Arapaho vs Chinese Householder Income Over 65 years

COMPARE

Arapaho
Race
Ancestry
AfghanAfricanAlaska NativeAlaskan AthabascanAlbanianAleutAlsatianAmericanApacheArabArapahoArgentineanArmenianAssyrian/Chaldean/SyriacAustralianAustrianBahamianBangladeshiBarbadianBasqueBelgianBelizeanBermudanBhutaneseBlackfeetBolivianBrazilianBritishBritish West IndianBulgarianBurmeseCajunCambodianCanadianCape VerdeanCarpatho RusynCelticCentral AmericanCentral American IndianCherokeeCheyenneChickasawChileanChippewaChoctawColombianColvilleComancheCosta RicanCreeCreekCroatianCrowCubanCypriotCzechCzechoslovakianDanishDelawareDominicanDutchDutch West IndianEastern EuropeanEcuadorianEgyptianEnglishEstonianEthiopianEuropeanFijianFilipinoFinnishFrenchFrench American IndianFrench CanadianGermanGerman RussianGhanaianGreekGuamanian/ChamorroGuatemalanGuyaneseHaitianHmongHonduranHopiHoumaHungarianIcelanderIndian (Asian)IndonesianInupiatIranianIraqiIrishIroquoisIsraeliItalianJamaicanJapaneseJordanianKenyanKiowaKoreanLaotianLatvianLebaneseLiberianLithuanianLumbeeLuxembourgerMacedonianMalaysianMalteseMarshalleseMenomineeMexicanMexican American IndianMongolianMoroccanNative HawaiianNavajoNepaleseNew ZealanderNicaraguanNigerianNorthern EuropeanNorwegianOkinawanOsageOttawaPaiutePakistaniPalestinianPanamanianParaguayanPennsylvania GermanPeruvianPimaPolishPortuguesePotawatomiPuebloPuerto RicanPuget Sound SalishRomanianRussianSalvadoranSamoanScandinavianScotch-IrishScottishSeminoleSenegaleseSerbianShoshoneSierra LeoneanSiouxSlavicSlovakSloveneSomaliSouth AfricanSouth AmericanSouth American IndianSoviet UnionSpaniardSpanishSpanish AmericanSpanish American IndianSri LankanSubsaharan AfricanSudaneseSwedishSwissSyrianTaiwaneseThaiTlingit-HaidaTohono O'OdhamTonganTrinidadian and TobagonianTsimshianTurkishU.S. Virgin IslanderUgandanUkrainianUruguayanUteVenezuelanVietnameseWelshWest IndianYakamaYaquiYugoslavianYumanYup'ikZimbabwean
Immigration
NonimmigrantsImmigrantsAfghanistanAfricaAlbaniaArgentinaArmeniaAsiaAustraliaAustriaBahamasBangladeshBarbadosBelarusBelgiumBelizeBoliviaBosnia and HerzegovinaBrazilBulgariaBurma/MyanmarCabo VerdeCambodiaCameroonCanadaCaribbeanCentral AmericaChileChinaColombiaCongoCosta RicaCroatiaCubaCzechoslovakiaDenmarkDominicaDominican RepublicEastern AfricaEastern AsiaEastern EuropeEcuadorEgyptEl SalvadorEnglandEritreaEthiopiaEuropeFijiFranceGermanyGhanaGreeceGrenadaGuatemalaGuyanaHaitiHondurasHong KongHungaryIndiaIndonesiaIranIraqIrelandIsraelItalyJamaicaJapanJordanKazakhstanKenyaKoreaKuwaitLaosLatin AmericaLatviaLebanonLiberiaLithuaniaMalaysiaMexicoMicronesiaMiddle AfricaMoldovaMoroccoNepalNetherlandsNicaraguaNigeriaNorth AmericaNorth MacedoniaNorthern AfricaNorthern EuropeNorwayOceaniaPakistanPanamaPeruPhilippinesPolandPortugalRomaniaRussiaSaudi ArabiaScotlandSenegalSerbiaSierra LeoneSingaporeSomaliaSouth AfricaSouth AmericaSouth Central AsiaSouth Eastern AsiaSouthern EuropeSpainSri LankaSt. Vincent and the GrenadinesSudanSwedenSwitzerlandSyriaTaiwanThailandTrinidad and TobagoTurkeyUgandaUkraineUruguayUzbekistanVenezuelaVietnamWest IndiesWestern AfricaWestern AsiaWestern EuropeYemenZaireZimbabweAzores
Chinese
Race
Ancestry
AfghanAfricanAlaska NativeAlaskan AthabascanAlbanianAleutAlsatianAmericanApacheArabArgentineanArmenianAssyrian/Chaldean/SyriacAustralianAustrianBahamianBangladeshiBarbadianBasqueBelgianBelizeanBermudanBhutaneseBlackfeetBolivianBrazilianBritishBritish West IndianBulgarianBurmeseCajunCambodianCanadianCape VerdeanCarpatho RusynCelticCentral AmericanCentral American IndianCherokeeCheyenneChickasawChileanChineseChippewaChoctawColombianColvilleComancheCosta RicanCreeCreekCroatianCrowCubanCypriotCzechCzechoslovakianDanishDelawareDominicanDutchDutch West IndianEastern EuropeanEcuadorianEgyptianEnglishEstonianEthiopianEuropeanFijianFilipinoFinnishFrenchFrench American IndianFrench CanadianGermanGerman RussianGhanaianGreekGuamanian/ChamorroGuatemalanGuyaneseHaitianHmongHonduranHopiHoumaHungarianIcelanderIndian (Asian)IndonesianInupiatIranianIraqiIrishIroquoisIsraeliItalianJamaicanJapaneseJordanianKenyanKiowaKoreanLaotianLatvianLebaneseLiberianLithuanianLumbeeLuxembourgerMacedonianMalaysianMalteseMarshalleseMenomineeMexicanMexican American IndianMongolianMoroccanNative HawaiianNavajoNepaleseNew ZealanderNicaraguanNigerianNorthern EuropeanNorwegianOkinawanOsageOttawaPaiutePakistaniPalestinianPanamanianParaguayanPennsylvania GermanPeruvianPimaPolishPortuguesePotawatomiPuebloPuerto RicanPuget Sound SalishRomanianRussianSalvadoranSamoanScandinavianScotch-IrishScottishSeminoleSenegaleseSerbianShoshoneSierra LeoneanSiouxSlavicSlovakSloveneSomaliSouth AfricanSouth AmericanSouth American IndianSoviet UnionSpaniardSpanishSpanish AmericanSpanish American IndianSri LankanSubsaharan AfricanSudaneseSwedishSwissSyrianTaiwaneseThaiTlingit-HaidaTohono O'OdhamTonganTrinidadian and TobagonianTsimshianTurkishU.S. Virgin IslanderUgandanUkrainianUruguayanUteVenezuelanVietnameseWelshWest IndianYakamaYaquiYugoslavianYumanYup'ikZimbabwean
Immigration
NonimmigrantsImmigrantsAfghanistanAfricaAlbaniaArgentinaArmeniaAsiaAustraliaAustriaBahamasBangladeshBarbadosBelarusBelgiumBelizeBoliviaBosnia and HerzegovinaBrazilBulgariaBurma/MyanmarCabo VerdeCambodiaCameroonCanadaCaribbeanCentral AmericaChileChinaColombiaCongoCosta RicaCroatiaCubaCzechoslovakiaDenmarkDominicaDominican RepublicEastern AfricaEastern AsiaEastern EuropeEcuadorEgyptEl SalvadorEnglandEritreaEthiopiaEuropeFijiFranceGermanyGhanaGreeceGrenadaGuatemalaGuyanaHaitiHondurasHong KongHungaryIndiaIndonesiaIranIraqIrelandIsraelItalyJamaicaJapanJordanKazakhstanKenyaKoreaKuwaitLaosLatin AmericaLatviaLebanonLiberiaLithuaniaMalaysiaMexicoMicronesiaMiddle AfricaMoldovaMoroccoNepalNetherlandsNicaraguaNigeriaNorth AmericaNorth MacedoniaNorthern AfricaNorthern EuropeNorwayOceaniaPakistanPanamaPeruPhilippinesPolandPortugalRomaniaRussiaSaudi ArabiaScotlandSenegalSerbiaSierra LeoneSingaporeSomaliaSouth AfricaSouth AmericaSouth Central AsiaSouth Eastern AsiaSouthern EuropeSpainSri LankaSt. Vincent and the GrenadinesSudanSwedenSwitzerlandSyriaTaiwanThailandTrinidad and TobagoTurkeyUgandaUkraineUruguayUzbekistanVenezuelaVietnamWest IndiesWestern AfricaWestern AsiaWestern EuropeYemenZaireZimbabweAzores
Householder Income Over 65 years
Income
Poverty
Unemployment
Labor Participation
Family Structure
Vehicle Availability
Education Level
Disability

Householder Income Over 65 years Comparison

Arapaho

Chinese

Poor
Exceptional
$59,383
HOUSEHOLDER INCOME OVER 65 YEARS
16.0/ 100
METRIC RATING
204th/ 347
METRIC RANK
$77,465
HOUSEHOLDER INCOME OVER 65 YEARS
100.0/ 100
METRIC RATING
1st/ 347
METRIC RANK

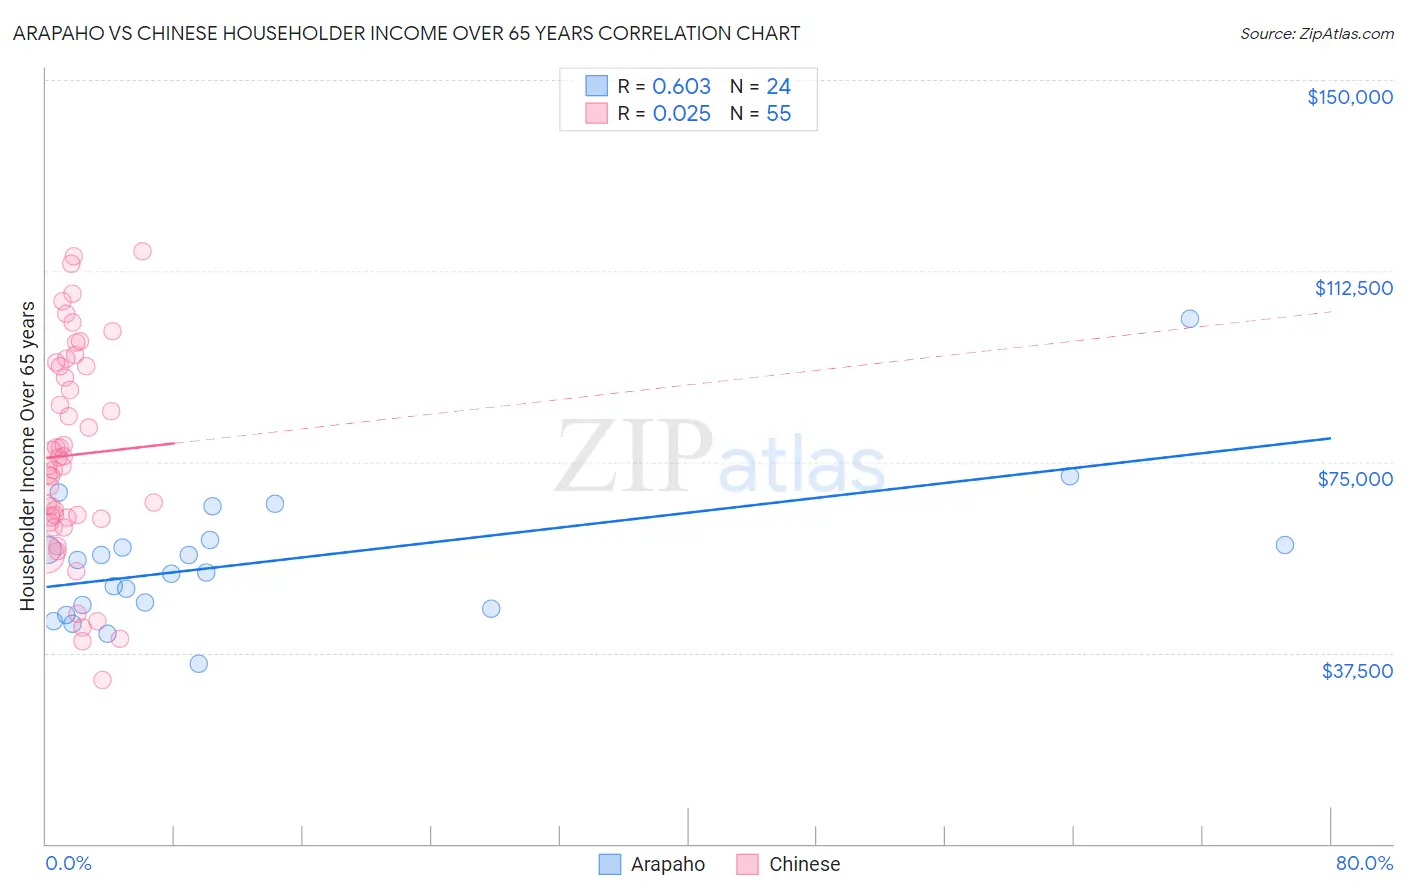
Arapaho vs Chinese Householder Income Over 65 years Correlation Chart

The statistical analysis conducted on geographies consisting of 29,739,180 people shows a significant positive correlation between the proportion of Arapaho and household income with householder over the age of 65 in the United States with a correlation coefficient (R) of 0.603 and weighted average of $59,383. Similarly, the statistical analysis conducted on geographies consisting of 64,728,631 people shows no correlation between the proportion of Chinese and household income with householder over the age of 65 in the United States with a correlation coefficient (R) of 0.025 and weighted average of $77,465, a difference of 30.4%.
Arapaho vs Chinese Householder Income Over 65 years

Householder Income Over 65 years Correlation Summary

MeasurementArapahoChinese
Minimum$35,366$32,143
Maximum$103,036$116,276
Range$67,670$84,133
Mean$55,690$76,332
Median$54,436$74,246
Interquartile 25% (IQ1)$46,442$63,846
Interquartile 75% (IQ3)$59,194$93,750
Interquartile Range (IQR)$12,751$29,904
Standard Deviation (Sample)$13,684$20,626
Standard Deviation (Population)$13,396$20,438

Similar Demographics by Householder Income Over 65 years

Demographics Similar to Arapaho by Householder Income Over 65 years

In terms of householder income over 65 years, the demographic groups most similar to Arapaho are Scotch-Irish ($59,447, a difference of 0.11%), Immigrants from Sudan ($59,248, a difference of 0.23%), Finnish ($59,535, a difference of 0.25%), Dutch ($59,539, a difference of 0.26%), and Immigrants from South America ($59,151, a difference of 0.39%).
DemographicsRating | RankHouseholder Income Over 65 years
Immigrants | Kenya
21.1
/100
|
#197
Fair
$59,710
Moroccans
20.7
/100
|
#198
Fair
$59,683
Immigrants | Immigrants
20.2
/100
|
#199
Fair
$59,656
French
20.2
/100
|
#200
Fair
$59,656
Dutch
18.3
/100
|
#201
Poor
$59,539
Finns
18.2
/100
|
#202
Poor
$59,535
Scotch-Irish
16.9
/100
|
#203
Poor
$59,447
Arapaho
16.0
/100
|
#204
Poor
$59,383
Immigrants | Sudan
14.2
/100
|
#205
Poor
$59,248
Immigrants | South America
13.0
/100
|
#206
Poor
$59,151
Salvadorans
12.9
/100
|
#207
Poor
$59,141
Uruguayans
12.3
/100
|
#208
Poor
$59,090
Slovaks
11.7
/100
|
#209
Poor
$59,039
Nigerians
11.2
/100
|
#210
Poor
$58,992
Immigrants | Nigeria
10.7
/100
|
#211
Poor
$58,942

Demographics Similar to Chinese by Householder Income Over 65 years

In terms of householder income over 65 years, the demographic groups most similar to Chinese are Iranian ($77,429, a difference of 0.050%), Immigrants from Taiwan ($77,051, a difference of 0.54%), Filipino ($76,686, a difference of 1.0%), Immigrants from Iran ($75,081, a difference of 3.2%), and Bolivian ($74,245, a difference of 4.3%).
DemographicsRating | RankHouseholder Income Over 65 years
Chinese
100.0
/100
|
#1
Exceptional
$77,465
Iranians
100.0
/100
|
#2
Exceptional
$77,429
Immigrants | Taiwan
100.0
/100
|
#3
Exceptional
$77,051
Filipinos
100.0
/100
|
#4
Exceptional
$76,686
Immigrants | Iran
100.0
/100
|
#5
Exceptional
$75,081
Bolivians
100.0
/100
|
#6
Exceptional
$74,245
Immigrants | Bolivia
100.0
/100
|
#7
Exceptional
$73,434
Immigrants | Singapore
100.0
/100
|
#8
Exceptional
$72,963
Immigrants | India
100.0
/100
|
#9
Exceptional
$72,804
Bhutanese
100.0
/100
|
#10
Exceptional
$72,288
Thais
100.0
/100
|
#11
Exceptional
$72,099
Cypriots
100.0
/100
|
#12
Exceptional
$71,714
Immigrants | Hong Kong
100.0
/100
|
#13
Exceptional
$71,567
Burmese
100.0
/100
|
#14
Exceptional
$71,139
Native Hawaiians
100.0
/100
|
#15
Exceptional
$71,021