Arapaho vs Central American Median Female Earnings
COMPARE
Arapaho
Central American
Median Female Earnings
Median Female Earnings Comparison
Arapaho
Central Americans
$31,489
MEDIAN FEMALE EARNINGS
0.0/ 100
METRIC RATING
346th/ 347
METRIC RANK
$36,492
MEDIAN FEMALE EARNINGS
0.1/ 100
METRIC RATING
276th/ 347
METRIC RANK
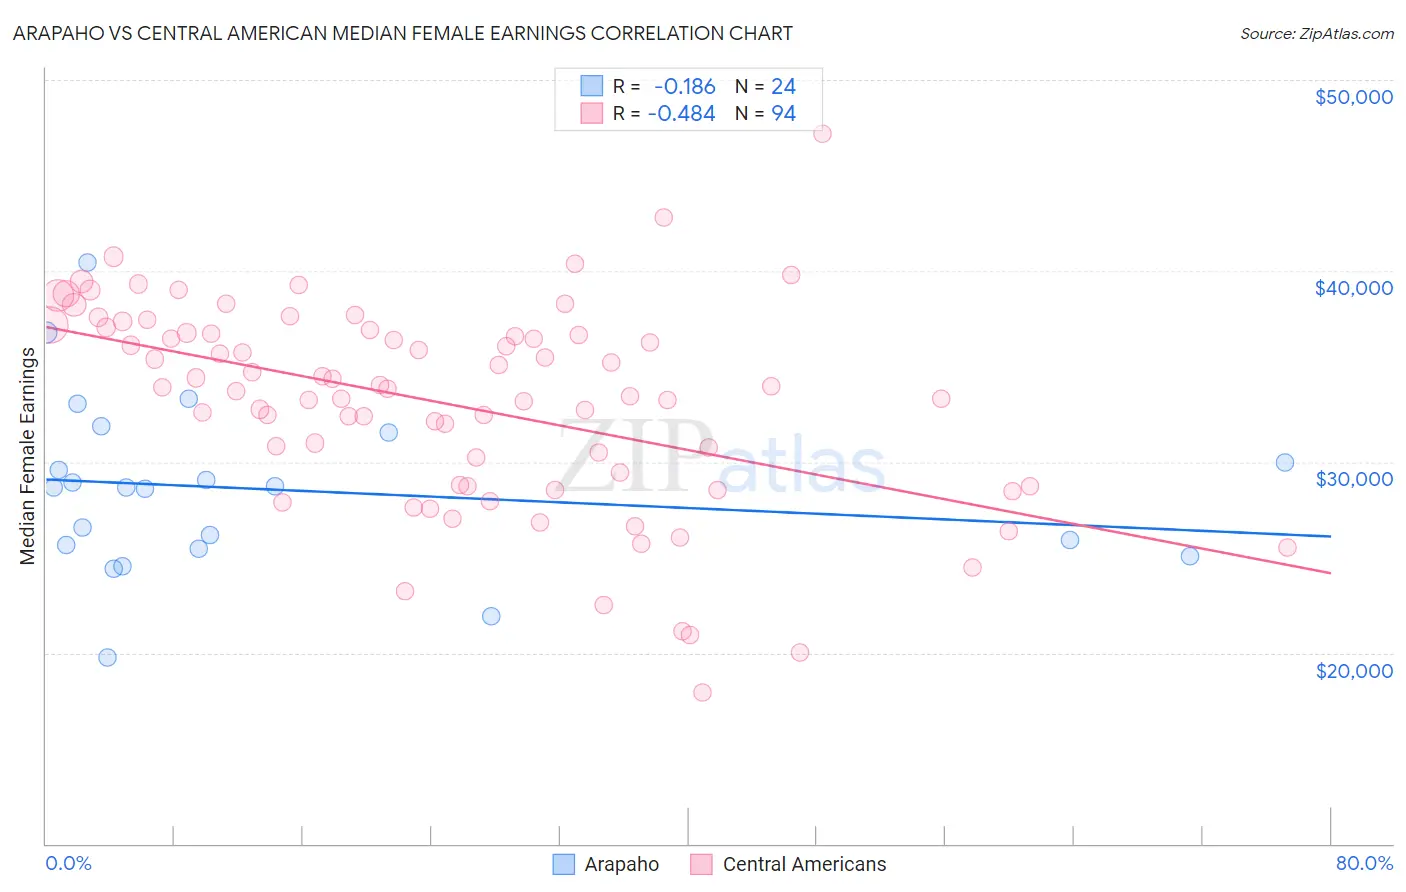
Arapaho vs Central American Median Female Earnings Correlation Chart
The statistical analysis conducted on geographies consisting of 29,776,290 people shows a poor negative correlation between the proportion of Arapaho and median female earnings in the United States with a correlation coefficient (R) of -0.186 and weighted average of $31,489. Similarly, the statistical analysis conducted on geographies consisting of 504,159,806 people shows a moderate negative correlation between the proportion of Central Americans and median female earnings in the United States with a correlation coefficient (R) of -0.484 and weighted average of $36,492, a difference of 15.9%.
Median Female Earnings Correlation Summary
| Measurement | Arapaho | Central American |
| Minimum | $19,750 | $17,895 |
| Maximum | $40,452 | $47,188 |
| Range | $20,702 | $29,293 |
| Mean | $28,528 | $33,080 |
| Median | $28,660 | $33,869 |
| Interquartile 25% (IQ1) | $25,558 | $28,801 |
| Interquartile 75% (IQ3) | $30,782 | $36,751 |
| Interquartile Range (IQR) | $5,224 | $7,950 |
| Standard Deviation (Sample) | $4,555 | $5,364 |
| Standard Deviation (Population) | $4,459 | $5,336 |
Similar Demographics by Median Female Earnings
Demographics Similar to Arapaho by Median Female Earnings
In terms of median female earnings, the demographic groups most similar to Arapaho are Puerto Rican ($31,560, a difference of 0.23%), Lumbee ($32,500, a difference of 3.2%), Pueblo ($32,564, a difference of 3.4%), Houma ($30,343, a difference of 3.8%), and Yup'ik ($32,730, a difference of 3.9%).
| Demographics | Rating | Rank | Median Female Earnings |
| Mexicans | 0.0 /100 | #333 | Tragic $33,664 |
| Spanish American Indians | 0.0 /100 | #334 | Tragic $33,625 |
| Creek | 0.0 /100 | #335 | Tragic $33,437 |
| Ottawa | 0.0 /100 | #336 | Tragic $33,378 |
| Yakama | 0.0 /100 | #337 | Tragic $33,354 |
| Immigrants | Cuba | 0.0 /100 | #338 | Tragic $33,291 |
| Immigrants | Mexico | 0.0 /100 | #339 | Tragic $33,236 |
| Tohono O'odham | 0.0 /100 | #340 | Tragic $33,205 |
| Navajo | 0.0 /100 | #341 | Tragic $33,046 |
| Yup'ik | 0.0 /100 | #342 | Tragic $32,730 |
| Pueblo | 0.0 /100 | #343 | Tragic $32,564 |
| Lumbee | 0.0 /100 | #344 | Tragic $32,500 |
| Puerto Ricans | 0.0 /100 | #345 | Tragic $31,560 |
| Arapaho | 0.0 /100 | #346 | Tragic $31,489 |
| Houma | 0.0 /100 | #347 | Tragic $30,343 |
Demographics Similar to Central Americans by Median Female Earnings
In terms of median female earnings, the demographic groups most similar to Central Americans are Marshallese ($36,459, a difference of 0.090%), African ($36,530, a difference of 0.10%), U.S. Virgin Islander ($36,424, a difference of 0.19%), Immigrants from Caribbean ($36,414, a difference of 0.22%), and Iroquois ($36,408, a difference of 0.23%).
| Demographics | Rating | Rank | Median Female Earnings |
| Immigrants | Venezuela | 0.4 /100 | #269 | Tragic $37,003 |
| French American Indians | 0.3 /100 | #270 | Tragic $36,920 |
| Nicaraguans | 0.3 /100 | #271 | Tragic $36,904 |
| Immigrants | Dominican Republic | 0.3 /100 | #272 | Tragic $36,857 |
| Immigrants | Laos | 0.3 /100 | #273 | Tragic $36,841 |
| Immigrants | El Salvador | 0.2 /100 | #274 | Tragic $36,673 |
| Africans | 0.1 /100 | #275 | Tragic $36,530 |
| Central Americans | 0.1 /100 | #276 | Tragic $36,492 |
| Marshallese | 0.1 /100 | #277 | Tragic $36,459 |
| U.S. Virgin Islanders | 0.1 /100 | #278 | Tragic $36,424 |
| Immigrants | Caribbean | 0.1 /100 | #279 | Tragic $36,414 |
| Iroquois | 0.1 /100 | #280 | Tragic $36,408 |
| Spanish Americans | 0.1 /100 | #281 | Tragic $36,391 |
| Haitians | 0.1 /100 | #282 | Tragic $36,374 |
| Immigrants | Haiti | 0.1 /100 | #283 | Tragic $36,203 |