Arapaho vs Bahamian Median Earnings
COMPARE
Arapaho
Bahamian
Median Earnings
Median Earnings Comparison
Arapaho
Bahamians
$36,586
MEDIAN EARNINGS
0.0/ 100
METRIC RATING
344th/ 347
METRIC RANK
$39,735
MEDIAN EARNINGS
0.0/ 100
METRIC RATING
323rd/ 347
METRIC RANK
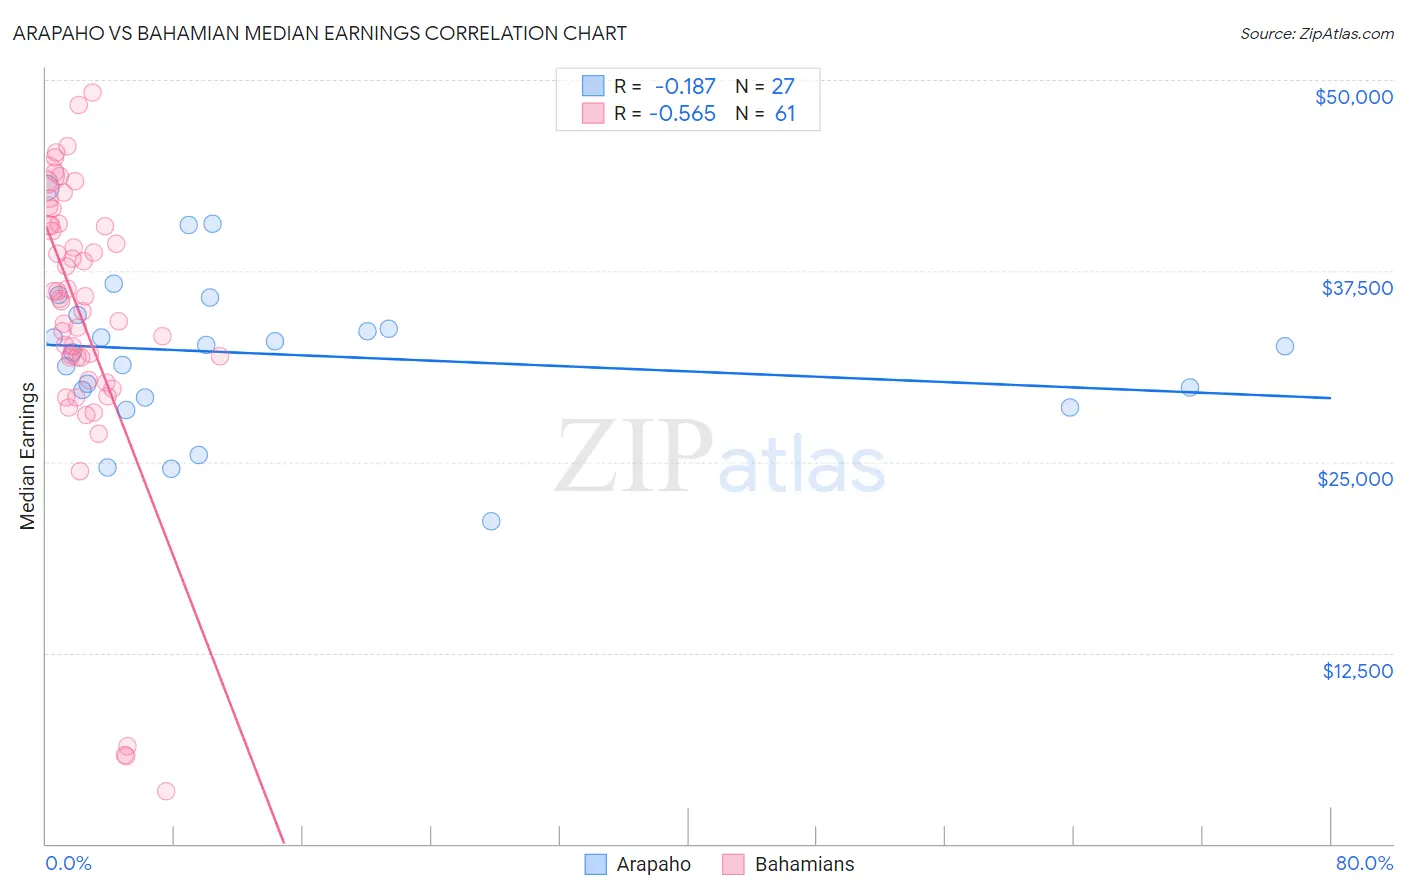
Arapaho vs Bahamian Median Earnings Correlation Chart
The statistical analysis conducted on geographies consisting of 29,778,965 people shows a poor negative correlation between the proportion of Arapaho and median earnings in the United States with a correlation coefficient (R) of -0.187 and weighted average of $36,586. Similarly, the statistical analysis conducted on geographies consisting of 112,703,764 people shows a substantial negative correlation between the proportion of Bahamians and median earnings in the United States with a correlation coefficient (R) of -0.565 and weighted average of $39,735, a difference of 8.6%.
Median Earnings Correlation Summary
| Measurement | Arapaho | Bahamian |
| Minimum | $21,094 | $3,467 |
| Maximum | $42,957 | $49,150 |
| Range | $21,863 | $45,683 |
| Mean | $32,041 | $34,478 |
| Median | $32,563 | $35,694 |
| Interquartile 25% (IQ1) | $29,178 | $31,085 |
| Interquartile 75% (IQ3) | $34,586 | $40,552 |
| Interquartile Range (IQR) | $5,408 | $9,467 |
| Standard Deviation (Sample) | $5,015 | $9,647 |
| Standard Deviation (Population) | $4,921 | $9,567 |
Similar Demographics by Median Earnings
Demographics Similar to Arapaho by Median Earnings
In terms of median earnings, the demographic groups most similar to Arapaho are Tohono O'odham ($36,349, a difference of 0.65%), Pueblo ($36,859, a difference of 0.75%), Hopi ($36,871, a difference of 0.78%), Lumbee ($36,876, a difference of 0.79%), and Navajo ($36,999, a difference of 1.1%).
| Demographics | Rating | Rank | Median Earnings |
| Houma | 0.0 /100 | #333 | Tragic $38,949 |
| Spanish American Indians | 0.0 /100 | #334 | Tragic $38,907 |
| Natives/Alaskans | 0.0 /100 | #335 | Tragic $38,896 |
| Crow | 0.0 /100 | #336 | Tragic $38,707 |
| Immigrants | Cuba | 0.0 /100 | #337 | Tragic $38,426 |
| Pima | 0.0 /100 | #338 | Tragic $38,285 |
| Menominee | 0.0 /100 | #339 | Tragic $37,884 |
| Navajo | 0.0 /100 | #340 | Tragic $36,999 |
| Lumbee | 0.0 /100 | #341 | Tragic $36,876 |
| Hopi | 0.0 /100 | #342 | Tragic $36,871 |
| Pueblo | 0.0 /100 | #343 | Tragic $36,859 |
| Arapaho | 0.0 /100 | #344 | Tragic $36,586 |
| Tohono O'odham | 0.0 /100 | #345 | Tragic $36,349 |
| Yup'ik | 0.0 /100 | #346 | Tragic $35,942 |
| Puerto Ricans | 0.0 /100 | #347 | Tragic $35,560 |
Demographics Similar to Bahamians by Median Earnings
In terms of median earnings, the demographic groups most similar to Bahamians are Ottawa ($39,721, a difference of 0.040%), Immigrants from Central America ($39,762, a difference of 0.070%), Creek ($39,648, a difference of 0.22%), Mexican ($39,834, a difference of 0.25%), and Immigrants from Bahamas ($39,861, a difference of 0.32%).
| Demographics | Rating | Rank | Median Earnings |
| Immigrants | Honduras | 0.0 /100 | #316 | Tragic $40,195 |
| Fijians | 0.0 /100 | #317 | Tragic $40,193 |
| Dutch West Indians | 0.0 /100 | #318 | Tragic $40,107 |
| Blacks/African Americans | 0.0 /100 | #319 | Tragic $40,085 |
| Immigrants | Bahamas | 0.0 /100 | #320 | Tragic $39,861 |
| Mexicans | 0.0 /100 | #321 | Tragic $39,834 |
| Immigrants | Central America | 0.0 /100 | #322 | Tragic $39,762 |
| Bahamians | 0.0 /100 | #323 | Tragic $39,735 |
| Ottawa | 0.0 /100 | #324 | Tragic $39,721 |
| Creek | 0.0 /100 | #325 | Tragic $39,648 |
| Immigrants | Yemen | 0.0 /100 | #326 | Tragic $39,540 |
| Yuman | 0.0 /100 | #327 | Tragic $39,523 |
| Sioux | 0.0 /100 | #328 | Tragic $39,448 |
| Kiowa | 0.0 /100 | #329 | Tragic $39,232 |
| Immigrants | Congo | 0.0 /100 | #330 | Tragic $39,169 |