Arab vs Osage Median Female Earnings
COMPARE
Arab
Osage
Median Female Earnings
Median Female Earnings Comparison
Arabs
Osage
$40,718
MEDIAN FEMALE EARNINGS
89.3/ 100
METRIC RATING
134th/ 347
METRIC RANK
$36,034
MEDIAN FEMALE EARNINGS
0.0/ 100
METRIC RATING
286th/ 347
METRIC RANK
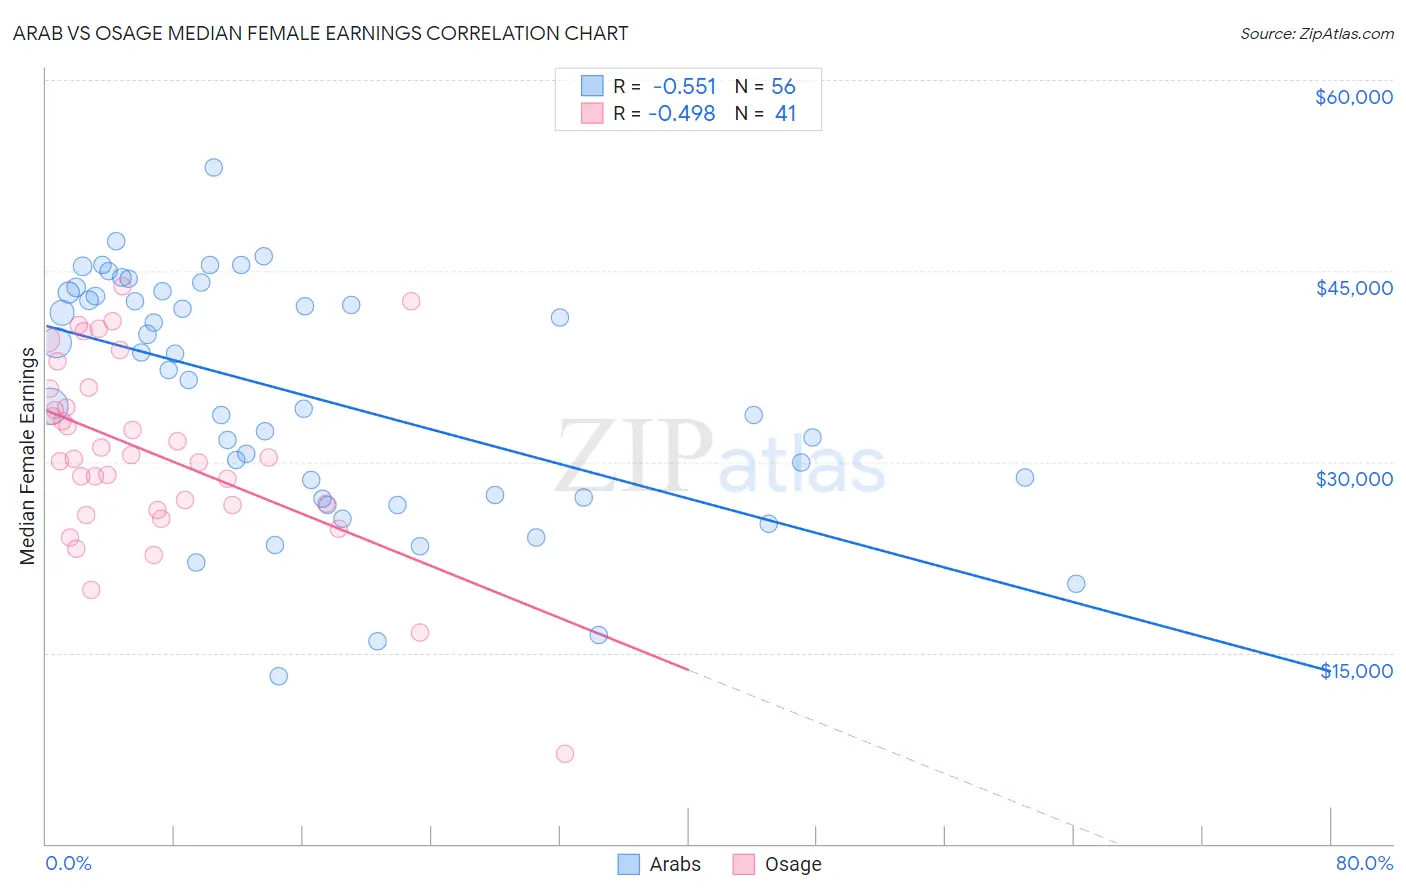
Arab vs Osage Median Female Earnings Correlation Chart
The statistical analysis conducted on geographies consisting of 486,538,152 people shows a substantial negative correlation between the proportion of Arabs and median female earnings in the United States with a correlation coefficient (R) of -0.551 and weighted average of $40,718. Similarly, the statistical analysis conducted on geographies consisting of 91,783,866 people shows a moderate negative correlation between the proportion of Osage and median female earnings in the United States with a correlation coefficient (R) of -0.498 and weighted average of $36,034, a difference of 13.0%.
Median Female Earnings Correlation Summary
| Measurement | Arab | Osage |
| Minimum | $13,173 | $7,083 |
| Maximum | $53,122 | $43,750 |
| Range | $39,949 | $36,667 |
| Mean | $35,183 | $30,795 |
| Median | $36,815 | $30,332 |
| Interquartile 25% (IQ1) | $27,287 | $26,425 |
| Interquartile 75% (IQ3) | $43,150 | $35,787 |
| Interquartile Range (IQR) | $15,863 | $9,362 |
| Standard Deviation (Sample) | $9,334 | $7,435 |
| Standard Deviation (Population) | $9,250 | $7,343 |
Similar Demographics by Median Female Earnings
Demographics Similar to Arabs by Median Female Earnings
In terms of median female earnings, the demographic groups most similar to Arabs are Syrian ($40,727, a difference of 0.020%), Immigrants from Nepal ($40,704, a difference of 0.030%), Immigrants from Uganda ($40,739, a difference of 0.050%), Chilean ($40,757, a difference of 0.10%), and Immigrants from Guyana ($40,773, a difference of 0.14%).
| Demographics | Rating | Rank | Median Female Earnings |
| Ugandans | 92.2 /100 | #127 | Exceptional $40,889 |
| Carpatho Rusyns | 91.2 /100 | #128 | Exceptional $40,825 |
| Zimbabweans | 90.8 /100 | #129 | Exceptional $40,798 |
| Immigrants | Guyana | 90.3 /100 | #130 | Exceptional $40,773 |
| Chileans | 90.0 /100 | #131 | Exceptional $40,757 |
| Immigrants | Uganda | 89.7 /100 | #132 | Excellent $40,739 |
| Syrians | 89.5 /100 | #133 | Excellent $40,727 |
| Arabs | 89.3 /100 | #134 | Excellent $40,718 |
| Immigrants | Nepal | 89.0 /100 | #135 | Excellent $40,704 |
| Immigrants | Eastern Africa | 87.7 /100 | #136 | Excellent $40,644 |
| Pakistanis | 86.6 /100 | #137 | Excellent $40,596 |
| Taiwanese | 86.1 /100 | #138 | Excellent $40,576 |
| Immigrants | South Eastern Asia | 85.7 /100 | #139 | Excellent $40,558 |
| Serbians | 85.2 /100 | #140 | Excellent $40,539 |
| Immigrants | Syria | 84.1 /100 | #141 | Excellent $40,499 |
Demographics Similar to Osage by Median Female Earnings
In terms of median female earnings, the demographic groups most similar to Osage are Immigrants from Nicaragua ($36,023, a difference of 0.030%), Immigrants from Zaire ($36,017, a difference of 0.050%), Paiute ($36,056, a difference of 0.060%), Bangladeshi ($35,960, a difference of 0.21%), and Indonesian ($36,140, a difference of 0.29%).
| Demographics | Rating | Rank | Median Female Earnings |
| Immigrants | Caribbean | 0.1 /100 | #279 | Tragic $36,414 |
| Iroquois | 0.1 /100 | #280 | Tragic $36,408 |
| Spanish Americans | 0.1 /100 | #281 | Tragic $36,391 |
| Haitians | 0.1 /100 | #282 | Tragic $36,374 |
| Immigrants | Haiti | 0.1 /100 | #283 | Tragic $36,203 |
| Indonesians | 0.1 /100 | #284 | Tragic $36,140 |
| Paiute | 0.1 /100 | #285 | Tragic $36,056 |
| Osage | 0.0 /100 | #286 | Tragic $36,034 |
| Immigrants | Nicaragua | 0.0 /100 | #287 | Tragic $36,023 |
| Immigrants | Zaire | 0.0 /100 | #288 | Tragic $36,017 |
| Bangladeshis | 0.0 /100 | #289 | Tragic $35,960 |
| Central American Indians | 0.0 /100 | #290 | Tragic $35,930 |
| Blackfeet | 0.0 /100 | #291 | Tragic $35,864 |
| Americans | 0.0 /100 | #292 | Tragic $35,777 |
| Guatemalans | 0.0 /100 | #293 | Tragic $35,695 |