Arab vs Brazilian Householder Income Ages 45 - 64 years
COMPARE
Arab
Brazilian
Householder Income Ages 45 - 64 years
Householder Income Ages 45 - 64 years Comparison
Arabs
Brazilians
$104,566
HOUSEHOLDER INCOME AGES 45 - 64 YEARS
89.3/ 100
METRIC RATING
133rd/ 347
METRIC RANK
$104,408
HOUSEHOLDER INCOME AGES 45 - 64 YEARS
88.6/ 100
METRIC RATING
135th/ 347
METRIC RANK
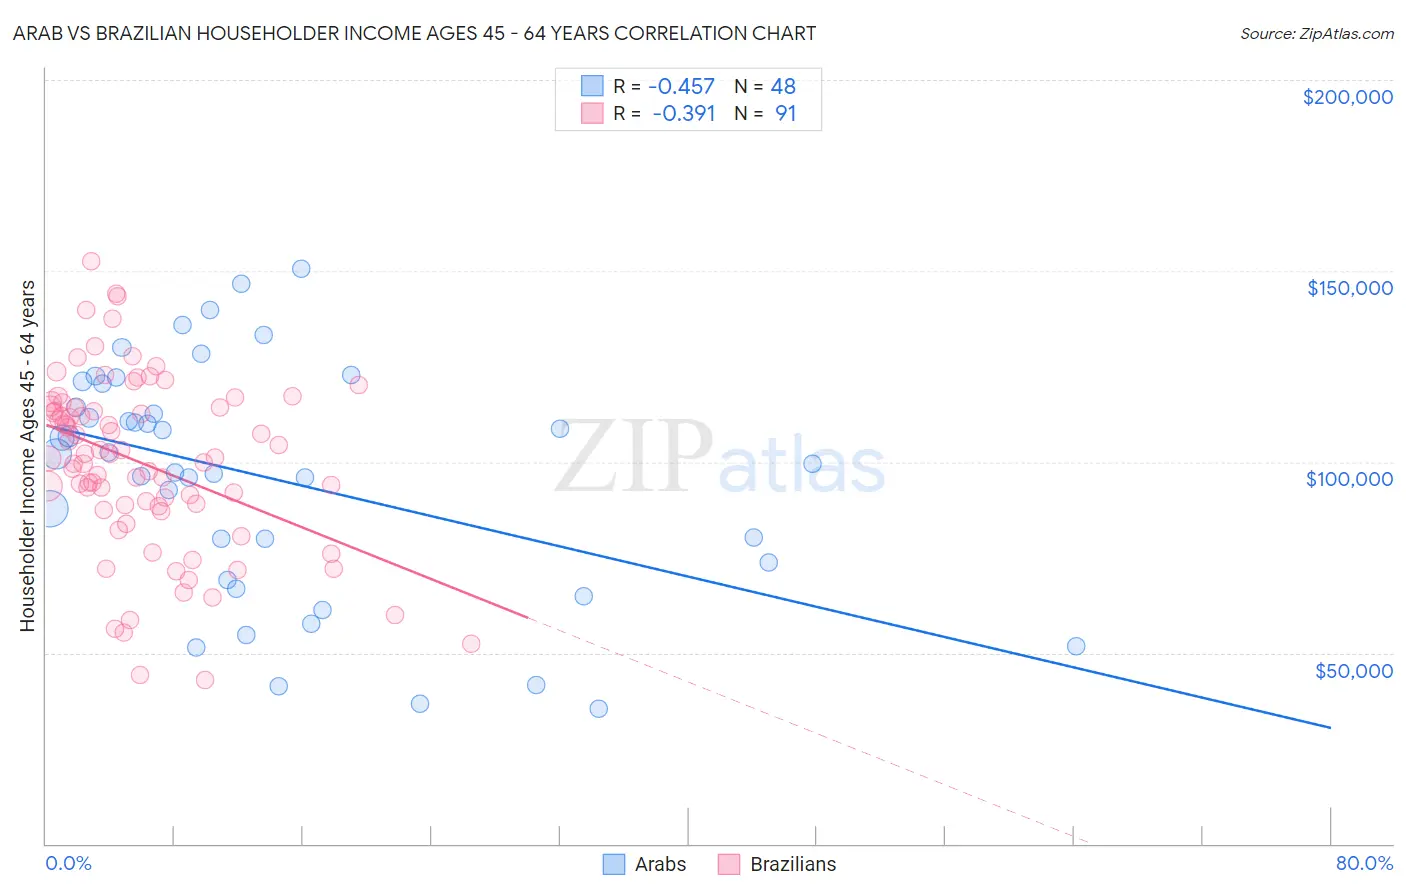
Arab vs Brazilian Householder Income Ages 45 - 64 years Correlation Chart
The statistical analysis conducted on geographies consisting of 485,614,967 people shows a moderate negative correlation between the proportion of Arabs and household income with householder between the ages 45 and 64 in the United States with a correlation coefficient (R) of -0.457 and weighted average of $104,566. Similarly, the statistical analysis conducted on geographies consisting of 323,438,021 people shows a mild negative correlation between the proportion of Brazilians and household income with householder between the ages 45 and 64 in the United States with a correlation coefficient (R) of -0.391 and weighted average of $104,408, a difference of 0.15%.
Householder Income Ages 45 - 64 years Correlation Summary
| Measurement | Arab | Brazilian |
| Minimum | $35,250 | $42,860 |
| Maximum | $150,539 | $152,670 |
| Range | $115,289 | $109,810 |
| Mean | $95,530 | $99,594 |
| Median | $100,868 | $101,250 |
| Interquartile 25% (IQ1) | $71,485 | $88,262 |
| Interquartile 75% (IQ3) | $117,419 | $114,328 |
| Interquartile Range (IQR) | $45,934 | $26,066 |
| Standard Deviation (Sample) | $30,403 | $22,722 |
| Standard Deviation (Population) | $30,085 | $22,597 |
Demographics Similar to Arabs and Brazilians by Householder Income Ages 45 - 64 years
In terms of householder income ages 45 - 64 years, the demographic groups most similar to Arabs are Canadian ($104,560, a difference of 0.010%), Lebanese ($104,734, a difference of 0.16%), Immigrants from Syria ($104,858, a difference of 0.28%), Taiwanese ($104,180, a difference of 0.37%), and Immigrants from Zimbabwe ($104,992, a difference of 0.41%). Similarly, the demographic groups most similar to Brazilians are Canadian ($104,560, a difference of 0.15%), Taiwanese ($104,180, a difference of 0.22%), Lebanese ($104,734, a difference of 0.31%), Immigrants from Syria ($104,858, a difference of 0.43%), and Hungarian ($103,913, a difference of 0.48%).
| Demographics | Rating | Rank | Householder Income Ages 45 - 64 years |
| Immigrants | Northern Africa | 92.8 /100 | #124 | Exceptional $105,430 |
| Pakistanis | 92.4 /100 | #125 | Exceptional $105,317 |
| Portuguese | 92.4 /100 | #126 | Exceptional $105,309 |
| Immigrants | Saudi Arabia | 92.2 /100 | #127 | Exceptional $105,249 |
| Native Hawaiians | 91.8 /100 | #128 | Exceptional $105,149 |
| Peruvians | 91.5 /100 | #129 | Exceptional $105,070 |
| Immigrants | Zimbabwe | 91.2 /100 | #130 | Exceptional $104,992 |
| Immigrants | Syria | 90.7 /100 | #131 | Exceptional $104,858 |
| Lebanese | 90.1 /100 | #132 | Exceptional $104,734 |
| Arabs | 89.3 /100 | #133 | Excellent $104,566 |
| Canadians | 89.3 /100 | #134 | Excellent $104,560 |
| Brazilians | 88.6 /100 | #135 | Excellent $104,408 |
| Taiwanese | 87.4 /100 | #136 | Excellent $104,180 |
| Hungarians | 85.8 /100 | #137 | Excellent $103,913 |
| Ethiopians | 84.7 /100 | #138 | Excellent $103,736 |
| Immigrants | Oceania | 84.5 /100 | #139 | Excellent $103,705 |
| Norwegians | 84.3 /100 | #140 | Excellent $103,682 |
| Immigrants | Uganda | 83.7 /100 | #141 | Excellent $103,584 |
| Luxembourgers | 83.3 /100 | #142 | Excellent $103,536 |
| Serbians | 83.2 /100 | #143 | Excellent $103,522 |
| Czechs | 83.1 /100 | #144 | Excellent $103,507 |