Apache vs Palestinian Householder Income Ages 45 - 64 years

COMPARE

Apache
Race
Ancestry
AfghanAfricanAlaska NativeAlaskan AthabascanAlbanianAleutAlsatianAmericanApacheArabArapahoArgentineanArmenianAssyrian/Chaldean/SyriacAustralianAustrianBahamianBangladeshiBarbadianBasqueBelgianBelizeanBermudanBhutaneseBlackfeetBolivianBrazilianBritishBritish West IndianBulgarianBurmeseCajunCambodianCanadianCape VerdeanCarpatho RusynCelticCentral AmericanCentral American IndianCherokeeCheyenneChickasawChileanChineseChippewaChoctawColombianColvilleComancheCosta RicanCreeCreekCroatianCrowCubanCypriotCzechCzechoslovakianDanishDelawareDominicanDutchDutch West IndianEastern EuropeanEcuadorianEgyptianEnglishEstonianEthiopianEuropeanFijianFilipinoFinnishFrenchFrench American IndianFrench CanadianGermanGerman RussianGhanaianGreekGuamanian/ChamorroGuatemalanGuyaneseHaitianHmongHonduranHopiHoumaHungarianIcelanderIndian (Asian)IndonesianInupiatIranianIraqiIrishIroquoisIsraeliItalianJamaicanJapaneseJordanianKenyanKiowaKoreanLaotianLatvianLebaneseLiberianLithuanianLumbeeLuxembourgerMacedonianMalaysianMalteseMarshalleseMenomineeMexicanMexican American IndianMongolianMoroccanNative HawaiianNavajoNepaleseNew ZealanderNicaraguanNigerianNorthern EuropeanNorwegianOkinawanOsageOttawaPaiutePakistaniPanamanianParaguayanPennsylvania GermanPeruvianPimaPolishPortuguesePotawatomiPuebloPuerto RicanPuget Sound SalishRomanianRussianSalvadoranSamoanScandinavianScotch-IrishScottishSeminoleSenegaleseSerbianShoshoneSierra LeoneanSiouxSlavicSlovakSloveneSomaliSouth AfricanSouth AmericanSouth American IndianSoviet UnionSpaniardSpanishSpanish AmericanSpanish American IndianSri LankanSubsaharan AfricanSudaneseSwedishSwissSyrianTaiwaneseThaiTlingit-HaidaTohono O'OdhamTonganTrinidadian and TobagonianTsimshianTurkishU.S. Virgin IslanderUgandanUkrainianUruguayanUteVenezuelanVietnameseWelshWest IndianYakamaYaquiYugoslavianYumanYup'ikZimbabwean
Immigration
NonimmigrantsImmigrantsAfghanistanAfricaAlbaniaArgentinaArmeniaAsiaAustraliaAustriaBahamasBangladeshBarbadosBelarusBelgiumBelizeBoliviaBosnia and HerzegovinaBrazilBulgariaBurma/MyanmarCabo VerdeCambodiaCameroonCanadaCaribbeanCentral AmericaChileChinaColombiaCongoCosta RicaCroatiaCubaCzechoslovakiaDenmarkDominicaDominican RepublicEastern AfricaEastern AsiaEastern EuropeEcuadorEgyptEl SalvadorEnglandEritreaEthiopiaEuropeFijiFranceGermanyGhanaGreeceGrenadaGuatemalaGuyanaHaitiHondurasHong KongHungaryIndiaIndonesiaIranIraqIrelandIsraelItalyJamaicaJapanJordanKazakhstanKenyaKoreaKuwaitLaosLatin AmericaLatviaLebanonLiberiaLithuaniaMalaysiaMexicoMicronesiaMiddle AfricaMoldovaMoroccoNepalNetherlandsNicaraguaNigeriaNorth AmericaNorth MacedoniaNorthern AfricaNorthern EuropeNorwayOceaniaPakistanPanamaPeruPhilippinesPolandPortugalRomaniaRussiaSaudi ArabiaScotlandSenegalSerbiaSierra LeoneSingaporeSomaliaSouth AfricaSouth AmericaSouth Central AsiaSouth Eastern AsiaSouthern EuropeSpainSri LankaSt. Vincent and the GrenadinesSudanSwedenSwitzerlandSyriaTaiwanThailandTrinidad and TobagoTurkeyUgandaUkraineUruguayUzbekistanVenezuelaVietnamWest IndiesWestern AfricaWestern AsiaWestern EuropeYemenZaireZimbabweAzores
Palestinian
Race
Ancestry
AfghanAfricanAlaska NativeAlaskan AthabascanAlbanianAleutAlsatianAmericanArabArapahoArgentineanArmenianAssyrian/Chaldean/SyriacAustralianAustrianBahamianBangladeshiBarbadianBasqueBelgianBelizeanBermudanBhutaneseBlackfeetBolivianBrazilianBritishBritish West IndianBulgarianBurmeseCajunCambodianCanadianCape VerdeanCarpatho RusynCelticCentral AmericanCentral American IndianCherokeeCheyenneChickasawChileanChineseChippewaChoctawColombianColvilleComancheCosta RicanCreeCreekCroatianCrowCubanCypriotCzechCzechoslovakianDanishDelawareDominicanDutchDutch West IndianEastern EuropeanEcuadorianEgyptianEnglishEstonianEthiopianEuropeanFijianFilipinoFinnishFrenchFrench American IndianFrench CanadianGermanGerman RussianGhanaianGreekGuamanian/ChamorroGuatemalanGuyaneseHaitianHmongHonduranHopiHoumaHungarianIcelanderIndian (Asian)IndonesianInupiatIranianIraqiIrishIroquoisIsraeliItalianJamaicanJapaneseJordanianKenyanKiowaKoreanLaotianLatvianLebaneseLiberianLithuanianLumbeeLuxembourgerMacedonianMalaysianMalteseMarshalleseMenomineeMexicanMexican American IndianMongolianMoroccanNative HawaiianNavajoNepaleseNew ZealanderNicaraguanNigerianNorthern EuropeanNorwegianOkinawanOsageOttawaPaiutePakistaniPalestinianPanamanianParaguayanPennsylvania GermanPeruvianPimaPolishPortuguesePotawatomiPuebloPuerto RicanPuget Sound SalishRomanianRussianSalvadoranSamoanScandinavianScotch-IrishScottishSeminoleSenegaleseSerbianShoshoneSierra LeoneanSiouxSlavicSlovakSloveneSomaliSouth AfricanSouth AmericanSouth American IndianSoviet UnionSpaniardSpanishSpanish AmericanSpanish American IndianSri LankanSubsaharan AfricanSudaneseSwedishSwissSyrianTaiwaneseThaiTlingit-HaidaTohono O'OdhamTonganTrinidadian and TobagonianTsimshianTurkishU.S. Virgin IslanderUgandanUkrainianUruguayanUteVenezuelanVietnameseWelshWest IndianYakamaYaquiYugoslavianYumanYup'ikZimbabwean
Immigration
NonimmigrantsImmigrantsAfghanistanAfricaAlbaniaArgentinaArmeniaAsiaAustraliaAustriaBahamasBangladeshBarbadosBelarusBelgiumBelizeBoliviaBosnia and HerzegovinaBrazilBulgariaBurma/MyanmarCabo VerdeCambodiaCameroonCanadaCaribbeanCentral AmericaChileChinaColombiaCongoCosta RicaCroatiaCubaCzechoslovakiaDenmarkDominicaDominican RepublicEastern AfricaEastern AsiaEastern EuropeEcuadorEgyptEl SalvadorEnglandEritreaEthiopiaEuropeFijiFranceGermanyGhanaGreeceGrenadaGuatemalaGuyanaHaitiHondurasHong KongHungaryIndiaIndonesiaIranIraqIrelandIsraelItalyJamaicaJapanJordanKazakhstanKenyaKoreaKuwaitLaosLatin AmericaLatviaLebanonLiberiaLithuaniaMalaysiaMexicoMicronesiaMiddle AfricaMoldovaMoroccoNepalNetherlandsNicaraguaNigeriaNorth AmericaNorth MacedoniaNorthern AfricaNorthern EuropeNorwayOceaniaPakistanPanamaPeruPhilippinesPolandPortugalRomaniaRussiaSaudi ArabiaScotlandSenegalSerbiaSierra LeoneSingaporeSomaliaSouth AfricaSouth AmericaSouth Central AsiaSouth Eastern AsiaSouthern EuropeSpainSri LankaSt. Vincent and the GrenadinesSudanSwedenSwitzerlandSyriaTaiwanThailandTrinidad and TobagoTurkeyUgandaUkraineUruguayUzbekistanVenezuelaVietnamWest IndiesWestern AfricaWestern AsiaWestern EuropeYemenZaireZimbabweAzores
Householder Income Ages 45 - 64 years
Income
Poverty
Unemployment
Labor Participation
Family Structure
Vehicle Availability
Education Level
Disability

Householder Income Ages 45 - 64 years Comparison

Apache

Palestinians

Tragic
Exceptional
$82,184
HOUSEHOLDER INCOME AGES 45 - 64 YEARS
0.0/ 100
METRIC RATING
320th/ 347
METRIC RANK
$107,721
HOUSEHOLDER INCOME AGES 45 - 64 YEARS
97.6/ 100
METRIC RATING
99th/ 347
METRIC RANK

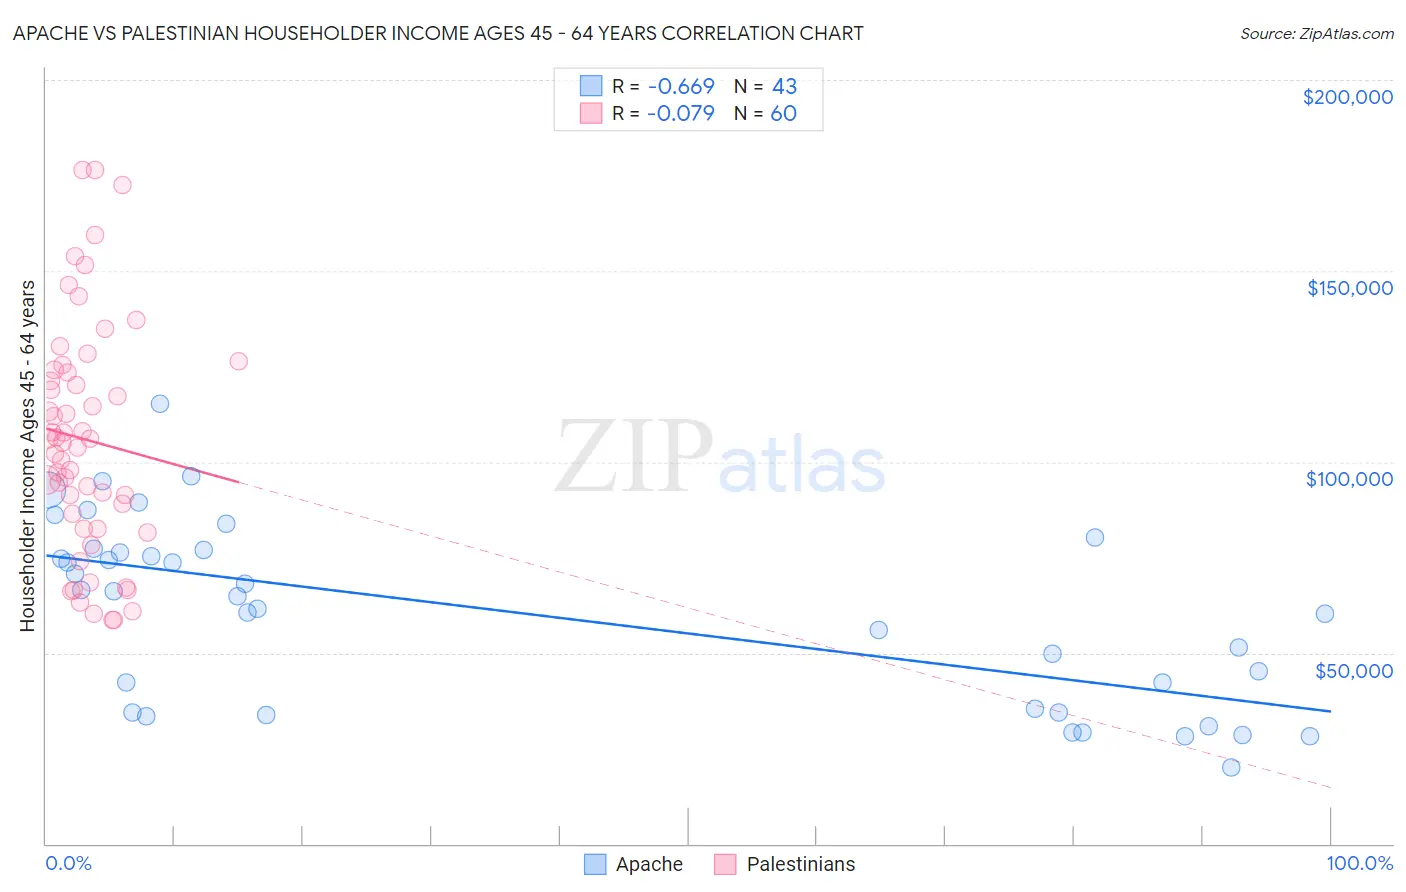
Apache vs Palestinian Householder Income Ages 45 - 64 years Correlation Chart

The statistical analysis conducted on geographies consisting of 230,746,916 people shows a significant negative correlation between the proportion of Apache and household income with householder between the ages 45 and 64 in the United States with a correlation coefficient (R) of -0.669 and weighted average of $82,184. Similarly, the statistical analysis conducted on geographies consisting of 216,304,002 people shows a slight negative correlation between the proportion of Palestinians and household income with householder between the ages 45 and 64 in the United States with a correlation coefficient (R) of -0.079 and weighted average of $107,721, a difference of 31.1%.
Apache vs Palestinian Householder Income Ages 45 - 64 years

Householder Income Ages 45 - 64 years Correlation Summary

MeasurementApachePalestinian
Minimum$19,917$58,671
Maximum$115,357$176,545
Range$95,440$117,874
Mean$60,429$105,880
Median$64,821$105,547
Interquartile 25% (IQ1)$34,492$84,446
Interquartile 75% (IQ3)$77,043$123,759
Interquartile Range (IQR)$42,551$39,313
Standard Deviation (Sample)$23,821$30,088
Standard Deviation (Population)$23,542$29,836

Similar Demographics by Householder Income Ages 45 - 64 years

Demographics Similar to Apache by Householder Income Ages 45 - 64 years

In terms of householder income ages 45 - 64 years, the demographic groups most similar to Apache are Chickasaw ($82,193, a difference of 0.010%), Yuman ($82,139, a difference of 0.050%), Choctaw ($82,287, a difference of 0.13%), Colville ($82,474, a difference of 0.35%), and Immigrants from Caribbean ($82,513, a difference of 0.40%).
DemographicsRating | RankHouseholder Income Ages 45 - 64 years
U.S. Virgin Islanders
0.0
/100
|
#313
Tragic
$82,736
Immigrants | Honduras
0.0
/100
|
#314
Tragic
$82,697
Paiute
0.0
/100
|
#315
Tragic
$82,629
Immigrants | Caribbean
0.0
/100
|
#316
Tragic
$82,513
Colville
0.0
/100
|
#317
Tragic
$82,474
Choctaw
0.0
/100
|
#318
Tragic
$82,287
Chickasaw
0.0
/100
|
#319
Tragic
$82,193
Apache
0.0
/100
|
#320
Tragic
$82,184
Yuman
0.0
/100
|
#321
Tragic
$82,139
Sioux
0.0
/100
|
#322
Tragic
$81,750
Bahamians
0.0
/100
|
#323
Tragic
$81,369
Yup'ik
0.0
/100
|
#324
Tragic
$81,000
Immigrants | Cuba
0.0
/100
|
#325
Tragic
$80,662
Dominicans
0.0
/100
|
#326
Tragic
$80,623
Seminole
0.0
/100
|
#327
Tragic
$80,077

Demographics Similar to Palestinians by Householder Income Ages 45 - 64 years

In terms of householder income ages 45 - 64 years, the demographic groups most similar to Palestinians are Immigrants from Southern Europe ($107,775, a difference of 0.050%), Northern European ($107,870, a difference of 0.14%), Immigrants from Serbia ($107,569, a difference of 0.14%), Immigrants from Kazakhstan ($107,378, a difference of 0.32%), and Immigrants from Moldova ($107,357, a difference of 0.34%).
DemographicsRating | RankHouseholder Income Ages 45 - 64 years
Croatians
98.3
/100
|
#92
Exceptional
$108,383
Immigrants | Croatia
98.2
/100
|
#93
Exceptional
$108,304
Sri Lankans
98.2
/100
|
#94
Exceptional
$108,270
Immigrants | Hungary
98.2
/100
|
#95
Exceptional
$108,267
Immigrants | Argentina
98.2
/100
|
#96
Exceptional
$108,264
Northern Europeans
97.8
/100
|
#97
Exceptional
$107,870
Immigrants | Southern Europe
97.7
/100
|
#98
Exceptional
$107,775
Palestinians
97.6
/100
|
#99
Exceptional
$107,721
Immigrants | Serbia
97.4
/100
|
#100
Exceptional
$107,569
Immigrants | Kazakhstan
97.2
/100
|
#101
Exceptional
$107,378
Immigrants | Moldova
97.1
/100
|
#102
Exceptional
$107,357
Syrians
96.9
/100
|
#103
Exceptional
$107,207
Immigrants | Ukraine
96.7
/100
|
#104
Exceptional
$107,079
Macedonians
96.7
/100
|
#105
Exceptional
$107,074
Armenians
96.6
/100
|
#106
Exceptional
$107,002