Apache vs Immigrants from Philippines Median Household Income
COMPARE
Apache
Immigrants from Philippines
Median Household Income
Median Household Income Comparison
Apache
Immigrants from Philippines
$70,927
MEDIAN HOUSEHOLD INCOME
0.0/ 100
METRIC RATING
316th/ 347
METRIC RANK
$93,899
MEDIAN HOUSEHOLD INCOME
99.6/ 100
METRIC RATING
71st/ 347
METRIC RANK
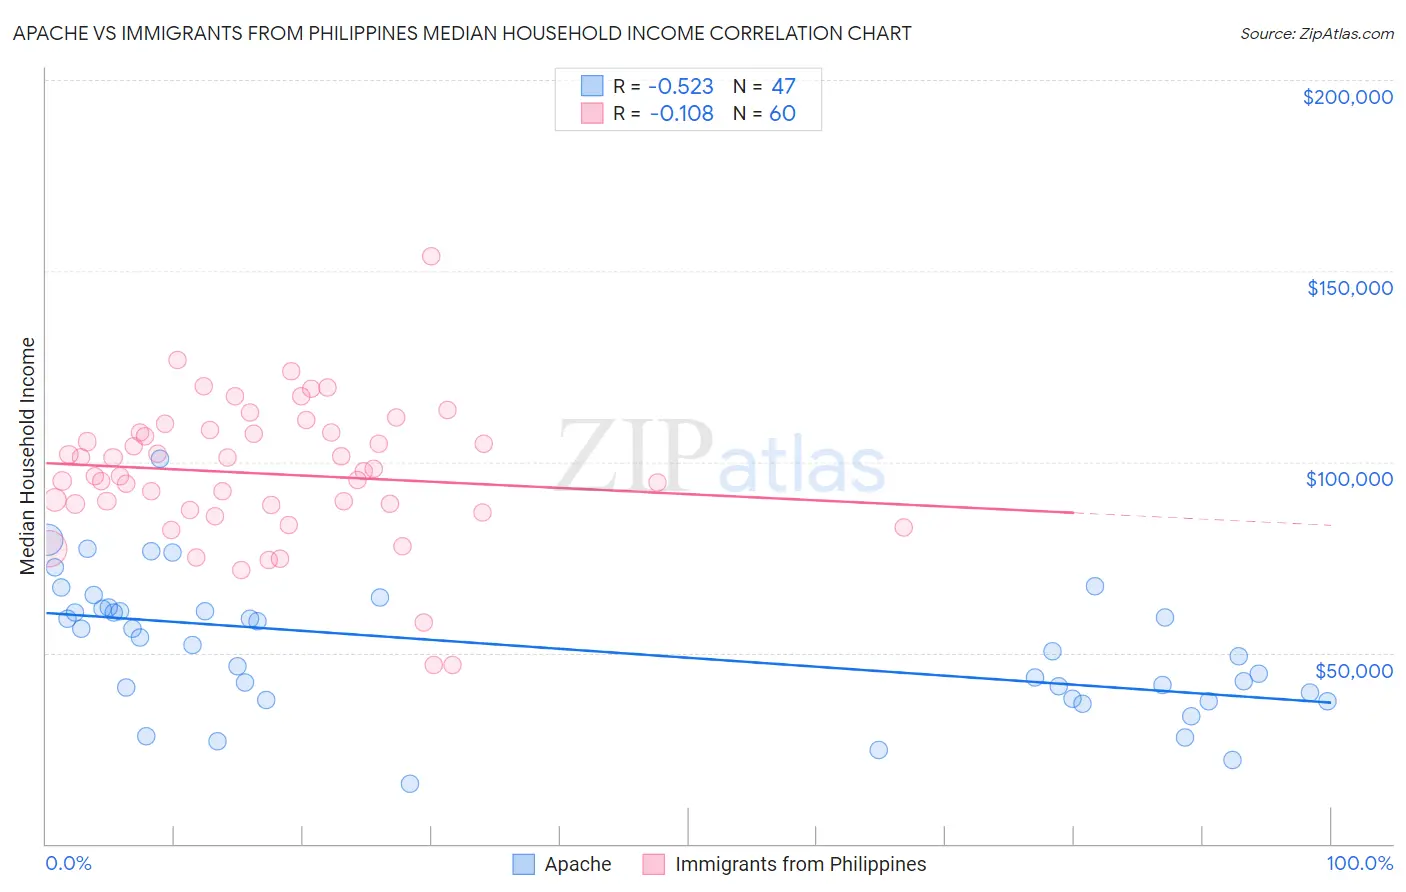
Apache vs Immigrants from Philippines Median Household Income Correlation Chart
The statistical analysis conducted on geographies consisting of 230,997,736 people shows a substantial negative correlation between the proportion of Apache and median household income in the United States with a correlation coefficient (R) of -0.523 and weighted average of $70,927. Similarly, the statistical analysis conducted on geographies consisting of 470,926,305 people shows a poor negative correlation between the proportion of Immigrants from Philippines and median household income in the United States with a correlation coefficient (R) of -0.108 and weighted average of $93,899, a difference of 32.4%.
Median Household Income Correlation Summary
| Measurement | Apache | Immigrants from Philippines |
| Minimum | $15,577 | $46,667 |
| Maximum | $100,781 | $153,750 |
| Range | $85,204 | $107,083 |
| Mean | $51,361 | $96,916 |
| Median | $52,202 | $96,925 |
| Interquartile 25% (IQ1) | $38,125 | $88,127 |
| Interquartile 75% (IQ3) | $61,561 | $107,685 |
| Interquartile Range (IQR) | $23,436 | $19,558 |
| Standard Deviation (Sample) | $17,390 | $18,430 |
| Standard Deviation (Population) | $17,204 | $18,276 |
Similar Demographics by Median Household Income
Demographics Similar to Apache by Median Household Income
In terms of median household income, the demographic groups most similar to Apache are Ottawa ($70,984, a difference of 0.080%), Cajun ($70,605, a difference of 0.46%), Dominican ($71,302, a difference of 0.53%), Chippewa ($70,539, a difference of 0.55%), and Immigrants from Bahamas ($71,349, a difference of 0.59%).
| Demographics | Rating | Rank | Median Household Income |
| Immigrants | Caribbean | 0.0 /100 | #309 | Tragic $71,860 |
| U.S. Virgin Islanders | 0.0 /100 | #310 | Tragic $71,853 |
| Immigrants | Zaire | 0.0 /100 | #311 | Tragic $71,801 |
| Immigrants | Honduras | 0.0 /100 | #312 | Tragic $71,452 |
| Immigrants | Bahamas | 0.0 /100 | #313 | Tragic $71,349 |
| Dominicans | 0.0 /100 | #314 | Tragic $71,302 |
| Ottawa | 0.0 /100 | #315 | Tragic $70,984 |
| Apache | 0.0 /100 | #316 | Tragic $70,927 |
| Cajuns | 0.0 /100 | #317 | Tragic $70,605 |
| Chippewa | 0.0 /100 | #318 | Tragic $70,539 |
| Immigrants | Dominican Republic | 0.0 /100 | #319 | Tragic $70,208 |
| Colville | 0.0 /100 | #320 | Tragic $70,094 |
| Chickasaw | 0.0 /100 | #321 | Tragic $70,005 |
| Choctaw | 0.0 /100 | #322 | Tragic $69,947 |
| Bahamians | 0.0 /100 | #323 | Tragic $69,726 |
Demographics Similar to Immigrants from Philippines by Median Household Income
In terms of median household income, the demographic groups most similar to Immigrants from Philippines are Immigrants from Fiji ($93,933, a difference of 0.040%), Lithuanian ($93,852, a difference of 0.050%), Argentinean ($93,960, a difference of 0.070%), Mongolian ($93,971, a difference of 0.080%), and Immigrants from Scotland ($94,091, a difference of 0.20%).
| Demographics | Rating | Rank | Median Household Income |
| Immigrants | Netherlands | 99.7 /100 | #64 | Exceptional $94,411 |
| Immigrants | Belarus | 99.7 /100 | #65 | Exceptional $94,399 |
| Immigrants | Romania | 99.7 /100 | #66 | Exceptional $94,222 |
| Immigrants | Scotland | 99.7 /100 | #67 | Exceptional $94,091 |
| Mongolians | 99.7 /100 | #68 | Exceptional $93,971 |
| Argentineans | 99.7 /100 | #69 | Exceptional $93,960 |
| Immigrants | Fiji | 99.7 /100 | #70 | Exceptional $93,933 |
| Immigrants | Philippines | 99.6 /100 | #71 | Exceptional $93,899 |
| Lithuanians | 99.6 /100 | #72 | Exceptional $93,852 |
| Immigrants | Egypt | 99.6 /100 | #73 | Exceptional $93,700 |
| Immigrants | Latvia | 99.6 /100 | #74 | Exceptional $93,602 |
| Immigrants | Italy | 99.5 /100 | #75 | Exceptional $93,465 |
| South Africans | 99.5 /100 | #76 | Exceptional $93,379 |
| Immigrants | Afghanistan | 99.5 /100 | #77 | Exceptional $93,375 |
| Immigrants | Bulgaria | 99.4 /100 | #78 | Exceptional $93,148 |