Apache vs Immigrants from Haiti Median Male Earnings
COMPARE
Apache
Immigrants from Haiti
Median Male Earnings
Median Male Earnings Comparison
Apache
Immigrants from Haiti
$46,429
MEDIAN MALE EARNINGS
0.0/ 100
METRIC RATING
311th/ 347
METRIC RANK
$45,266
MEDIAN MALE EARNINGS
0.0/ 100
METRIC RATING
326th/ 347
METRIC RANK
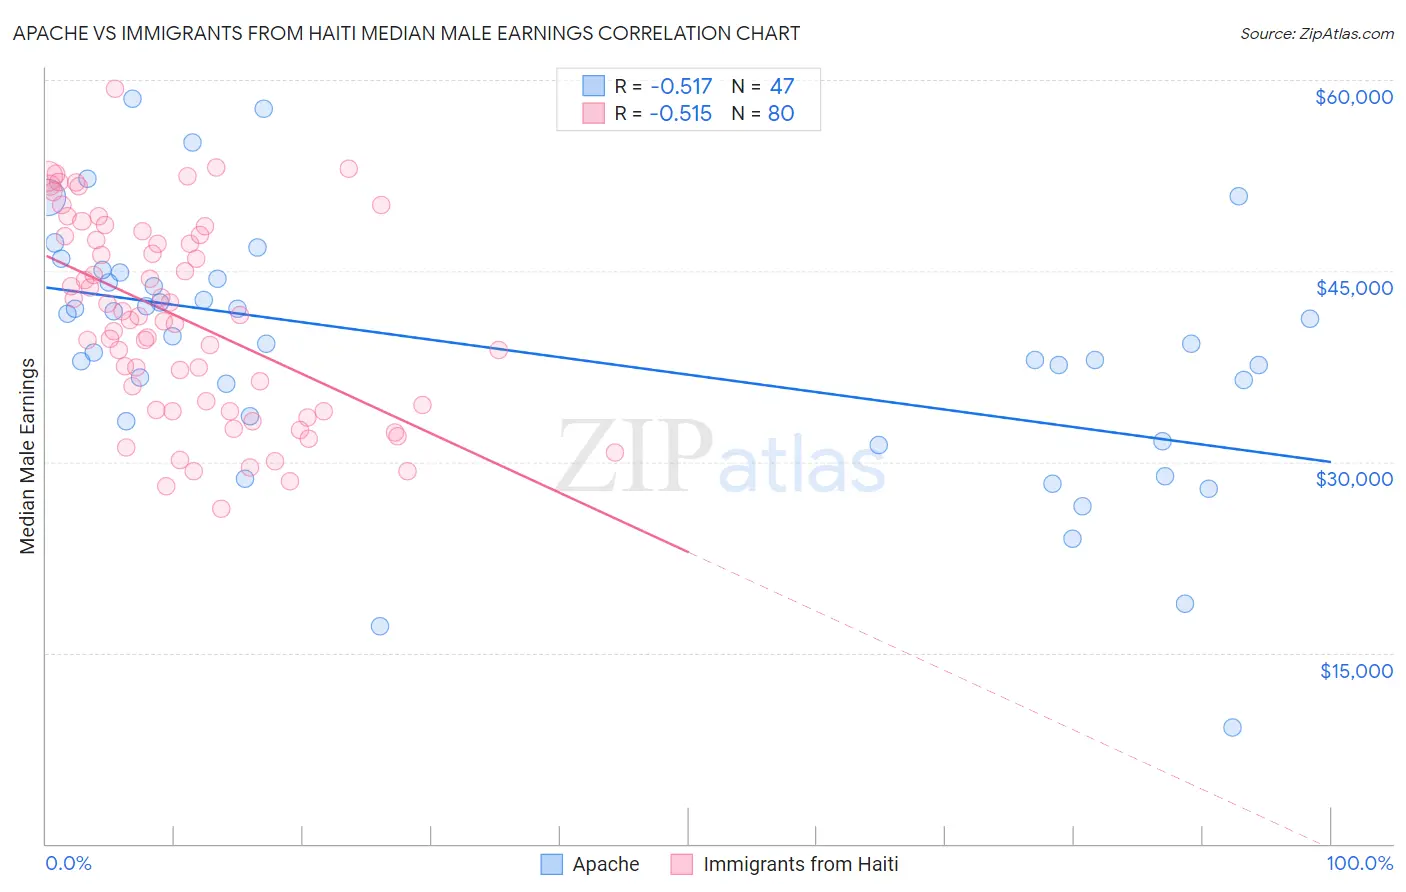
Apache vs Immigrants from Haiti Median Male Earnings Correlation Chart
The statistical analysis conducted on geographies consisting of 231,058,501 people shows a substantial negative correlation between the proportion of Apache and median male earnings in the United States with a correlation coefficient (R) of -0.517 and weighted average of $46,429. Similarly, the statistical analysis conducted on geographies consisting of 225,244,233 people shows a substantial negative correlation between the proportion of Immigrants from Haiti and median male earnings in the United States with a correlation coefficient (R) of -0.515 and weighted average of $45,266, a difference of 2.6%.
Median Male Earnings Correlation Summary
| Measurement | Apache | Immigrants from Haiti |
| Minimum | $9,161 | $26,317 |
| Maximum | $58,566 | $59,316 |
| Range | $49,405 | $32,999 |
| Mean | $38,686 | $41,227 |
| Median | $39,318 | $41,309 |
| Interquartile 25% (IQ1) | $33,190 | $34,055 |
| Interquartile 75% (IQ3) | $44,375 | $47,765 |
| Interquartile Range (IQR) | $11,185 | $13,710 |
| Standard Deviation (Sample) | $10,062 | $7,780 |
| Standard Deviation (Population) | $9,955 | $7,731 |
Demographics Similar to Apache and Immigrants from Haiti by Median Male Earnings
In terms of median male earnings, the demographic groups most similar to Apache are Hispanic or Latino ($46,419, a difference of 0.020%), Honduran ($46,374, a difference of 0.12%), Chippewa ($46,368, a difference of 0.13%), Cuban ($46,580, a difference of 0.33%), and Creek ($46,594, a difference of 0.36%). Similarly, the demographic groups most similar to Immigrants from Haiti are Immigrants from Bahamas ($45,176, a difference of 0.20%), Kiowa ($45,094, a difference of 0.38%), Yuman ($45,446, a difference of 0.40%), Black/African American ($45,523, a difference of 0.57%), and Immigrants from Central America ($45,538, a difference of 0.60%).
| Demographics | Rating | Rank | Median Male Earnings |
| Ottawa | 0.0 /100 | #308 | Tragic $46,611 |
| Creek | 0.0 /100 | #309 | Tragic $46,594 |
| Cubans | 0.0 /100 | #310 | Tragic $46,580 |
| Apache | 0.0 /100 | #311 | Tragic $46,429 |
| Hispanics or Latinos | 0.0 /100 | #312 | Tragic $46,419 |
| Hondurans | 0.0 /100 | #313 | Tragic $46,374 |
| Chippewa | 0.0 /100 | #314 | Tragic $46,368 |
| Immigrants | Guatemala | 0.0 /100 | #315 | Tragic $46,244 |
| Immigrants | Caribbean | 0.0 /100 | #316 | Tragic $46,193 |
| Mexicans | 0.0 /100 | #317 | Tragic $46,147 |
| Cheyenne | 0.0 /100 | #318 | Tragic $46,062 |
| Haitians | 0.0 /100 | #319 | Tragic $45,903 |
| Immigrants | Honduras | 0.0 /100 | #320 | Tragic $45,787 |
| Fijians | 0.0 /100 | #321 | Tragic $45,607 |
| Sioux | 0.0 /100 | #322 | Tragic $45,566 |
| Immigrants | Central America | 0.0 /100 | #323 | Tragic $45,538 |
| Blacks/African Americans | 0.0 /100 | #324 | Tragic $45,523 |
| Yuman | 0.0 /100 | #325 | Tragic $45,446 |
| Immigrants | Haiti | 0.0 /100 | #326 | Tragic $45,266 |
| Immigrants | Bahamas | 0.0 /100 | #327 | Tragic $45,176 |
| Kiowa | 0.0 /100 | #328 | Tragic $45,094 |