American vs Immigrants from Japan Median Family Income
COMPARE
American
Immigrants from Japan
Median Family Income
Median Family Income Comparison
Americans
Immigrants from Japan
$92,096
MEDIAN FAMILY INCOME
0.4/ 100
METRIC RATING
257th/ 347
METRIC RANK
$122,764
MEDIAN FAMILY INCOME
100.0/ 100
METRIC RATING
23rd/ 347
METRIC RANK
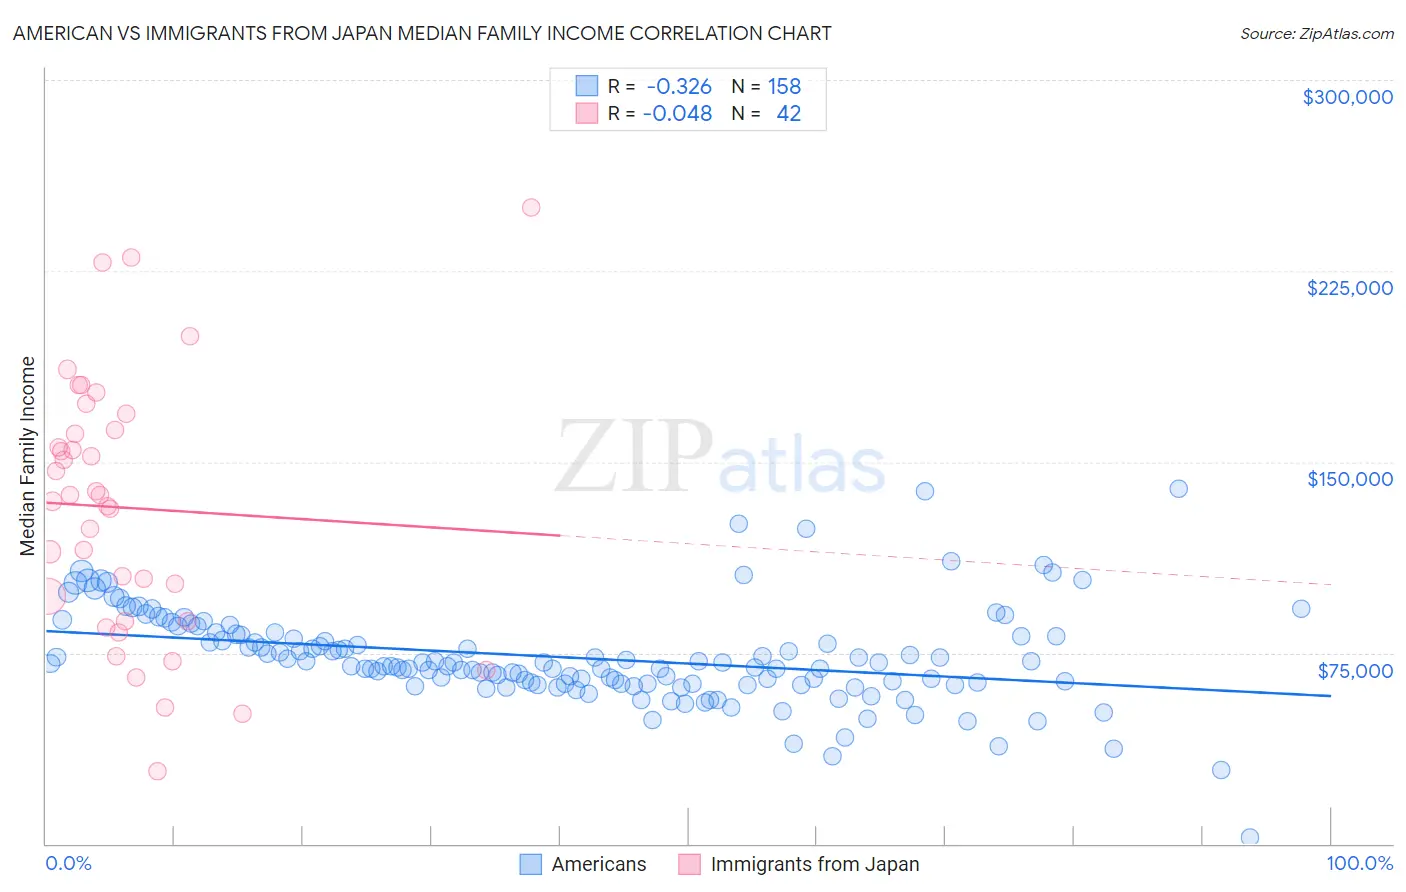
American vs Immigrants from Japan Median Family Income Correlation Chart
The statistical analysis conducted on geographies consisting of 580,248,843 people shows a mild negative correlation between the proportion of Americans and median family income in the United States with a correlation coefficient (R) of -0.326 and weighted average of $92,096. Similarly, the statistical analysis conducted on geographies consisting of 339,915,551 people shows no correlation between the proportion of Immigrants from Japan and median family income in the United States with a correlation coefficient (R) of -0.048 and weighted average of $122,764, a difference of 33.3%.
Median Family Income Correlation Summary
| Measurement | American | Immigrants from Japan |
| Minimum | $2,499 | $28,538 |
| Maximum | $139,235 | $250,001 |
| Range | $136,736 | $221,463 |
| Mean | $73,235 | $131,921 |
| Median | $70,309 | $135,669 |
| Interquartile 25% (IQ1) | $63,060 | $87,578 |
| Interquartile 75% (IQ3) | $81,871 | $162,396 |
| Interquartile Range (IQR) | $18,811 | $74,818 |
| Standard Deviation (Sample) | $18,957 | $50,889 |
| Standard Deviation (Population) | $18,897 | $50,280 |
Similar Demographics by Median Family Income
Demographics Similar to Americans by Median Family Income
In terms of median family income, the demographic groups most similar to Americans are Nicaraguan ($92,231, a difference of 0.15%), Immigrants from Laos ($92,239, a difference of 0.16%), Osage ($91,926, a difference of 0.19%), Cape Verdean ($91,848, a difference of 0.27%), and Immigrants from Barbados ($92,419, a difference of 0.35%).
| Demographics | Rating | Rank | Median Family Income |
| West Indians | 0.6 /100 | #250 | Tragic $92,765 |
| Immigrants | Somalia | 0.6 /100 | #251 | Tragic $92,609 |
| Immigrants | El Salvador | 0.6 /100 | #252 | Tragic $92,545 |
| Immigrants | Guyana | 0.6 /100 | #253 | Tragic $92,513 |
| Immigrants | Barbados | 0.5 /100 | #254 | Tragic $92,419 |
| Immigrants | Laos | 0.5 /100 | #255 | Tragic $92,239 |
| Nicaraguans | 0.5 /100 | #256 | Tragic $92,231 |
| Americans | 0.4 /100 | #257 | Tragic $92,096 |
| Osage | 0.4 /100 | #258 | Tragic $91,926 |
| Cape Verdeans | 0.4 /100 | #259 | Tragic $91,848 |
| Pennsylvania Germans | 0.4 /100 | #260 | Tragic $91,763 |
| Inupiat | 0.4 /100 | #261 | Tragic $91,730 |
| Liberians | 0.4 /100 | #262 | Tragic $91,722 |
| Immigrants | West Indies | 0.3 /100 | #263 | Tragic $91,588 |
| Senegalese | 0.3 /100 | #264 | Tragic $91,475 |
Demographics Similar to Immigrants from Japan by Median Family Income
In terms of median family income, the demographic groups most similar to Immigrants from Japan are Immigrants from Sweden ($122,765, a difference of 0.0%), Immigrants from Korea ($122,800, a difference of 0.030%), Burmese ($123,369, a difference of 0.49%), Immigrants from Northern Europe ($121,840, a difference of 0.76%), and Immigrants from Belgium ($123,831, a difference of 0.87%).
| Demographics | Rating | Rank | Median Family Income |
| Immigrants | China | 100.0 /100 | #16 | Exceptional $125,540 |
| Indians (Asian) | 100.0 /100 | #17 | Exceptional $125,312 |
| Immigrants | Eastern Asia | 100.0 /100 | #18 | Exceptional $125,150 |
| Immigrants | Belgium | 100.0 /100 | #19 | Exceptional $123,831 |
| Burmese | 100.0 /100 | #20 | Exceptional $123,369 |
| Immigrants | Korea | 100.0 /100 | #21 | Exceptional $122,800 |
| Immigrants | Sweden | 100.0 /100 | #22 | Exceptional $122,765 |
| Immigrants | Japan | 100.0 /100 | #23 | Exceptional $122,764 |
| Immigrants | Northern Europe | 100.0 /100 | #24 | Exceptional $121,840 |
| Turks | 100.0 /100 | #25 | Exceptional $121,202 |
| Immigrants | Switzerland | 100.0 /100 | #26 | Exceptional $120,726 |
| Russians | 100.0 /100 | #27 | Exceptional $120,487 |
| Immigrants | Denmark | 100.0 /100 | #28 | Exceptional $120,445 |
| Latvians | 100.0 /100 | #29 | Exceptional $120,301 |
| Immigrants | Sri Lanka | 100.0 /100 | #30 | Exceptional $120,263 |