American vs Fijian Householder Income Over 65 years
COMPARE
American
Fijian
Householder Income Over 65 years
Householder Income Over 65 years Comparison
Americans
Fijians
$55,527
HOUSEHOLDER INCOME OVER 65 YEARS
0.3/ 100
METRIC RATING
254th/ 347
METRIC RANK
$56,768
HOUSEHOLDER INCOME OVER 65 YEARS
1.2/ 100
METRIC RATING
238th/ 347
METRIC RANK
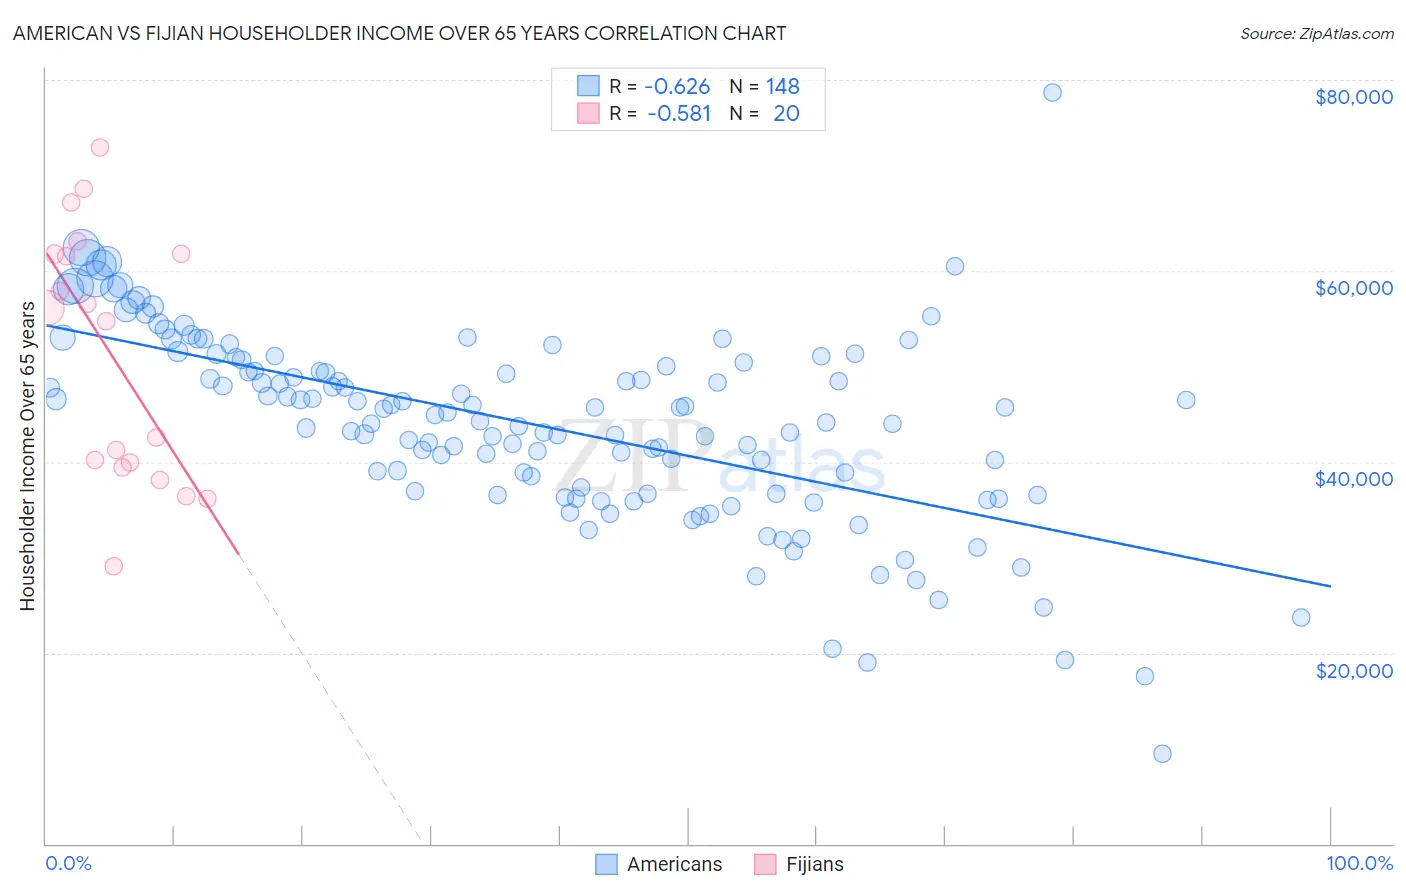
American vs Fijian Householder Income Over 65 years Correlation Chart
The statistical analysis conducted on geographies consisting of 575,586,955 people shows a significant negative correlation between the proportion of Americans and household income with householder over the age of 65 in the United States with a correlation coefficient (R) of -0.626 and weighted average of $55,527. Similarly, the statistical analysis conducted on geographies consisting of 55,863,642 people shows a substantial negative correlation between the proportion of Fijians and household income with householder over the age of 65 in the United States with a correlation coefficient (R) of -0.581 and weighted average of $56,768, a difference of 2.2%.
Householder Income Over 65 years Correlation Summary
| Measurement | American | Fijian |
| Minimum | $9,474 | $29,091 |
| Maximum | $78,750 | $72,983 |
| Range | $69,276 | $43,892 |
| Mean | $43,883 | $51,272 |
| Median | $45,063 | $55,405 |
| Interquartile 25% (IQ1) | $36,777 | $39,651 |
| Interquartile 75% (IQ3) | $50,543 | $61,780 |
| Interquartile Range (IQR) | $13,765 | $22,129 |
| Standard Deviation (Sample) | $10,175 | $13,144 |
| Standard Deviation (Population) | $10,140 | $12,811 |
Demographics Similar to Americans and Fijians by Householder Income Over 65 years
In terms of householder income over 65 years, the demographic groups most similar to Americans are Immigrants from Trinidad and Tobago ($55,598, a difference of 0.13%), Immigrants from Bangladesh ($55,394, a difference of 0.24%), Osage ($55,677, a difference of 0.27%), German Russian ($55,356, a difference of 0.31%), and Immigrants from Portugal ($55,924, a difference of 0.72%). Similarly, the demographic groups most similar to Fijians are Immigrants from Laos ($56,722, a difference of 0.080%), Subsaharan African ($56,615, a difference of 0.27%), Immigrants from Panama ($56,944, a difference of 0.31%), Immigrants from Uruguay ($56,975, a difference of 0.36%), and Immigrants from Guyana ($56,495, a difference of 0.48%).
| Demographics | Rating | Rank | Householder Income Over 65 years |
| Immigrants | Uruguay | 1.5 /100 | #236 | Tragic $56,975 |
| Immigrants | Panama | 1.5 /100 | #237 | Tragic $56,944 |
| Fijians | 1.2 /100 | #238 | Tragic $56,768 |
| Immigrants | Laos | 1.2 /100 | #239 | Tragic $56,722 |
| Sub-Saharan Africans | 1.0 /100 | #240 | Tragic $56,615 |
| Immigrants | Guyana | 0.9 /100 | #241 | Tragic $56,495 |
| Yaqui | 0.8 /100 | #242 | Tragic $56,417 |
| Guyanese | 0.8 /100 | #243 | Tragic $56,351 |
| Hmong | 0.8 /100 | #244 | Tragic $56,339 |
| Immigrants | Uzbekistan | 0.8 /100 | #245 | Tragic $56,331 |
| Central Americans | 0.8 /100 | #246 | Tragic $56,321 |
| Yakama | 0.7 /100 | #247 | Tragic $56,234 |
| Vietnamese | 0.6 /100 | #248 | Tragic $56,143 |
| Mexican American Indians | 0.6 /100 | #249 | Tragic $56,089 |
| Immigrants | Bosnia and Herzegovina | 0.5 /100 | #250 | Tragic $55,986 |
| Immigrants | Portugal | 0.5 /100 | #251 | Tragic $55,924 |
| Osage | 0.4 /100 | #252 | Tragic $55,677 |
| Immigrants | Trinidad and Tobago | 0.4 /100 | #253 | Tragic $55,598 |
| Americans | 0.3 /100 | #254 | Tragic $55,527 |
| Immigrants | Bangladesh | 0.3 /100 | #255 | Tragic $55,394 |
| German Russians | 0.3 /100 | #256 | Tragic $55,356 |