Alsatian vs Pueblo Householder Income Ages 45 - 64 years
COMPARE
Alsatian
Pueblo
Householder Income Ages 45 - 64 years
Householder Income Ages 45 - 64 years Comparison
Alsatians
Pueblo
$100,435
HOUSEHOLDER INCOME AGES 45 - 64 YEARS
51.4/ 100
METRIC RATING
173rd/ 347
METRIC RANK
$75,601
HOUSEHOLDER INCOME AGES 45 - 64 YEARS
0.0/ 100
METRIC RATING
337th/ 347
METRIC RANK
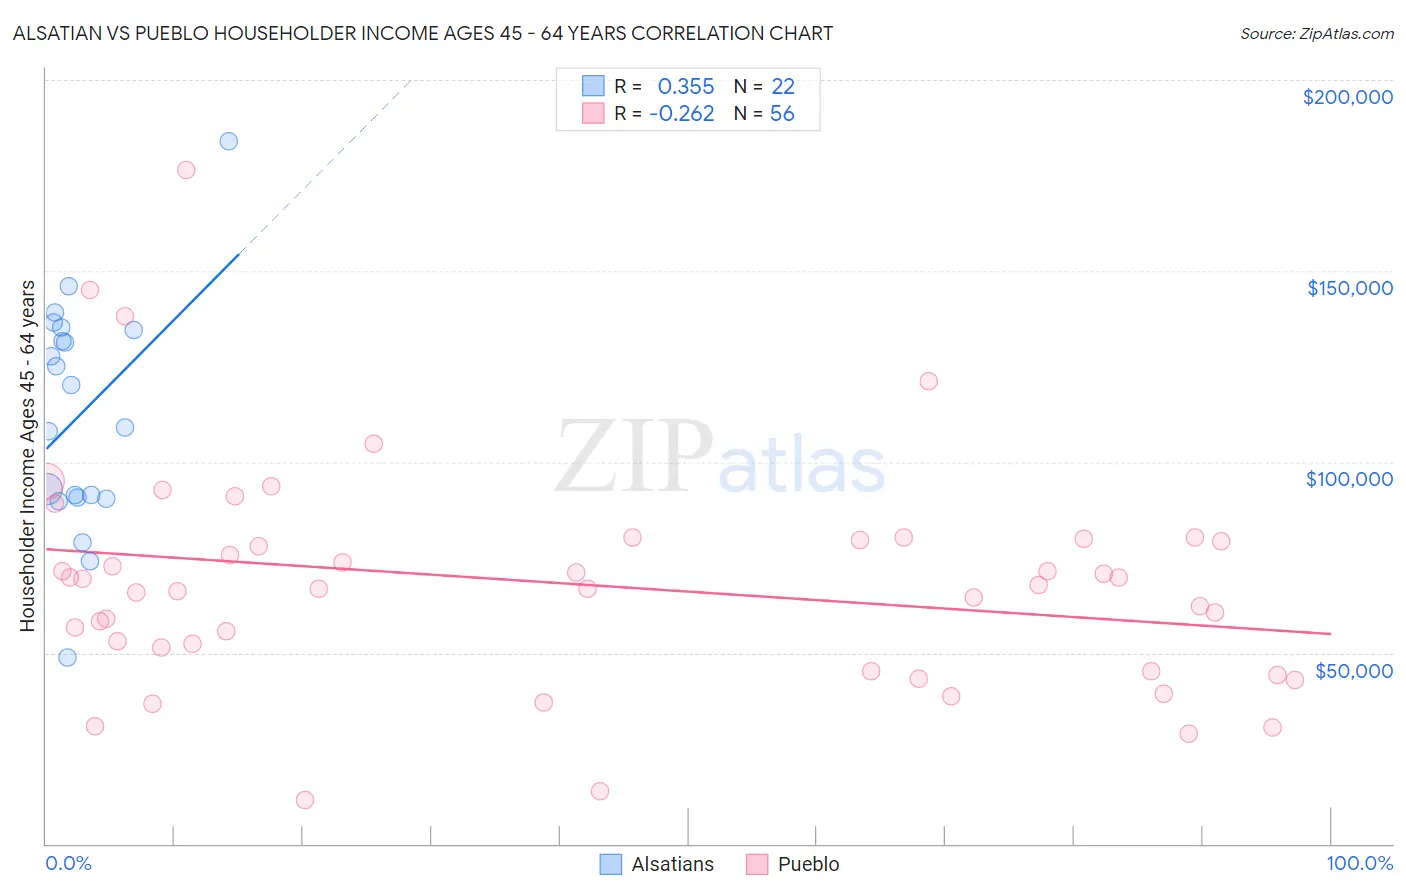
Alsatian vs Pueblo Householder Income Ages 45 - 64 years Correlation Chart
The statistical analysis conducted on geographies consisting of 82,661,679 people shows a mild positive correlation between the proportion of Alsatians and household income with householder between the ages 45 and 64 in the United States with a correlation coefficient (R) of 0.355 and weighted average of $100,435. Similarly, the statistical analysis conducted on geographies consisting of 119,997,423 people shows a weak negative correlation between the proportion of Pueblo and household income with householder between the ages 45 and 64 in the United States with a correlation coefficient (R) of -0.262 and weighted average of $75,601, a difference of 32.9%.
Householder Income Ages 45 - 64 years Correlation Summary
| Measurement | Alsatian | Pueblo |
| Minimum | $48,731 | $11,375 |
| Maximum | $184,018 | $176,310 |
| Range | $135,287 | $164,935 |
| Mean | $112,529 | $68,113 |
| Median | $114,674 | $67,241 |
| Interquartile 25% (IQ1) | $90,588 | $48,248 |
| Interquartile 75% (IQ3) | $134,688 | $79,754 |
| Interquartile Range (IQR) | $44,100 | $31,506 |
| Standard Deviation (Sample) | $30,232 | $29,894 |
| Standard Deviation (Population) | $29,537 | $29,626 |
Similar Demographics by Householder Income Ages 45 - 64 years
Demographics Similar to Alsatians by Householder Income Ages 45 - 64 years
In terms of householder income ages 45 - 64 years, the demographic groups most similar to Alsatians are Immigrants from Uzbekistan ($100,523, a difference of 0.090%), Welsh ($100,322, a difference of 0.11%), German ($100,224, a difference of 0.21%), Immigrants from Costa Rica ($100,141, a difference of 0.29%), and Moroccan ($100,138, a difference of 0.30%).
| Demographics | Rating | Rank | Householder Income Ages 45 - 64 years |
| Samoans | 65.3 /100 | #166 | Good $101,580 |
| Czechoslovakians | 63.0 /100 | #167 | Good $101,387 |
| South American Indians | 60.5 /100 | #168 | Good $101,171 |
| Guamanians/Chamorros | 60.5 /100 | #169 | Good $101,170 |
| Slovaks | 58.8 /100 | #170 | Average $101,029 |
| South Americans | 56.4 /100 | #171 | Average $100,837 |
| Immigrants | Uzbekistan | 52.5 /100 | #172 | Average $100,523 |
| Alsatians | 51.4 /100 | #173 | Average $100,435 |
| Welsh | 50.0 /100 | #174 | Average $100,322 |
| Germans | 48.8 /100 | #175 | Average $100,224 |
| Immigrants | Costa Rica | 47.7 /100 | #176 | Average $100,141 |
| Moroccans | 47.7 /100 | #177 | Average $100,138 |
| Immigrants | Cameroon | 47.0 /100 | #178 | Average $100,084 |
| Belgians | 46.7 /100 | #179 | Average $100,060 |
| Aleuts | 46.6 /100 | #180 | Average $100,052 |
Demographics Similar to Pueblo by Householder Income Ages 45 - 64 years
In terms of householder income ages 45 - 64 years, the demographic groups most similar to Pueblo are Hopi ($75,562, a difference of 0.050%), Arapaho ($75,945, a difference of 0.45%), Cheyenne ($76,362, a difference of 1.0%), Kiowa ($74,815, a difference of 1.1%), and Immigrants from Yemen ($74,575, a difference of 1.4%).
| Demographics | Rating | Rank | Householder Income Ages 45 - 64 years |
| Creek | 0.0 /100 | #330 | Tragic $78,960 |
| Immigrants | Dominican Republic | 0.0 /100 | #331 | Tragic $78,836 |
| Blacks/African Americans | 0.0 /100 | #332 | Tragic $78,556 |
| Immigrants | Congo | 0.0 /100 | #333 | Tragic $77,850 |
| Menominee | 0.0 /100 | #334 | Tragic $76,903 |
| Cheyenne | 0.0 /100 | #335 | Tragic $76,362 |
| Arapaho | 0.0 /100 | #336 | Tragic $75,945 |
| Pueblo | 0.0 /100 | #337 | Tragic $75,601 |
| Hopi | 0.0 /100 | #338 | Tragic $75,562 |
| Kiowa | 0.0 /100 | #339 | Tragic $74,815 |
| Immigrants | Yemen | 0.0 /100 | #340 | Tragic $74,575 |
| Crow | 0.0 /100 | #341 | Tragic $74,257 |
| Tohono O'odham | 0.0 /100 | #342 | Tragic $73,774 |
| Pima | 0.0 /100 | #343 | Tragic $73,365 |
| Houma | 0.0 /100 | #344 | Tragic $72,093 |