Alsatian vs Immigrants from Sierra Leone Median Female Earnings
COMPARE
Alsatian
Immigrants from Sierra Leone
Median Female Earnings
Median Female Earnings Comparison
Alsatians
Immigrants from Sierra Leone
$40,060
MEDIAN FEMALE EARNINGS
68.0/ 100
METRIC RATING
161st/ 347
METRIC RANK
$42,214
MEDIAN FEMALE EARNINGS
99.5/ 100
METRIC RATING
83rd/ 347
METRIC RANK
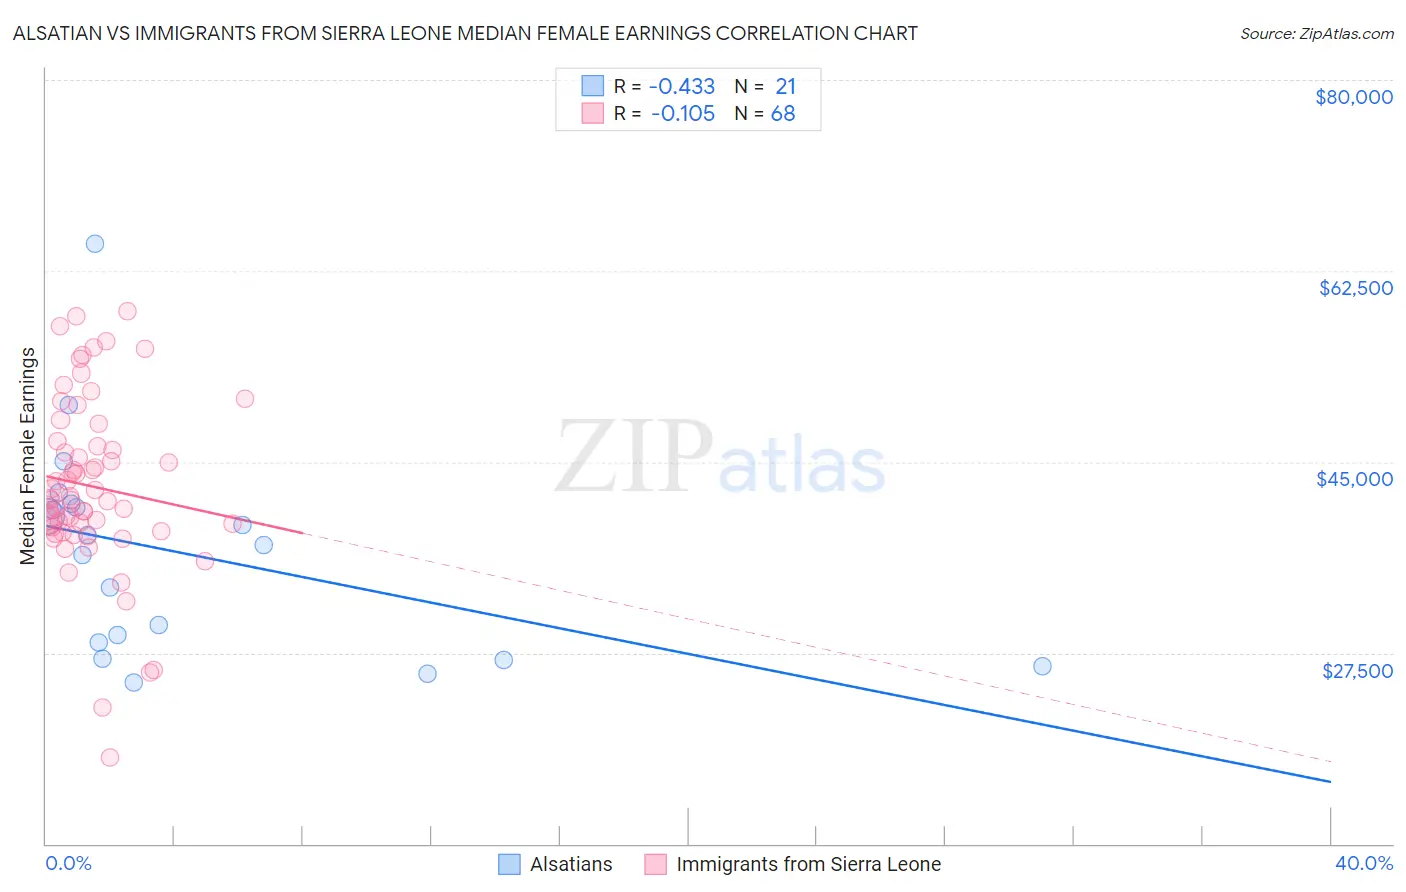
Alsatian vs Immigrants from Sierra Leone Median Female Earnings Correlation Chart
The statistical analysis conducted on geographies consisting of 82,671,266 people shows a moderate negative correlation between the proportion of Alsatians and median female earnings in the United States with a correlation coefficient (R) of -0.433 and weighted average of $40,060. Similarly, the statistical analysis conducted on geographies consisting of 101,627,832 people shows a poor negative correlation between the proportion of Immigrants from Sierra Leone and median female earnings in the United States with a correlation coefficient (R) of -0.105 and weighted average of $42,214, a difference of 5.4%.
Median Female Earnings Correlation Summary
| Measurement | Alsatian | Immigrants from Sierra Leone |
| Minimum | $24,833 | $17,869 |
| Maximum | $65,000 | $58,839 |
| Range | $40,167 | $40,970 |
| Mean | $36,577 | $42,763 |
| Median | $37,425 | $41,611 |
| Interquartile 25% (IQ1) | $27,720 | $38,837 |
| Interquartile 75% (IQ3) | $40,989 | $46,686 |
| Interquartile Range (IQR) | $13,268 | $7,849 |
| Standard Deviation (Sample) | $9,753 | $8,036 |
| Standard Deviation (Population) | $9,518 | $7,977 |
Similar Demographics by Median Female Earnings
Demographics Similar to Alsatians by Median Female Earnings
In terms of median female earnings, the demographic groups most similar to Alsatians are Inupiat ($40,080, a difference of 0.050%), South American Indian ($40,019, a difference of 0.10%), Lebanese ($40,006, a difference of 0.14%), Immigrants from Vietnam ($40,153, a difference of 0.23%), and Immigrants from Senegal ($40,157, a difference of 0.24%).
| Demographics | Rating | Rank | Median Female Earnings |
| Immigrants | Oceania | 77.6 /100 | #154 | Good $40,297 |
| Immigrants | Africa | 76.2 /100 | #155 | Good $40,257 |
| Peruvians | 75.3 /100 | #156 | Good $40,234 |
| Portuguese | 73.0 /100 | #157 | Good $40,177 |
| Immigrants | Senegal | 72.2 /100 | #158 | Good $40,157 |
| Immigrants | Vietnam | 72.0 /100 | #159 | Good $40,153 |
| Inupiat | 68.9 /100 | #160 | Good $40,080 |
| Alsatians | 68.0 /100 | #161 | Good $40,060 |
| South American Indians | 66.1 /100 | #162 | Good $40,019 |
| Lebanese | 65.5 /100 | #163 | Good $40,006 |
| Immigrants | Saudi Arabia | 62.9 /100 | #164 | Good $39,952 |
| Immigrants | Bangladesh | 60.8 /100 | #165 | Good $39,910 |
| Immigrants | Ghana | 60.0 /100 | #166 | Good $39,894 |
| Luxembourgers | 59.9 /100 | #167 | Average $39,891 |
| Immigrants | Peru | 58.9 /100 | #168 | Average $39,871 |
Demographics Similar to Immigrants from Sierra Leone by Median Female Earnings
In terms of median female earnings, the demographic groups most similar to Immigrants from Sierra Leone are Armenian ($42,212, a difference of 0.010%), Immigrants from Morocco ($42,229, a difference of 0.030%), Immigrants from Southern Europe ($42,275, a difference of 0.14%), Laotian ($42,133, a difference of 0.19%), and Immigrants from Moldova ($42,304, a difference of 0.21%).
| Demographics | Rating | Rank | Median Female Earnings |
| Immigrants | Italy | 99.7 /100 | #76 | Exceptional $42,446 |
| Immigrants | Albania | 99.6 /100 | #77 | Exceptional $42,388 |
| Immigrants | Kazakhstan | 99.6 /100 | #78 | Exceptional $42,386 |
| Greeks | 99.6 /100 | #79 | Exceptional $42,336 |
| Immigrants | Moldova | 99.6 /100 | #80 | Exceptional $42,304 |
| Immigrants | Southern Europe | 99.5 /100 | #81 | Exceptional $42,275 |
| Immigrants | Morocco | 99.5 /100 | #82 | Exceptional $42,229 |
| Immigrants | Sierra Leone | 99.5 /100 | #83 | Exceptional $42,214 |
| Armenians | 99.5 /100 | #84 | Exceptional $42,212 |
| Laotians | 99.4 /100 | #85 | Exceptional $42,133 |
| Immigrants | St. Vincent and the Grenadines | 99.3 /100 | #86 | Exceptional $42,108 |
| Lithuanians | 99.3 /100 | #87 | Exceptional $42,108 |
| Immigrants | Northern Africa | 99.3 /100 | #88 | Exceptional $42,084 |
| Immigrants | Afghanistan | 99.3 /100 | #89 | Exceptional $42,055 |
| Ukrainians | 99.2 /100 | #90 | Exceptional $42,015 |