Alsatian vs Immigrants from Chile Householder Income Ages 25 - 44 years
COMPARE
Alsatian
Immigrants from Chile
Householder Income Ages 25 - 44 years
Householder Income Ages 25 - 44 years Comparison
Alsatians
Immigrants from Chile
$95,059
HOUSEHOLDER INCOME AGES 25 - 44 YEARS
56.8/ 100
METRIC RATING
168th/ 347
METRIC RANK
$97,159
HOUSEHOLDER INCOME AGES 25 - 44 YEARS
80.8/ 100
METRIC RATING
144th/ 347
METRIC RANK
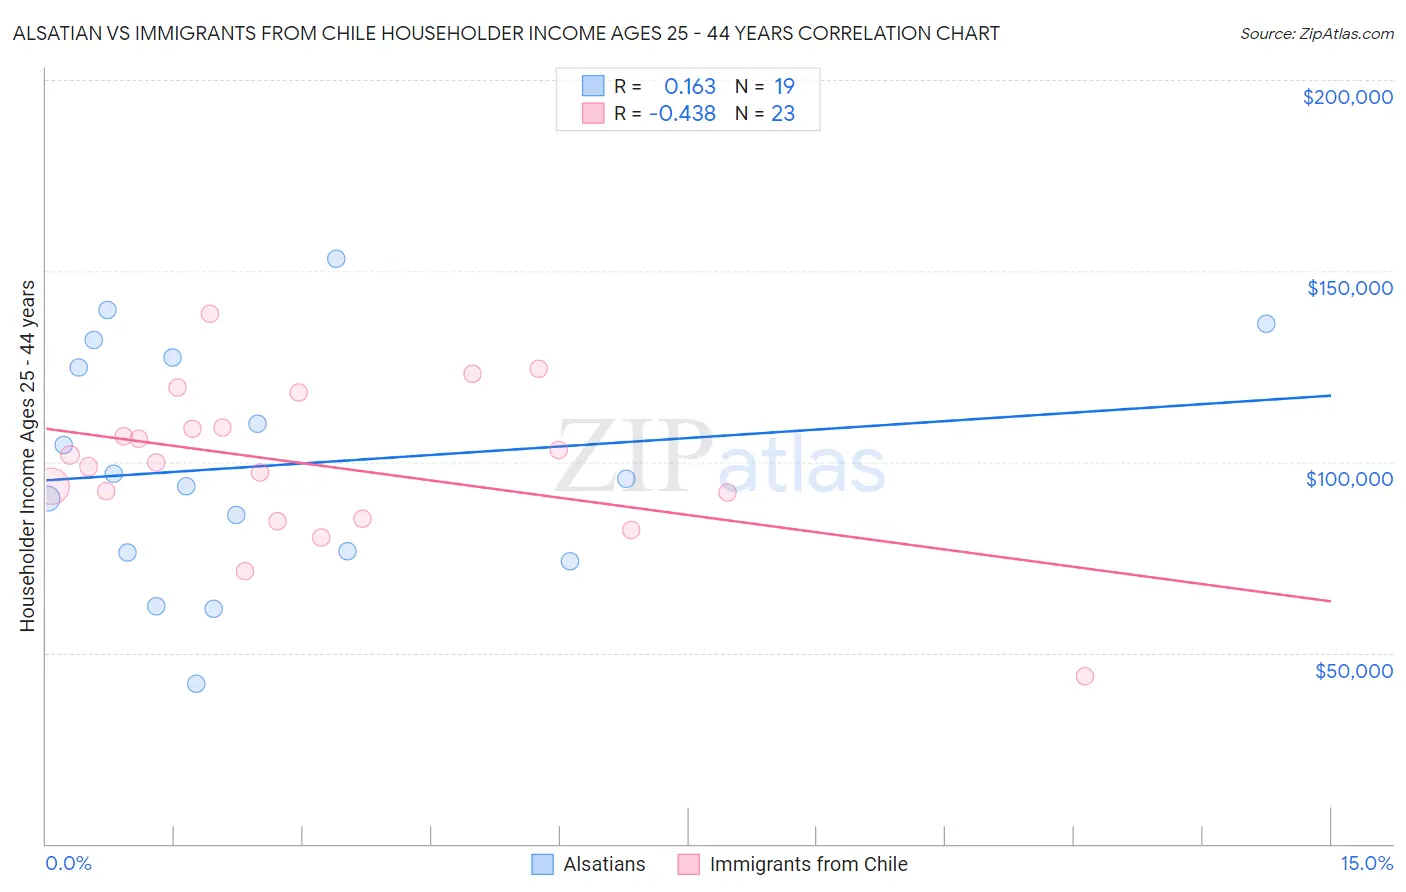
Alsatian vs Immigrants from Chile Householder Income Ages 25 - 44 years Correlation Chart
The statistical analysis conducted on geographies consisting of 82,595,947 people shows a poor positive correlation between the proportion of Alsatians and household income with householder between the ages 25 and 44 in the United States with a correlation coefficient (R) of 0.163 and weighted average of $95,059. Similarly, the statistical analysis conducted on geographies consisting of 218,505,323 people shows a moderate negative correlation between the proportion of Immigrants from Chile and household income with householder between the ages 25 and 44 in the United States with a correlation coefficient (R) of -0.438 and weighted average of $97,159, a difference of 2.2%.
Householder Income Ages 25 - 44 years Correlation Summary
| Measurement | Alsatian | Immigrants from Chile |
| Minimum | $42,026 | $43,889 |
| Maximum | $153,077 | $138,706 |
| Range | $111,051 | $94,817 |
| Mean | $99,110 | $99,118 |
| Median | $95,529 | $99,927 |
| Interquartile 25% (IQ1) | $76,336 | $85,105 |
| Interquartile 75% (IQ3) | $127,229 | $109,064 |
| Interquartile Range (IQR) | $50,893 | $23,959 |
| Standard Deviation (Sample) | $30,381 | $20,106 |
| Standard Deviation (Population) | $29,570 | $19,664 |
Similar Demographics by Householder Income Ages 25 - 44 years
Demographics Similar to Alsatians by Householder Income Ages 25 - 44 years
In terms of householder income ages 25 - 44 years, the demographic groups most similar to Alsatians are Native Hawaiian ($95,058, a difference of 0.0%), Czechoslovakian ($95,070, a difference of 0.010%), Slovak ($95,032, a difference of 0.030%), Immigrants from Armenia ($94,867, a difference of 0.20%), and Immigrants from Ethiopia ($95,256, a difference of 0.21%).
| Demographics | Rating | Rank | Householder Income Ages 25 - 44 years |
| Immigrants | Portugal | 62.8 /100 | #161 | Good $95,512 |
| Swiss | 62.8 /100 | #162 | Good $95,511 |
| Immigrants | Saudi Arabia | 62.0 /100 | #163 | Good $95,450 |
| South Americans | 60.9 /100 | #164 | Good $95,362 |
| Immigrants | Nepal | 60.3 /100 | #165 | Good $95,322 |
| Immigrants | Ethiopia | 59.5 /100 | #166 | Average $95,256 |
| Czechoslovakians | 57.0 /100 | #167 | Average $95,070 |
| Alsatians | 56.8 /100 | #168 | Average $95,059 |
| Native Hawaiians | 56.8 /100 | #169 | Average $95,058 |
| Slovaks | 56.4 /100 | #170 | Average $95,032 |
| Immigrants | Armenia | 54.2 /100 | #171 | Average $94,867 |
| Scottish | 50.8 /100 | #172 | Average $94,622 |
| Finns | 50.6 /100 | #173 | Average $94,610 |
| Colombians | 50.0 /100 | #174 | Average $94,565 |
| English | 48.1 /100 | #175 | Average $94,429 |
Demographics Similar to Immigrants from Chile by Householder Income Ages 25 - 44 years
In terms of householder income ages 25 - 44 years, the demographic groups most similar to Immigrants from Chile are Immigrants from Jordan ($97,185, a difference of 0.030%), Danish ($97,221, a difference of 0.060%), Luxembourger ($97,237, a difference of 0.080%), Immigrants from Morocco ($97,305, a difference of 0.15%), and Arab ($97,336, a difference of 0.18%).
| Demographics | Rating | Rank | Householder Income Ages 25 - 44 years |
| Lebanese | 82.3 /100 | #137 | Excellent $97,339 |
| Arabs | 82.3 /100 | #138 | Excellent $97,336 |
| Immigrants | Peru | 82.2 /100 | #139 | Excellent $97,329 |
| Immigrants | Morocco | 82.0 /100 | #140 | Excellent $97,305 |
| Luxembourgers | 81.5 /100 | #141 | Excellent $97,237 |
| Danes | 81.3 /100 | #142 | Excellent $97,221 |
| Immigrants | Jordan | 81.0 /100 | #143 | Excellent $97,185 |
| Immigrants | Chile | 80.8 /100 | #144 | Excellent $97,159 |
| Norwegians | 78.2 /100 | #145 | Good $96,866 |
| Ethiopians | 77.8 /100 | #146 | Good $96,824 |
| Immigrants | Syria | 77.4 /100 | #147 | Good $96,789 |
| Irish | 76.9 /100 | #148 | Good $96,730 |
| Basques | 76.6 /100 | #149 | Good $96,709 |
| Ugandans | 76.2 /100 | #150 | Good $96,667 |
| Czechs | 74.8 /100 | #151 | Good $96,525 |