Aleut vs Yugoslavian Median Family Income
COMPARE
Aleut
Yugoslavian
Median Family Income
Median Family Income Comparison
Aleuts
Yugoslavians
$98,702
MEDIAN FAMILY INCOME
11.6/ 100
METRIC RATING
207th/ 347
METRIC RANK
$100,119
MEDIAN FAMILY INCOME
21.3/ 100
METRIC RATING
199th/ 347
METRIC RANK
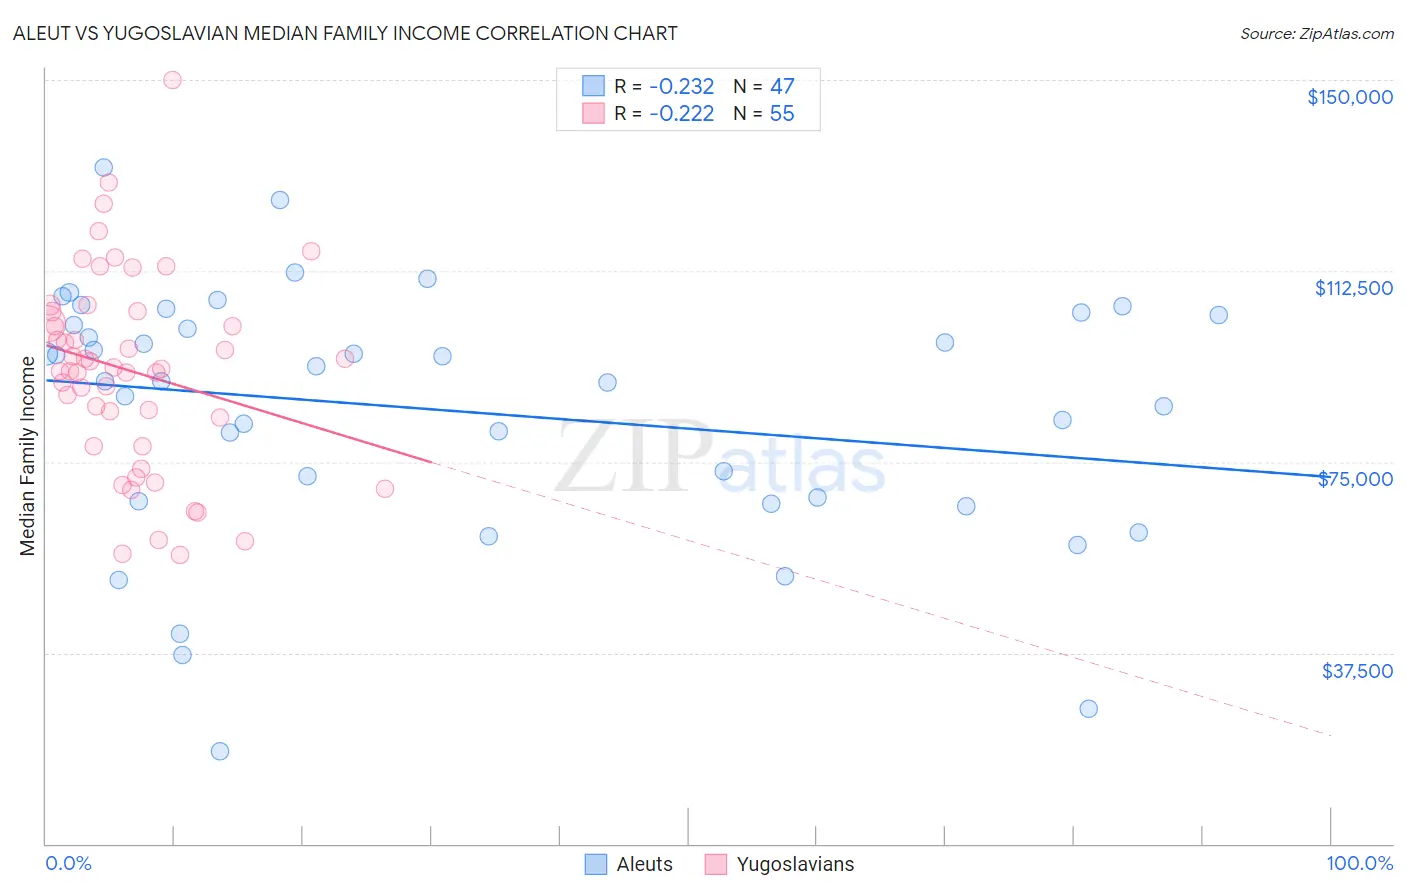
Aleut vs Yugoslavian Median Family Income Correlation Chart
The statistical analysis conducted on geographies consisting of 61,771,380 people shows a weak negative correlation between the proportion of Aleuts and median family income in the United States with a correlation coefficient (R) of -0.232 and weighted average of $98,702. Similarly, the statistical analysis conducted on geographies consisting of 285,576,130 people shows a weak negative correlation between the proportion of Yugoslavians and median family income in the United States with a correlation coefficient (R) of -0.222 and weighted average of $100,119, a difference of 1.4%.
Median Family Income Correlation Summary
| Measurement | Aleut | Yugoslavian |
| Minimum | $18,125 | $56,660 |
| Maximum | $132,750 | $150,000 |
| Range | $114,625 | $93,340 |
| Mean | $85,071 | $92,781 |
| Median | $90,875 | $93,214 |
| Interquartile 25% (IQ1) | $67,198 | $78,167 |
| Interquartile 75% (IQ3) | $103,750 | $104,589 |
| Interquartile Range (IQR) | $36,552 | $26,422 |
| Standard Deviation (Sample) | $24,932 | $19,367 |
| Standard Deviation (Population) | $24,665 | $19,191 |
Demographics Similar to Aleuts and Yugoslavians by Median Family Income
In terms of median family income, the demographic groups most similar to Aleuts are Immigrants from Iraq ($98,786, a difference of 0.080%), Hawaiian ($98,869, a difference of 0.17%), Ghanaian ($98,877, a difference of 0.18%), Immigrants from Uruguay ($98,205, a difference of 0.51%), and Immigrants from Colombia ($98,067, a difference of 0.65%). Similarly, the demographic groups most similar to Yugoslavians are Immigrants from Africa ($100,256, a difference of 0.14%), Spanish ($99,977, a difference of 0.14%), Immigrants from Cameroon ($100,289, a difference of 0.17%), Samoan ($100,344, a difference of 0.22%), and Immigrants from Thailand ($99,840, a difference of 0.28%).
| Demographics | Rating | Rank | Median Family Income |
| Iraqis | 26.3 /100 | #193 | Fair $100,658 |
| Uruguayans | 26.3 /100 | #194 | Fair $100,656 |
| Immigrants | South America | 23.9 /100 | #195 | Fair $100,414 |
| Samoans | 23.3 /100 | #196 | Fair $100,344 |
| Immigrants | Cameroon | 22.8 /100 | #197 | Fair $100,289 |
| Immigrants | Africa | 22.5 /100 | #198 | Fair $100,256 |
| Yugoslavians | 21.3 /100 | #199 | Fair $100,119 |
| Spanish | 20.1 /100 | #200 | Fair $99,977 |
| Immigrants | Thailand | 19.0 /100 | #201 | Poor $99,840 |
| Whites/Caucasians | 18.7 /100 | #202 | Poor $99,800 |
| Scotch-Irish | 17.1 /100 | #203 | Poor $99,591 |
| Ghanaians | 12.6 /100 | #204 | Poor $98,877 |
| Hawaiians | 12.5 /100 | #205 | Poor $98,869 |
| Immigrants | Iraq | 12.1 /100 | #206 | Poor $98,786 |
| Aleuts | 11.6 /100 | #207 | Poor $98,702 |
| Immigrants | Uruguay | 9.2 /100 | #208 | Tragic $98,205 |
| Immigrants | Colombia | 8.7 /100 | #209 | Tragic $98,067 |
| Puget Sound Salish | 8.2 /100 | #210 | Tragic $97,958 |
| Immigrants | Sudan | 7.4 /100 | #211 | Tragic $97,737 |
| Panamanians | 7.2 /100 | #212 | Tragic $97,683 |
| Immigrants | Armenia | 7.0 /100 | #213 | Tragic $97,605 |