Aleut vs Swedish Householder Income Ages 45 - 64 years

COMPARE

Aleut
Race
Ancestry
AfghanAfricanAlaska NativeAlaskan AthabascanAlbanianAleutAlsatianAmericanApacheArabArapahoArgentineanArmenianAssyrian/Chaldean/SyriacAustralianAustrianBahamianBangladeshiBarbadianBasqueBelgianBelizeanBermudanBhutaneseBlackfeetBolivianBrazilianBritishBritish West IndianBulgarianBurmeseCajunCambodianCanadianCape VerdeanCarpatho RusynCelticCentral AmericanCentral American IndianCherokeeCheyenneChickasawChileanChineseChippewaChoctawColombianColvilleComancheCosta RicanCreeCreekCroatianCrowCubanCypriotCzechCzechoslovakianDanishDelawareDominicanDutchDutch West IndianEastern EuropeanEcuadorianEgyptianEnglishEstonianEthiopianEuropeanFijianFilipinoFinnishFrenchFrench American IndianFrench CanadianGermanGerman RussianGhanaianGreekGuamanian/ChamorroGuatemalanGuyaneseHaitianHmongHonduranHopiHoumaHungarianIcelanderIndian (Asian)IndonesianInupiatIranianIraqiIrishIroquoisIsraeliItalianJamaicanJapaneseJordanianKenyanKiowaKoreanLaotianLatvianLebaneseLiberianLithuanianLumbeeLuxembourgerMacedonianMalaysianMalteseMarshalleseMenomineeMexicanMexican American IndianMongolianMoroccanNative HawaiianNavajoNepaleseNew ZealanderNicaraguanNigerianNorthern EuropeanNorwegianOkinawanOsageOttawaPaiutePakistaniPalestinianPanamanianParaguayanPennsylvania GermanPeruvianPimaPolishPortuguesePotawatomiPuebloPuerto RicanPuget Sound SalishRomanianRussianSalvadoranSamoanScandinavianScotch-IrishScottishSeminoleSenegaleseSerbianShoshoneSierra LeoneanSiouxSlavicSlovakSloveneSomaliSouth AfricanSouth AmericanSouth American IndianSoviet UnionSpaniardSpanishSpanish AmericanSpanish American IndianSri LankanSubsaharan AfricanSudaneseSwissSyrianTaiwaneseThaiTlingit-HaidaTohono O'OdhamTonganTrinidadian and TobagonianTsimshianTurkishU.S. Virgin IslanderUgandanUkrainianUruguayanUteVenezuelanVietnameseWelshWest IndianYakamaYaquiYugoslavianYumanYup'ikZimbabwean
Immigration
NonimmigrantsImmigrantsAfghanistanAfricaAlbaniaArgentinaArmeniaAsiaAustraliaAustriaBahamasBangladeshBarbadosBelarusBelgiumBelizeBoliviaBosnia and HerzegovinaBrazilBulgariaBurma/MyanmarCabo VerdeCambodiaCameroonCanadaCaribbeanCentral AmericaChileChinaColombiaCongoCosta RicaCroatiaCubaCzechoslovakiaDenmarkDominicaDominican RepublicEastern AfricaEastern AsiaEastern EuropeEcuadorEgyptEl SalvadorEnglandEritreaEthiopiaEuropeFijiFranceGermanyGhanaGreeceGrenadaGuatemalaGuyanaHaitiHondurasHong KongHungaryIndiaIndonesiaIranIraqIrelandIsraelItalyJamaicaJapanJordanKazakhstanKenyaKoreaKuwaitLaosLatin AmericaLatviaLebanonLiberiaLithuaniaMalaysiaMexicoMicronesiaMiddle AfricaMoldovaMoroccoNepalNetherlandsNicaraguaNigeriaNorth AmericaNorth MacedoniaNorthern AfricaNorthern EuropeNorwayOceaniaPakistanPanamaPeruPhilippinesPolandPortugalRomaniaRussiaSaudi ArabiaScotlandSenegalSerbiaSierra LeoneSingaporeSomaliaSouth AfricaSouth AmericaSouth Central AsiaSouth Eastern AsiaSouthern EuropeSpainSri LankaSt. Vincent and the GrenadinesSudanSwedenSwitzerlandSyriaTaiwanThailandTrinidad and TobagoTurkeyUgandaUkraineUruguayUzbekistanVenezuelaVietnamWest IndiesWestern AfricaWestern AsiaWestern EuropeYemenZaireZimbabweAzores
Swedish
Race
Ancestry
AfghanAfricanAlaska NativeAlaskan AthabascanAlbanianAlsatianAmericanApacheArabArapahoArgentineanArmenianAssyrian/Chaldean/SyriacAustralianAustrianBahamianBangladeshiBarbadianBasqueBelgianBelizeanBermudanBhutaneseBlackfeetBolivianBrazilianBritishBritish West IndianBulgarianBurmeseCajunCambodianCanadianCape VerdeanCarpatho RusynCelticCentral AmericanCentral American IndianCherokeeCheyenneChickasawChileanChineseChippewaChoctawColombianColvilleComancheCosta RicanCreeCreekCroatianCrowCubanCypriotCzechCzechoslovakianDanishDelawareDominicanDutchDutch West IndianEastern EuropeanEcuadorianEgyptianEnglishEstonianEthiopianEuropeanFijianFilipinoFinnishFrenchFrench American IndianFrench CanadianGermanGerman RussianGhanaianGreekGuamanian/ChamorroGuatemalanGuyaneseHaitianHmongHonduranHopiHoumaHungarianIcelanderIndian (Asian)IndonesianInupiatIranianIraqiIrishIroquoisIsraeliItalianJamaicanJapaneseJordanianKenyanKiowaKoreanLaotianLatvianLebaneseLiberianLithuanianLumbeeLuxembourgerMacedonianMalaysianMalteseMarshalleseMenomineeMexicanMexican American IndianMongolianMoroccanNative HawaiianNavajoNepaleseNew ZealanderNicaraguanNigerianNorthern EuropeanNorwegianOkinawanOsageOttawaPaiutePakistaniPalestinianPanamanianParaguayanPennsylvania GermanPeruvianPimaPolishPortuguesePotawatomiPuebloPuerto RicanPuget Sound SalishRomanianRussianSalvadoranSamoanScandinavianScotch-IrishScottishSeminoleSenegaleseSerbianShoshoneSierra LeoneanSiouxSlavicSlovakSloveneSomaliSouth AfricanSouth AmericanSouth American IndianSoviet UnionSpaniardSpanishSpanish AmericanSpanish American IndianSri LankanSubsaharan AfricanSudaneseSwedishSwissSyrianTaiwaneseThaiTlingit-HaidaTohono O'OdhamTonganTrinidadian and TobagonianTsimshianTurkishU.S. Virgin IslanderUgandanUkrainianUruguayanUteVenezuelanVietnameseWelshWest IndianYakamaYaquiYugoslavianYumanYup'ikZimbabwean
Immigration
NonimmigrantsImmigrantsAfghanistanAfricaAlbaniaArgentinaArmeniaAsiaAustraliaAustriaBahamasBangladeshBarbadosBelarusBelgiumBelizeBoliviaBosnia and HerzegovinaBrazilBulgariaBurma/MyanmarCabo VerdeCambodiaCameroonCanadaCaribbeanCentral AmericaChileChinaColombiaCongoCosta RicaCroatiaCubaCzechoslovakiaDenmarkDominicaDominican RepublicEastern AfricaEastern AsiaEastern EuropeEcuadorEgyptEl SalvadorEnglandEritreaEthiopiaEuropeFijiFranceGermanyGhanaGreeceGrenadaGuatemalaGuyanaHaitiHondurasHong KongHungaryIndiaIndonesiaIranIraqIrelandIsraelItalyJamaicaJapanJordanKazakhstanKenyaKoreaKuwaitLaosLatin AmericaLatviaLebanonLiberiaLithuaniaMalaysiaMexicoMicronesiaMiddle AfricaMoldovaMoroccoNepalNetherlandsNicaraguaNigeriaNorth AmericaNorth MacedoniaNorthern AfricaNorthern EuropeNorwayOceaniaPakistanPanamaPeruPhilippinesPolandPortugalRomaniaRussiaSaudi ArabiaScotlandSenegalSerbiaSierra LeoneSingaporeSomaliaSouth AfricaSouth AmericaSouth Central AsiaSouth Eastern AsiaSouthern EuropeSpainSri LankaSt. Vincent and the GrenadinesSudanSwedenSwitzerlandSyriaTaiwanThailandTrinidad and TobagoTurkeyUgandaUkraineUruguayUzbekistanVenezuelaVietnamWest IndiesWestern AfricaWestern AsiaWestern EuropeYemenZaireZimbabweAzores
Householder Income Ages 45 - 64 years
Income
Poverty
Unemployment
Labor Participation
Family Structure
Vehicle Availability
Education Level
Disability

Householder Income Ages 45 - 64 years Comparison

Aleuts

Swedes

Average
Exceptional
$100,052
HOUSEHOLDER INCOME AGES 45 - 64 YEARS
46.6/ 100
METRIC RATING
180th/ 347
METRIC RANK
$106,377
HOUSEHOLDER INCOME AGES 45 - 64 YEARS
95.4/ 100
METRIC RATING
112th/ 347
METRIC RANK

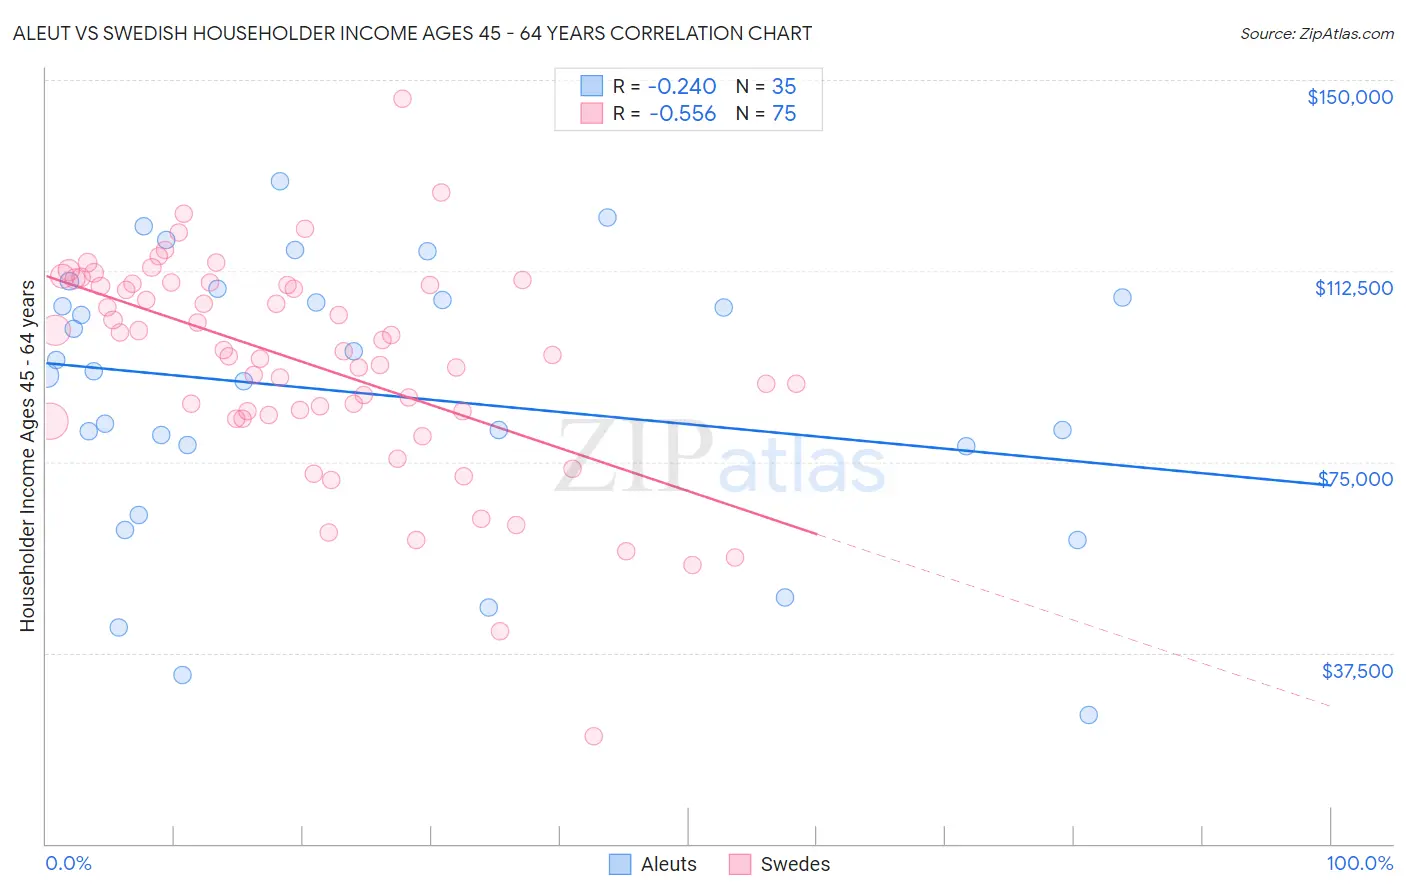
Aleut vs Swedish Householder Income Ages 45 - 64 years Correlation Chart

The statistical analysis conducted on geographies consisting of 61,745,960 people shows a weak negative correlation between the proportion of Aleuts and household income with householder between the ages 45 and 64 in the United States with a correlation coefficient (R) of -0.240 and weighted average of $100,052. Similarly, the statistical analysis conducted on geographies consisting of 536,739,042 people shows a substantial negative correlation between the proportion of Swedes and household income with householder between the ages 45 and 64 in the United States with a correlation coefficient (R) of -0.556 and weighted average of $106,377, a difference of 6.3%.
Aleut vs Swedish Householder Income Ages 45 - 64 years

Householder Income Ages 45 - 64 years Correlation Summary

MeasurementAleutSwedish
Minimum$25,250$21,055
Maximum$130,063$146,263
Range$104,813$125,208
Mean$88,376$94,232
Median$92,906$96,778
Interquartile 25% (IQ1)$78,125$84,274
Interquartile 75% (IQ3)$107,188$109,981
Interquartile Range (IQR)$29,063$25,707
Standard Deviation (Sample)$26,902$21,129
Standard Deviation (Population)$26,515$20,987

Similar Demographics by Householder Income Ages 45 - 64 years

Demographics Similar to Aleuts by Householder Income Ages 45 - 64 years

In terms of householder income ages 45 - 64 years, the demographic groups most similar to Aleuts are Belgian ($100,060, a difference of 0.010%), Immigrants from Cameroon ($100,084, a difference of 0.030%), Immigrants from Costa Rica ($100,141, a difference of 0.090%), Moroccan ($100,138, a difference of 0.090%), and Immigrants ($99,943, a difference of 0.11%).
DemographicsRating | RankHouseholder Income Ages 45 - 64 years
Alsatians
51.4
/100
|
#173
Average
$100,435
Welsh
50.0
/100
|
#174
Average
$100,322
Germans
48.8
/100
|
#175
Average
$100,224
Immigrants | Costa Rica
47.7
/100
|
#176
Average
$100,141
Moroccans
47.7
/100
|
#177
Average
$100,138
Immigrants | Cameroon
47.0
/100
|
#178
Average
$100,084
Belgians
46.7
/100
|
#179
Average
$100,060
Aleuts
46.6
/100
|
#180
Average
$100,052
Immigrants | Immigrants
45.3
/100
|
#181
Average
$99,943
Finns
44.8
/100
|
#182
Average
$99,904
Spaniards
44.6
/100
|
#183
Average
$99,889
French
43.8
/100
|
#184
Average
$99,824
Colombians
43.2
/100
|
#185
Average
$99,772
Dutch
41.7
/100
|
#186
Average
$99,650
Iraqis
38.5
/100
|
#187
Fair
$99,387

Demographics Similar to Swedes by Householder Income Ages 45 - 64 years

In terms of householder income ages 45 - 64 years, the demographic groups most similar to Swedes are European ($106,367, a difference of 0.010%), Immigrants from Vietnam ($106,417, a difference of 0.040%), Immigrants from Poland ($106,319, a difference of 0.060%), Immigrants from Brazil ($106,470, a difference of 0.090%), and Immigrants from Kuwait ($106,285, a difference of 0.090%).
DemographicsRating | RankHouseholder Income Ages 45 - 64 years
Macedonians
96.7
/100
|
#105
Exceptional
$107,074
Armenians
96.6
/100
|
#106
Exceptional
$107,002
Immigrants | Fiji
96.5
/100
|
#107
Exceptional
$106,952
Zimbabweans
96.3
/100
|
#108
Exceptional
$106,849
Chileans
95.9
/100
|
#109
Exceptional
$106,611
Immigrants | Brazil
95.6
/100
|
#110
Exceptional
$106,470
Immigrants | Vietnam
95.5
/100
|
#111
Exceptional
$106,417
Swedes
95.4
/100
|
#112
Exceptional
$106,377
Europeans
95.4
/100
|
#113
Exceptional
$106,367
Immigrants | Poland
95.3
/100
|
#114
Exceptional
$106,319
Immigrants | Kuwait
95.2
/100
|
#115
Exceptional
$106,285
British
95.2
/100
|
#116
Exceptional
$106,264
Albanians
95.1
/100
|
#117
Exceptional
$106,243
Immigrants | Western Asia
95.0
/100
|
#118
Exceptional
$106,217
Immigrants | Jordan
94.9
/100
|
#119
Exceptional
$106,164