Aleut vs Cypriot Median Male Earnings
COMPARE
Aleut
Cypriot
Median Male Earnings
Median Male Earnings Comparison
Aleuts
Cypriots
$51,168
MEDIAN MALE EARNINGS
3.7/ 100
METRIC RATING
233rd/ 347
METRIC RANK
$65,549
MEDIAN MALE EARNINGS
100.0/ 100
METRIC RATING
19th/ 347
METRIC RANK
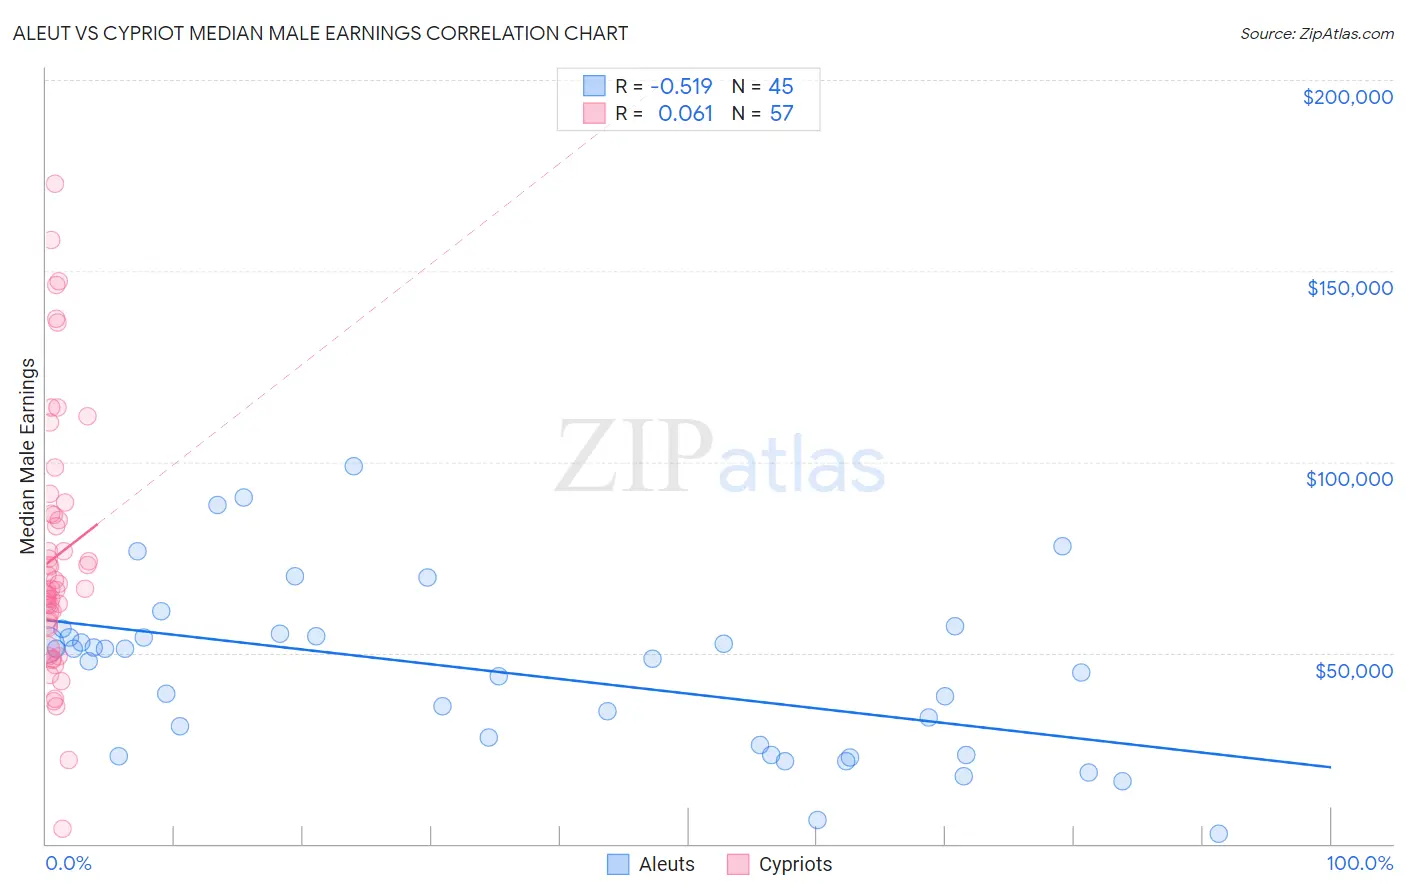
Aleut vs Cypriot Median Male Earnings Correlation Chart
The statistical analysis conducted on geographies consisting of 61,765,699 people shows a substantial negative correlation between the proportion of Aleuts and median male earnings in the United States with a correlation coefficient (R) of -0.519 and weighted average of $51,168. Similarly, the statistical analysis conducted on geographies consisting of 61,867,128 people shows a slight positive correlation between the proportion of Cypriots and median male earnings in the United States with a correlation coefficient (R) of 0.061 and weighted average of $65,549, a difference of 28.1%.
Median Male Earnings Correlation Summary
| Measurement | Aleut | Cypriot |
| Minimum | $2,499 | $3,864 |
| Maximum | $98,906 | $172,778 |
| Range | $96,407 | $168,914 |
| Mean | $44,984 | $75,157 |
| Median | $48,500 | $66,784 |
| Interquartile 25% (IQ1) | $24,583 | $56,985 |
| Interquartile 75% (IQ3) | $54,582 | $86,286 |
| Interquartile Range (IQR) | $29,999 | $29,301 |
| Standard Deviation (Sample) | $22,008 | $33,466 |
| Standard Deviation (Population) | $21,762 | $33,171 |
Similar Demographics by Median Male Earnings
Demographics Similar to Aleuts by Median Male Earnings
In terms of median male earnings, the demographic groups most similar to Aleuts are Sudanese ($51,216, a difference of 0.090%), Barbadian ($51,236, a difference of 0.13%), Cape Verdean ($51,103, a difference of 0.13%), Immigrants from Nigeria ($51,310, a difference of 0.28%), and Immigrants from Trinidad and Tobago ($51,376, a difference of 0.41%).
| Demographics | Rating | Rank | Median Male Earnings |
| Japanese | 4.9 /100 | #226 | Tragic $51,473 |
| Trinidadians and Tobagonians | 4.8 /100 | #227 | Tragic $51,446 |
| Samoans | 4.6 /100 | #228 | Tragic $51,389 |
| Immigrants | Trinidad and Tobago | 4.5 /100 | #229 | Tragic $51,376 |
| Immigrants | Nigeria | 4.2 /100 | #230 | Tragic $51,310 |
| Barbadians | 3.9 /100 | #231 | Tragic $51,236 |
| Sudanese | 3.9 /100 | #232 | Tragic $51,216 |
| Aleuts | 3.7 /100 | #233 | Tragic $51,168 |
| Cape Verdeans | 3.5 /100 | #234 | Tragic $51,103 |
| Immigrants | Western Africa | 3.0 /100 | #235 | Tragic $50,940 |
| Pennsylvania Germans | 2.8 /100 | #236 | Tragic $50,878 |
| Immigrants | Barbados | 2.6 /100 | #237 | Tragic $50,795 |
| Malaysians | 2.5 /100 | #238 | Tragic $50,772 |
| Americans | 2.5 /100 | #239 | Tragic $50,761 |
| West Indians | 2.3 /100 | #240 | Tragic $50,682 |
Demographics Similar to Cypriots by Median Male Earnings
In terms of median male earnings, the demographic groups most similar to Cypriots are Immigrants from Japan ($65,518, a difference of 0.050%), Immigrants from Sweden ($65,406, a difference of 0.22%), Burmese ($65,236, a difference of 0.48%), Immigrants from Korea ($65,079, a difference of 0.72%), and Indian (Asian) ($66,078, a difference of 0.81%).
| Demographics | Rating | Rank | Median Male Earnings |
| Immigrants | Australia | 100.0 /100 | #12 | Exceptional $67,634 |
| Immigrants | China | 100.0 /100 | #13 | Exceptional $67,353 |
| Okinawans | 100.0 /100 | #14 | Exceptional $67,232 |
| Immigrants | Eastern Asia | 100.0 /100 | #15 | Exceptional $66,903 |
| Eastern Europeans | 100.0 /100 | #16 | Exceptional $66,472 |
| Immigrants | Belgium | 100.0 /100 | #17 | Exceptional $66,125 |
| Indians (Asian) | 100.0 /100 | #18 | Exceptional $66,078 |
| Cypriots | 100.0 /100 | #19 | Exceptional $65,549 |
| Immigrants | Japan | 100.0 /100 | #20 | Exceptional $65,518 |
| Immigrants | Sweden | 100.0 /100 | #21 | Exceptional $65,406 |
| Burmese | 100.0 /100 | #22 | Exceptional $65,236 |
| Immigrants | Korea | 100.0 /100 | #23 | Exceptional $65,079 |
| Immigrants | Northern Europe | 100.0 /100 | #24 | Exceptional $64,987 |
| Immigrants | Denmark | 100.0 /100 | #25 | Exceptional $64,625 |
| Turks | 100.0 /100 | #26 | Exceptional $64,253 |