Aleut vs Arapaho Median Earnings
COMPARE
Aleut
Arapaho
Median Earnings
Median Earnings Comparison
Aleuts
Arapaho
$44,241
MEDIAN EARNINGS
4.4/ 100
METRIC RATING
240th/ 347
METRIC RANK
$36,586
MEDIAN EARNINGS
0.0/ 100
METRIC RATING
344th/ 347
METRIC RANK
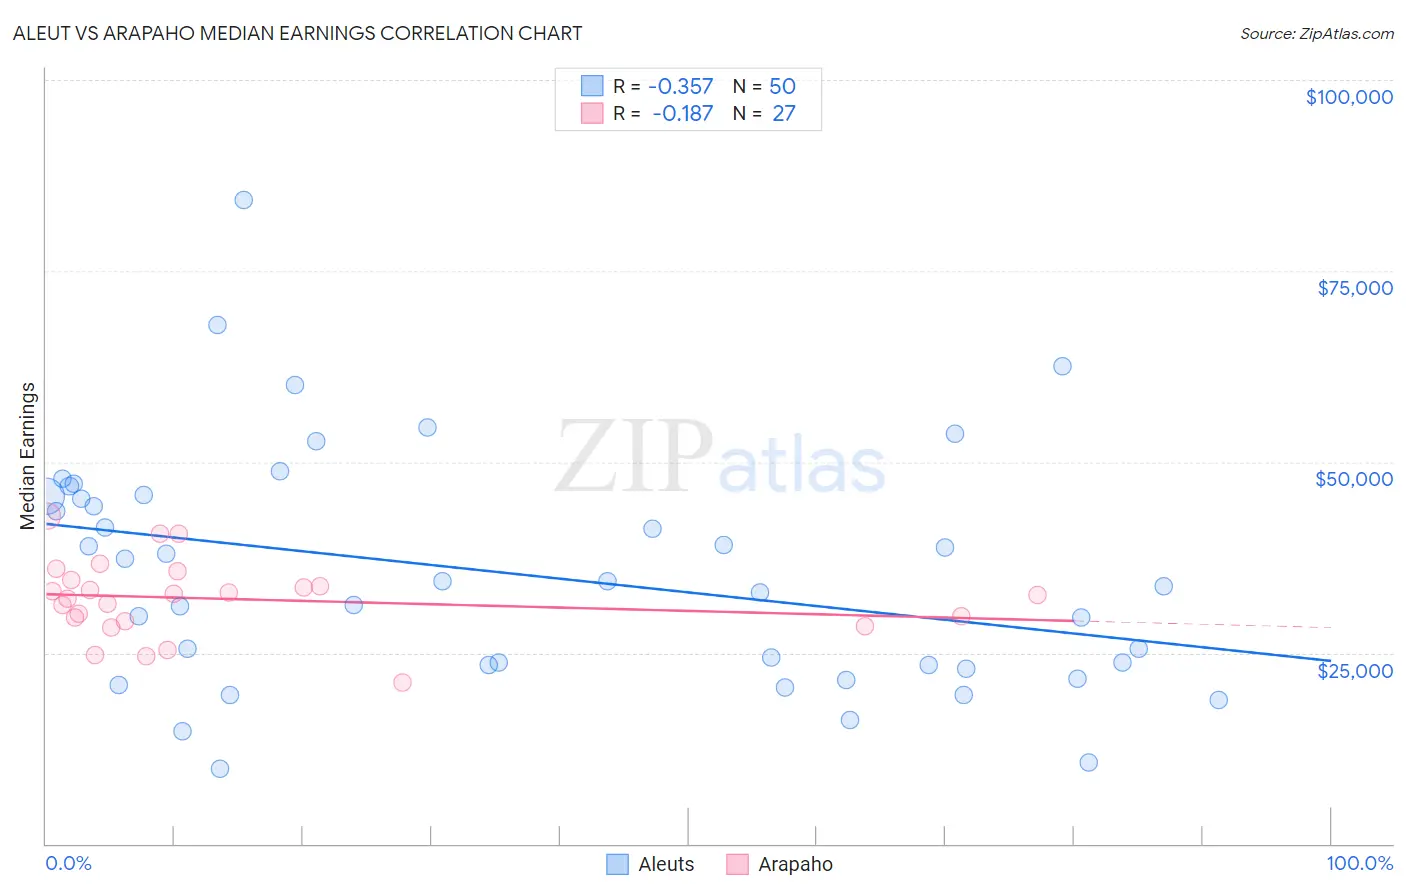
Aleut vs Arapaho Median Earnings Correlation Chart
The statistical analysis conducted on geographies consisting of 61,772,931 people shows a mild negative correlation between the proportion of Aleuts and median earnings in the United States with a correlation coefficient (R) of -0.357 and weighted average of $44,241. Similarly, the statistical analysis conducted on geographies consisting of 29,778,965 people shows a poor negative correlation between the proportion of Arapaho and median earnings in the United States with a correlation coefficient (R) of -0.187 and weighted average of $36,586, a difference of 20.9%.
Median Earnings Correlation Summary
| Measurement | Aleut | Arapaho |
| Minimum | $9,792 | $21,094 |
| Maximum | $84,286 | $42,957 |
| Range | $74,494 | $21,863 |
| Mean | $35,360 | $32,041 |
| Median | $34,021 | $32,563 |
| Interquartile 25% (IQ1) | $23,409 | $29,178 |
| Interquartile 75% (IQ3) | $45,452 | $34,586 |
| Interquartile Range (IQR) | $22,043 | $5,408 |
| Standard Deviation (Sample) | $15,491 | $5,015 |
| Standard Deviation (Population) | $15,336 | $4,921 |
Similar Demographics by Median Earnings
Demographics Similar to Aleuts by Median Earnings
In terms of median earnings, the demographic groups most similar to Aleuts are Samoan ($44,206, a difference of 0.080%), Immigrants from Venezuela ($44,163, a difference of 0.18%), Subsaharan African ($44,118, a difference of 0.28%), Nonimmigrants ($44,117, a difference of 0.28%), and Senegalese ($44,373, a difference of 0.30%).
| Demographics | Rating | Rank | Median Earnings |
| Immigrants | Sudan | 8.8 /100 | #233 | Tragic $44,767 |
| Cape Verdeans | 7.5 /100 | #234 | Tragic $44,640 |
| Venezuelans | 6.9 /100 | #235 | Tragic $44,580 |
| British West Indians | 6.7 /100 | #236 | Tragic $44,552 |
| Immigrants | Ecuador | 5.9 /100 | #237 | Tragic $44,462 |
| Sudanese | 5.6 /100 | #238 | Tragic $44,419 |
| Senegalese | 5.3 /100 | #239 | Tragic $44,373 |
| Aleuts | 4.4 /100 | #240 | Tragic $44,241 |
| Samoans | 4.2 /100 | #241 | Tragic $44,206 |
| Immigrants | Venezuela | 4.0 /100 | #242 | Tragic $44,163 |
| Sub-Saharan Africans | 3.7 /100 | #243 | Tragic $44,118 |
| Immigrants | Nonimmigrants | 3.7 /100 | #244 | Tragic $44,117 |
| Immigrants | Burma/Myanmar | 3.2 /100 | #245 | Tragic $43,998 |
| Immigrants | West Indies | 3.1 /100 | #246 | Tragic $43,989 |
| Immigrants | Cabo Verde | 3.0 /100 | #247 | Tragic $43,963 |
Demographics Similar to Arapaho by Median Earnings
In terms of median earnings, the demographic groups most similar to Arapaho are Tohono O'odham ($36,349, a difference of 0.65%), Pueblo ($36,859, a difference of 0.75%), Hopi ($36,871, a difference of 0.78%), Lumbee ($36,876, a difference of 0.79%), and Navajo ($36,999, a difference of 1.1%).
| Demographics | Rating | Rank | Median Earnings |
| Houma | 0.0 /100 | #333 | Tragic $38,949 |
| Spanish American Indians | 0.0 /100 | #334 | Tragic $38,907 |
| Natives/Alaskans | 0.0 /100 | #335 | Tragic $38,896 |
| Crow | 0.0 /100 | #336 | Tragic $38,707 |
| Immigrants | Cuba | 0.0 /100 | #337 | Tragic $38,426 |
| Pima | 0.0 /100 | #338 | Tragic $38,285 |
| Menominee | 0.0 /100 | #339 | Tragic $37,884 |
| Navajo | 0.0 /100 | #340 | Tragic $36,999 |
| Lumbee | 0.0 /100 | #341 | Tragic $36,876 |
| Hopi | 0.0 /100 | #342 | Tragic $36,871 |
| Pueblo | 0.0 /100 | #343 | Tragic $36,859 |
| Arapaho | 0.0 /100 | #344 | Tragic $36,586 |
| Tohono O'odham | 0.0 /100 | #345 | Tragic $36,349 |
| Yup'ik | 0.0 /100 | #346 | Tragic $35,942 |
| Puerto Ricans | 0.0 /100 | #347 | Tragic $35,560 |