Albanian vs Immigrants from Dominican Republic Householder Income Ages 25 - 44 years
COMPARE
Albanian
Immigrants from Dominican Republic
Householder Income Ages 25 - 44 years
Householder Income Ages 25 - 44 years Comparison
Albanians
Immigrants from Dominican Republic
$101,367
HOUSEHOLDER INCOME AGES 25 - 44 YEARS
97.8/ 100
METRIC RATING
101st/ 347
METRIC RANK
$80,319
HOUSEHOLDER INCOME AGES 25 - 44 YEARS
0.0/ 100
METRIC RATING
305th/ 347
METRIC RANK
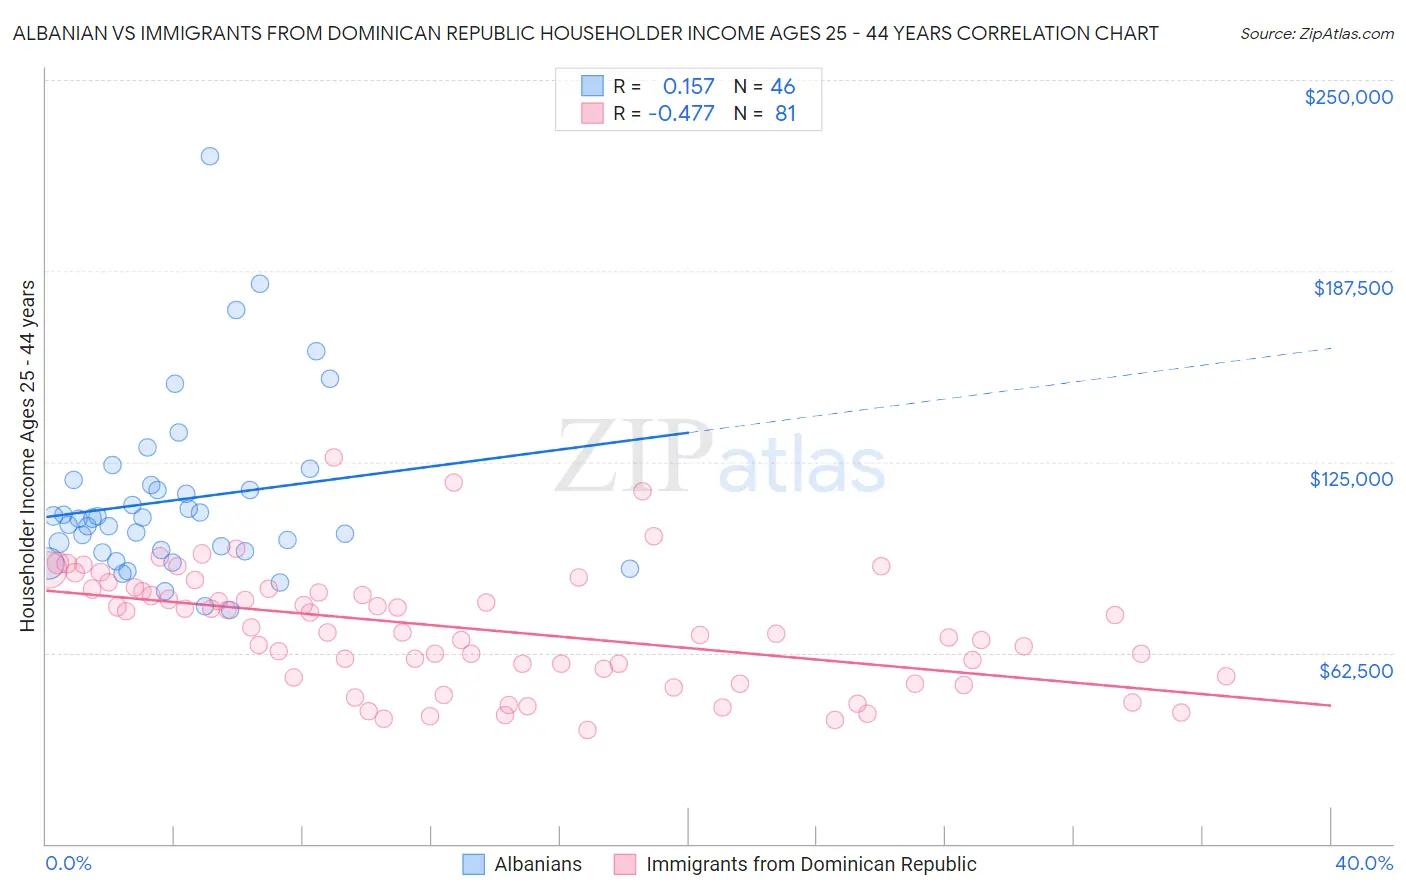
Albanian vs Immigrants from Dominican Republic Householder Income Ages 25 - 44 years Correlation Chart
The statistical analysis conducted on geographies consisting of 193,076,288 people shows a poor positive correlation between the proportion of Albanians and household income with householder between the ages 25 and 44 in the United States with a correlation coefficient (R) of 0.157 and weighted average of $101,367. Similarly, the statistical analysis conducted on geographies consisting of 274,672,798 people shows a moderate negative correlation between the proportion of Immigrants from Dominican Republic and household income with householder between the ages 25 and 44 in the United States with a correlation coefficient (R) of -0.477 and weighted average of $80,319, a difference of 26.2%.
Householder Income Ages 25 - 44 years Correlation Summary
| Measurement | Albanian | Immigrants from Dominican Republic |
| Minimum | $76,718 | $37,215 |
| Maximum | $225,000 | $126,257 |
| Range | $148,282 | $89,042 |
| Mean | $112,576 | $70,454 |
| Median | $106,494 | $69,254 |
| Interquartile 25% (IQ1) | $95,901 | $54,727 |
| Interquartile 75% (IQ3) | $117,313 | $83,452 |
| Interquartile Range (IQR) | $21,412 | $28,725 |
| Standard Deviation (Sample) | $28,766 | $19,333 |
| Standard Deviation (Population) | $28,452 | $19,213 |
Similar Demographics by Householder Income Ages 25 - 44 years
Demographics Similar to Albanians by Householder Income Ages 25 - 44 years
In terms of householder income ages 25 - 44 years, the demographic groups most similar to Albanians are Immigrants from Argentina ($101,415, a difference of 0.050%), Taiwanese ($101,492, a difference of 0.12%), Immigrants from Lebanon ($101,124, a difference of 0.24%), Immigrants from Moldova ($101,091, a difference of 0.27%), and Immigrants from Poland ($101,065, a difference of 0.30%).
| Demographics | Rating | Rank | Householder Income Ages 25 - 44 years |
| Sri Lankans | 98.4 /100 | #94 | Exceptional $101,960 |
| Assyrians/Chaldeans/Syriacs | 98.3 /100 | #95 | Exceptional $101,936 |
| Macedonians | 98.3 /100 | #96 | Exceptional $101,882 |
| Austrians | 98.3 /100 | #97 | Exceptional $101,842 |
| Immigrants | Kazakhstan | 98.1 /100 | #98 | Exceptional $101,727 |
| Taiwanese | 97.9 /100 | #99 | Exceptional $101,492 |
| Immigrants | Argentina | 97.8 /100 | #100 | Exceptional $101,415 |
| Albanians | 97.8 /100 | #101 | Exceptional $101,367 |
| Immigrants | Lebanon | 97.4 /100 | #102 | Exceptional $101,124 |
| Immigrants | Moldova | 97.4 /100 | #103 | Exceptional $101,091 |
| Immigrants | Poland | 97.4 /100 | #104 | Exceptional $101,065 |
| Immigrants | Vietnam | 96.5 /100 | #105 | Exceptional $100,535 |
| Immigrants | Brazil | 96.5 /100 | #106 | Exceptional $100,534 |
| Northern Europeans | 96.3 /100 | #107 | Exceptional $100,457 |
| Immigrants | South Eastern Asia | 96.0 /100 | #108 | Exceptional $100,283 |
Demographics Similar to Immigrants from Dominican Republic by Householder Income Ages 25 - 44 years
In terms of householder income ages 25 - 44 years, the demographic groups most similar to Immigrants from Dominican Republic are Immigrants from Caribbean ($80,326, a difference of 0.010%), Apache ($80,260, a difference of 0.070%), Mexican ($80,427, a difference of 0.13%), Hispanic or Latino ($80,515, a difference of 0.24%), and Immigrants from Micronesia ($80,544, a difference of 0.28%).
| Demographics | Rating | Rank | Householder Income Ages 25 - 44 years |
| Dominicans | 0.1 /100 | #298 | Tragic $81,229 |
| Immigrants | Liberia | 0.1 /100 | #299 | Tragic $80,863 |
| Cherokee | 0.0 /100 | #300 | Tragic $80,843 |
| Immigrants | Micronesia | 0.0 /100 | #301 | Tragic $80,544 |
| Hispanics or Latinos | 0.0 /100 | #302 | Tragic $80,515 |
| Mexicans | 0.0 /100 | #303 | Tragic $80,427 |
| Immigrants | Caribbean | 0.0 /100 | #304 | Tragic $80,326 |
| Immigrants | Dominican Republic | 0.0 /100 | #305 | Tragic $80,319 |
| Apache | 0.0 /100 | #306 | Tragic $80,260 |
| Haitians | 0.0 /100 | #307 | Tragic $80,055 |
| Immigrants | Central America | 0.0 /100 | #308 | Tragic $80,012 |
| Chippewa | 0.0 /100 | #309 | Tragic $80,005 |
| Fijians | 0.0 /100 | #310 | Tragic $79,956 |
| Indonesians | 0.0 /100 | #311 | Tragic $79,543 |
| Immigrants | Haiti | 0.0 /100 | #312 | Tragic $79,391 |