Albanian vs Hungarian Median Earnings
COMPARE
Albanian
Hungarian
Median Earnings
Median Earnings Comparison
Albanians
Hungarians
$50,116
MEDIAN EARNINGS
99.4/ 100
METRIC RATING
88th/ 347
METRIC RANK
$47,795
MEDIAN EARNINGS
87.1/ 100
METRIC RATING
144th/ 347
METRIC RANK
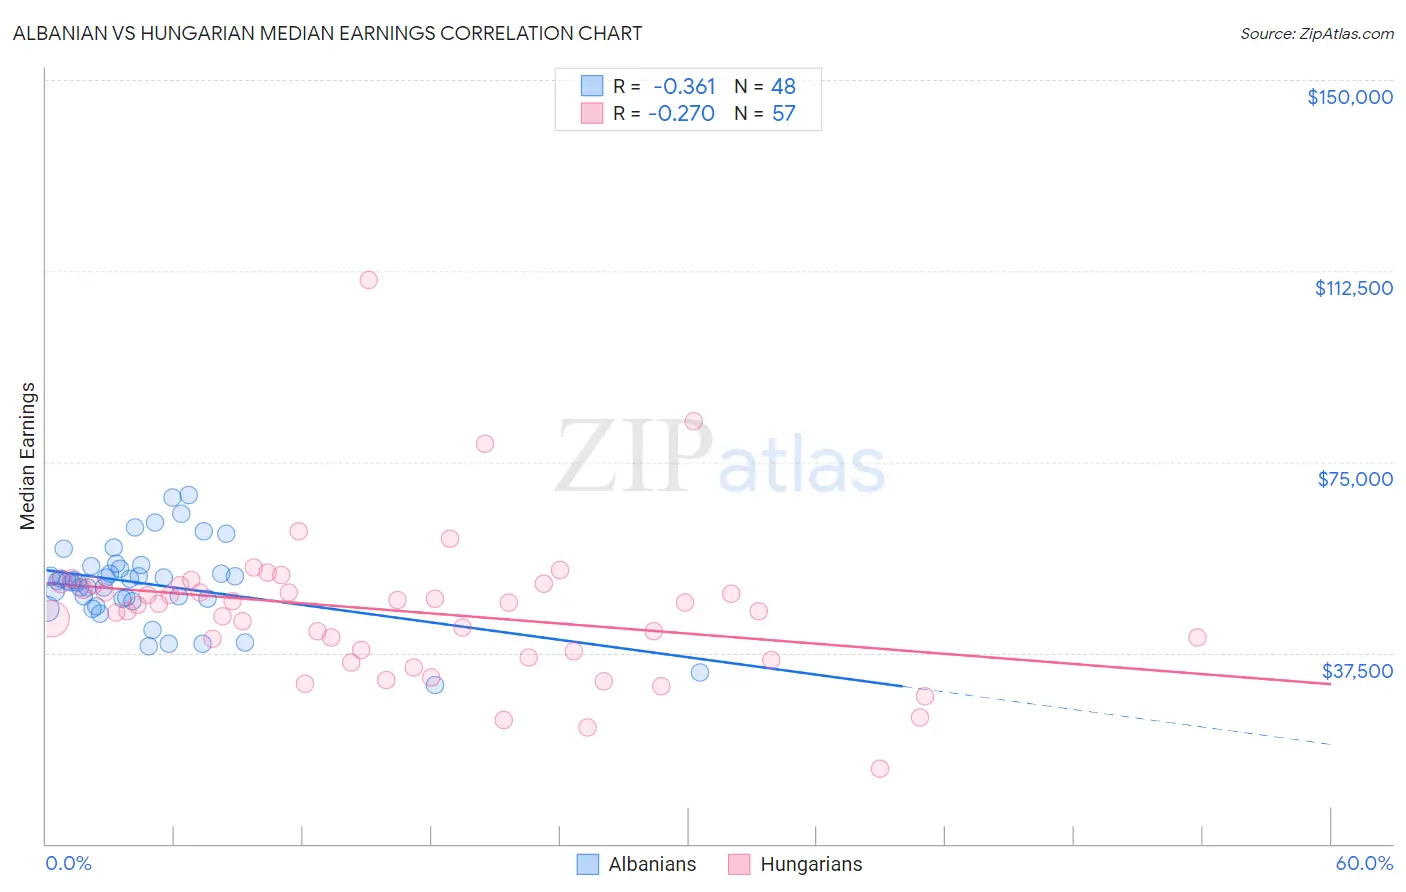
Albanian vs Hungarian Median Earnings Correlation Chart
The statistical analysis conducted on geographies consisting of 193,255,601 people shows a mild negative correlation between the proportion of Albanians and median earnings in the United States with a correlation coefficient (R) of -0.361 and weighted average of $50,116. Similarly, the statistical analysis conducted on geographies consisting of 486,158,969 people shows a weak negative correlation between the proportion of Hungarians and median earnings in the United States with a correlation coefficient (R) of -0.270 and weighted average of $47,795, a difference of 4.9%.
Median Earnings Correlation Summary
| Measurement | Albanian | Hungarian |
| Minimum | $31,250 | $14,721 |
| Maximum | $68,474 | $110,790 |
| Range | $37,224 | $96,069 |
| Mean | $51,050 | $45,677 |
| Median | $51,491 | $46,823 |
| Interquartile 25% (IQ1) | $47,850 | $37,180 |
| Interquartile 75% (IQ3) | $54,177 | $50,813 |
| Interquartile Range (IQR) | $6,327 | $13,633 |
| Standard Deviation (Sample) | $7,882 | $14,634 |
| Standard Deviation (Population) | $7,799 | $14,505 |
Similar Demographics by Median Earnings
Demographics Similar to Albanians by Median Earnings
In terms of median earnings, the demographic groups most similar to Albanians are Immigrants from North America ($50,108, a difference of 0.020%), Immigrants from Uzbekistan ($50,151, a difference of 0.070%), Immigrants from Canada ($50,192, a difference of 0.15%), Immigrants from Hungary ($50,227, a difference of 0.22%), and Immigrants from Kazakhstan ($50,225, a difference of 0.22%).
| Demographics | Rating | Rank | Median Earnings |
| Immigrants | Southern Europe | 99.6 /100 | #81 | Exceptional $50,280 |
| Immigrants | Moldova | 99.5 /100 | #82 | Exceptional $50,274 |
| Romanians | 99.5 /100 | #83 | Exceptional $50,244 |
| Immigrants | Hungary | 99.5 /100 | #84 | Exceptional $50,227 |
| Immigrants | Kazakhstan | 99.5 /100 | #85 | Exceptional $50,225 |
| Immigrants | Canada | 99.5 /100 | #86 | Exceptional $50,192 |
| Immigrants | Uzbekistan | 99.5 /100 | #87 | Exceptional $50,151 |
| Albanians | 99.4 /100 | #88 | Exceptional $50,116 |
| Immigrants | North America | 99.4 /100 | #89 | Exceptional $50,108 |
| Italians | 99.3 /100 | #90 | Exceptional $49,915 |
| Macedonians | 99.2 /100 | #91 | Exceptional $49,893 |
| Immigrants | Argentina | 99.2 /100 | #92 | Exceptional $49,841 |
| Armenians | 99.1 /100 | #93 | Exceptional $49,804 |
| Croatians | 99.0 /100 | #94 | Exceptional $49,724 |
| Immigrants | England | 99.0 /100 | #95 | Exceptional $49,722 |
Demographics Similar to Hungarians by Median Earnings
In terms of median earnings, the demographic groups most similar to Hungarians are Ugandan ($47,854, a difference of 0.12%), Swedish ($47,851, a difference of 0.12%), Immigrants from Sierra Leone ($47,875, a difference of 0.17%), Immigrants from Saudi Arabia ($47,704, a difference of 0.19%), and Immigrants from Chile ($47,697, a difference of 0.21%).
| Demographics | Rating | Rank | Median Earnings |
| Immigrants | Nepal | 89.0 /100 | #137 | Excellent $47,925 |
| Europeans | 88.9 /100 | #138 | Excellent $47,915 |
| Canadians | 88.8 /100 | #139 | Excellent $47,911 |
| Taiwanese | 88.7 /100 | #140 | Excellent $47,902 |
| Immigrants | Sierra Leone | 88.3 /100 | #141 | Excellent $47,875 |
| Ugandans | 88.0 /100 | #142 | Excellent $47,854 |
| Swedes | 88.0 /100 | #143 | Excellent $47,851 |
| Hungarians | 87.1 /100 | #144 | Excellent $47,795 |
| Immigrants | Saudi Arabia | 85.6 /100 | #145 | Excellent $47,704 |
| Immigrants | Chile | 85.5 /100 | #146 | Excellent $47,697 |
| Immigrants | South Eastern Asia | 85.0 /100 | #147 | Excellent $47,671 |
| Immigrants | Eritrea | 84.8 /100 | #148 | Excellent $47,657 |
| Luxembourgers | 84.5 /100 | #149 | Excellent $47,640 |
| Peruvians | 84.2 /100 | #150 | Excellent $47,628 |
| Immigrants | Oceania | 84.1 /100 | #151 | Excellent $47,617 |