Alaska Native vs Immigrants from West Indies Median Earnings
COMPARE
Alaska Native
Immigrants from West Indies
Median Earnings
Median Earnings Comparison
Alaska Natives
Immigrants from West Indies
$43,750
MEDIAN EARNINGS
2.3/ 100
METRIC RATING
250th/ 347
METRIC RANK
$43,989
MEDIAN EARNINGS
3.1/ 100
METRIC RATING
246th/ 347
METRIC RANK
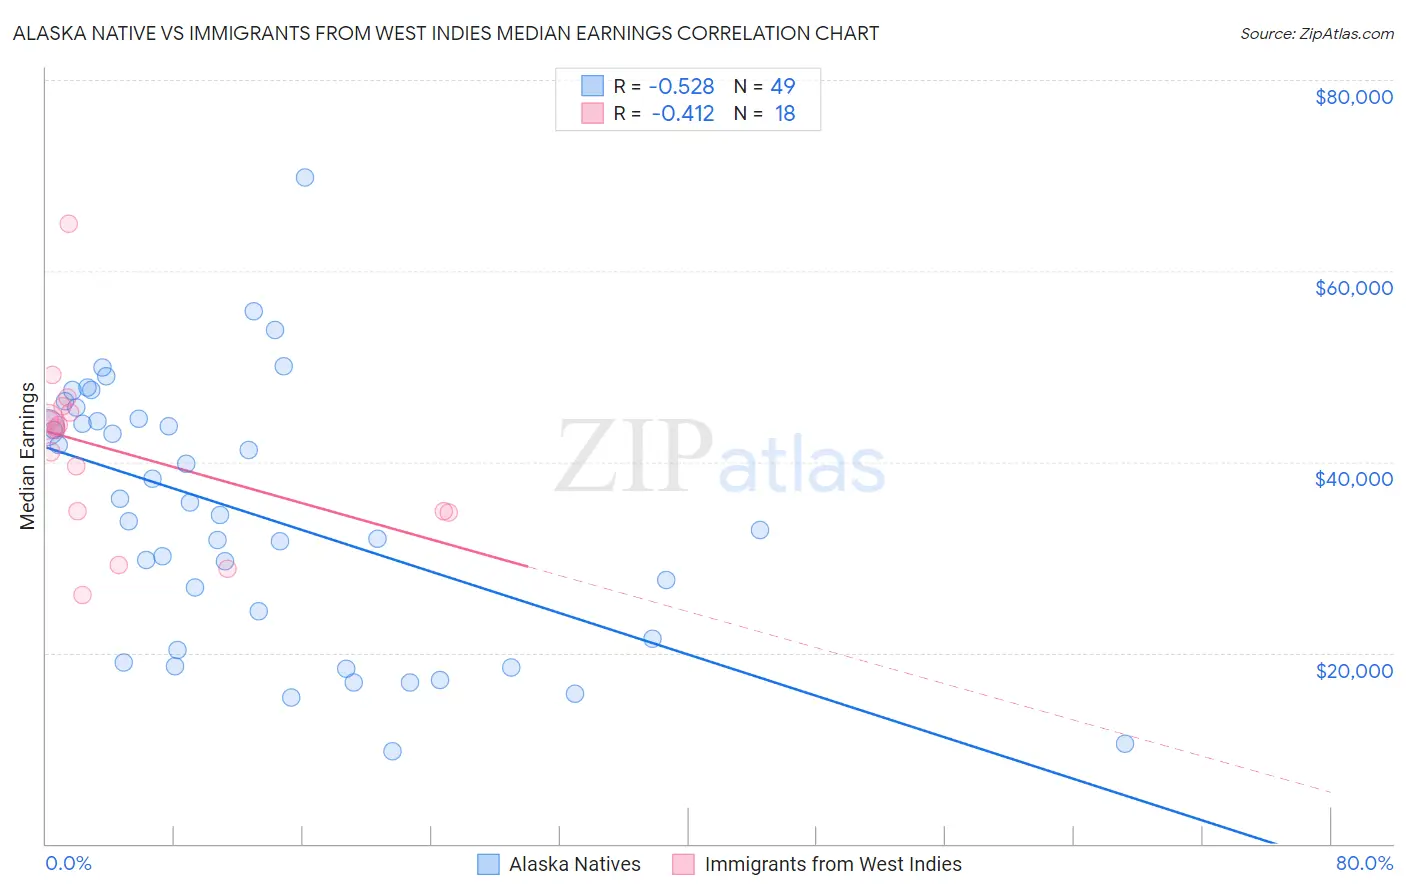
Alaska Native vs Immigrants from West Indies Median Earnings Correlation Chart
The statistical analysis conducted on geographies consisting of 76,766,332 people shows a substantial negative correlation between the proportion of Alaska Natives and median earnings in the United States with a correlation coefficient (R) of -0.528 and weighted average of $43,750. Similarly, the statistical analysis conducted on geographies consisting of 72,420,477 people shows a moderate negative correlation between the proportion of Immigrants from West Indies and median earnings in the United States with a correlation coefficient (R) of -0.412 and weighted average of $43,989, a difference of 0.55%.
Median Earnings Correlation Summary
| Measurement | Alaska Native | Immigrants from West Indies |
| Minimum | $9,662 | $26,000 |
| Maximum | $69,808 | $64,982 |
| Range | $60,146 | $38,982 |
| Mean | $34,396 | $41,111 |
| Median | $34,412 | $43,487 |
| Interquartile 25% (IQ1) | $20,906 | $34,810 |
| Interquartile 75% (IQ3) | $44,339 | $45,119 |
| Interquartile Range (IQR) | $23,432 | $10,309 |
| Standard Deviation (Sample) | $13,540 | $9,035 |
| Standard Deviation (Population) | $13,401 | $8,780 |
Demographics Similar to Alaska Natives and Immigrants from West Indies by Median Earnings
In terms of median earnings, the demographic groups most similar to Alaska Natives are Tsimshian ($43,695, a difference of 0.13%), Hawaiian ($43,673, a difference of 0.18%), Malaysian ($43,844, a difference of 0.22%), Nepalese ($43,860, a difference of 0.25%), and Somali ($43,567, a difference of 0.42%). Similarly, the demographic groups most similar to Immigrants from West Indies are Immigrants from Burma/Myanmar ($43,998, a difference of 0.020%), Immigrants from Cabo Verde ($43,963, a difference of 0.060%), Subsaharan African ($44,118, a difference of 0.29%), Nonimmigrants ($44,117, a difference of 0.29%), and Nepalese ($43,860, a difference of 0.29%).
| Demographics | Rating | Rank | Median Earnings |
| Sudanese | 5.6 /100 | #238 | Tragic $44,419 |
| Senegalese | 5.3 /100 | #239 | Tragic $44,373 |
| Aleuts | 4.4 /100 | #240 | Tragic $44,241 |
| Samoans | 4.2 /100 | #241 | Tragic $44,206 |
| Immigrants | Venezuela | 4.0 /100 | #242 | Tragic $44,163 |
| Sub-Saharan Africans | 3.7 /100 | #243 | Tragic $44,118 |
| Immigrants | Nonimmigrants | 3.7 /100 | #244 | Tragic $44,117 |
| Immigrants | Burma/Myanmar | 3.2 /100 | #245 | Tragic $43,998 |
| Immigrants | West Indies | 3.1 /100 | #246 | Tragic $43,989 |
| Immigrants | Cabo Verde | 3.0 /100 | #247 | Tragic $43,963 |
| Nepalese | 2.6 /100 | #248 | Tragic $43,860 |
| Malaysians | 2.6 /100 | #249 | Tragic $43,844 |
| Alaska Natives | 2.3 /100 | #250 | Tragic $43,750 |
| Tsimshian | 2.1 /100 | #251 | Tragic $43,695 |
| Hawaiians | 2.0 /100 | #252 | Tragic $43,673 |
| Somalis | 1.8 /100 | #253 | Tragic $43,567 |
| Liberians | 1.7 /100 | #254 | Tragic $43,536 |
| Immigrants | Middle Africa | 1.4 /100 | #255 | Tragic $43,416 |
| Alaskan Athabascans | 1.4 /100 | #256 | Tragic $43,393 |
| Jamaicans | 1.3 /100 | #257 | Tragic $43,343 |
| French American Indians | 1.3 /100 | #258 | Tragic $43,333 |