Alaska Native vs German Russian Median Male Earnings
COMPARE
Alaska Native
German Russian
Median Male Earnings
Median Male Earnings Comparison
Alaska Natives
German Russians
$49,711
MEDIAN MALE EARNINGS
0.9/ 100
METRIC RATING
256th/ 347
METRIC RANK
$49,924
MEDIAN MALE EARNINGS
1.1/ 100
METRIC RATING
253rd/ 347
METRIC RANK
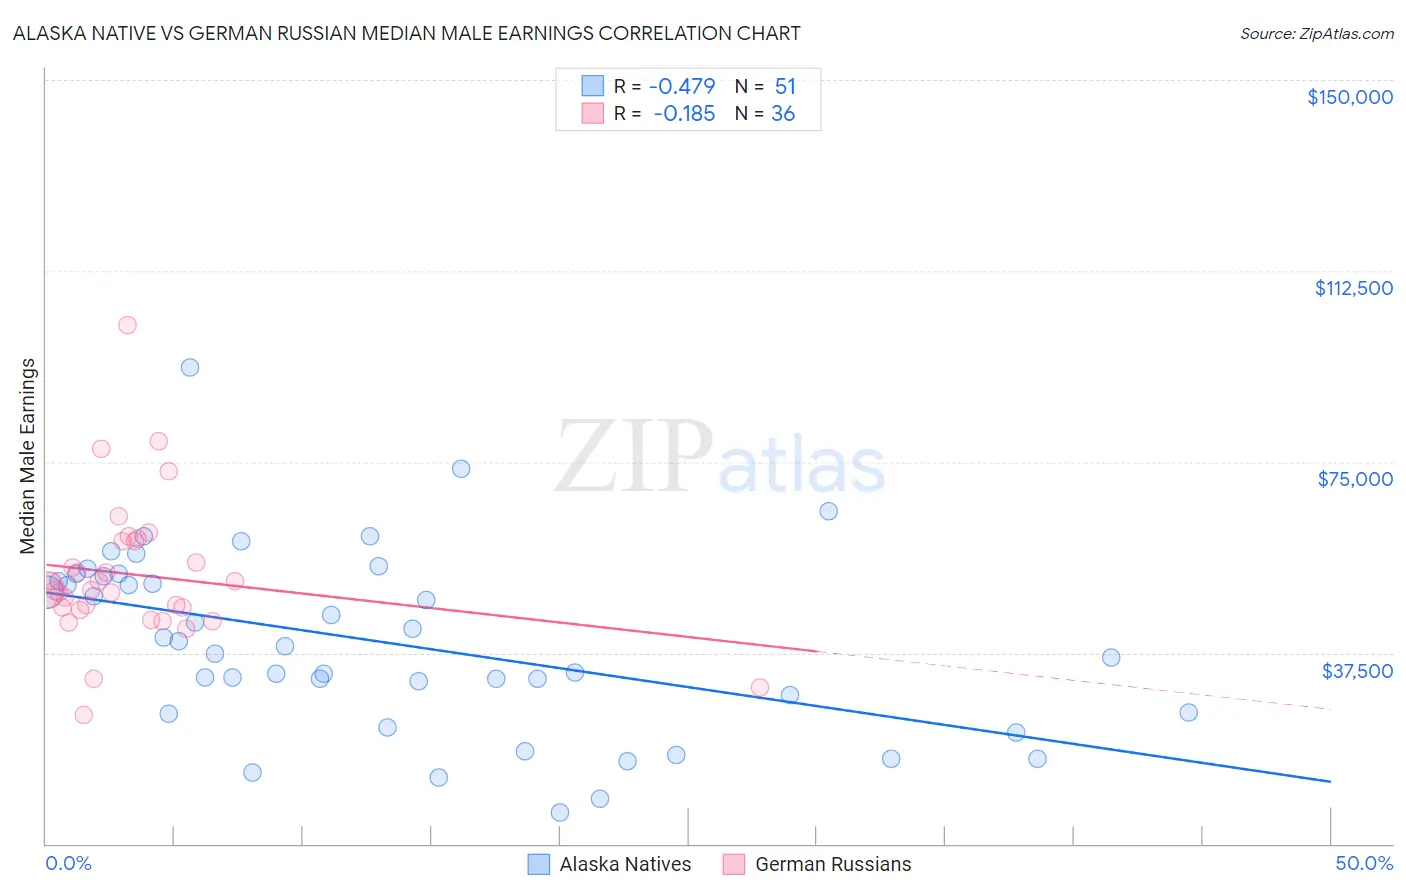
Alaska Native vs German Russian Median Male Earnings Correlation Chart
The statistical analysis conducted on geographies consisting of 76,751,910 people shows a moderate negative correlation between the proportion of Alaska Natives and median male earnings in the United States with a correlation coefficient (R) of -0.479 and weighted average of $49,711. Similarly, the statistical analysis conducted on geographies consisting of 96,455,245 people shows a poor negative correlation between the proportion of German Russians and median male earnings in the United States with a correlation coefficient (R) of -0.185 and weighted average of $49,924, a difference of 0.43%.
Median Male Earnings Correlation Summary
| Measurement | Alaska Native | German Russian |
| Minimum | $6,250 | $25,295 |
| Maximum | $93,451 | $101,964 |
| Range | $87,201 | $76,669 |
| Mean | $39,521 | $52,820 |
| Median | $38,750 | $49,866 |
| Interquartile 25% (IQ1) | $25,833 | $46,118 |
| Interquartile 75% (IQ3) | $52,440 | $59,385 |
| Interquartile Range (IQR) | $26,607 | $13,267 |
| Standard Deviation (Sample) | $17,827 | $14,069 |
| Standard Deviation (Population) | $17,652 | $13,873 |
Demographics Similar to Alaska Natives and German Russians by Median Male Earnings
In terms of median male earnings, the demographic groups most similar to Alaska Natives are Alaskan Athabascan ($49,748, a difference of 0.070%), Senegalese ($49,774, a difference of 0.13%), British West Indian ($49,636, a difference of 0.15%), Cree ($49,497, a difference of 0.43%), and Nepalese ($49,458, a difference of 0.51%). Similarly, the demographic groups most similar to German Russians are Immigrants from Cabo Verde ($50,009, a difference of 0.17%), Senegalese ($49,774, a difference of 0.30%), Alaskan Athabascan ($49,748, a difference of 0.35%), British West Indian ($49,636, a difference of 0.58%), and Immigrants from Grenada ($50,279, a difference of 0.71%).
| Demographics | Rating | Rank | Median Male Earnings |
| Houma | 2.0 /100 | #244 | Tragic $50,547 |
| Hawaiians | 1.9 /100 | #245 | Tragic $50,488 |
| Immigrants | Ecuador | 1.9 /100 | #246 | Tragic $50,474 |
| Sub-Saharan Africans | 1.8 /100 | #247 | Tragic $50,408 |
| Immigrants | Guyana | 1.6 /100 | #248 | Tragic $50,321 |
| Immigrants | Burma/Myanmar | 1.6 /100 | #249 | Tragic $50,298 |
| Osage | 1.6 /100 | #250 | Tragic $50,292 |
| Immigrants | Grenada | 1.6 /100 | #251 | Tragic $50,279 |
| Immigrants | Cabo Verde | 1.2 /100 | #252 | Tragic $50,009 |
| German Russians | 1.1 /100 | #253 | Tragic $49,924 |
| Senegalese | 1.0 /100 | #254 | Tragic $49,774 |
| Alaskan Athabascans | 0.9 /100 | #255 | Tragic $49,748 |
| Alaska Natives | 0.9 /100 | #256 | Tragic $49,711 |
| British West Indians | 0.8 /100 | #257 | Tragic $49,636 |
| Cree | 0.7 /100 | #258 | Tragic $49,497 |
| Nepalese | 0.7 /100 | #259 | Tragic $49,458 |
| Iroquois | 0.7 /100 | #260 | Tragic $49,374 |
| Liberians | 0.6 /100 | #261 | Tragic $49,318 |
| Immigrants | West Indies | 0.6 /100 | #262 | Tragic $49,271 |
| Nicaraguans | 0.6 /100 | #263 | Tragic $49,215 |
| Immigrants | Middle Africa | 0.6 /100 | #264 | Tragic $49,201 |