African vs Venezuelan Per Capita Income
COMPARE
African
Venezuelan
Per Capita Income
Per Capita Income Comparison
Africans
Venezuelans
$37,785
PER CAPITA INCOME
0.1/ 100
METRIC RATING
284th/ 347
METRIC RANK
$42,074
PER CAPITA INCOME
14.4/ 100
METRIC RATING
207th/ 347
METRIC RANK
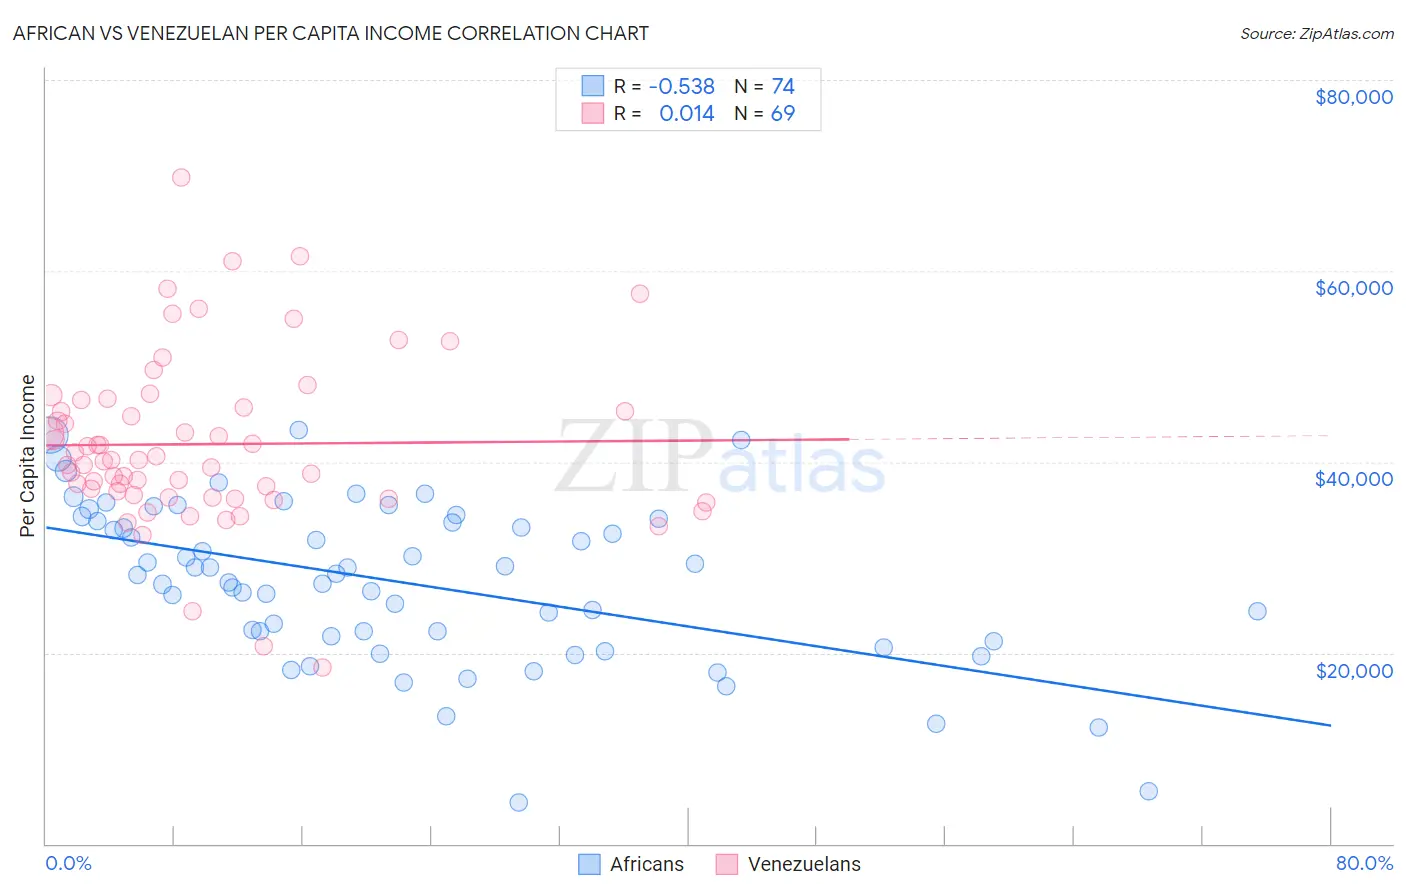
African vs Venezuelan Per Capita Income Correlation Chart
The statistical analysis conducted on geographies consisting of 470,145,104 people shows a substantial negative correlation between the proportion of Africans and per capita income in the United States with a correlation coefficient (R) of -0.538 and weighted average of $37,785. Similarly, the statistical analysis conducted on geographies consisting of 306,315,613 people shows no correlation between the proportion of Venezuelans and per capita income in the United States with a correlation coefficient (R) of 0.014 and weighted average of $42,074, a difference of 11.4%.
Per Capita Income Correlation Summary
| Measurement | African | Venezuelan |
| Minimum | $4,302 | $18,497 |
| Maximum | $43,354 | $69,728 |
| Range | $39,052 | $51,231 |
| Mean | $27,384 | $41,856 |
| Median | $28,229 | $40,215 |
| Interquartile 25% (IQ1) | $21,779 | $36,400 |
| Interquartile 75% (IQ3) | $33,791 | $46,139 |
| Interquartile Range (IQR) | $12,012 | $9,740 |
| Standard Deviation (Sample) | $8,322 | $8,927 |
| Standard Deviation (Population) | $8,265 | $8,862 |
Similar Demographics by Per Capita Income
Demographics Similar to Africans by Per Capita Income
In terms of per capita income, the demographic groups most similar to Africans are Guatemalan ($37,766, a difference of 0.050%), Pennsylvania German ($37,842, a difference of 0.15%), Immigrants from Laos ($37,857, a difference of 0.19%), Central American Indian ($37,699, a difference of 0.23%), and Dominican ($37,697, a difference of 0.24%).
| Demographics | Rating | Rank | Per Capita Income |
| Comanche | 0.2 /100 | #277 | Tragic $38,088 |
| Immigrants | Nicaragua | 0.2 /100 | #278 | Tragic $38,065 |
| Colville | 0.2 /100 | #279 | Tragic $38,047 |
| Potawatomi | 0.2 /100 | #280 | Tragic $38,046 |
| Immigrants | Dominica | 0.2 /100 | #281 | Tragic $37,952 |
| Immigrants | Laos | 0.1 /100 | #282 | Tragic $37,857 |
| Pennsylvania Germans | 0.1 /100 | #283 | Tragic $37,842 |
| Africans | 0.1 /100 | #284 | Tragic $37,785 |
| Guatemalans | 0.1 /100 | #285 | Tragic $37,766 |
| Central American Indians | 0.1 /100 | #286 | Tragic $37,699 |
| Dominicans | 0.1 /100 | #287 | Tragic $37,697 |
| Blackfeet | 0.1 /100 | #288 | Tragic $37,695 |
| U.S. Virgin Islanders | 0.1 /100 | #289 | Tragic $37,589 |
| Immigrants | Guatemala | 0.1 /100 | #290 | Tragic $37,550 |
| Cajuns | 0.1 /100 | #291 | Tragic $37,527 |
Demographics Similar to Venezuelans by Per Capita Income
In terms of per capita income, the demographic groups most similar to Venezuelans are Panamanian ($42,035, a difference of 0.090%), Ghanaian ($42,164, a difference of 0.21%), Immigrants from Sudan ($41,986, a difference of 0.21%), White/Caucasian ($42,180, a difference of 0.25%), and Ecuadorian ($41,958, a difference of 0.28%).
| Demographics | Rating | Rank | Per Capita Income |
| Vietnamese | 19.0 /100 | #200 | Poor $42,368 |
| Immigrants | Thailand | 17.6 /100 | #201 | Poor $42,289 |
| Immigrants | Bosnia and Herzegovina | 17.5 /100 | #202 | Poor $42,278 |
| Spanish | 17.0 /100 | #203 | Poor $42,249 |
| Aleuts | 16.4 /100 | #204 | Poor $42,210 |
| Whites/Caucasians | 15.9 /100 | #205 | Poor $42,180 |
| Ghanaians | 15.7 /100 | #206 | Poor $42,164 |
| Venezuelans | 14.4 /100 | #207 | Poor $42,074 |
| Panamanians | 13.9 /100 | #208 | Poor $42,035 |
| Immigrants | Sudan | 13.2 /100 | #209 | Poor $41,986 |
| Ecuadorians | 12.9 /100 | #210 | Poor $41,958 |
| Immigrants | Panama | 11.6 /100 | #211 | Poor $41,853 |
| Immigrants | Senegal | 11.3 /100 | #212 | Poor $41,830 |
| Immigrants | Venezuela | 10.2 /100 | #213 | Poor $41,727 |
| Immigrants | Bangladesh | 10.1 /100 | #214 | Poor $41,709 |