African vs Immigrants from Nigeria Householder Income Ages 45 - 64 years
COMPARE
African
Immigrants from Nigeria
Householder Income Ages 45 - 64 years
Householder Income Ages 45 - 64 years Comparison
Africans
Immigrants from Nigeria
$84,925
HOUSEHOLDER INCOME AGES 45 - 64 YEARS
0.0/ 100
METRIC RATING
298th/ 347
METRIC RANK
$94,804
HOUSEHOLDER INCOME AGES 45 - 64 YEARS
5.9/ 100
METRIC RATING
221st/ 347
METRIC RANK
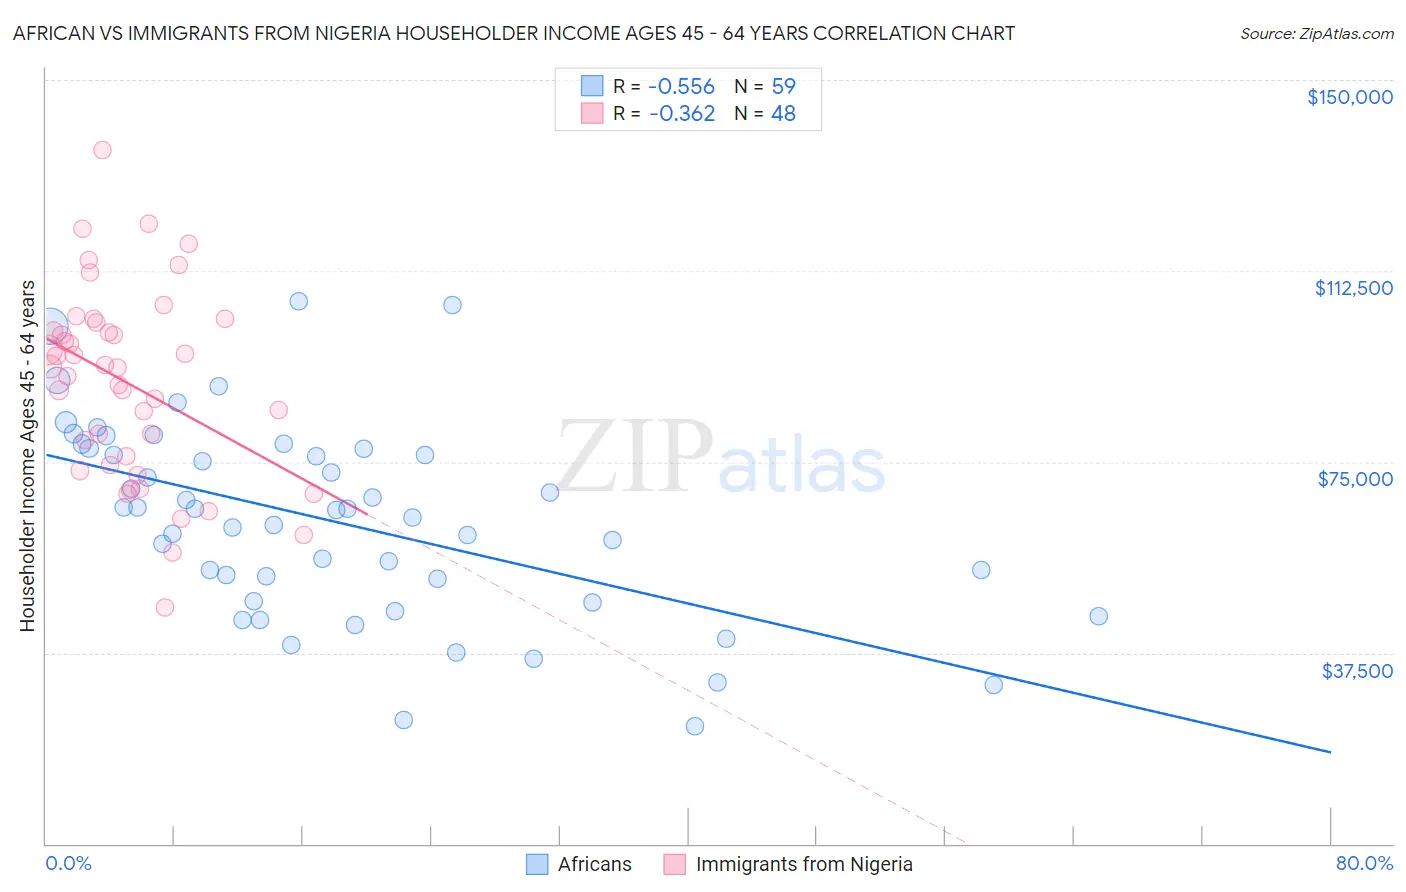
African vs Immigrants from Nigeria Householder Income Ages 45 - 64 years Correlation Chart
The statistical analysis conducted on geographies consisting of 468,468,488 people shows a substantial negative correlation between the proportion of Africans and household income with householder between the ages 45 and 64 in the United States with a correlation coefficient (R) of -0.556 and weighted average of $84,925. Similarly, the statistical analysis conducted on geographies consisting of 283,069,423 people shows a mild negative correlation between the proportion of Immigrants from Nigeria and household income with householder between the ages 45 and 64 in the United States with a correlation coefficient (R) of -0.362 and weighted average of $94,804, a difference of 11.6%.
Householder Income Ages 45 - 64 years Correlation Summary
| Measurement | African | Immigrants from Nigeria |
| Minimum | $23,133 | $46,429 |
| Maximum | $106,630 | $136,191 |
| Range | $83,497 | $89,762 |
| Mean | $63,321 | $90,499 |
| Median | $65,668 | $93,669 |
| Interquartile 25% (IQ1) | $47,695 | $75,303 |
| Interquartile 75% (IQ3) | $77,568 | $101,492 |
| Interquartile Range (IQR) | $29,873 | $26,189 |
| Standard Deviation (Sample) | $19,169 | $18,699 |
| Standard Deviation (Population) | $19,006 | $18,504 |
Similar Demographics by Householder Income Ages 45 - 64 years
Demographics Similar to Africans by Householder Income Ages 45 - 64 years
In terms of householder income ages 45 - 64 years, the demographic groups most similar to Africans are Immigrants from Mexico ($84,910, a difference of 0.020%), Indonesian ($84,890, a difference of 0.040%), Fijian ($85,187, a difference of 0.31%), Immigrants from Zaire ($85,207, a difference of 0.33%), and Potawatomi ($84,613, a difference of 0.37%).
| Demographics | Rating | Rank | Householder Income Ages 45 - 64 years |
| Hispanics or Latinos | 0.1 /100 | #291 | Tragic $86,006 |
| Immigrants | Central America | 0.1 /100 | #292 | Tragic $85,965 |
| Comanche | 0.1 /100 | #293 | Tragic $85,787 |
| British West Indians | 0.1 /100 | #294 | Tragic $85,571 |
| Immigrants | Grenada | 0.1 /100 | #295 | Tragic $85,552 |
| Immigrants | Zaire | 0.1 /100 | #296 | Tragic $85,207 |
| Fijians | 0.1 /100 | #297 | Tragic $85,187 |
| Africans | 0.0 /100 | #298 | Tragic $84,925 |
| Immigrants | Mexico | 0.0 /100 | #299 | Tragic $84,910 |
| Indonesians | 0.0 /100 | #300 | Tragic $84,890 |
| Potawatomi | 0.0 /100 | #301 | Tragic $84,613 |
| Haitians | 0.0 /100 | #302 | Tragic $84,384 |
| Hondurans | 0.0 /100 | #303 | Tragic $84,079 |
| Ottawa | 0.0 /100 | #304 | Tragic $83,953 |
| Chippewa | 0.0 /100 | #305 | Tragic $83,943 |
Demographics Similar to Immigrants from Nigeria by Householder Income Ages 45 - 64 years
In terms of householder income ages 45 - 64 years, the demographic groups most similar to Immigrants from Nigeria are Salvadoran ($94,842, a difference of 0.040%), Immigrants from Armenia ($94,863, a difference of 0.060%), Delaware ($94,914, a difference of 0.12%), Immigrants from Ghana ($94,982, a difference of 0.19%), and Malaysian ($94,517, a difference of 0.30%).
| Demographics | Rating | Rank | Householder Income Ages 45 - 64 years |
| Panamanians | 10.6 /100 | #214 | Poor $96,066 |
| Nigerians | 8.2 /100 | #215 | Tragic $95,492 |
| Immigrants | Venezuela | 7.6 /100 | #216 | Tragic $95,342 |
| Immigrants | Ghana | 6.4 /100 | #217 | Tragic $94,982 |
| Delaware | 6.2 /100 | #218 | Tragic $94,914 |
| Immigrants | Armenia | 6.1 /100 | #219 | Tragic $94,863 |
| Salvadorans | 6.0 /100 | #220 | Tragic $94,842 |
| Immigrants | Nigeria | 5.9 /100 | #221 | Tragic $94,804 |
| Malaysians | 5.2 /100 | #222 | Tragic $94,517 |
| Immigrants | Nonimmigrants | 5.0 /100 | #223 | Tragic $94,448 |
| Immigrants | Bosnia and Herzegovina | 4.6 /100 | #224 | Tragic $94,288 |
| Bermudans | 4.4 /100 | #225 | Tragic $94,197 |
| Immigrants | Azores | 4.3 /100 | #226 | Tragic $94,138 |
| Alaska Natives | 4.0 /100 | #227 | Tragic $93,991 |
| Immigrants | Panama | 3.7 /100 | #228 | Tragic $93,815 |