Afghan vs Mexican American Indian Median Earnings
COMPARE
Afghan
Mexican American Indian
Median Earnings
Median Earnings Comparison
Afghans
Mexican American Indians
$51,112
MEDIAN EARNINGS
99.9/ 100
METRIC RATING
66th/ 347
METRIC RANK
$41,719
MEDIAN EARNINGS
0.1/ 100
METRIC RATING
286th/ 347
METRIC RANK
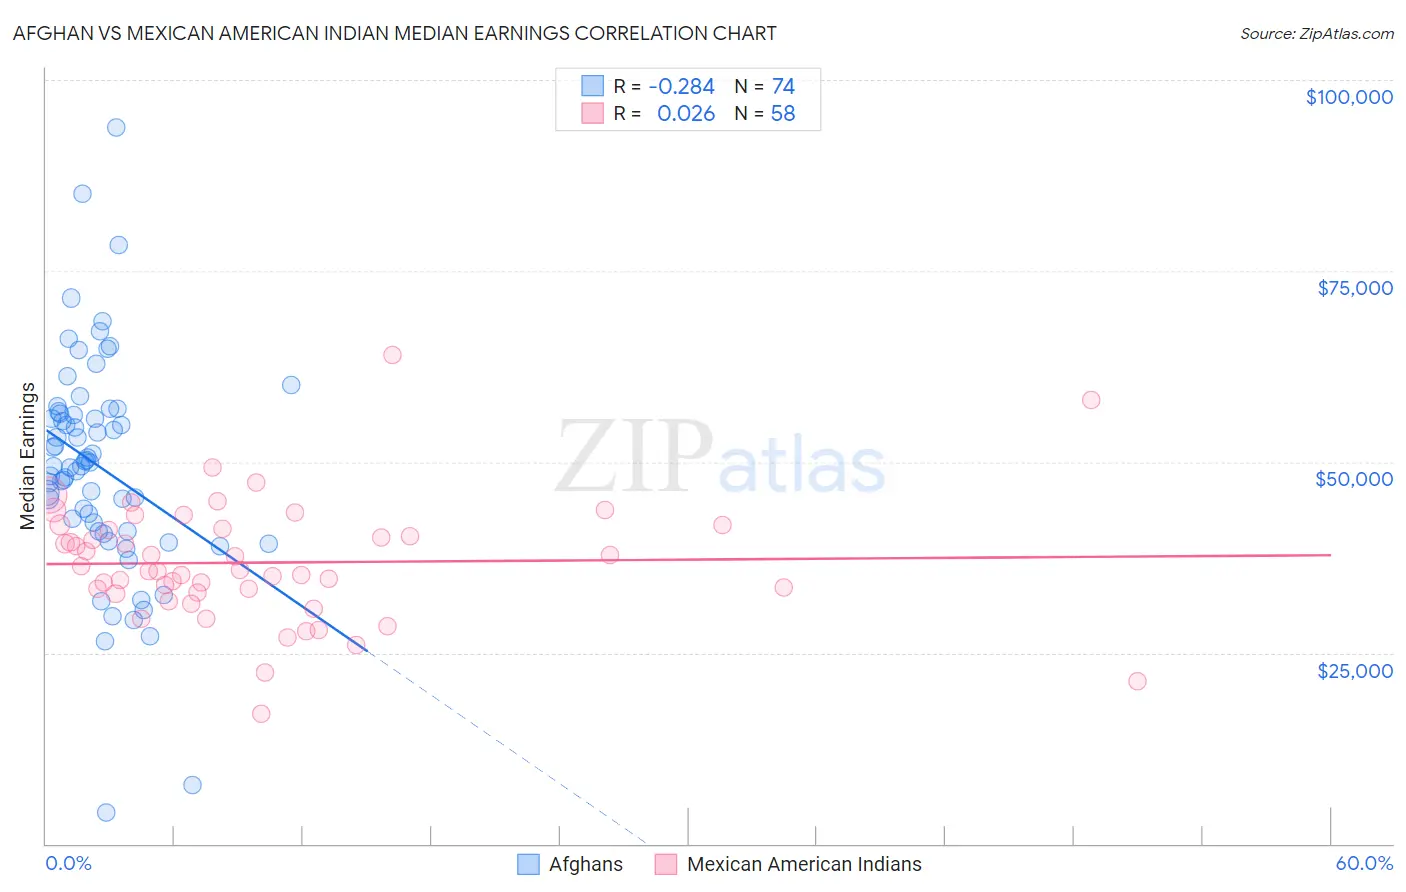
Afghan vs Mexican American Indian Median Earnings Correlation Chart
The statistical analysis conducted on geographies consisting of 148,874,377 people shows a weak negative correlation between the proportion of Afghans and median earnings in the United States with a correlation coefficient (R) of -0.284 and weighted average of $51,112. Similarly, the statistical analysis conducted on geographies consisting of 317,581,604 people shows no correlation between the proportion of Mexican American Indians and median earnings in the United States with a correlation coefficient (R) of 0.026 and weighted average of $41,719, a difference of 22.5%.
Median Earnings Correlation Summary
| Measurement | Afghan | Mexican American Indian |
| Minimum | $4,034 | $16,986 |
| Maximum | $93,750 | $63,917 |
| Range | $89,716 | $46,931 |
| Mean | $49,335 | $36,825 |
| Median | $49,670 | $35,754 |
| Interquartile 25% (IQ1) | $40,877 | $32,817 |
| Interquartile 75% (IQ3) | $56,283 | $41,197 |
| Interquartile Range (IQR) | $15,406 | $8,379 |
| Standard Deviation (Sample) | $14,513 | $7,970 |
| Standard Deviation (Population) | $14,415 | $7,901 |
Similar Demographics by Median Earnings
Demographics Similar to Afghans by Median Earnings
In terms of median earnings, the demographic groups most similar to Afghans are Immigrants from Spain ($51,092, a difference of 0.040%), Paraguayan ($51,068, a difference of 0.090%), Greek ($51,164, a difference of 0.10%), Mongolian ($51,038, a difference of 0.15%), and Lithuanian ($50,991, a difference of 0.24%).
| Demographics | Rating | Rank | Median Earnings |
| Immigrants | Croatia | 99.9 /100 | #59 | Exceptional $51,581 |
| Immigrants | Serbia | 99.9 /100 | #60 | Exceptional $51,557 |
| Immigrants | Latvia | 99.9 /100 | #61 | Exceptional $51,555 |
| Immigrants | Romania | 99.9 /100 | #62 | Exceptional $51,337 |
| Immigrants | Bulgaria | 99.9 /100 | #63 | Exceptional $51,318 |
| New Zealanders | 99.9 /100 | #64 | Exceptional $51,246 |
| Greeks | 99.9 /100 | #65 | Exceptional $51,164 |
| Afghans | 99.9 /100 | #66 | Exceptional $51,112 |
| Immigrants | Spain | 99.9 /100 | #67 | Exceptional $51,092 |
| Paraguayans | 99.9 /100 | #68 | Exceptional $51,068 |
| Mongolians | 99.8 /100 | #69 | Exceptional $51,038 |
| Lithuanians | 99.8 /100 | #70 | Exceptional $50,991 |
| Immigrants | Ukraine | 99.8 /100 | #71 | Exceptional $50,984 |
| Immigrants | Egypt | 99.8 /100 | #72 | Exceptional $50,901 |
| Immigrants | Netherlands | 99.8 /100 | #73 | Exceptional $50,818 |
Demographics Similar to Mexican American Indians by Median Earnings
In terms of median earnings, the demographic groups most similar to Mexican American Indians are Immigrants from Nicaragua ($41,737, a difference of 0.040%), Indonesian ($41,701, a difference of 0.040%), Blackfeet ($41,822, a difference of 0.25%), Dominican ($41,864, a difference of 0.35%), and Immigrants from Dominican Republic ($41,554, a difference of 0.40%).
| Demographics | Rating | Rank | Median Earnings |
| Colville | 0.2 /100 | #279 | Tragic $42,151 |
| Hmong | 0.2 /100 | #280 | Tragic $42,111 |
| Marshallese | 0.2 /100 | #281 | Tragic $41,969 |
| Africans | 0.2 /100 | #282 | Tragic $41,955 |
| Dominicans | 0.2 /100 | #283 | Tragic $41,864 |
| Blackfeet | 0.2 /100 | #284 | Tragic $41,822 |
| Immigrants | Nicaragua | 0.1 /100 | #285 | Tragic $41,737 |
| Mexican American Indians | 0.1 /100 | #286 | Tragic $41,719 |
| Indonesians | 0.1 /100 | #287 | Tragic $41,701 |
| Immigrants | Dominican Republic | 0.1 /100 | #288 | Tragic $41,554 |
| Comanche | 0.1 /100 | #289 | Tragic $41,519 |
| Paiute | 0.1 /100 | #290 | Tragic $41,508 |
| Central American Indians | 0.1 /100 | #291 | Tragic $41,474 |
| U.S. Virgin Islanders | 0.1 /100 | #292 | Tragic $41,448 |
| Immigrants | Zaire | 0.1 /100 | #293 | Tragic $41,325 |