Afghan vs Choctaw Median Female Earnings
COMPARE
Afghan
Choctaw
Median Female Earnings
Median Female Earnings Comparison
Afghans
Choctaw
$43,077
MEDIAN FEMALE EARNINGS
99.9/ 100
METRIC RATING
62nd/ 347
METRIC RANK
$33,775
MEDIAN FEMALE EARNINGS
0.0/ 100
METRIC RATING
332nd/ 347
METRIC RANK
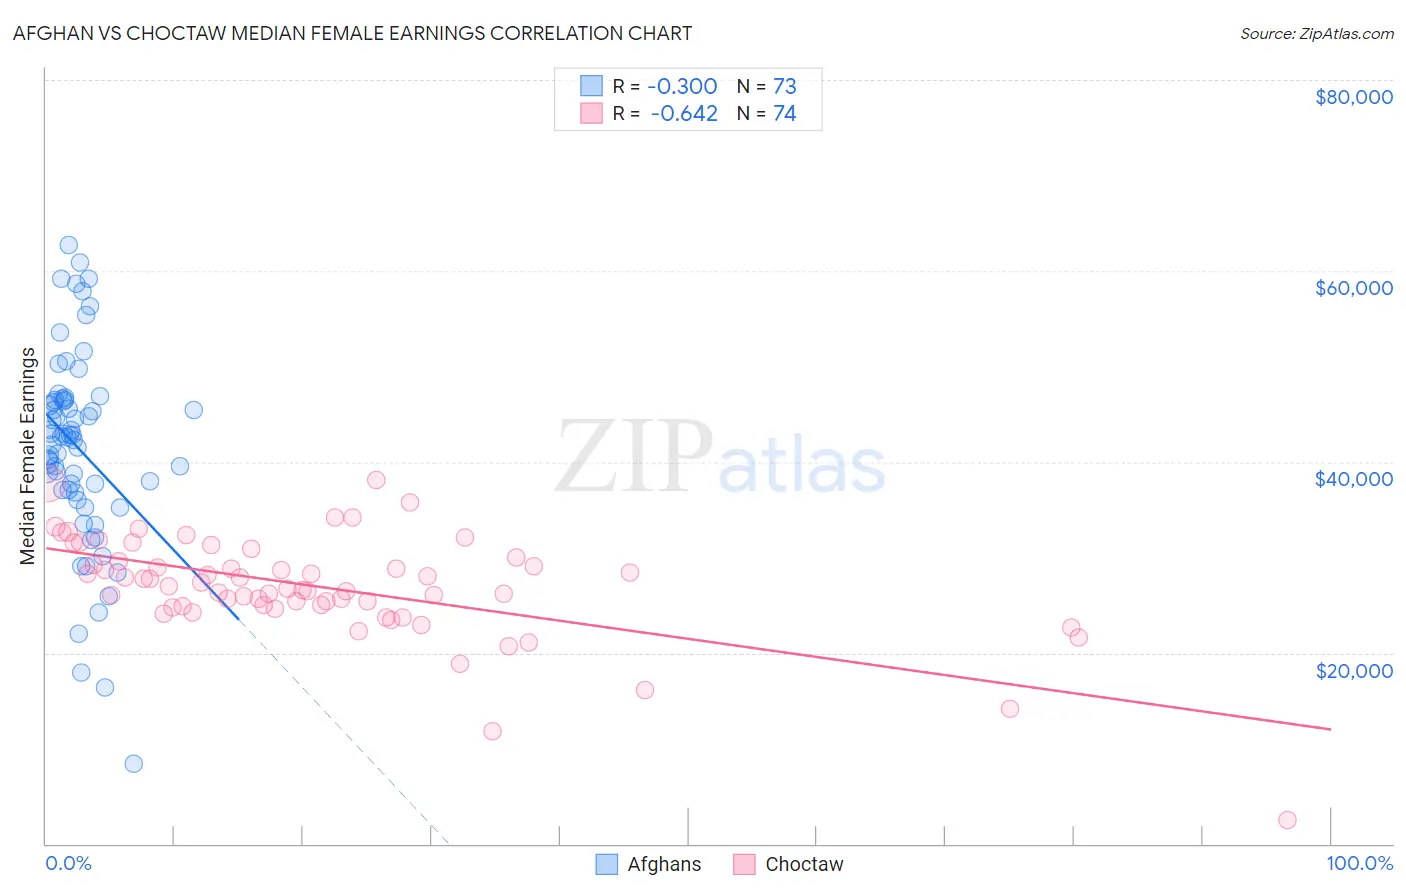
Afghan vs Choctaw Median Female Earnings Correlation Chart
The statistical analysis conducted on geographies consisting of 148,870,057 people shows a mild negative correlation between the proportion of Afghans and median female earnings in the United States with a correlation coefficient (R) of -0.300 and weighted average of $43,077. Similarly, the statistical analysis conducted on geographies consisting of 269,561,547 people shows a significant negative correlation between the proportion of Choctaw and median female earnings in the United States with a correlation coefficient (R) of -0.642 and weighted average of $33,775, a difference of 27.5%.
Median Female Earnings Correlation Summary
| Measurement | Afghan | Choctaw |
| Minimum | $8,380 | $2,499 |
| Maximum | $62,780 | $38,125 |
| Range | $54,400 | $35,626 |
| Mean | $41,426 | $26,859 |
| Median | $42,748 | $26,812 |
| Interquartile 25% (IQ1) | $36,907 | $24,870 |
| Interquartile 75% (IQ3) | $46,506 | $29,604 |
| Interquartile Range (IQR) | $9,599 | $4,734 |
| Standard Deviation (Sample) | $10,289 | $5,513 |
| Standard Deviation (Population) | $10,218 | $5,475 |
Similar Demographics by Median Female Earnings
Demographics Similar to Afghans by Median Female Earnings
In terms of median female earnings, the demographic groups most similar to Afghans are Immigrants from Bulgaria ($43,085, a difference of 0.020%), Immigrants from Ukraine ($43,069, a difference of 0.020%), Immigrants from Latvia ($43,099, a difference of 0.050%), Immigrants from Pakistan ($43,052, a difference of 0.060%), and Estonian ($43,106, a difference of 0.070%).
| Demographics | Rating | Rank | Median Female Earnings |
| Egyptians | 99.9 /100 | #55 | Exceptional $43,305 |
| Immigrants | Croatia | 99.9 /100 | #56 | Exceptional $43,258 |
| Ethiopians | 99.9 /100 | #57 | Exceptional $43,243 |
| Paraguayans | 99.9 /100 | #58 | Exceptional $43,173 |
| Estonians | 99.9 /100 | #59 | Exceptional $43,106 |
| Immigrants | Latvia | 99.9 /100 | #60 | Exceptional $43,099 |
| Immigrants | Bulgaria | 99.9 /100 | #61 | Exceptional $43,085 |
| Afghans | 99.9 /100 | #62 | Exceptional $43,077 |
| Immigrants | Ukraine | 99.9 /100 | #63 | Exceptional $43,069 |
| Immigrants | Pakistan | 99.9 /100 | #64 | Exceptional $43,052 |
| Sierra Leoneans | 99.9 /100 | #65 | Exceptional $42,868 |
| Immigrants | Norway | 99.9 /100 | #66 | Exceptional $42,837 |
| Immigrants | Egypt | 99.9 /100 | #67 | Exceptional $42,837 |
| Immigrants | Austria | 99.8 /100 | #68 | Exceptional $42,824 |
| Immigrants | Spain | 99.8 /100 | #69 | Exceptional $42,815 |
Demographics Similar to Choctaw by Median Female Earnings
In terms of median female earnings, the demographic groups most similar to Choctaw are Native/Alaskan ($33,806, a difference of 0.090%), Mexican ($33,664, a difference of 0.33%), Menominee ($33,894, a difference of 0.35%), Spanish American Indian ($33,625, a difference of 0.45%), and Hopi ($33,932, a difference of 0.46%).
| Demographics | Rating | Rank | Median Female Earnings |
| Dutch West Indians | 0.0 /100 | #325 | Tragic $34,106 |
| Kiowa | 0.0 /100 | #326 | Tragic $34,074 |
| Cajuns | 0.0 /100 | #327 | Tragic $34,034 |
| Immigrants | Central America | 0.0 /100 | #328 | Tragic $33,953 |
| Hopi | 0.0 /100 | #329 | Tragic $33,932 |
| Menominee | 0.0 /100 | #330 | Tragic $33,894 |
| Natives/Alaskans | 0.0 /100 | #331 | Tragic $33,806 |
| Choctaw | 0.0 /100 | #332 | Tragic $33,775 |
| Mexicans | 0.0 /100 | #333 | Tragic $33,664 |
| Spanish American Indians | 0.0 /100 | #334 | Tragic $33,625 |
| Creek | 0.0 /100 | #335 | Tragic $33,437 |
| Ottawa | 0.0 /100 | #336 | Tragic $33,378 |
| Yakama | 0.0 /100 | #337 | Tragic $33,354 |
| Immigrants | Cuba | 0.0 /100 | #338 | Tragic $33,291 |
| Immigrants | Mexico | 0.0 /100 | #339 | Tragic $33,236 |