Zip Codes with the Highest Percentage of Households Without a Vehicle in Valparaiso, IN
RELATED REPORTS & OPTIONS
Households without a Cars
Valparaiso
Compare Zip Codes
Map of Zip Codes with the Highest Percentage of Households Without a Vehicle in Valparaiso
1.9%
5.3%
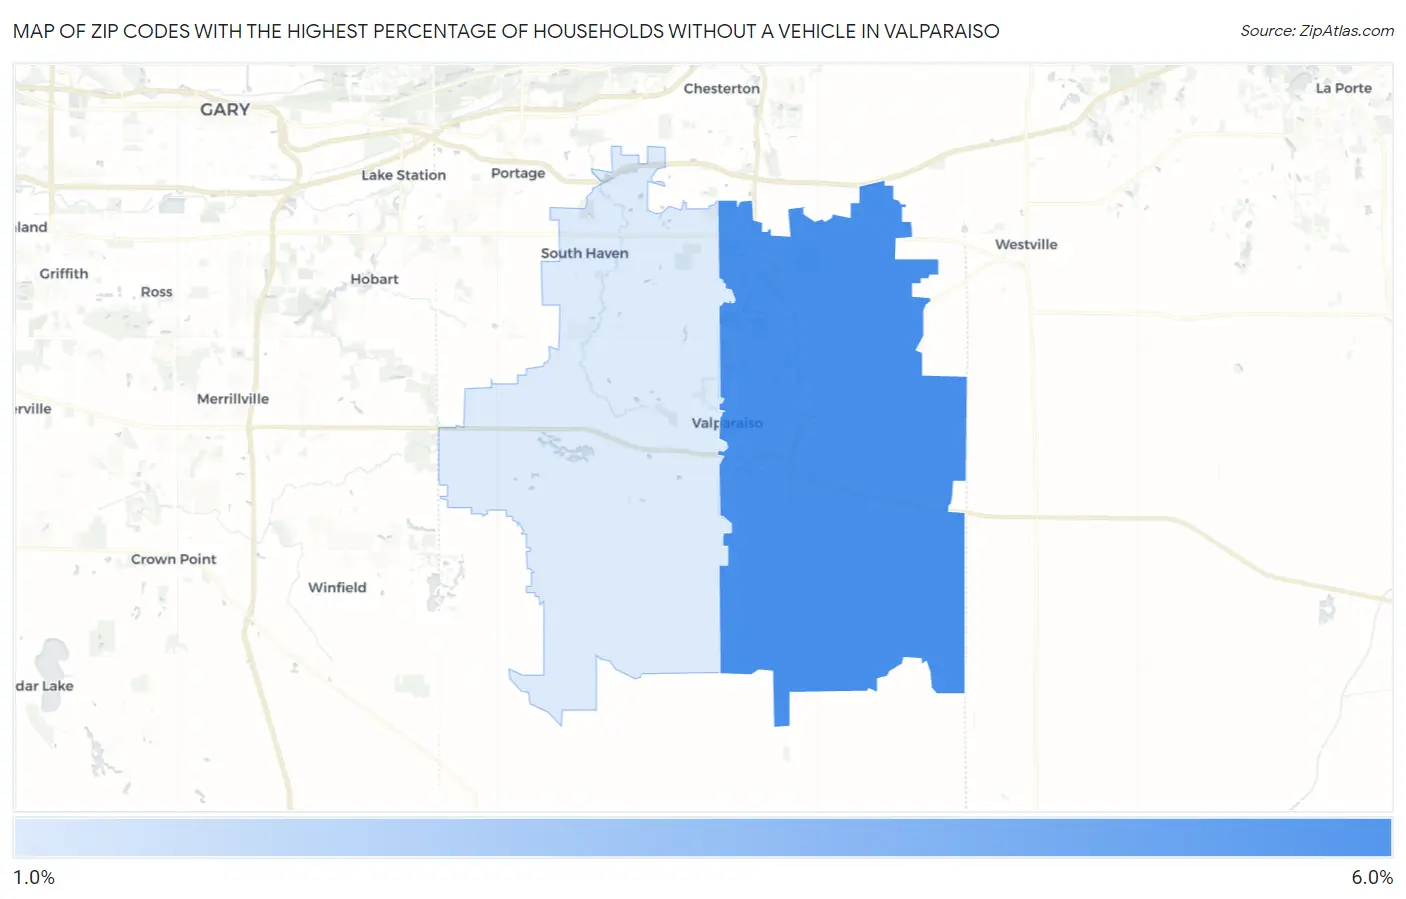
Zip Codes with the Highest Percentage of Households Without a Vehicle in Valparaiso, IN
| Zip Code | Housholds Without a Car | vs State | vs National | |
| 1. | 46383 | 5.3% | 6.2%(-0.900)#253 | 8.3%(-3.00)#12,067 |
| 2. | 46385 | 1.9% | 6.2%(-4.30)#527 | 8.3%(-6.40)#22,755 |
1
Common Questions
What are the Top Zip Codes with the Highest Percentage of Households Without a Vehicle in Valparaiso, IN?
Top Zip Codes with the Highest Percentage of Households Without a Vehicle in Valparaiso, IN are:
What zip code has the Highest Percentage of Households Without a Vehicle in Valparaiso, IN?
46383 has the Highest Percentage of Households Without a Vehicle in Valparaiso, IN with 5.3%.
What is the Percentage of Households Without a Vehicle in Valparaiso, IN?
Percentage of Households Without a Vehicle in Valparaiso is 6.1%.
What is the Percentage of Households Without a Vehicle in Indiana?
Percentage of Households Without a Vehicle in Indiana is 6.2%.
What is the Percentage of Households Without a Vehicle in the United States?
Percentage of Households Without a Vehicle in the United States is 8.3%.