Zip Codes with the Highest Percentage of Population Employed in Installation, Maintenance & Repair in Valparaiso, IN
RELATED REPORTS & OPTIONS
Installation, Maintenance & Repair
Valparaiso
Compare Zip Codes
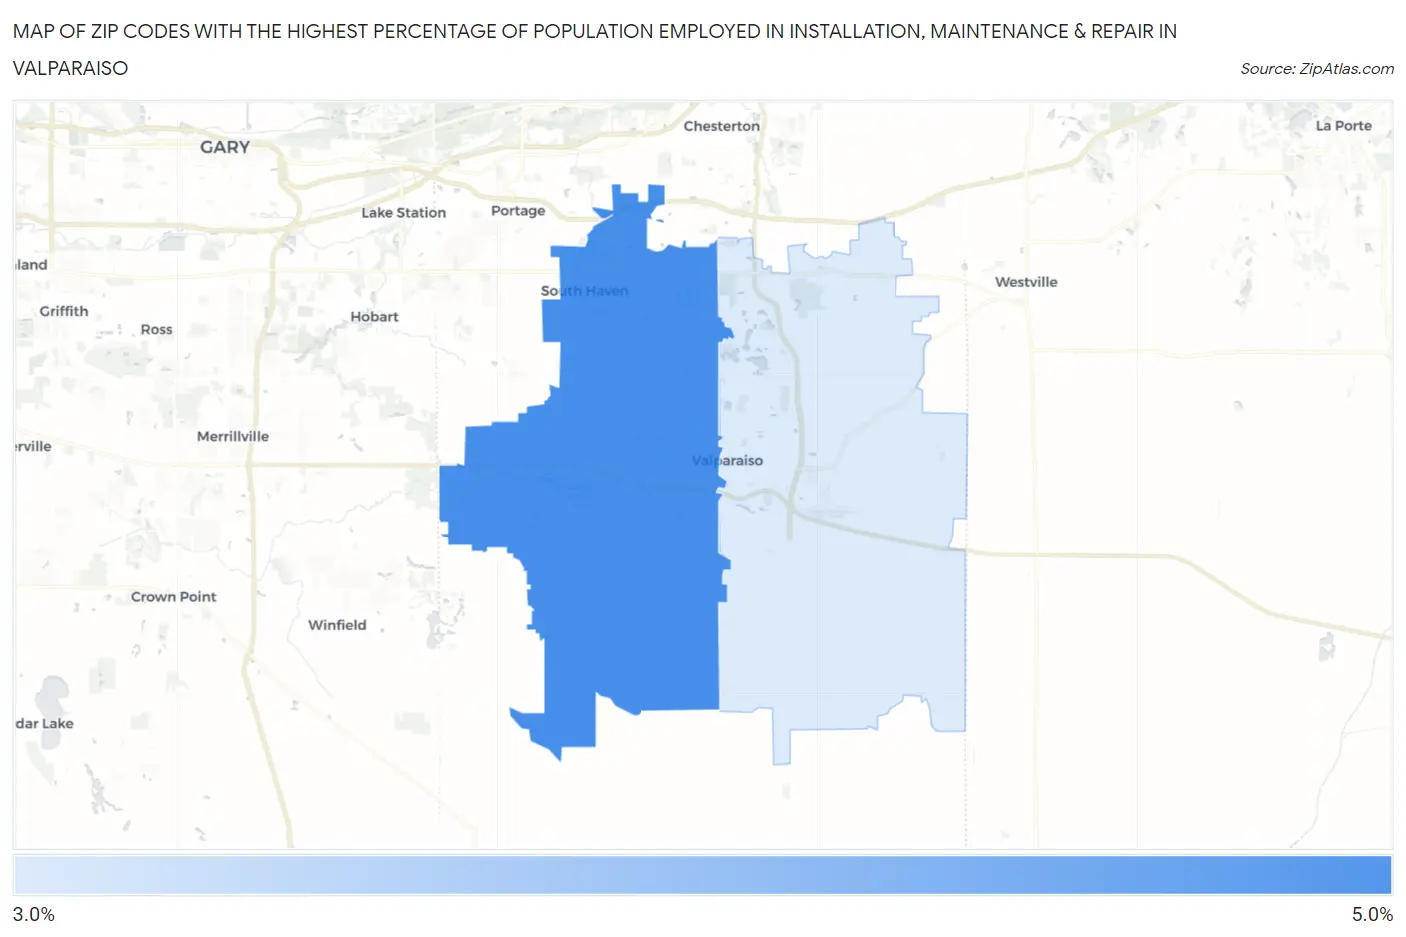
Map of Zip Codes with the Highest Percentage of Population Employed in Installation, Maintenance & Repair in Valparaiso
3.9%
4.6%
Zip Codes with the Highest Percentage of Population Employed in Installation, Maintenance & Repair in Valparaiso, IN
| Zip Code | % Employed | vs State | vs National | |
| 1. | 46385 | 4.6% | 3.5%(+1.08)#297 | 3.1%(+1.55)#9,983 |
| 2. | 46383 | 3.9% | 3.5%(+0.312)#385 | 3.1%(+0.787)#13,004 |
1
Common Questions
What are the Top Zip Codes with the Highest Percentage of Population Employed in Installation, Maintenance & Repair in Valparaiso, IN?
Top Zip Codes with the Highest Percentage of Population Employed in Installation, Maintenance & Repair in Valparaiso, IN are:
What zip code has the Highest Percentage of Population Employed in Installation, Maintenance & Repair in Valparaiso, IN?
46385 has the Highest Percentage of Population Employed in Installation, Maintenance & Repair in Valparaiso, IN with 4.6%.
What is the Percentage of Population Employed in Installation, Maintenance & Repair in Valparaiso, IN?
Percentage of Population Employed in Installation, Maintenance & Repair in Valparaiso is 2.9%.
What is the Percentage of Population Employed in Installation, Maintenance & Repair in Indiana?
Percentage of Population Employed in Installation, Maintenance & Repair in Indiana is 3.5%.
What is the Percentage of Population Employed in Installation, Maintenance & Repair in the United States?
Percentage of Population Employed in Installation, Maintenance & Repair in the United States is 3.1%.