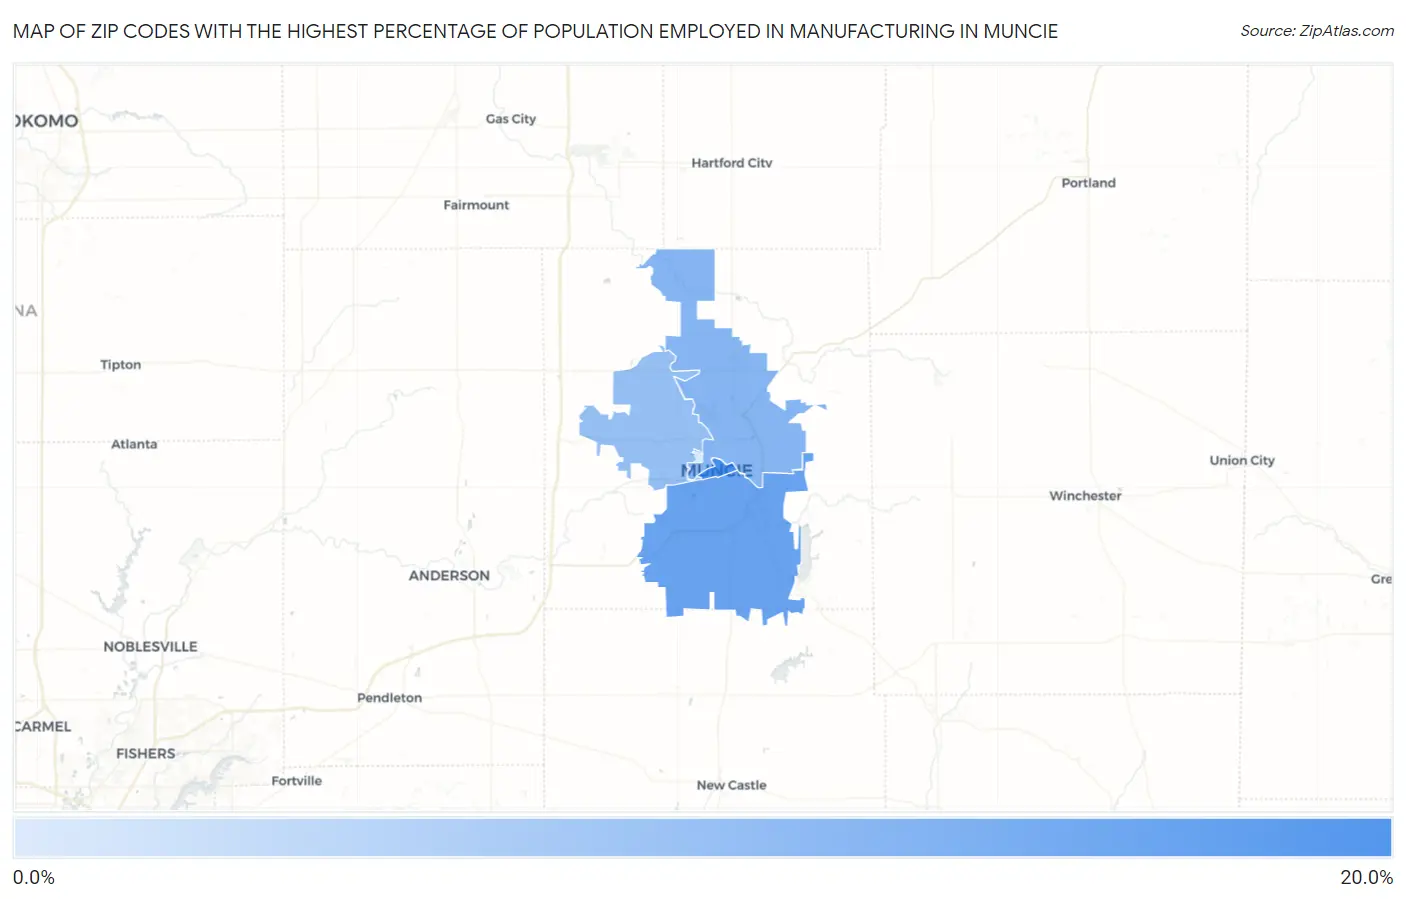
Zip Codes with the Highest Percentage of Population Employed in Manufacturing in Muncie, IN
RELATED REPORTS & OPTIONS
Manufacturing
Muncie
Compare Zip Codes
Map of Zip Codes with the Highest Percentage of Population Employed in Manufacturing in Muncie
0.0%
20.0%
Zip Codes with the Highest Percentage of Population Employed in Manufacturing in Muncie, IN
| Zip Code | % Employed | vs State | vs National | |
| 1. | 47305 | 18.6% | 18.6%(-0.062)#452 | 10.0%(+8.56)#5,863 |
| 2. | 47302 | 14.5% | 18.6%(-4.08)#573 | 10.0%(+4.54)#9,561 |
| 3. | 47303 | 10.7% | 18.6%(-7.89)#682 | 10.0%(+0.730)#14,592 |
| 4. | 47304 | 8.9% | 18.6%(-9.68)#716 | 10.0%(-1.06)#17,551 |
| 5. | 47306 | 0.62% | 18.6%(-18.0)#748 | 10.0%(-9.38)#29,373 |
1
Common Questions
What are the Top 3 Zip Codes with the Highest Percentage of Population Employed in Manufacturing in Muncie, IN?
Top 3 Zip Codes with the Highest Percentage of Population Employed in Manufacturing in Muncie, IN are:
What zip code has the Highest Percentage of Population Employed in Manufacturing in Muncie, IN?
47305 has the Highest Percentage of Population Employed in Manufacturing in Muncie, IN with 18.6%.
What is the Percentage of Population Employed in Manufacturing in Muncie, IN?
Percentage of Population Employed in Manufacturing in Muncie is 9.9%.
What is the Percentage of Population Employed in Manufacturing in Indiana?
Percentage of Population Employed in Manufacturing in Indiana is 18.6%.
What is the Percentage of Population Employed in Manufacturing in the United States?
Percentage of Population Employed in Manufacturing in the United States is 10.0%.