Zip Codes with the Highest Percentage of Population Employed in Arts, Entertainment & Recreation in Nampa, ID
RELATED REPORTS & OPTIONS
Arts, Entertainment & Recreation
Nampa
Compare Zip Codes
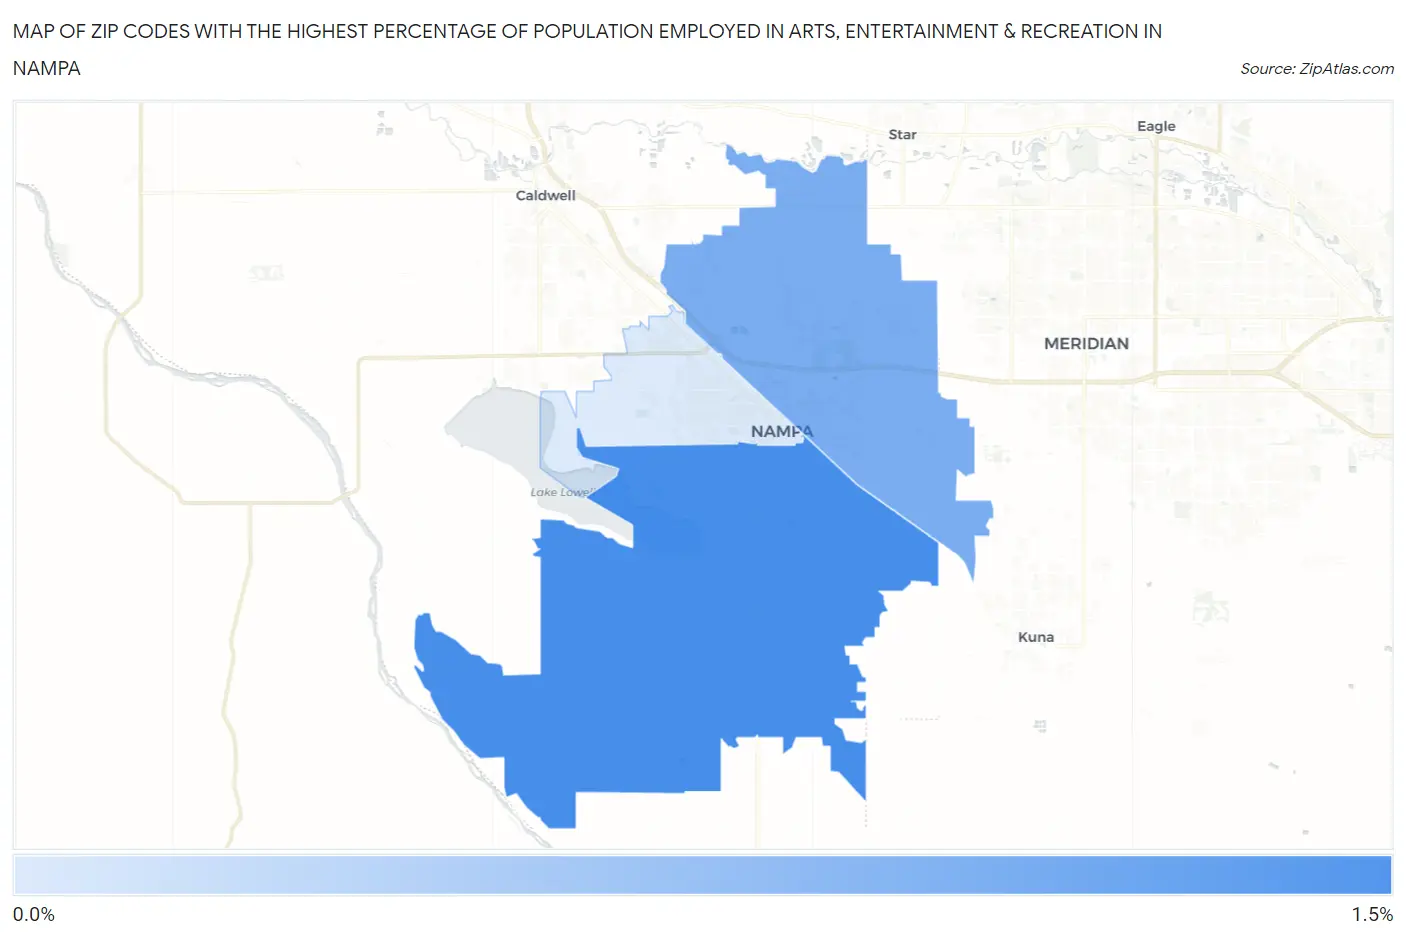
Map of Zip Codes with the Highest Percentage of Population Employed in Arts, Entertainment & Recreation in Nampa
0.0%
1.5%
Zip Codes with the Highest Percentage of Population Employed in Arts, Entertainment & Recreation in Nampa, ID
| Zip Code | % Employed | vs State | vs National | |
| 1. | 83686 | 1.3% | 1.8%(-0.443)#110 | 2.1%(-0.738)#14,408 |
| 2. | 83687 | 0.96% | 1.8%(-0.824)#132 | 2.1%(-1.12)#17,224 |
| 3. | 83651 | 0.21% | 1.8%(-1.57)#169 | 2.1%(-1.87)#22,127 |
1
Common Questions
What are the Top Zip Codes with the Highest Percentage of Population Employed in Arts, Entertainment & Recreation in Nampa, ID?
Top Zip Codes with the Highest Percentage of Population Employed in Arts, Entertainment & Recreation in Nampa, ID are:
What zip code has the Highest Percentage of Population Employed in Arts, Entertainment & Recreation in Nampa, ID?
83686 has the Highest Percentage of Population Employed in Arts, Entertainment & Recreation in Nampa, ID with 1.3%.
What is the Percentage of Population Employed in Arts, Entertainment & Recreation in Nampa, ID?
Percentage of Population Employed in Arts, Entertainment & Recreation in Nampa is 0.77%.
What is the Percentage of Population Employed in Arts, Entertainment & Recreation in Idaho?
Percentage of Population Employed in Arts, Entertainment & Recreation in Idaho is 1.8%.
What is the Percentage of Population Employed in Arts, Entertainment & Recreation in the United States?
Percentage of Population Employed in Arts, Entertainment & Recreation in the United States is 2.1%.