Zip Codes with the Highest Percentage of Population Employed in Food Preparation & Serving in Caldwell, ID
RELATED REPORTS & OPTIONS
Food Preparation & Serving
Caldwell
Compare Zip Codes
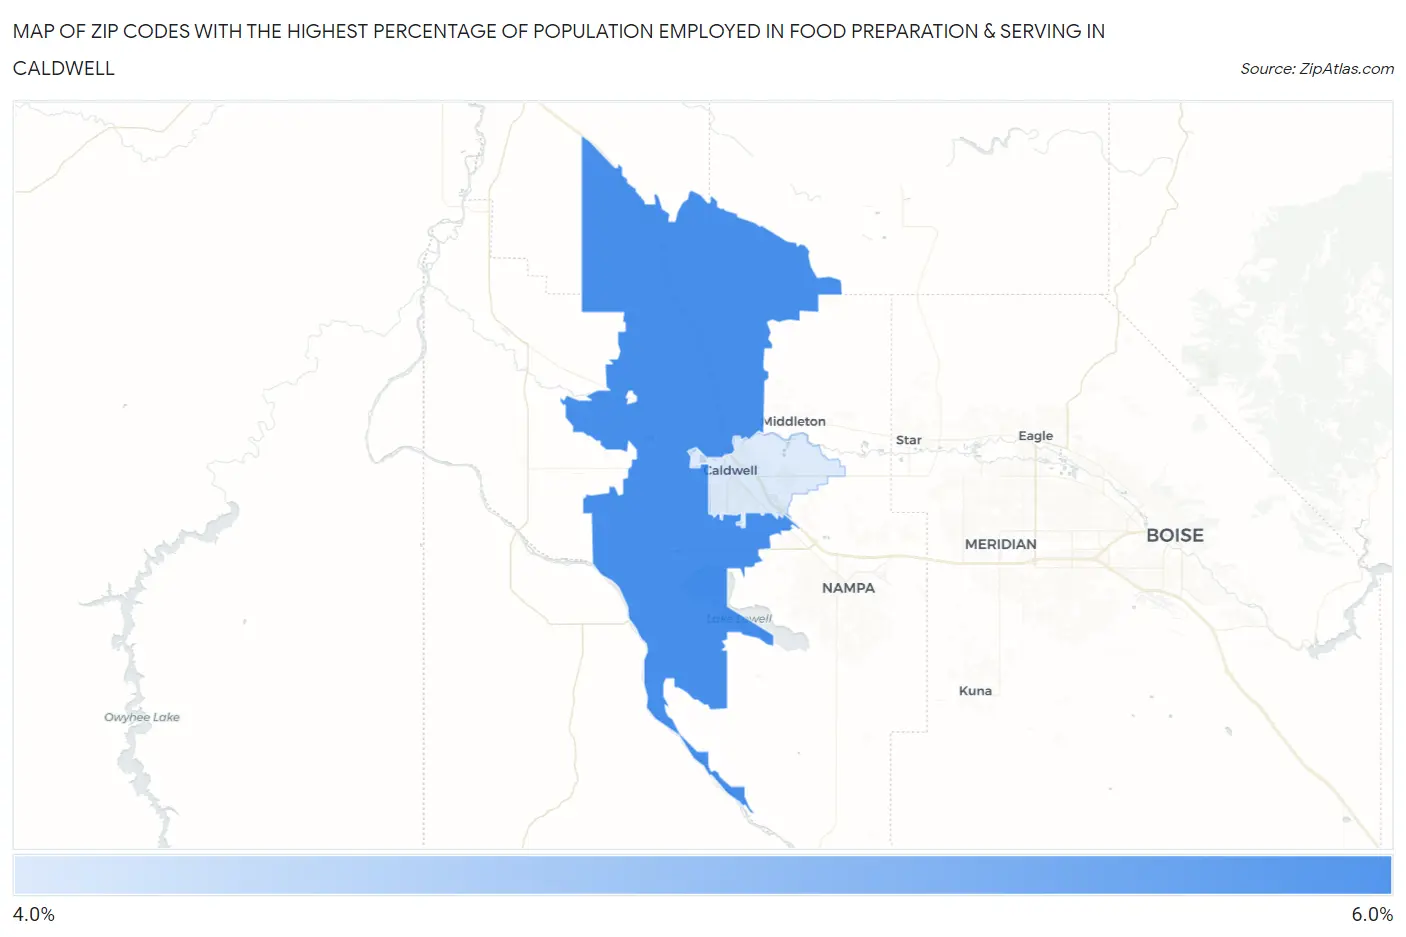
Map of Zip Codes with the Highest Percentage of Population Employed in Food Preparation & Serving in Caldwell
4.6%
5.1%
Zip Codes with the Highest Percentage of Population Employed in Food Preparation & Serving in Caldwell, ID
| Zip Code | % Employed | vs State | vs National | |
| 1. | 83607 | 5.1% | 5.7%(-0.613)#100 | 5.3%(-0.226)#12,688 |
| 2. | 83605 | 4.6% | 5.7%(-1.08)#123 | 5.3%(-0.696)#14,643 |
1
Common Questions
What are the Top Zip Codes with the Highest Percentage of Population Employed in Food Preparation & Serving in Caldwell, ID?
Top Zip Codes with the Highest Percentage of Population Employed in Food Preparation & Serving in Caldwell, ID are:
What zip code has the Highest Percentage of Population Employed in Food Preparation & Serving in Caldwell, ID?
83607 has the Highest Percentage of Population Employed in Food Preparation & Serving in Caldwell, ID with 5.1%.
What is the Percentage of Population Employed in Food Preparation & Serving in Caldwell, ID?
Percentage of Population Employed in Food Preparation & Serving in Caldwell is 5.5%.
What is the Percentage of Population Employed in Food Preparation & Serving in Idaho?
Percentage of Population Employed in Food Preparation & Serving in Idaho is 5.7%.
What is the Percentage of Population Employed in Food Preparation & Serving in the United States?
Percentage of Population Employed in Food Preparation & Serving in the United States is 5.3%.