Westside, IA Map & Demographics
Westside Map
Westside Overview
$38,535
PER CAPITA INCOME
$99,375
AVG FAMILY INCOME
$61,563
AVG HOUSEHOLD INCOME
1.2%
WAGE / INCOME GAP [ % ]
98.8¢/ $1
WAGE / INCOME GAP [ $ ]
0.40
INEQUALITY / GINI INDEX
296
TOTAL POPULATION
152
MALE POPULATION
144
FEMALE POPULATION
105.56
MALES / 100 FEMALES
94.74
FEMALES / 100 MALES
45.5
MEDIAN AGE
2.6
AVG FAMILY SIZE
2.0
AVG HOUSEHOLD SIZE
153
LABOR FORCE [ PEOPLE ]
65.9%
PERCENT IN LABOR FORCE
Westside Zip Codes
Westside Area Codes
Income in Westside
Income Overview in Westside
Per Capita Income in Westside is $38,535, while median incomes of families and households are $99,375 and $61,563 respectively.
| Characteristic | Number | Measure |
| Per Capita Income | 296 | $38,535 |
| Median Family Income | 87 | $99,375 |
| Mean Family Income | 87 | $101,841 |
| Median Household Income | 147 | $61,563 |
| Mean Household Income | 147 | $79,363 |
| Income Deficit | 87 | $0 |
| Wage / Income Gap (%) | 296 | 1.22% |
| Wage / Income Gap ($) | 296 | 98.78¢ per $1 |
| Gini / Inequality Index | 296 | 0.40 |
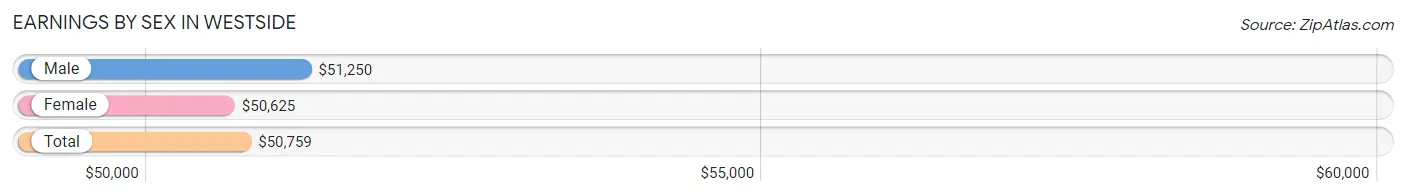
Earnings by Sex in Westside
Average Earnings in Westside are $50,759, $51,250 for men and $50,625 for women, a difference of 1.2%.
| Sex | Number | Average Earnings |
| Male | 84 (52.8%) | $51,250 |
| Female | 75 (47.2%) | $50,625 |
| Total | 159 (100.0%) | $50,759 |
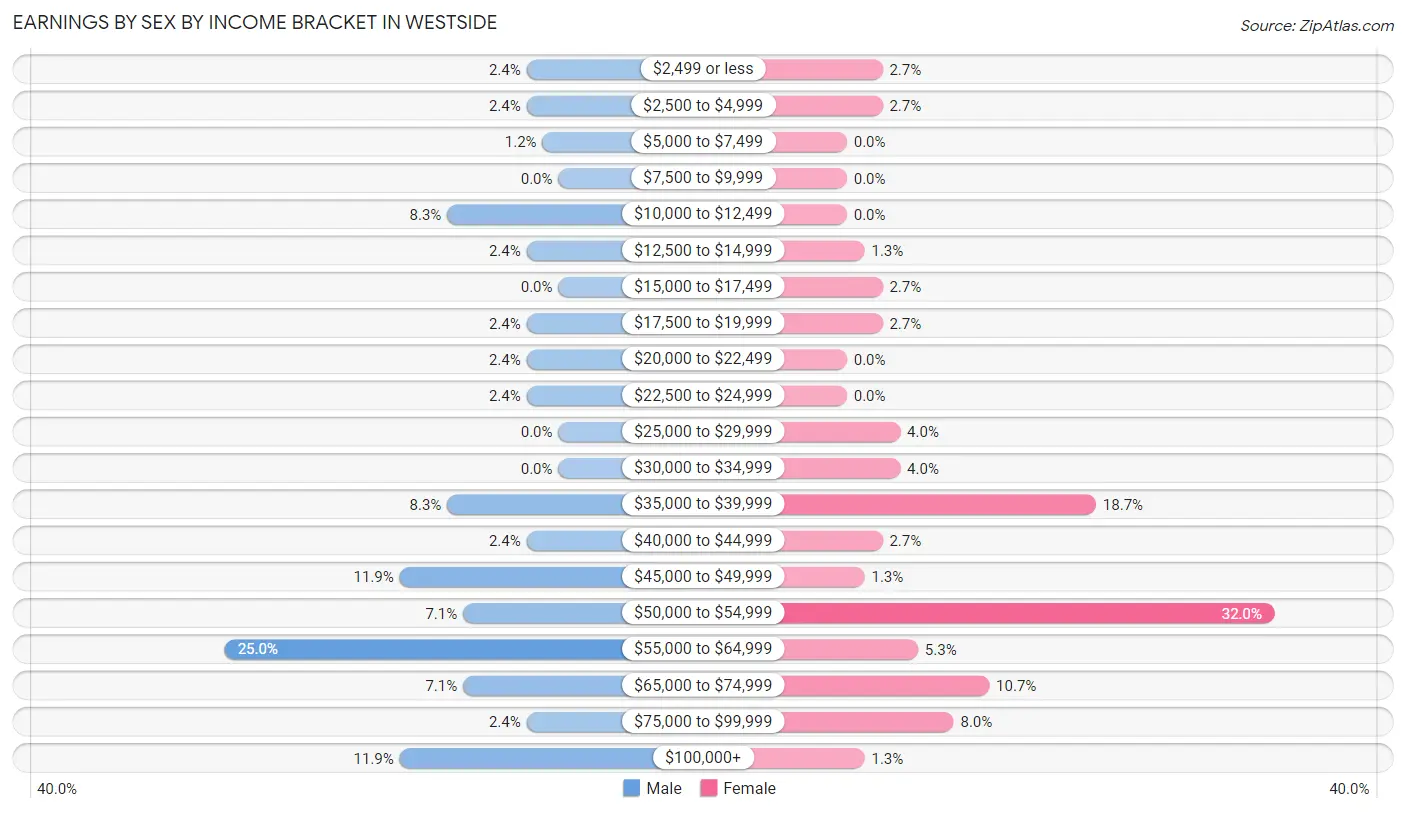
Earnings by Sex by Income Bracket in Westside
The most common earnings brackets in Westside are $55,000 to $64,999 for men (21 | 25.0%) and $50,000 to $54,999 for women (24 | 32.0%).
| Income | Male | Female |
| $2,499 or less | 2 (2.4%) | 2 (2.7%) |
| $2,500 to $4,999 | 2 (2.4%) | 2 (2.7%) |
| $5,000 to $7,499 | 1 (1.2%) | 0 (0.0%) |
| $7,500 to $9,999 | 0 (0.0%) | 0 (0.0%) |
| $10,000 to $12,499 | 7 (8.3%) | 0 (0.0%) |
| $12,500 to $14,999 | 2 (2.4%) | 1 (1.3%) |
| $15,000 to $17,499 | 0 (0.0%) | 2 (2.7%) |
| $17,500 to $19,999 | 2 (2.4%) | 2 (2.7%) |
| $20,000 to $22,499 | 2 (2.4%) | 0 (0.0%) |
| $22,500 to $24,999 | 2 (2.4%) | 0 (0.0%) |
| $25,000 to $29,999 | 0 (0.0%) | 3 (4.0%) |
| $30,000 to $34,999 | 0 (0.0%) | 3 (4.0%) |
| $35,000 to $39,999 | 7 (8.3%) | 14 (18.7%) |
| $40,000 to $44,999 | 2 (2.4%) | 2 (2.7%) |
| $45,000 to $49,999 | 10 (11.9%) | 1 (1.3%) |
| $50,000 to $54,999 | 6 (7.1%) | 24 (32.0%) |
| $55,000 to $64,999 | 21 (25.0%) | 4 (5.3%) |
| $65,000 to $74,999 | 6 (7.1%) | 8 (10.7%) |
| $75,000 to $99,999 | 2 (2.4%) | 6 (8.0%) |
| $100,000+ | 10 (11.9%) | 1 (1.3%) |
| Total | 84 (100.0%) | 75 (100.0%) |
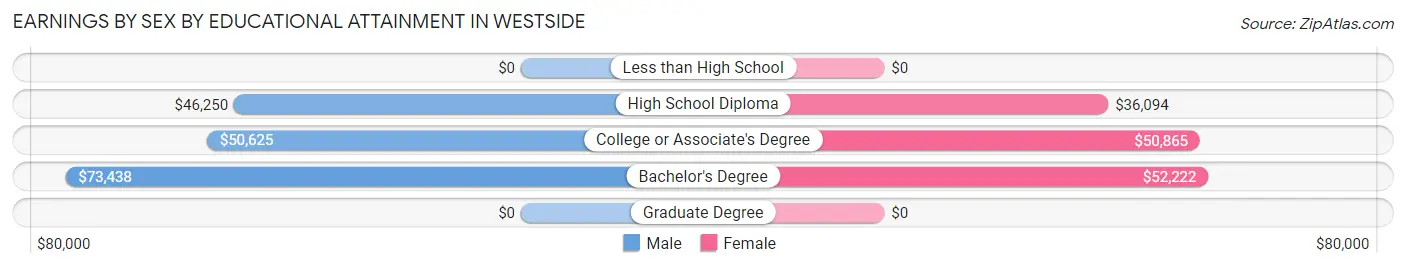
Earnings by Sex by Educational Attainment in Westside
Average earnings in Westside are $55,156 for men and $50,625 for women, a difference of 8.2%. Men with an educational attainment of bachelor's degree enjoy the highest average annual earnings of $73,438, while those with high school diploma education earn the least with $46,250. Women with an educational attainment of bachelor's degree earn the most with the average annual earnings of $52,222, while those with high school diploma education have the smallest earnings of $36,094.
| Educational Attainment | Male Income | Female Income |
| Less than High School | - | - |
| High School Diploma | $46,250 | $36,094 |
| College or Associate's Degree | $50,625 | $50,865 |
| Bachelor's Degree | $73,438 | $52,222 |
| Graduate Degree | - | - |
| Total | $55,156 | $50,625 |
Family Income in Westside
Family Income Brackets in Westside
According to the Westside family income data, there are 32 families falling into the $100,000 to $149,999 income range, which is the most common income bracket and makes up 36.8% of all families.
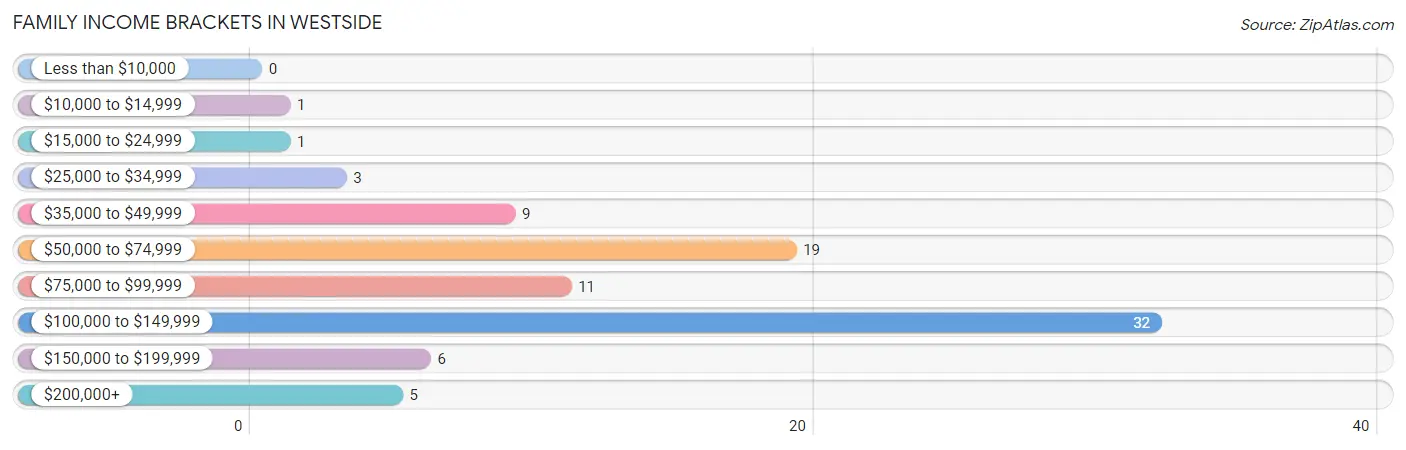
| Income Bracket | # Families | % Families |
| Less than $10,000 | 0 | 0.0% |
| $10,000 to $14,999 | 1 | 1.1% |
| $15,000 to $24,999 | 1 | 1.1% |
| $25,000 to $34,999 | 3 | 3.4% |
| $35,000 to $49,999 | 9 | 10.3% |
| $50,000 to $74,999 | 19 | 21.8% |
| $75,000 to $99,999 | 11 | 12.6% |
| $100,000 to $149,999 | 32 | 36.8% |
| $150,000 to $199,999 | 6 | 6.9% |
| $200,000+ | 5 | 5.7% |
Family Income by Famaliy Size in Westside
4-person families (10 | 11.5%) account for the highest median family income in Westside with $124,375 per family, while 3-person families (25 | 28.7%) have the highest median income of $35,288 per family member.
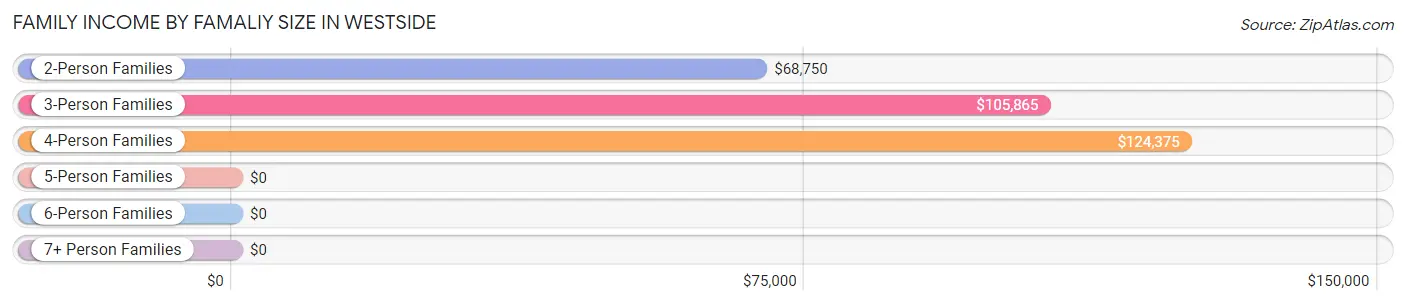
| Income Bracket | # Families | Median Income |
| 2-Person Families | 46 (52.9%) | $68,750 |
| 3-Person Families | 25 (28.7%) | $105,865 |
| 4-Person Families | 10 (11.5%) | $124,375 |
| 5-Person Families | 6 (6.9%) | $0 |
| 6-Person Families | 0 (0.0%) | $0 |
| 7+ Person Families | 0 (0.0%) | $0 |
| Total | 87 (100.0%) | $99,375 |
Family Income by Number of Earners in Westside
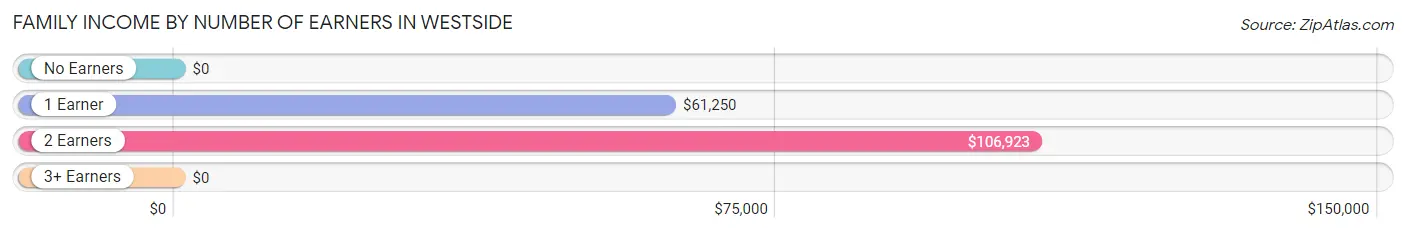
| Number of Earners | # Families | Median Income |
| No Earners | 8 (9.2%) | $0 |
| 1 Earner | 30 (34.5%) | $61,250 |
| 2 Earners | 44 (50.6%) | $106,923 |
| 3+ Earners | 5 (5.8%) | $0 |
| Total | 87 (100.0%) | $99,375 |
Household Income in Westside
Household Income Brackets in Westside
With 42 households falling in the category, the $100,000 to $149,999 income range is the most frequent in Westside, accounting for 28.6% of all households. In contrast, only 4 households (2.7%) fall into the less than $10,000 income bracket, making it the least populous group.
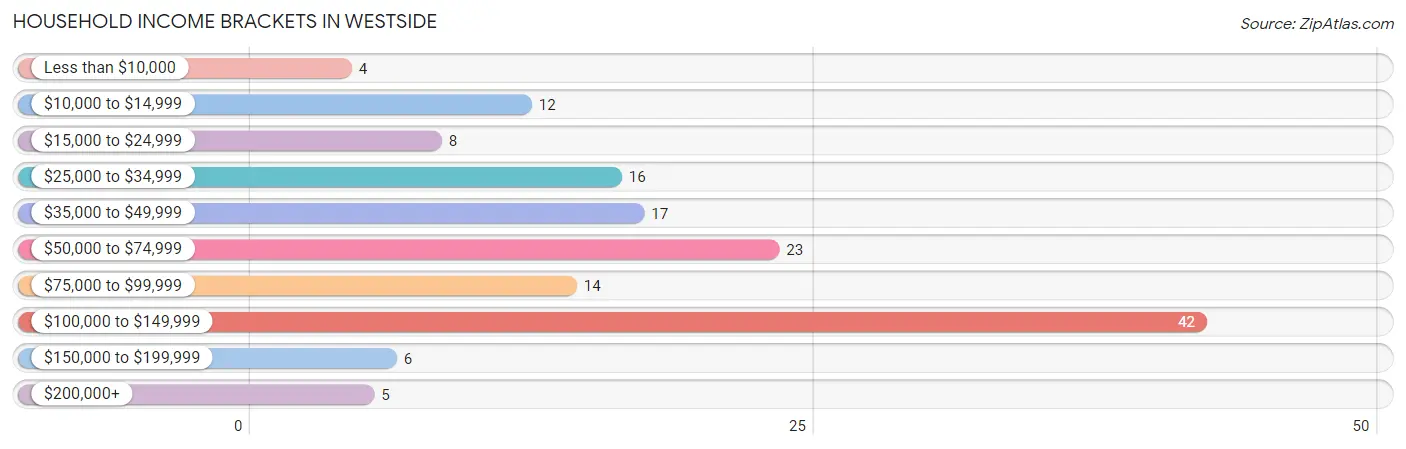
| Income Bracket | # Households | % Households |
| Less than $10,000 | 4 | 2.7% |
| $10,000 to $14,999 | 12 | 8.2% |
| $15,000 to $24,999 | 8 | 5.4% |
| $25,000 to $34,999 | 16 | 10.9% |
| $35,000 to $49,999 | 17 | 11.6% |
| $50,000 to $74,999 | 23 | 15.6% |
| $75,000 to $99,999 | 14 | 9.5% |
| $100,000 to $149,999 | 42 | 28.6% |
| $150,000 to $199,999 | 6 | 4.1% |
| $200,000+ | 5 | 3.4% |
Household Income by Householder Age in Westside
The median household income in Westside is $61,563, with the highest median household income of $110,938 found in the 25 to 44 years age bracket for the primary householder. A total of 31 households (21.1%) fall into this category. Meanwhile, the 15 to 24 years age bracket for the primary householder has the lowest median household income of $0, with 2 households (1.4%) in this group.
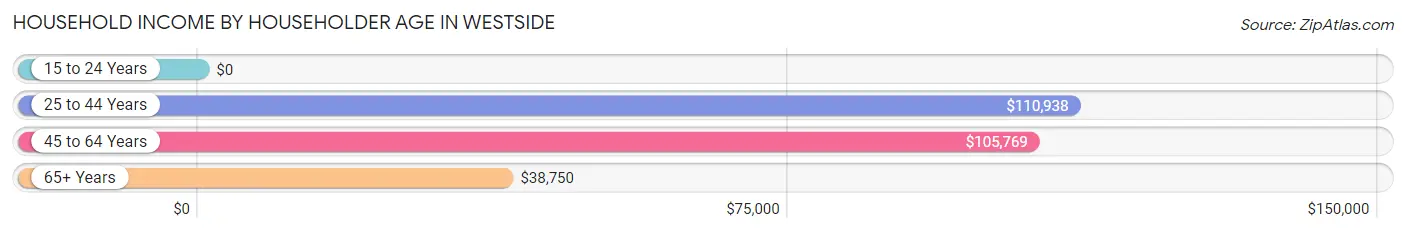
| Income Bracket | # Households | Median Income |
| 15 to 24 Years | 2 (1.4%) | $0 |
| 25 to 44 Years | 31 (21.1%) | $110,938 |
| 45 to 64 Years | 42 (28.6%) | $105,769 |
| 65+ Years | 72 (49.0%) | $38,750 |
| Total | 147 (100.0%) | $61,563 |
Poverty in Westside
Income Below Poverty by Sex and Age in Westside
With 1.3% poverty level for males and 4.2% for females among the residents of Westside, 55 to 64 year old males and 75 year old and over females are the most vulnerable to poverty, with 2 males (11.1%) and 3 females (9.4%) in their respective age groups living below the poverty level.
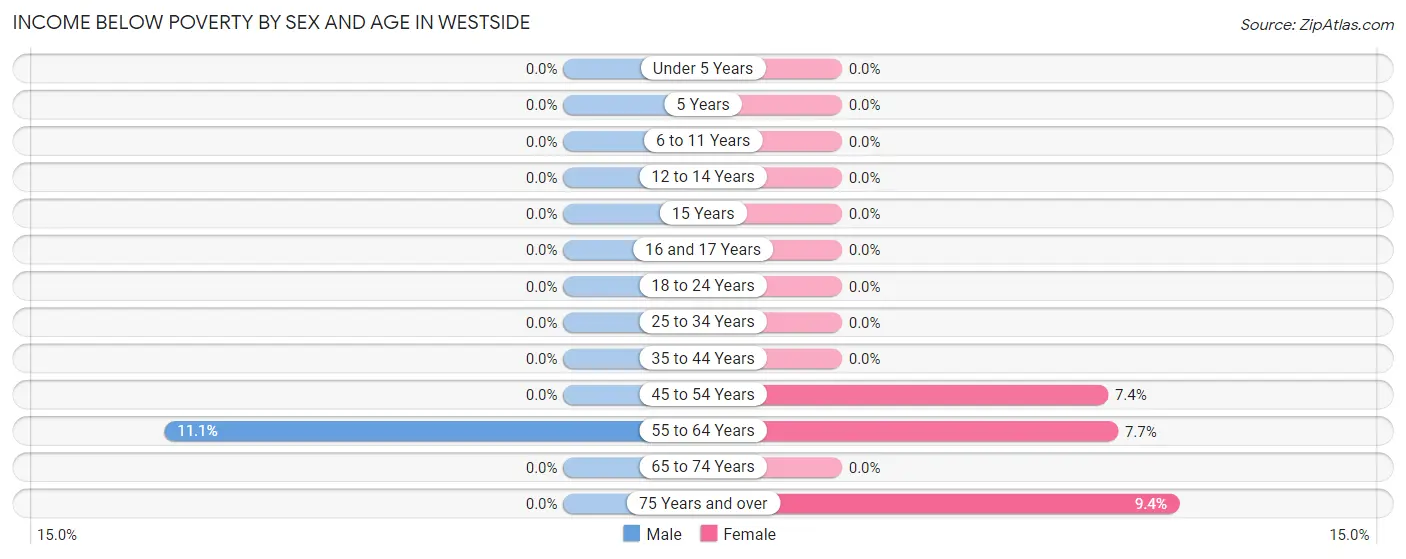
| Age Bracket | Male | Female |
| Under 5 Years | 0 (0.0%) | 0 (0.0%) |
| 5 Years | 0 (0.0%) | 0 (0.0%) |
| 6 to 11 Years | 0 (0.0%) | 0 (0.0%) |
| 12 to 14 Years | 0 (0.0%) | 0 (0.0%) |
| 15 Years | 0 (0.0%) | 0 (0.0%) |
| 16 and 17 Years | 0 (0.0%) | 0 (0.0%) |
| 18 to 24 Years | 0 (0.0%) | 0 (0.0%) |
| 25 to 34 Years | 0 (0.0%) | 0 (0.0%) |
| 35 to 44 Years | 0 (0.0%) | 0 (0.0%) |
| 45 to 54 Years | 0 (0.0%) | 2 (7.4%) |
| 55 to 64 Years | 2 (11.1%) | 1 (7.7%) |
| 65 to 74 Years | 0 (0.0%) | 0 (0.0%) |
| 75 Years and over | 0 (0.0%) | 3 (9.4%) |
| Total | 2 (1.3%) | 6 (4.2%) |
Income Above Poverty by Sex and Age in Westside
According to the poverty statistics in Westside, males aged under 5 years and females aged under 5 years are the age groups that are most secure financially, with 100.0% of males and 100.0% of females in these age groups living above the poverty line.
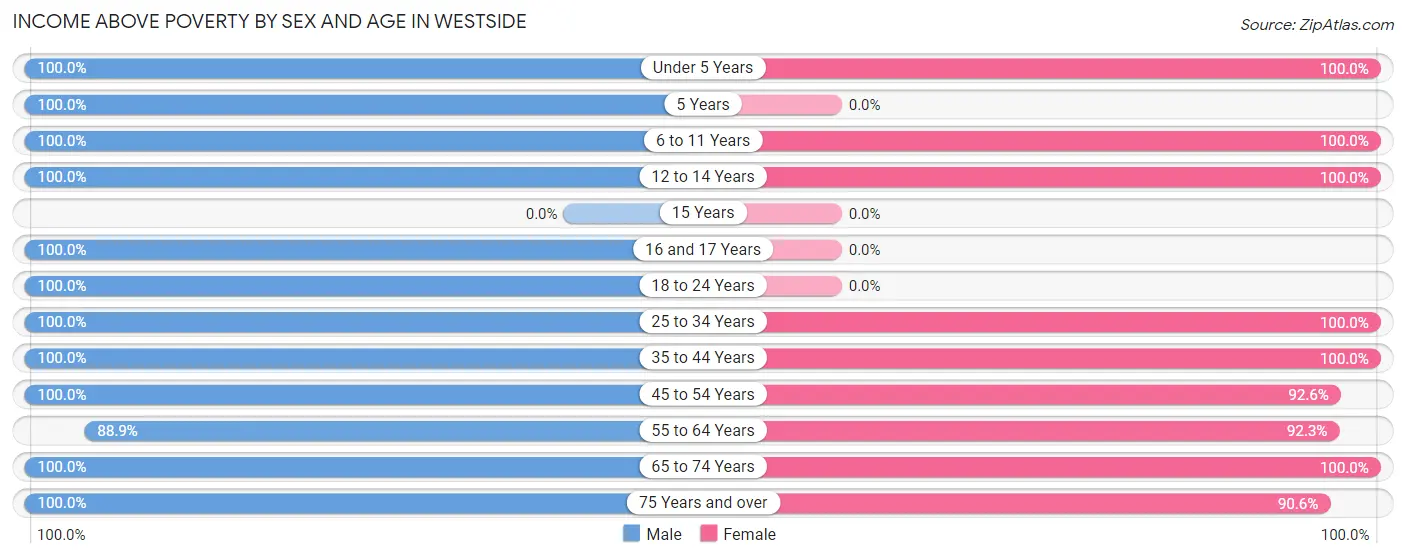
| Age Bracket | Male | Female |
| Under 5 Years | 16 (100.0%) | 4 (100.0%) |
| 5 Years | 10 (100.0%) | 0 (0.0%) |
| 6 to 11 Years | 10 (100.0%) | 6 (100.0%) |
| 12 to 14 Years | 11 (100.0%) | 7 (100.0%) |
| 15 Years | 0 (0.0%) | 0 (0.0%) |
| 16 and 17 Years | 2 (100.0%) | 0 (0.0%) |
| 18 to 24 Years | 6 (100.0%) | 0 (0.0%) |
| 25 to 34 Years | 12 (100.0%) | 19 (100.0%) |
| 35 to 44 Years | 27 (100.0%) | 12 (100.0%) |
| 45 to 54 Years | 6 (100.0%) | 25 (92.6%) |
| 55 to 64 Years | 16 (88.9%) | 12 (92.3%) |
| 65 to 74 Years | 18 (100.0%) | 24 (100.0%) |
| 75 Years and over | 16 (100.0%) | 29 (90.6%) |
| Total | 150 (98.7%) | 138 (95.8%) |
Income Below Poverty Among Married-Couple Families in Westside
The poverty statistics for married-couple families in Westside show that 1.4% or 1 of the total 70 families live below the poverty line. Families with no children have the highest poverty rate of 2.4%, comprising of 1 families. On the other hand, families with 1 or 2 children have the lowest poverty rate of 0.0%, which includes 0 families.
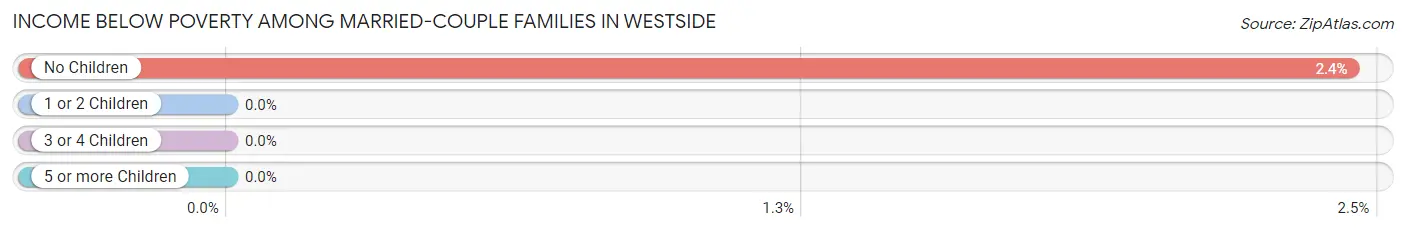
| Children | Above Poverty | Below Poverty |
| No Children | 40 (97.6%) | 1 (2.4%) |
| 1 or 2 Children | 27 (100.0%) | 0 (0.0%) |
| 3 or 4 Children | 2 (100.0%) | 0 (0.0%) |
| 5 or more Children | 0 (0.0%) | 0 (0.0%) |
| Total | 69 (98.6%) | 1 (1.4%) |
Income Below Poverty Among Single-Parent Households in Westside
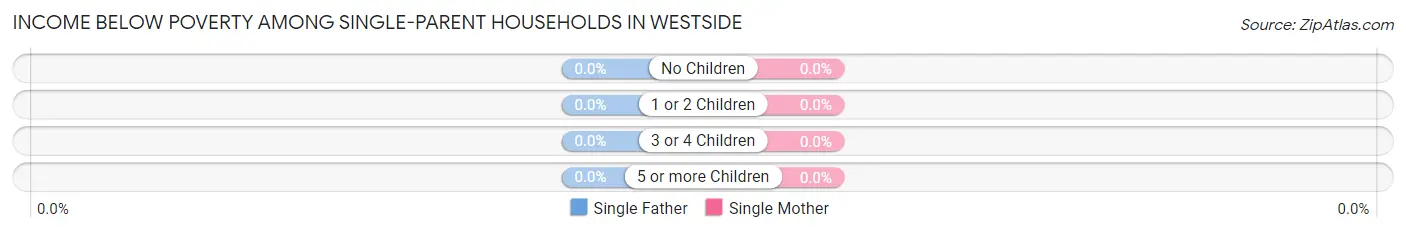
| Children | Single Father | Single Mother |
| No Children | 0 (0.0%) | 0 (0.0%) |
| 1 or 2 Children | 0 (0.0%) | 0 (0.0%) |
| 3 or 4 Children | 0 (0.0%) | 0 (0.0%) |
| 5 or more Children | 0 (0.0%) | 0 (0.0%) |
| Total | 0 (0.0%) | 0 (0.0%) |
Income Below Poverty Among Married-Couple vs Single-Parent Households in Westside
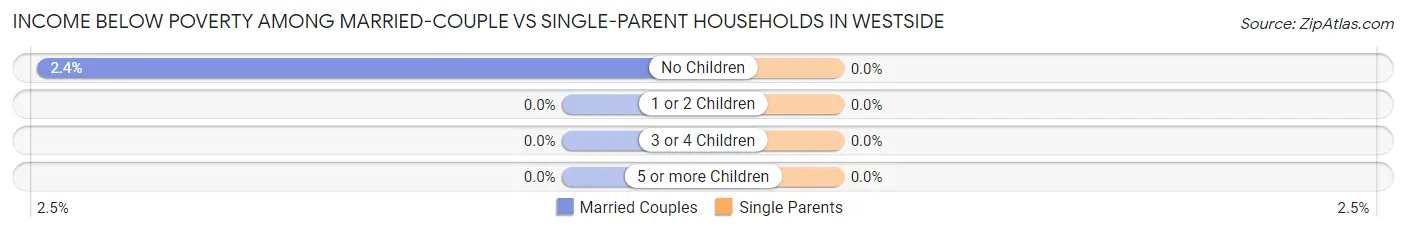
| Children | Married-Couple Families | Single-Parent Households |
| No Children | 1 (2.4%) | 0 (0.0%) |
| 1 or 2 Children | 0 (0.0%) | 0 (0.0%) |
| 3 or 4 Children | 0 (0.0%) | 0 (0.0%) |
| 5 or more Children | 0 (0.0%) | 0 (0.0%) |
| Total | 1 (1.4%) | 0 (0.0%) |
Race in Westside
The most populous races in Westside are White / Caucasian (277 | 93.6%), Hispanic or Latino (12 | 4.1%), and Some other Race (11 | 3.7%).
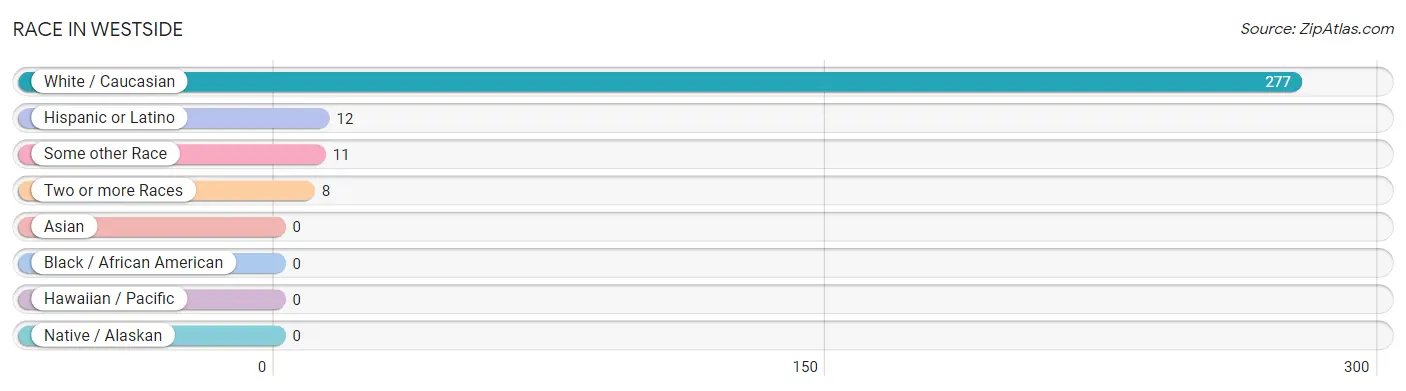
| Race | # Population | % Population |
| Asian | 0 | 0.0% |
| Black / African American | 0 | 0.0% |
| Hawaiian / Pacific | 0 | 0.0% |
| Hispanic or Latino | 12 | 4.1% |
| Native / Alaskan | 0 | 0.0% |
| White / Caucasian | 277 | 93.6% |
| Two or more Races | 8 | 2.7% |
| Some other Race | 11 | 3.7% |
| Total | 296 | 100.0% |
Ancestry in Westside
The most populous ancestries reported in Westside are German (139 | 47.0%), Irish (27 | 9.1%), American (13 | 4.4%), English (10 | 3.4%), and Mexican (10 | 3.4%), together accounting for 67.2% of all Westside residents.
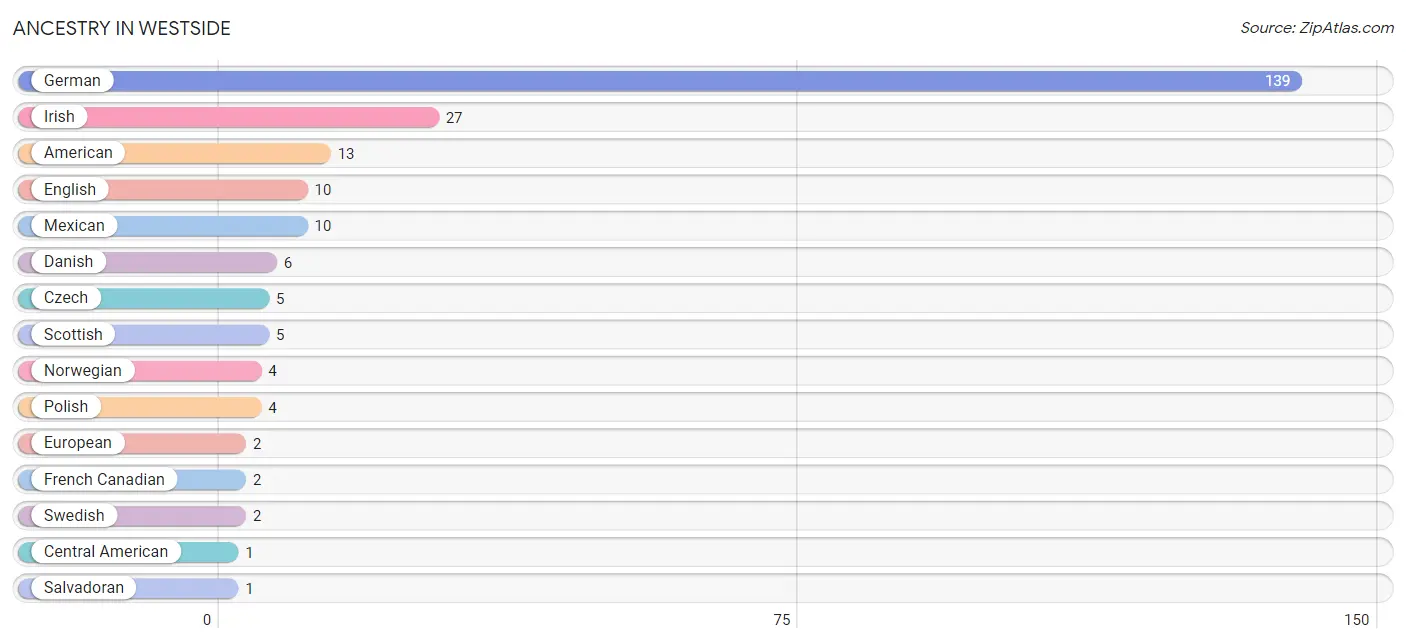
| Ancestry | # Population | % Population |
| American | 13 | 4.4% |
| Central American | 1 | 0.3% |
| Czech | 5 | 1.7% |
| Danish | 6 | 2.0% |
| English | 10 | 3.4% |
| European | 2 | 0.7% |
| French Canadian | 2 | 0.7% |
| German | 139 | 47.0% |
| Irish | 27 | 9.1% |
| Mexican | 10 | 3.4% |
| Norwegian | 4 | 1.3% |
| Polish | 4 | 1.3% |
| Salvadoran | 1 | 0.3% |
| Scottish | 5 | 1.7% |
| Spanish | 1 | 0.3% |
| Swedish | 2 | 0.7% | View All 16 Rows |
Immigrants in Westside
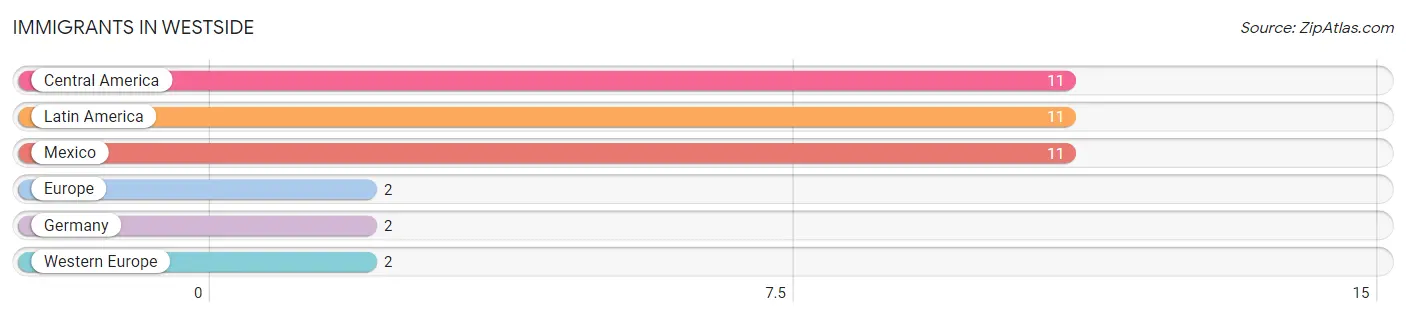
The most numerous immigrant groups reported in Westside came from Central America (11 | 3.7%), Latin America (11 | 3.7%), Mexico (11 | 3.7%), Europe (2 | 0.7%), and Germany (2 | 0.7%), together accounting for 12.5% of all Westside residents.
| Immigration Origin | # Population | % Population |
| Central America | 11 | 3.7% |
| Europe | 2 | 0.7% |
| Germany | 2 | 0.7% |
| Latin America | 11 | 3.7% |
| Mexico | 11 | 3.7% |
| Western Europe | 2 | 0.7% | View All 6 Rows |
Sex and Age in Westside
Sex and Age in Westside
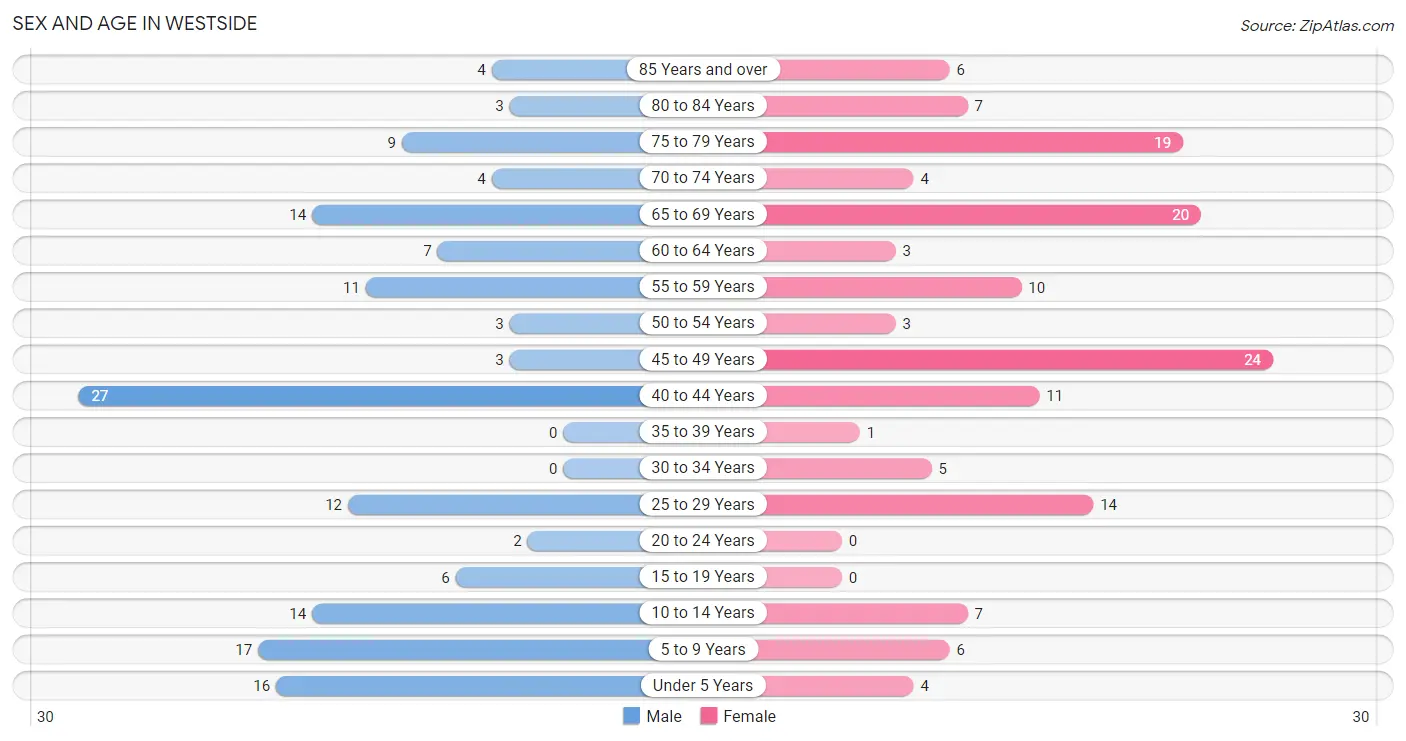
The most populous age groups in Westside are 40 to 44 Years (27 | 17.8%) for men and 45 to 49 Years (24 | 16.7%) for women.
| Age Bracket | Male | Female |
| Under 5 Years | 16 (10.5%) | 4 (2.8%) |
| 5 to 9 Years | 17 (11.2%) | 6 (4.2%) |
| 10 to 14 Years | 14 (9.2%) | 7 (4.9%) |
| 15 to 19 Years | 6 (4.0%) | 0 (0.0%) |
| 20 to 24 Years | 2 (1.3%) | 0 (0.0%) |
| 25 to 29 Years | 12 (7.9%) | 14 (9.7%) |
| 30 to 34 Years | 0 (0.0%) | 5 (3.5%) |
| 35 to 39 Years | 0 (0.0%) | 1 (0.7%) |
| 40 to 44 Years | 27 (17.8%) | 11 (7.6%) |
| 45 to 49 Years | 3 (2.0%) | 24 (16.7%) |
| 50 to 54 Years | 3 (2.0%) | 3 (2.1%) |
| 55 to 59 Years | 11 (7.2%) | 10 (6.9%) |
| 60 to 64 Years | 7 (4.6%) | 3 (2.1%) |
| 65 to 69 Years | 14 (9.2%) | 20 (13.9%) |
| 70 to 74 Years | 4 (2.6%) | 4 (2.8%) |
| 75 to 79 Years | 9 (5.9%) | 19 (13.2%) |
| 80 to 84 Years | 3 (2.0%) | 7 (4.9%) |
| 85 Years and over | 4 (2.6%) | 6 (4.2%) |
| Total | 152 (100.0%) | 144 (100.0%) |
Families and Households in Westside
Median Family Size in Westside
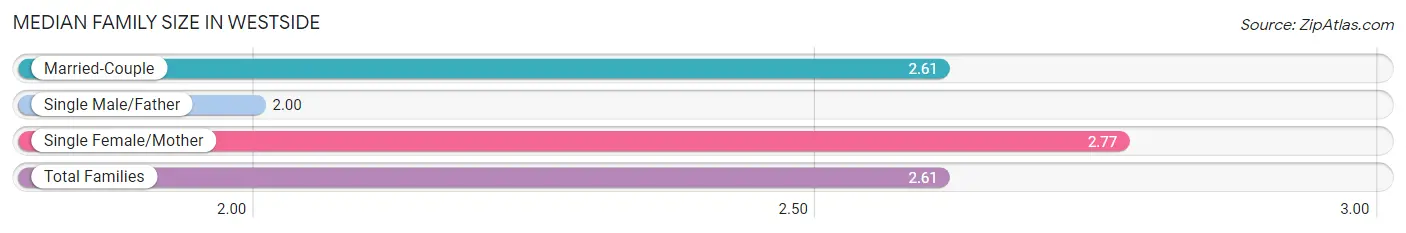
The median family size in Westside is 2.61 persons per family, with single female/mother families (13 | 14.9%) accounting for the largest median family size of 2.77 persons per family. On the other hand, single male/father families (4 | 4.6%) represent the smallest median family size with 2.00 persons per family.
| Family Type | # Families | Family Size |
| Married-Couple | 70 (80.5%) | 2.61 |
| Single Male/Father | 4 (4.6%) | 2.00 |
| Single Female/Mother | 13 (14.9%) | 2.77 |
| Total Families | 87 (100.0%) | 2.61 |
Median Household Size in Westside
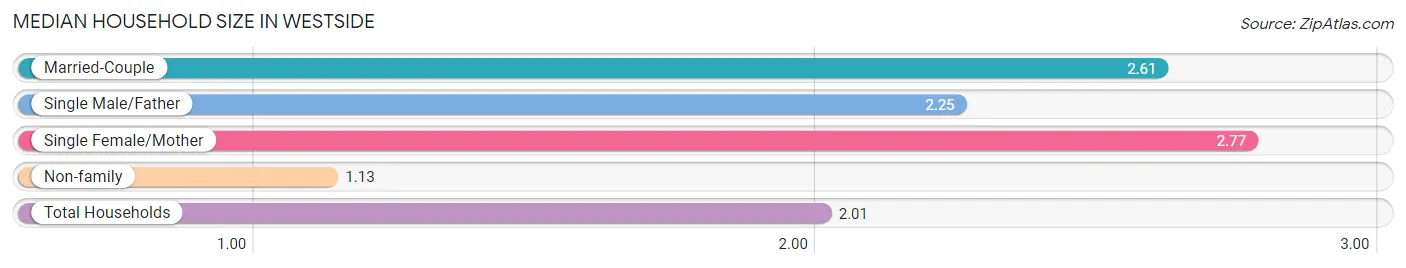
The median household size in Westside is 2.01 persons per household, with single female/mother households (13 | 8.8%) accounting for the largest median household size of 2.77 persons per household. non-family households (60 | 40.8%) represent the smallest median household size with 1.13 persons per household.
| Household Type | # Households | Household Size |
| Married-Couple | 70 (47.6%) | 2.61 |
| Single Male/Father | 4 (2.7%) | 2.25 |
| Single Female/Mother | 13 (8.8%) | 2.77 |
| Non-family | 60 (40.8%) | 1.13 |
| Total Households | 147 (100.0%) | 2.01 |
Household Size by Marriage Status in Westside
Out of a total of 147 households in Westside, 87 (59.2%) are family households, while 60 (40.8%) are nonfamily households. The most numerous type of family households are 2-person households, comprising 46, and the most common type of nonfamily households are 1-person households, comprising 51.
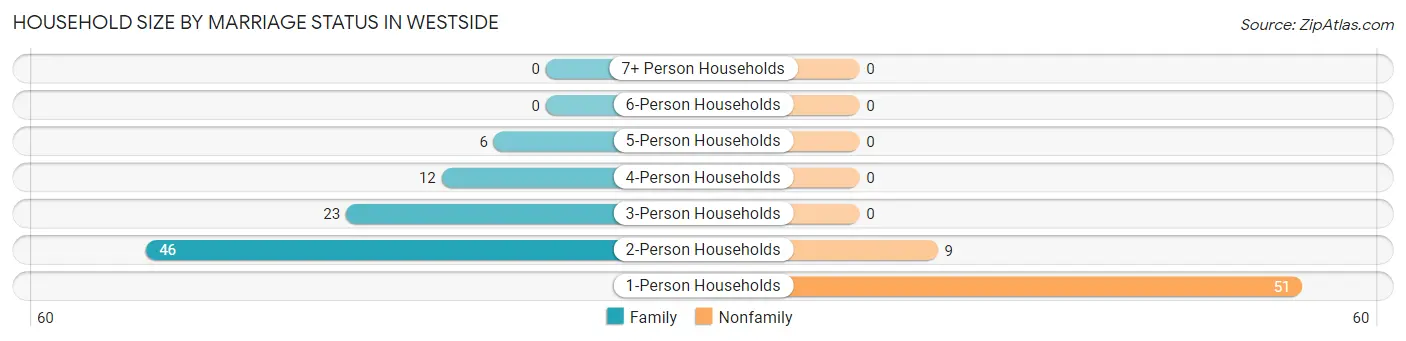
| Household Size | Family Households | Nonfamily Households |
| 1-Person Households | - | 51 (34.7%) |
| 2-Person Households | 46 (31.3%) | 9 (6.1%) |
| 3-Person Households | 23 (15.7%) | 0 (0.0%) |
| 4-Person Households | 12 (8.2%) | 0 (0.0%) |
| 5-Person Households | 6 (4.1%) | 0 (0.0%) |
| 6-Person Households | 0 (0.0%) | 0 (0.0%) |
| 7+ Person Households | 0 (0.0%) | 0 (0.0%) |
| Total | 87 (59.2%) | 60 (40.8%) |
Female Fertility in Westside
Fertility by Age in Westside
Average fertility rate in Westside is 145.0 births per 1,000 women. Women in the age bracket of 20 to 34 years have the highest fertility rate with 421.0 births per 1,000 women. Women in the age bracket of 20 to 34 years acount for 100.0% of all women with births.
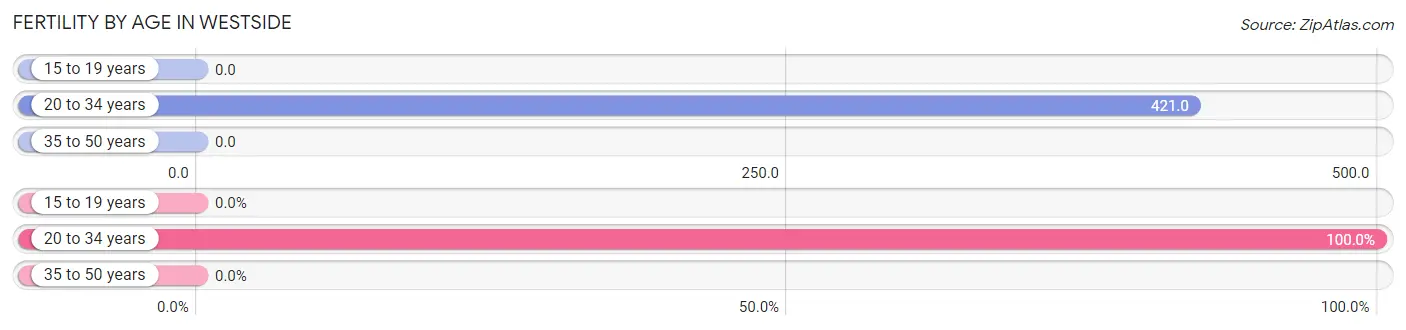
| Age Bracket | Women with Births | Births / 1,000 Women |
| 15 to 19 years | 0 (0.0%) | 0.0 |
| 20 to 34 years | 8 (100.0%) | 421.0 |
| 35 to 50 years | 0 (0.0%) | 0.0 |
| Total | 8 (100.0%) | 145.0 |
Fertility by Age by Marriage Status in Westside
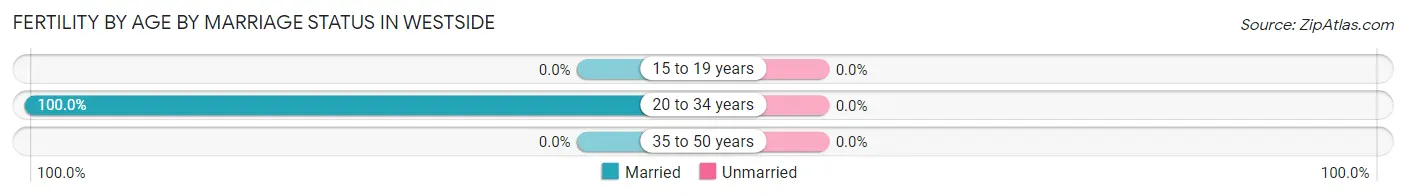
| Age Bracket | Married | Unmarried |
| 15 to 19 years | 0 (0.0%) | 0 (0.0%) |
| 20 to 34 years | 8 (100.0%) | 0 (0.0%) |
| 35 to 50 years | 0 (0.0%) | 0 (0.0%) |
| Total | 8 (100.0%) | 0 (0.0%) |
Fertility by Education in Westside
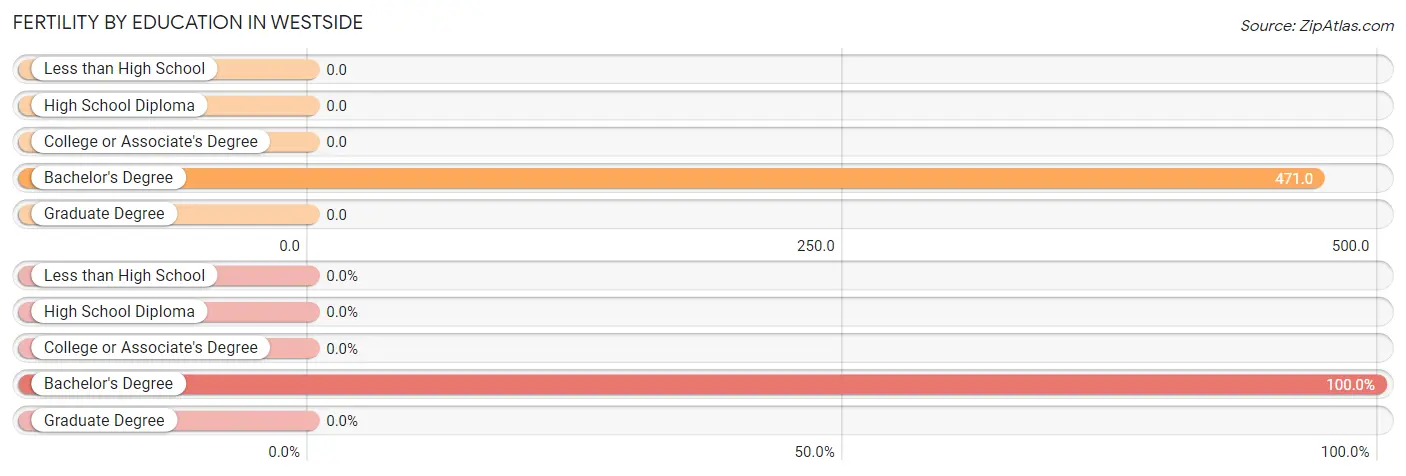
| Educational Attainment | Women with Births | Births / 1,000 Women |
| Less than High School | 0 (0.0%) | 0.0 |
| High School Diploma | 0 (0.0%) | 0.0 |
| College or Associate's Degree | 0 (0.0%) | 0.0 |
| Bachelor's Degree | 8 (100.0%) | 471.0 |
| Graduate Degree | 0 (0.0%) | 0.0 |
| Total | 8 (100.0%) | 145.0 |
Fertility by Education by Marriage Status in Westside
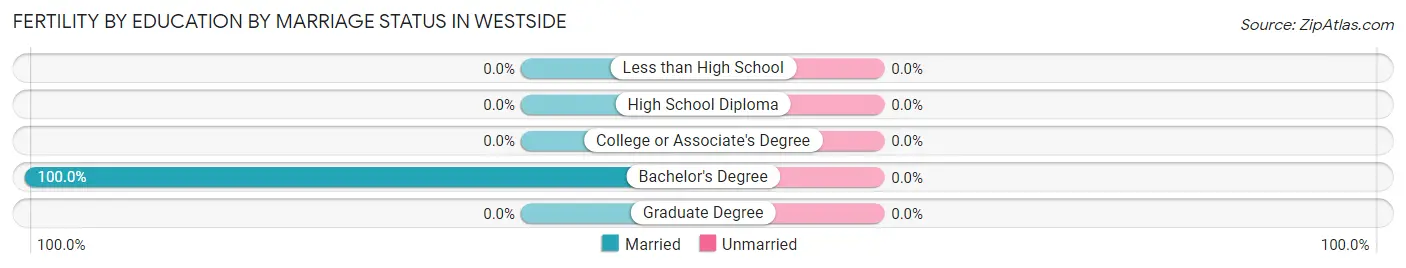
| Educational Attainment | Married | Unmarried |
| Less than High School | 0 (0.0%) | 0 (0.0%) |
| High School Diploma | 0 (0.0%) | 0 (0.0%) |
| College or Associate's Degree | 0 (0.0%) | 0 (0.0%) |
| Bachelor's Degree | 8 (100.0%) | 0 (0.0%) |
| Graduate Degree | 0 (0.0%) | 0 (0.0%) |
| Total | 8 (100.0%) | 0 (0.0%) |
Employment Characteristics in Westside
Employment by Class of Employer in Westside
Among the 153 employed individuals in Westside, private company employees (111 | 72.6%), self-employed (not incorporated) (16 | 10.5%), and not-for-profit organizations (9 | 5.9%) make up the most common classes of employment.
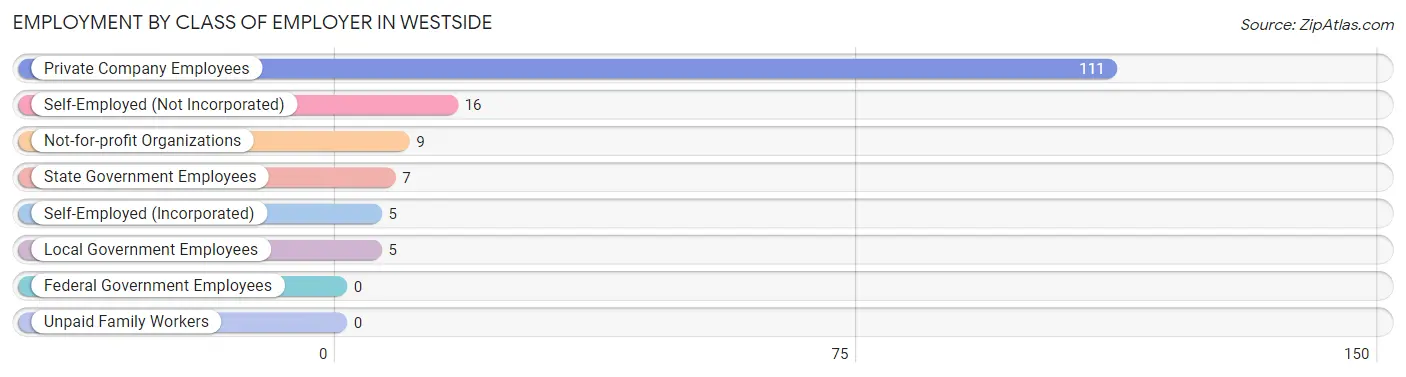
| Employer Class | # Employees | % Employees |
| Private Company Employees | 111 | 72.6% |
| Self-Employed (Incorporated) | 5 | 3.3% |
| Self-Employed (Not Incorporated) | 16 | 10.5% |
| Not-for-profit Organizations | 9 | 5.9% |
| Local Government Employees | 5 | 3.3% |
| State Government Employees | 7 | 4.6% |
| Federal Government Employees | 0 | 0.0% |
| Unpaid Family Workers | 0 | 0.0% |
| Total | 153 | 100.0% |
Employment Status by Age in Westside
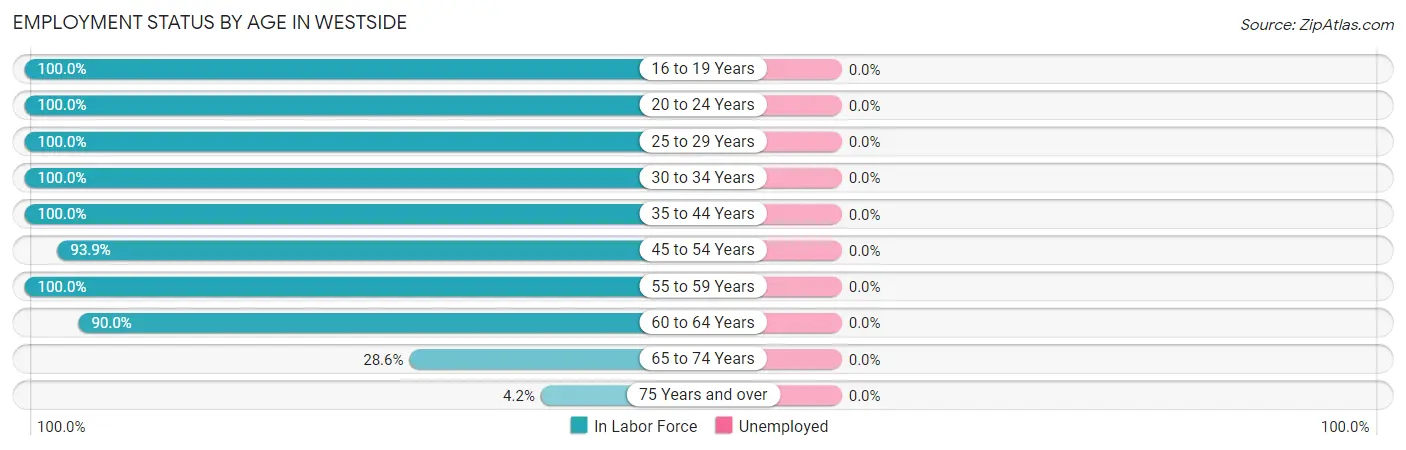
| Age Bracket | In Labor Force | Unemployed |
| 16 to 19 Years | 6 (100.0%) | 0 (0.0%) |
| 20 to 24 Years | 2 (100.0%) | 0 (0.0%) |
| 25 to 29 Years | 26 (100.0%) | 0 (0.0%) |
| 30 to 34 Years | 5 (100.0%) | 0 (0.0%) |
| 35 to 44 Years | 39 (100.0%) | 0 (0.0%) |
| 45 to 54 Years | 31 (93.9%) | 0 (0.0%) |
| 55 to 59 Years | 21 (100.0%) | 0 (0.0%) |
| 60 to 64 Years | 9 (90.0%) | 0 (0.0%) |
| 65 to 74 Years | 12 (28.6%) | 0 (0.0%) |
| 75 Years and over | 2 (4.2%) | 0 (0.0%) |
| Total | 153 (65.9%) | 0 (0.0%) |
Employment Status by Educational Attainment in Westside
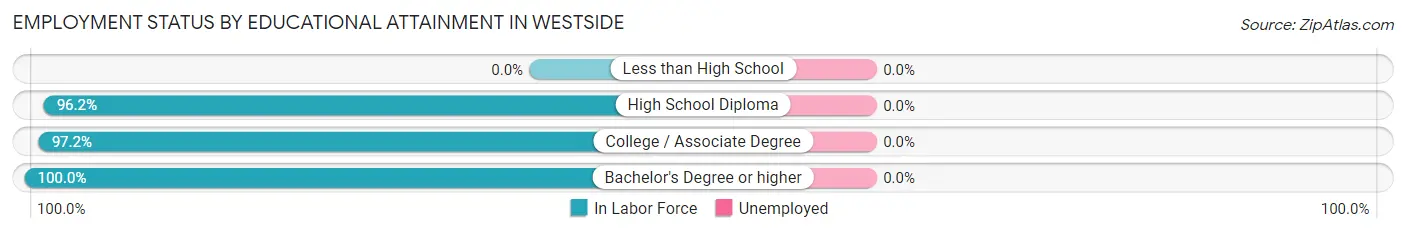
| Educational Attainment | In Labor Force | Unemployed |
| Less than High School | 0 (0.0%) | 0 (0.0%) |
| High School Diploma | 51 (96.2%) | 0 (0.0%) |
| College / Associate Degree | 35 (97.2%) | 0 (0.0%) |
| Bachelor's Degree or higher | 45 (100.0%) | 0 (0.0%) |
| Total | 131 (97.8%) | 0 (0.0%) |
Employment Occupations by Sex in Westside
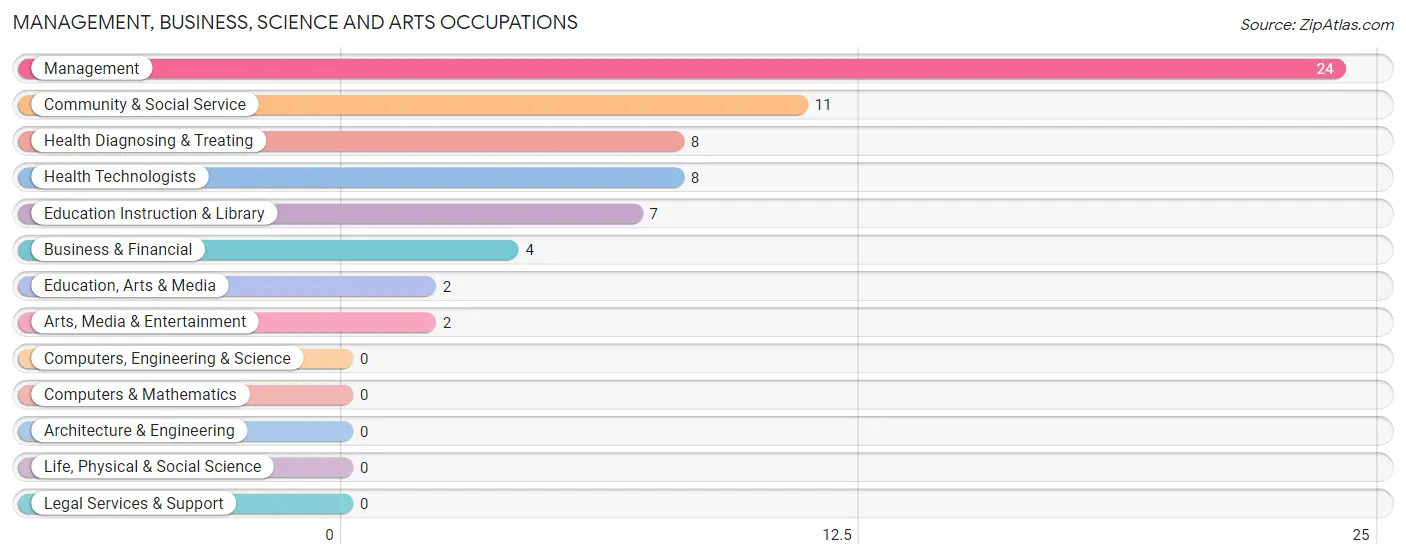
Management, Business, Science and Arts Occupations
The most common Management, Business, Science and Arts occupations in Westside are Management (24 | 15.7%), Community & Social Service (11 | 7.2%), Health Diagnosing & Treating (8 | 5.2%), Health Technologists (8 | 5.2%), and Education Instruction & Library (7 | 4.6%).
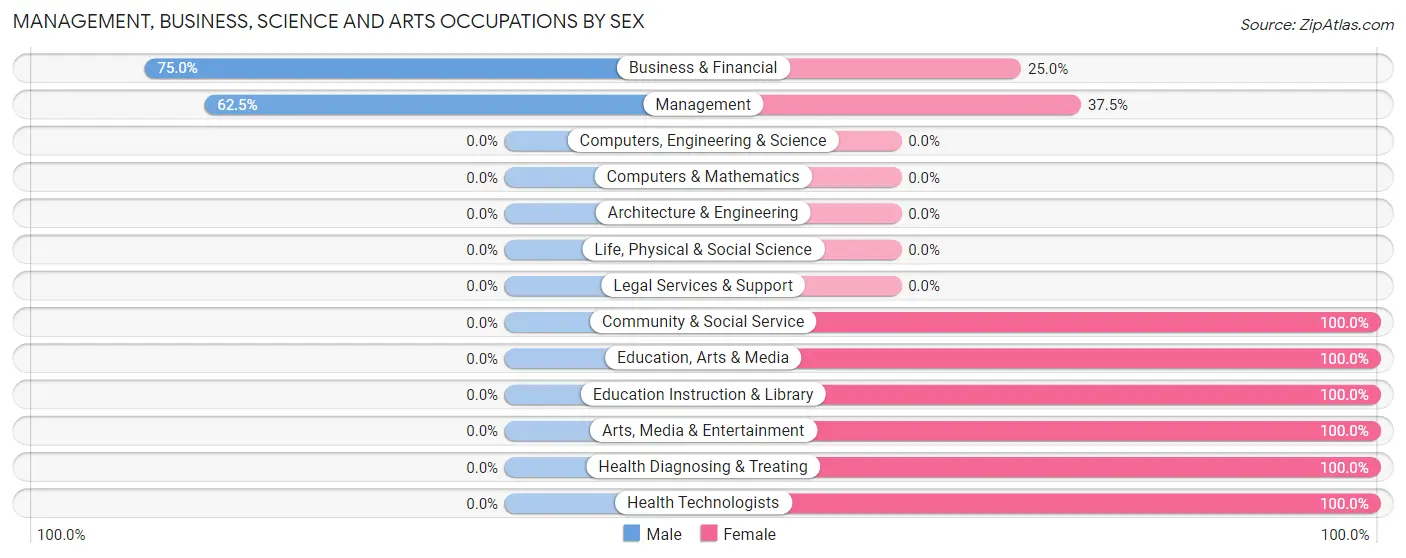
Management, Business, Science and Arts Occupations by Sex
Within the Management, Business, Science and Arts occupations in Westside, the most male-oriented occupations are Business & Financial (75.0%), and Management (62.5%), while the most female-oriented occupations are Community & Social Service (100.0%), Education, Arts & Media (100.0%), and Education Instruction & Library (100.0%).
| Occupation | Male | Female |
| Management | 15 (62.5%) | 9 (37.5%) |
| Business & Financial | 3 (75.0%) | 1 (25.0%) |
| Computers, Engineering & Science | 0 (0.0%) | 0 (0.0%) |
| Computers & Mathematics | 0 (0.0%) | 0 (0.0%) |
| Architecture & Engineering | 0 (0.0%) | 0 (0.0%) |
| Life, Physical & Social Science | 0 (0.0%) | 0 (0.0%) |
| Community & Social Service | 0 (0.0%) | 11 (100.0%) |
| Education, Arts & Media | 0 (0.0%) | 2 (100.0%) |
| Legal Services & Support | 0 (0.0%) | 0 (0.0%) |
| Education Instruction & Library | 0 (0.0%) | 7 (100.0%) |
| Arts, Media & Entertainment | 0 (0.0%) | 2 (100.0%) |
| Health Diagnosing & Treating | 0 (0.0%) | 8 (100.0%) |
| Health Technologists | 0 (0.0%) | 8 (100.0%) |
| Total (Category) | 18 (38.3%) | 29 (61.7%) |
| Total (Overall) | 79 (51.6%) | 74 (48.4%) |
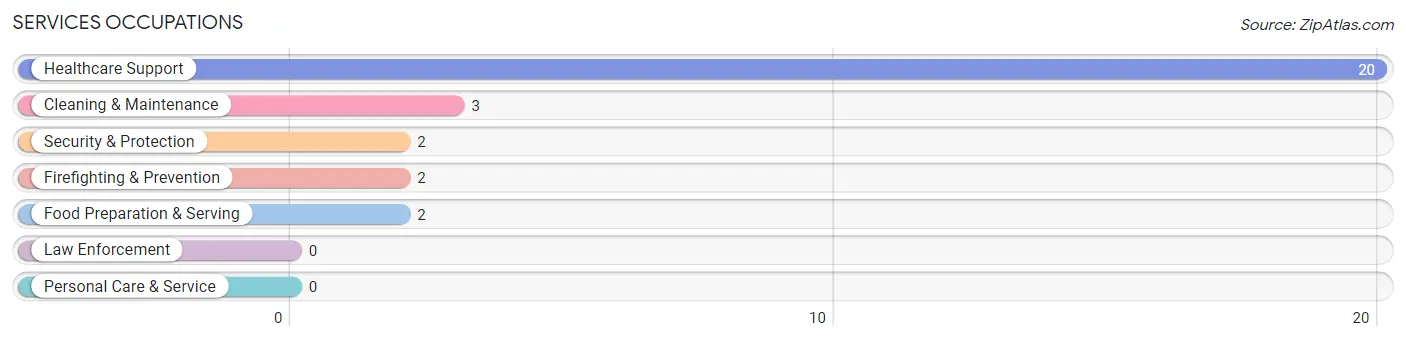
Services Occupations
The most common Services occupations in Westside are Healthcare Support (20 | 13.1%), Cleaning & Maintenance (3 | 2.0%), Security & Protection (2 | 1.3%), Firefighting & Prevention (2 | 1.3%), and Food Preparation & Serving (2 | 1.3%).
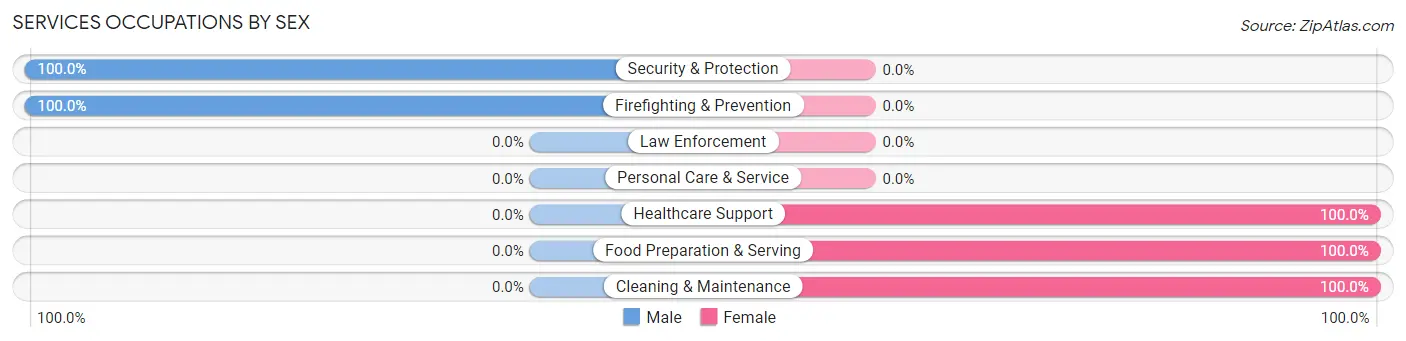
Services Occupations by Sex
Within the Services occupations in Westside, the most male-oriented occupations are Security & Protection (100.0%), and Firefighting & Prevention (100.0%), while the most female-oriented occupations are Healthcare Support (100.0%), Food Preparation & Serving (100.0%), and Cleaning & Maintenance (100.0%).
| Occupation | Male | Female |
| Healthcare Support | 0 (0.0%) | 20 (100.0%) |
| Security & Protection | 2 (100.0%) | 0 (0.0%) |
| Firefighting & Prevention | 2 (100.0%) | 0 (0.0%) |
| Law Enforcement | 0 (0.0%) | 0 (0.0%) |
| Food Preparation & Serving | 0 (0.0%) | 2 (100.0%) |
| Cleaning & Maintenance | 0 (0.0%) | 3 (100.0%) |
| Personal Care & Service | 0 (0.0%) | 0 (0.0%) |
| Total (Category) | 2 (7.4%) | 25 (92.6%) |
| Total (Overall) | 79 (51.6%) | 74 (48.4%) |
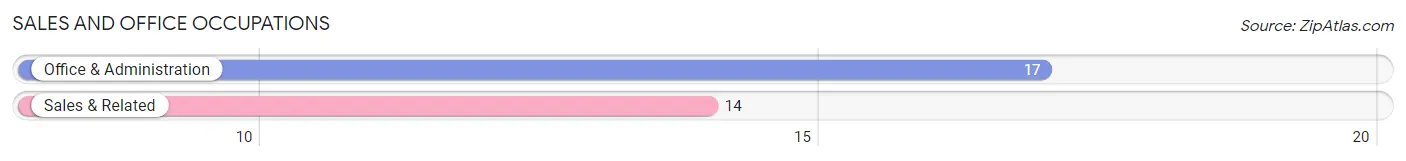
Sales and Office Occupations
The most common Sales and Office occupations in Westside are Office & Administration (17 | 11.1%), and Sales & Related (14 | 9.1%).
Sales and Office Occupations by Sex
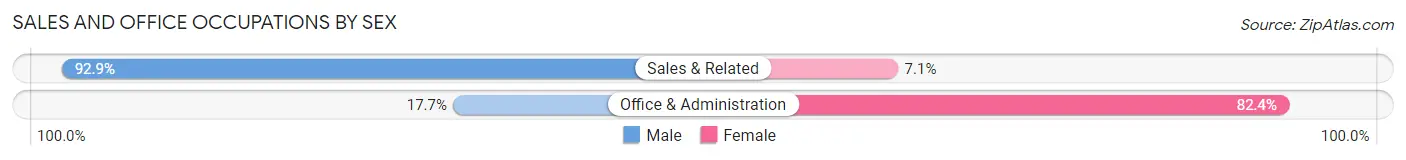
| Occupation | Male | Female |
| Sales & Related | 13 (92.9%) | 1 (7.1%) |
| Office & Administration | 3 (17.6%) | 14 (82.4%) |
| Total (Category) | 16 (51.6%) | 15 (48.4%) |
| Total (Overall) | 79 (51.6%) | 74 (48.4%) |
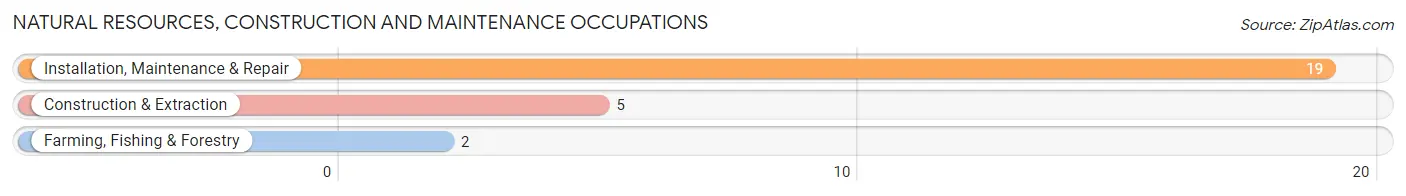
Natural Resources, Construction and Maintenance Occupations
The most common Natural Resources, Construction and Maintenance occupations in Westside are Installation, Maintenance & Repair (19 | 12.4%), Construction & Extraction (5 | 3.3%), and Farming, Fishing & Forestry (2 | 1.3%).
Natural Resources, Construction and Maintenance Occupations by Sex
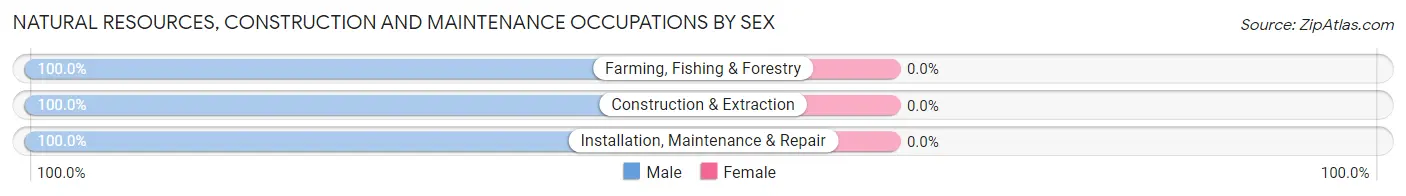
| Occupation | Male | Female |
| Farming, Fishing & Forestry | 2 (100.0%) | 0 (0.0%) |
| Construction & Extraction | 5 (100.0%) | 0 (0.0%) |
| Installation, Maintenance & Repair | 19 (100.0%) | 0 (0.0%) |
| Total (Category) | 26 (100.0%) | 0 (0.0%) |
| Total (Overall) | 79 (51.6%) | 74 (48.4%) |
Production, Transportation and Moving Occupations
The most common Production, Transportation and Moving occupations in Westside are Transportation (13 | 8.5%), Production (5 | 3.3%), and Material Moving (4 | 2.6%).
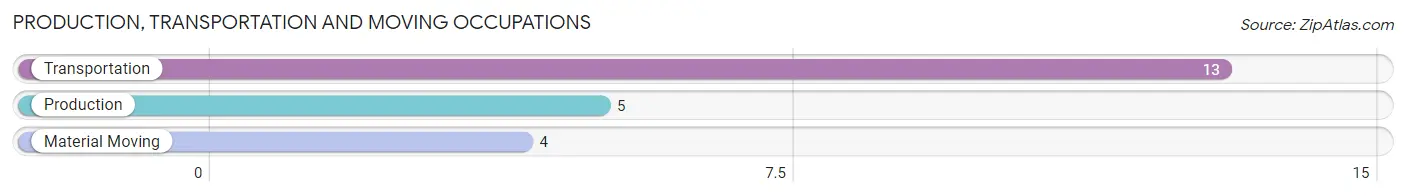
Production, Transportation and Moving Occupations by Sex
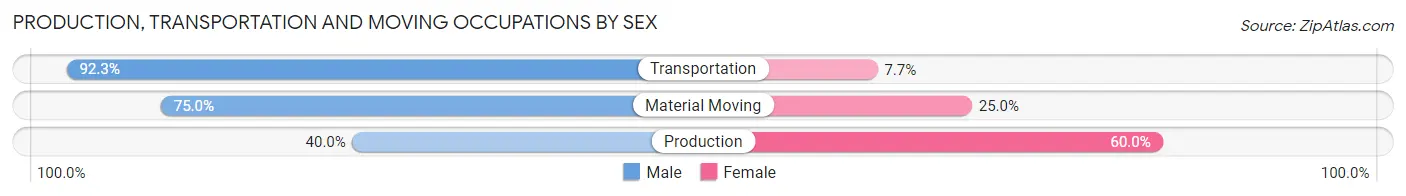
| Occupation | Male | Female |
| Production | 2 (40.0%) | 3 (60.0%) |
| Transportation | 12 (92.3%) | 1 (7.7%) |
| Material Moving | 3 (75.0%) | 1 (25.0%) |
| Total (Category) | 17 (77.3%) | 5 (22.7%) |
| Total (Overall) | 79 (51.6%) | 74 (48.4%) |
Employment Industries by Sex in Westside
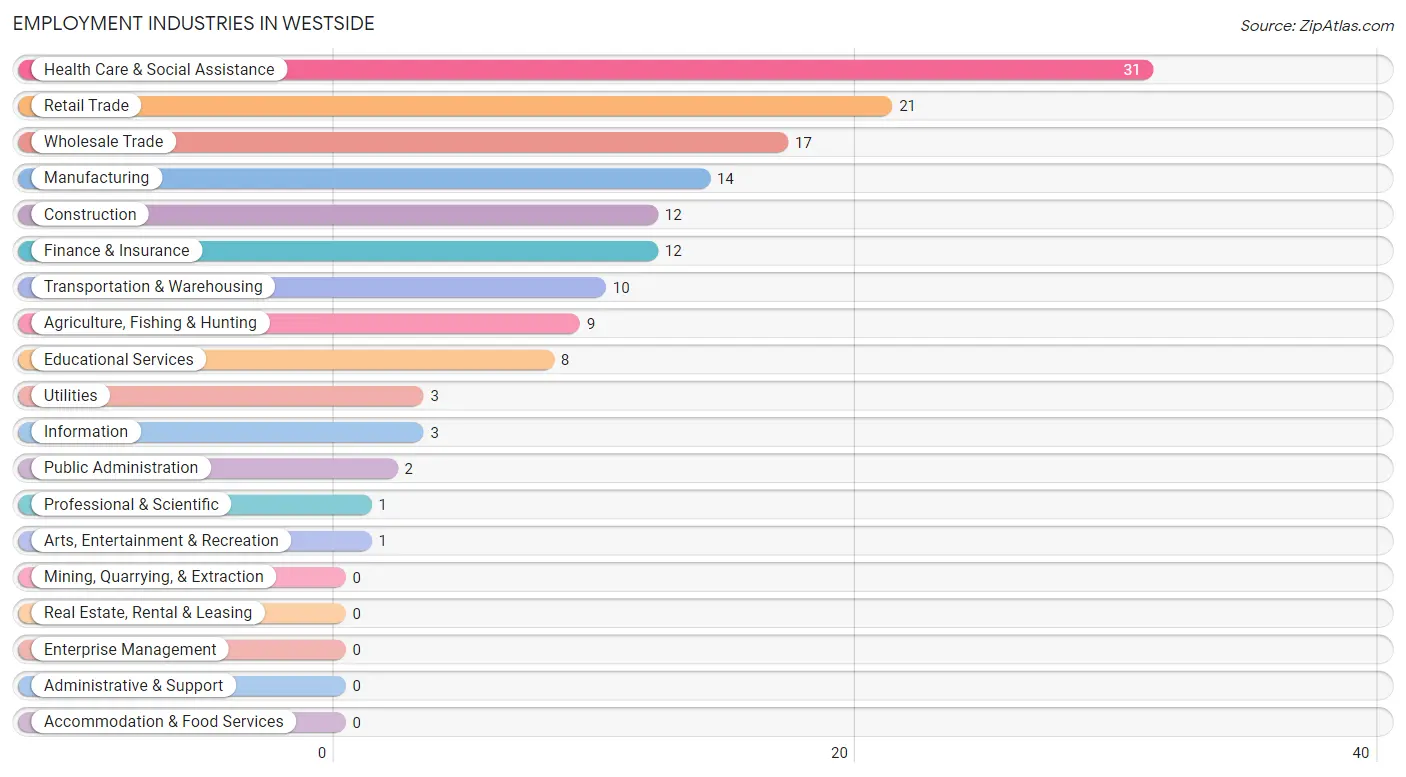
Employment Industries in Westside
The major employment industries in Westside include Health Care & Social Assistance (31 | 20.3%), Retail Trade (21 | 13.7%), Wholesale Trade (17 | 11.1%), Manufacturing (14 | 9.1%), and Construction (12 | 7.8%).
Employment Industries by Sex in Westside
The Westside industries that see more men than women are Information (100.0%), Arts, Entertainment & Recreation (100.0%), and Public Administration (100.0%), whereas the industries that tend to have a higher number of women are Utilities (100.0%), Professional & Scientific (100.0%), and Educational Services (100.0%).
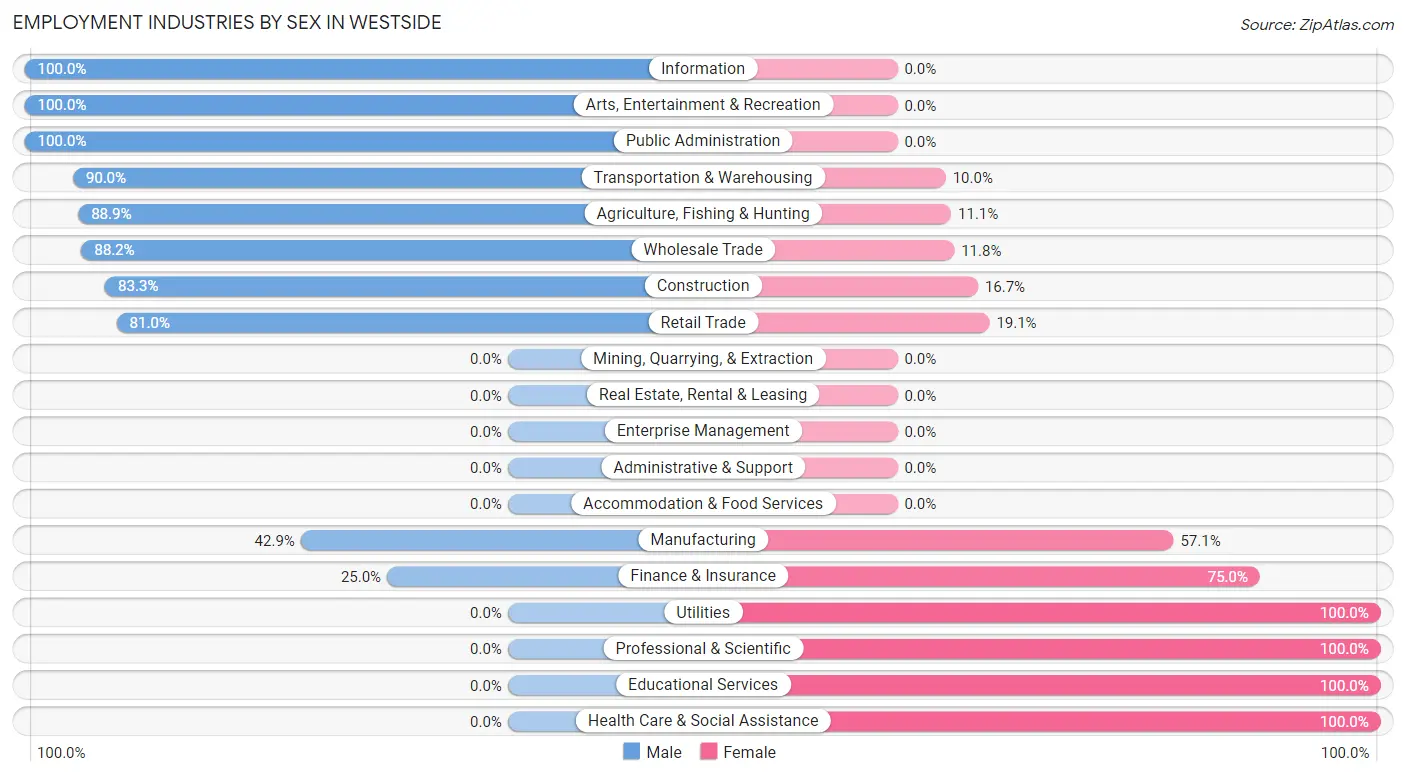
| Industry | Male | Female |
| Agriculture, Fishing & Hunting | 8 (88.9%) | 1 (11.1%) |
| Mining, Quarrying, & Extraction | 0 (0.0%) | 0 (0.0%) |
| Construction | 10 (83.3%) | 2 (16.7%) |
| Manufacturing | 6 (42.9%) | 8 (57.1%) |
| Wholesale Trade | 15 (88.2%) | 2 (11.8%) |
| Retail Trade | 17 (80.9%) | 4 (19.1%) |
| Transportation & Warehousing | 9 (90.0%) | 1 (10.0%) |
| Utilities | 0 (0.0%) | 3 (100.0%) |
| Information | 3 (100.0%) | 0 (0.0%) |
| Finance & Insurance | 3 (25.0%) | 9 (75.0%) |
| Real Estate, Rental & Leasing | 0 (0.0%) | 0 (0.0%) |
| Professional & Scientific | 0 (0.0%) | 1 (100.0%) |
| Enterprise Management | 0 (0.0%) | 0 (0.0%) |
| Administrative & Support | 0 (0.0%) | 0 (0.0%) |
| Educational Services | 0 (0.0%) | 8 (100.0%) |
| Health Care & Social Assistance | 0 (0.0%) | 31 (100.0%) |
| Arts, Entertainment & Recreation | 1 (100.0%) | 0 (0.0%) |
| Accommodation & Food Services | 0 (0.0%) | 0 (0.0%) |
| Public Administration | 2 (100.0%) | 0 (0.0%) |
| Total | 79 (51.6%) | 74 (48.4%) |
Education in Westside
School Enrollment in Westside
The most common levels of schooling among the 51 students in Westside are middle school (21 | 41.2%), kindergarten (15 | 29.4%), and elementary school (8 | 15.7%).
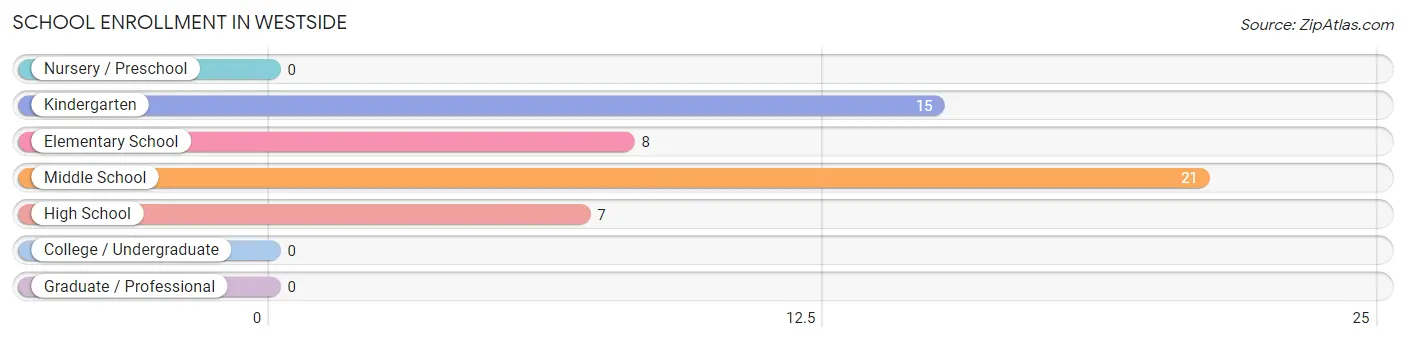
| School Level | # Students | % Students |
| Nursery / Preschool | 0 | 0.0% |
| Kindergarten | 15 | 29.4% |
| Elementary School | 8 | 15.7% |
| Middle School | 21 | 41.2% |
| High School | 7 | 13.7% |
| College / Undergraduate | 0 | 0.0% |
| Graduate / Professional | 0 | 0.0% |
| Total | 51 | 100.0% |
School Enrollment by Age by Funding Source in Westside
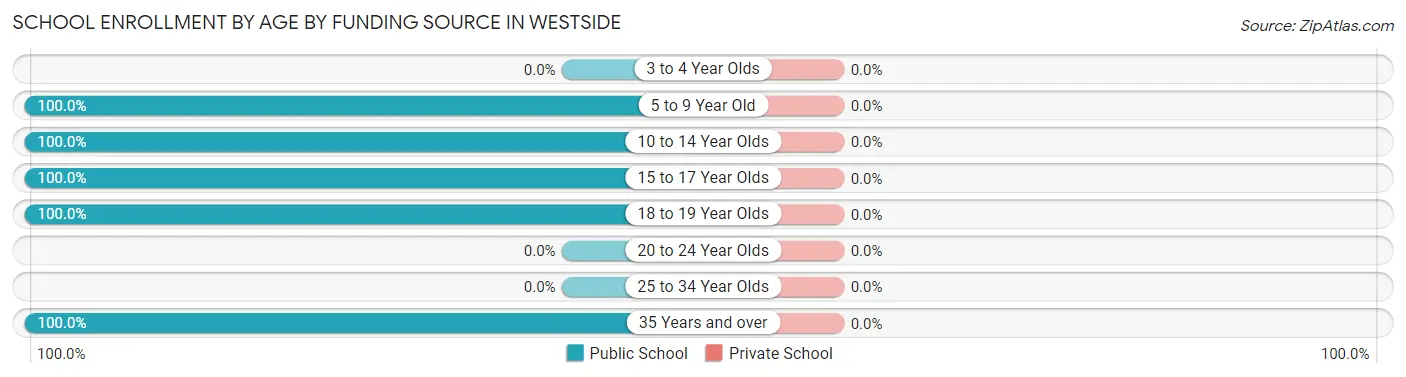
| Age Bracket | Public School | Private School |
| 3 to 4 Year Olds | 0 (0.0%) | 0 (0.0%) |
| 5 to 9 Year Old | 23 (100.0%) | 0 (0.0%) |
| 10 to 14 Year Olds | 21 (100.0%) | 0 (0.0%) |
| 15 to 17 Year Olds | 2 (100.0%) | 0 (0.0%) |
| 18 to 19 Year Olds | 4 (100.0%) | 0 (0.0%) |
| 20 to 24 Year Olds | 0 (0.0%) | 0 (0.0%) |
| 25 to 34 Year Olds | 0 (0.0%) | 0 (0.0%) |
| 35 Years and over | 1 (100.0%) | 0 (0.0%) |
| Total | 51 (100.0%) | 0 (0.0%) |
Educational Attainment by Field of Study in Westside
Science & technology (11 | 18.6%), education (11 | 18.6%), business (9 | 15.2%), bio, nature & agricultural (8 | 13.6%), and engineering (6 | 10.2%) are the most common fields of study among 59 individuals in Westside who have obtained a bachelor's degree or higher.
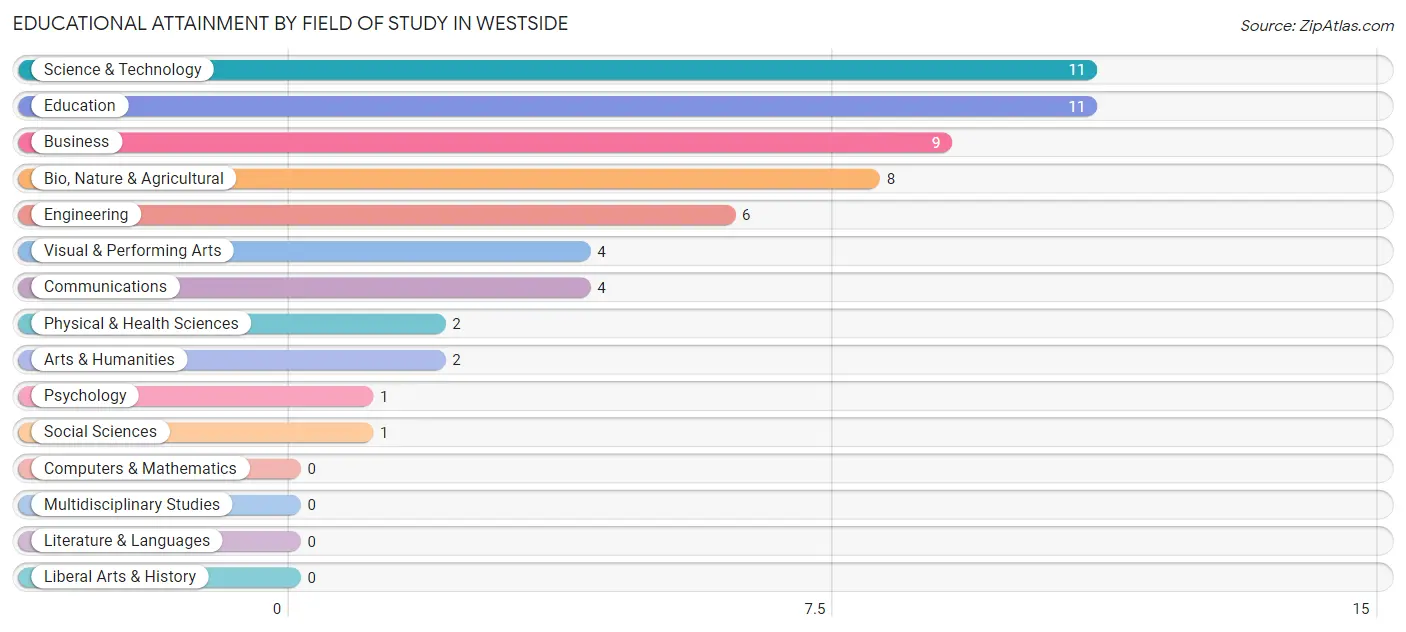
| Field of Study | # Graduates | % Graduates |
| Computers & Mathematics | 0 | 0.0% |
| Bio, Nature & Agricultural | 8 | 13.6% |
| Physical & Health Sciences | 2 | 3.4% |
| Psychology | 1 | 1.7% |
| Social Sciences | 1 | 1.7% |
| Engineering | 6 | 10.2% |
| Multidisciplinary Studies | 0 | 0.0% |
| Science & Technology | 11 | 18.6% |
| Business | 9 | 15.2% |
| Education | 11 | 18.6% |
| Literature & Languages | 0 | 0.0% |
| Liberal Arts & History | 0 | 0.0% |
| Visual & Performing Arts | 4 | 6.8% |
| Communications | 4 | 6.8% |
| Arts & Humanities | 2 | 3.4% |
| Total | 59 | 100.0% |
Transportation & Commute in Westside
Vehicle Availability by Sex in Westside
The most prevalent vehicle ownership categories in Westside are males with 3 vehicles (33, accounting for 41.8%) and females with 3 vehicles (26, making up 44.6%).
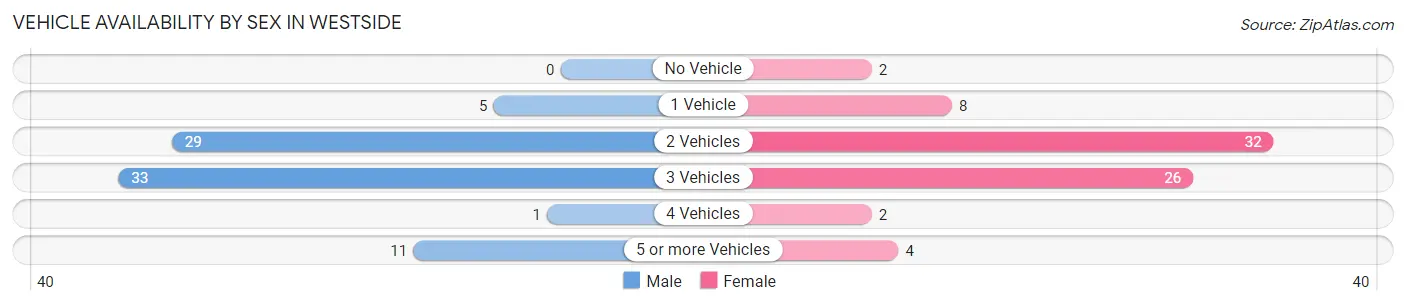
| Vehicles Available | Male | Female |
| No Vehicle | 0 (0.0%) | 2 (2.7%) |
| 1 Vehicle | 5 (6.3%) | 8 (10.8%) |
| 2 Vehicles | 29 (36.7%) | 32 (43.2%) |
| 3 Vehicles | 33 (41.8%) | 26 (35.1%) |
| 4 Vehicles | 1 (1.3%) | 2 (2.7%) |
| 5 or more Vehicles | 11 (13.9%) | 4 (5.4%) |
| Total | 79 (100.0%) | 74 (100.0%) |
Commute Time in Westside
The most frequently occuring commute durations in Westside are 20 to 24 minutes (74 commuters, 49.0%), less than 5 minutes (21 commuters, 13.9%), and 5 to 9 minutes (20 commuters, 13.3%).
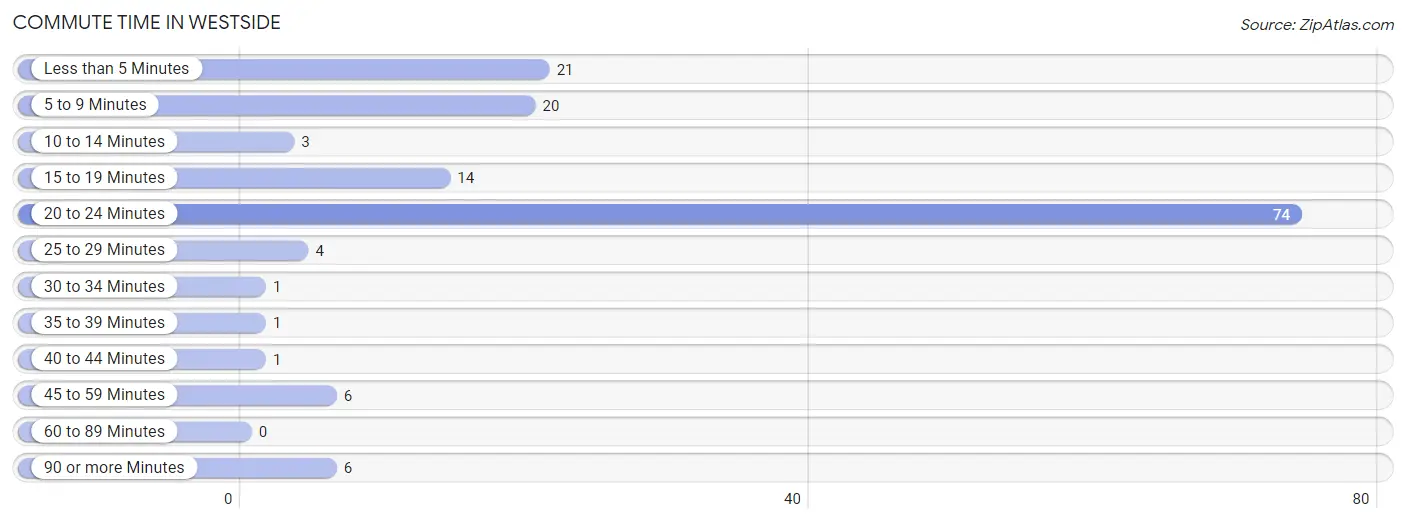
| Commute Time | # Commuters | % Commuters |
| Less than 5 Minutes | 21 | 13.9% |
| 5 to 9 Minutes | 20 | 13.3% |
| 10 to 14 Minutes | 3 | 2.0% |
| 15 to 19 Minutes | 14 | 9.3% |
| 20 to 24 Minutes | 74 | 49.0% |
| 25 to 29 Minutes | 4 | 2.6% |
| 30 to 34 Minutes | 1 | 0.7% |
| 35 to 39 Minutes | 1 | 0.7% |
| 40 to 44 Minutes | 1 | 0.7% |
| 45 to 59 Minutes | 6 | 4.0% |
| 60 to 89 Minutes | 0 | 0.0% |
| 90 or more Minutes | 6 | 4.0% |
Commute Time by Sex in Westside
The most common commute times in Westside are 20 to 24 minutes (33 commuters, 41.8%) for males and 20 to 24 minutes (41 commuters, 56.9%) for females.
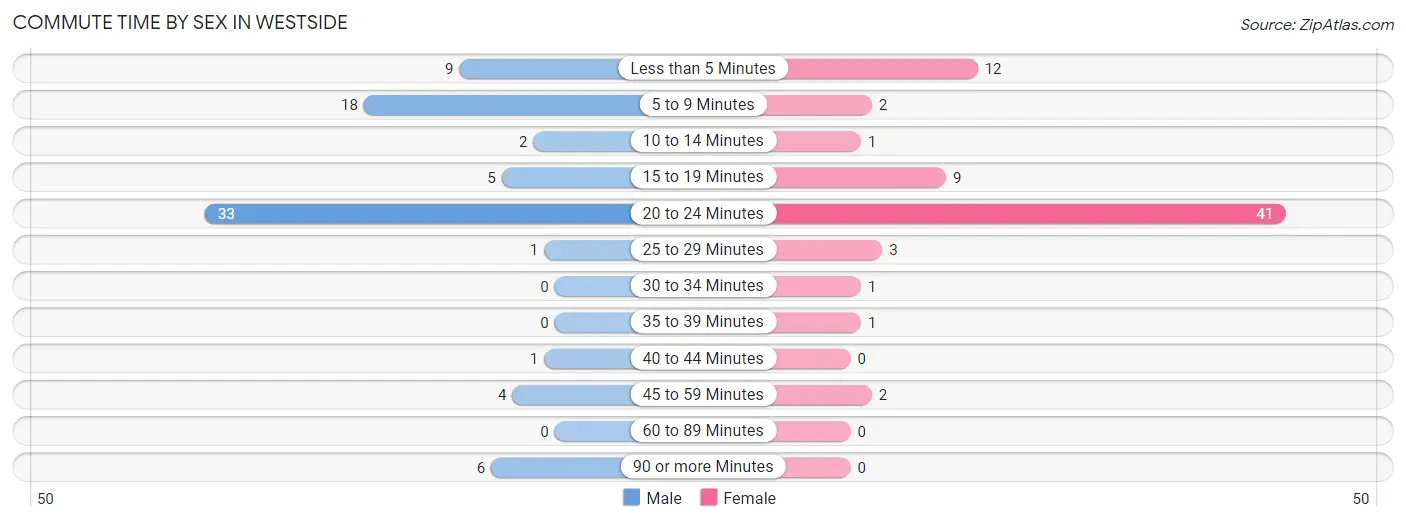
| Commute Time | Male | Female |
| Less than 5 Minutes | 9 (11.4%) | 12 (16.7%) |
| 5 to 9 Minutes | 18 (22.8%) | 2 (2.8%) |
| 10 to 14 Minutes | 2 (2.5%) | 1 (1.4%) |
| 15 to 19 Minutes | 5 (6.3%) | 9 (12.5%) |
| 20 to 24 Minutes | 33 (41.8%) | 41 (56.9%) |
| 25 to 29 Minutes | 1 (1.3%) | 3 (4.2%) |
| 30 to 34 Minutes | 0 (0.0%) | 1 (1.4%) |
| 35 to 39 Minutes | 0 (0.0%) | 1 (1.4%) |
| 40 to 44 Minutes | 1 (1.3%) | 0 (0.0%) |
| 45 to 59 Minutes | 4 (5.1%) | 2 (2.8%) |
| 60 to 89 Minutes | 0 (0.0%) | 0 (0.0%) |
| 90 or more Minutes | 6 (7.6%) | 0 (0.0%) |
Time of Departure to Work by Sex in Westside
The most frequent times of departure to work in Westside are 7:30 AM to 7:59 AM (30, 38.0%) for males and 7:30 AM to 7:59 AM (27, 37.5%) for females.
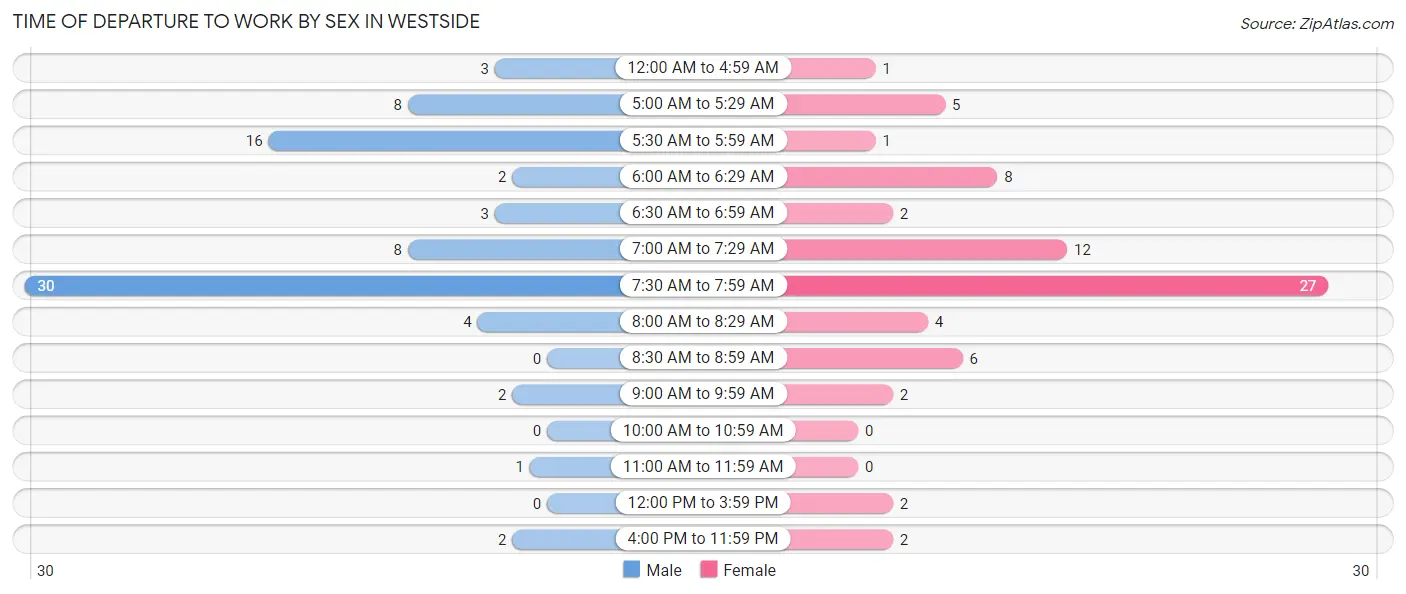
| Time of Departure | Male | Female |
| 12:00 AM to 4:59 AM | 3 (3.8%) | 1 (1.4%) |
| 5:00 AM to 5:29 AM | 8 (10.1%) | 5 (6.9%) |
| 5:30 AM to 5:59 AM | 16 (20.3%) | 1 (1.4%) |
| 6:00 AM to 6:29 AM | 2 (2.5%) | 8 (11.1%) |
| 6:30 AM to 6:59 AM | 3 (3.8%) | 2 (2.8%) |
| 7:00 AM to 7:29 AM | 8 (10.1%) | 12 (16.7%) |
| 7:30 AM to 7:59 AM | 30 (38.0%) | 27 (37.5%) |
| 8:00 AM to 8:29 AM | 4 (5.1%) | 4 (5.6%) |
| 8:30 AM to 8:59 AM | 0 (0.0%) | 6 (8.3%) |
| 9:00 AM to 9:59 AM | 2 (2.5%) | 2 (2.8%) |
| 10:00 AM to 10:59 AM | 0 (0.0%) | 0 (0.0%) |
| 11:00 AM to 11:59 AM | 1 (1.3%) | 0 (0.0%) |
| 12:00 PM to 3:59 PM | 0 (0.0%) | 2 (2.8%) |
| 4:00 PM to 11:59 PM | 2 (2.5%) | 2 (2.8%) |
| Total | 79 (100.0%) | 72 (100.0%) |
Housing Occupancy in Westside
Occupancy by Ownership in Westside
Of the total 147 dwellings in Westside, owner-occupied units account for 138 (93.9%), while renter-occupied units make up 9 (6.1%).
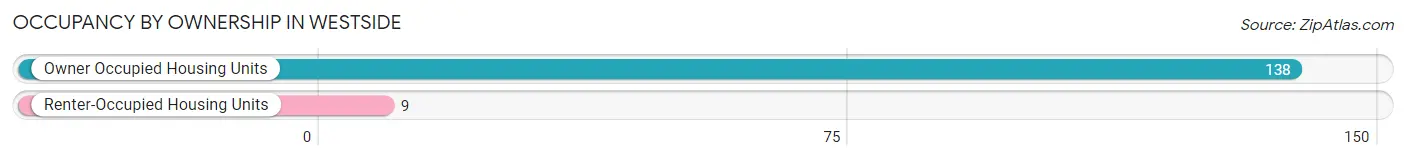
| Occupancy | # Housing Units | % Housing Units |
| Owner Occupied Housing Units | 138 | 93.9% |
| Renter-Occupied Housing Units | 9 | 6.1% |
| Total Occupied Housing Units | 147 | 100.0% |
Occupancy by Household Size in Westside
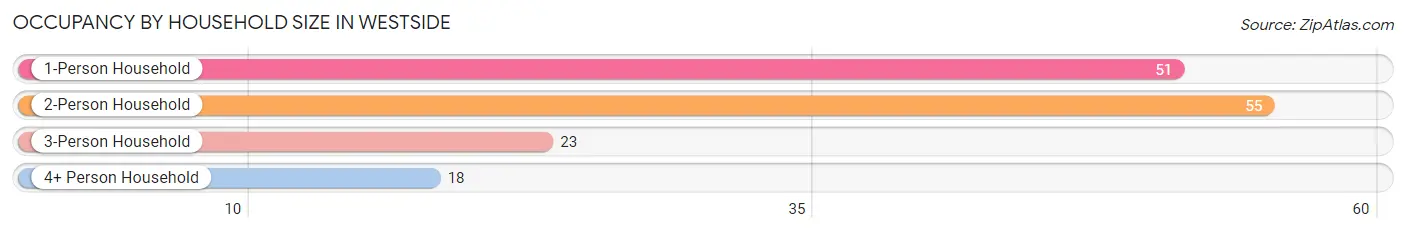
| Household Size | # Housing Units | % Housing Units |
| 1-Person Household | 51 | 34.7% |
| 2-Person Household | 55 | 37.4% |
| 3-Person Household | 23 | 15.7% |
| 4+ Person Household | 18 | 12.2% |
| Total Housing Units | 147 | 100.0% |
Occupancy by Ownership by Household Size in Westside
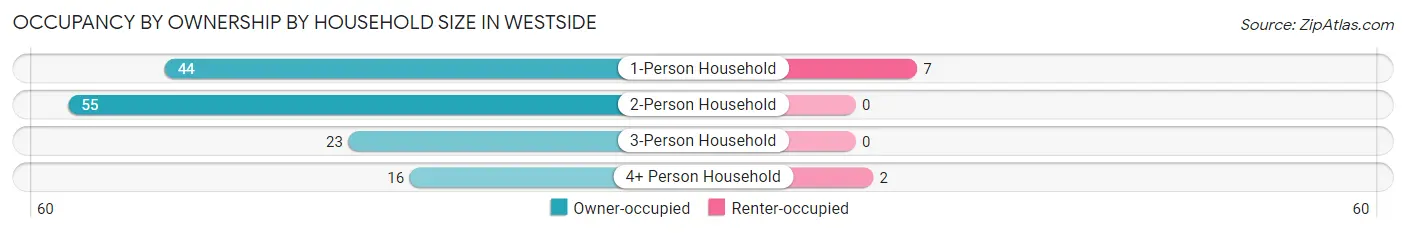
| Household Size | Owner-occupied | Renter-occupied |
| 1-Person Household | 44 (86.3%) | 7 (13.7%) |
| 2-Person Household | 55 (100.0%) | 0 (0.0%) |
| 3-Person Household | 23 (100.0%) | 0 (0.0%) |
| 4+ Person Household | 16 (88.9%) | 2 (11.1%) |
| Total Housing Units | 138 (93.9%) | 9 (6.1%) |
Occupancy by Educational Attainment in Westside
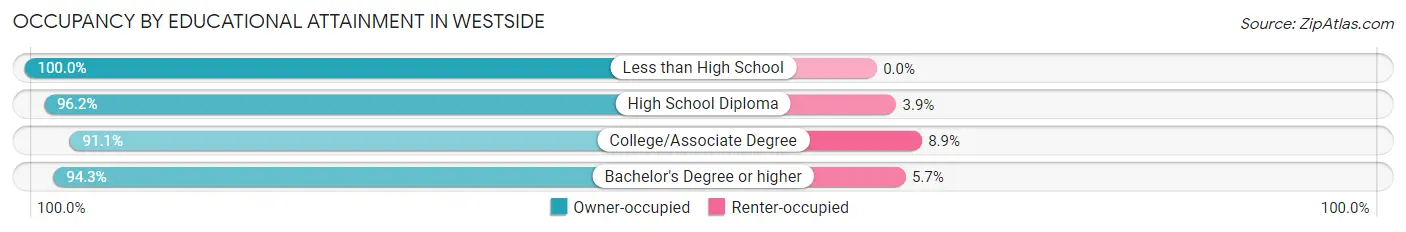
| Household Size | Owner-occupied | Renter-occupied |
| Less than High School | 4 (100.0%) | 0 (0.0%) |
| High School Diploma | 50 (96.2%) | 2 (3.8%) |
| College/Associate Degree | 51 (91.1%) | 5 (8.9%) |
| Bachelor's Degree or higher | 33 (94.3%) | 2 (5.7%) |
Occupancy by Age of Householder in Westside
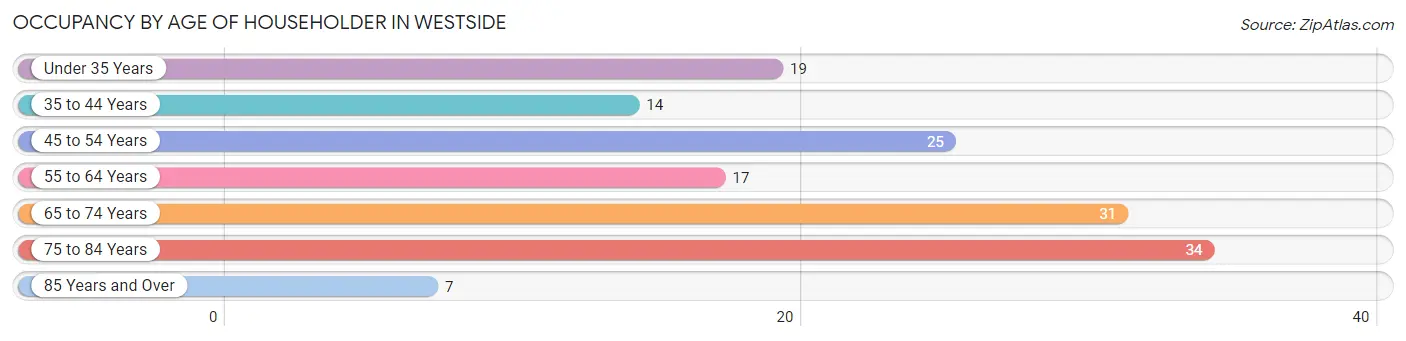
| Age Bracket | # Households | % Households |
| Under 35 Years | 19 | 12.9% |
| 35 to 44 Years | 14 | 9.5% |
| 45 to 54 Years | 25 | 17.0% |
| 55 to 64 Years | 17 | 11.6% |
| 65 to 74 Years | 31 | 21.1% |
| 75 to 84 Years | 34 | 23.1% |
| 85 Years and Over | 7 | 4.8% |
| Total | 147 | 100.0% |
Housing Finances in Westside
Median Income by Occupancy in Westside
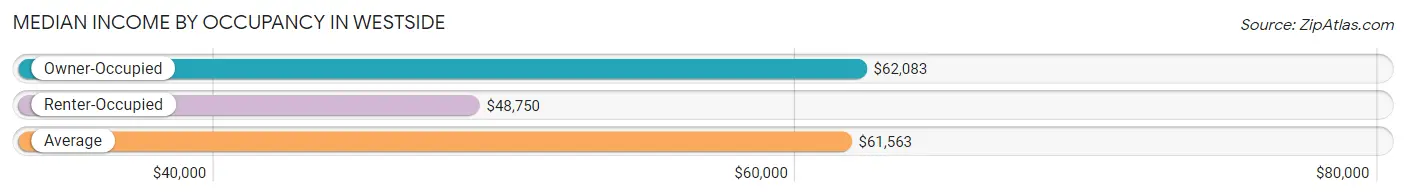
| Occupancy Type | # Households | Median Income |
| Owner-Occupied | 138 (93.9%) | $62,083 |
| Renter-Occupied | 9 (6.1%) | $48,750 |
| Average | 147 (100.0%) | $61,563 |
Occupancy by Householder Income Bracket in Westside
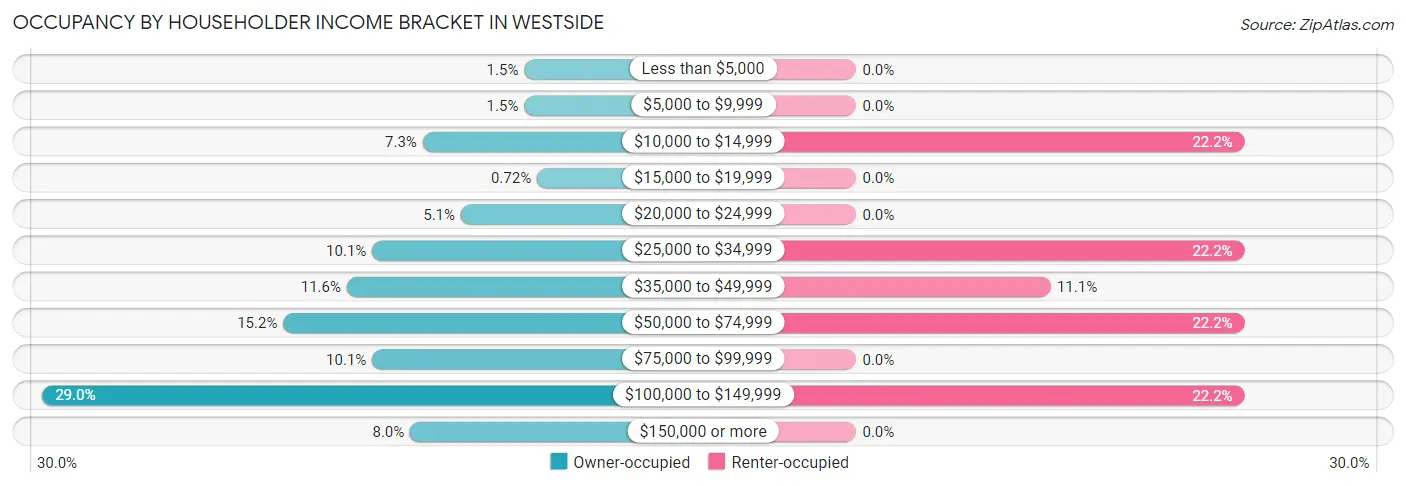
| Income Bracket | Owner-occupied | Renter-occupied |
| Less than $5,000 | 2 (1.5%) | 0 (0.0%) |
| $5,000 to $9,999 | 2 (1.5%) | 0 (0.0%) |
| $10,000 to $14,999 | 10 (7.2%) | 2 (22.2%) |
| $15,000 to $19,999 | 1 (0.7%) | 0 (0.0%) |
| $20,000 to $24,999 | 7 (5.1%) | 0 (0.0%) |
| $25,000 to $34,999 | 14 (10.1%) | 2 (22.2%) |
| $35,000 to $49,999 | 16 (11.6%) | 1 (11.1%) |
| $50,000 to $74,999 | 21 (15.2%) | 2 (22.2%) |
| $75,000 to $99,999 | 14 (10.1%) | 0 (0.0%) |
| $100,000 to $149,999 | 40 (29.0%) | 2 (22.2%) |
| $150,000 or more | 11 (8.0%) | 0 (0.0%) |
| Total | 138 (100.0%) | 9 (100.0%) |
Monthly Housing Cost Tiers in Westside
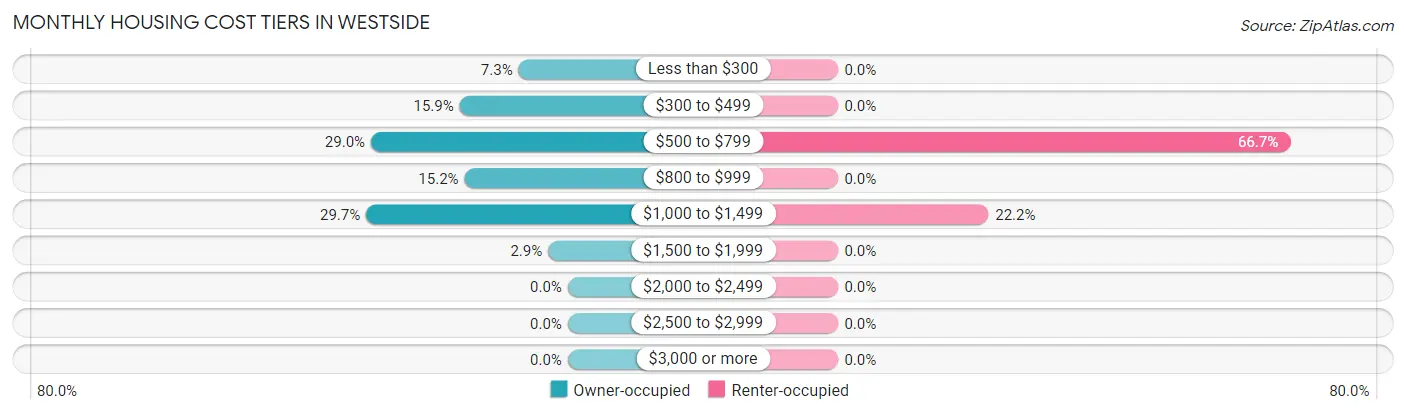
| Monthly Cost | Owner-occupied | Renter-occupied |
| Less than $300 | 10 (7.2%) | 0 (0.0%) |
| $300 to $499 | 22 (15.9%) | 0 (0.0%) |
| $500 to $799 | 40 (29.0%) | 6 (66.7%) |
| $800 to $999 | 21 (15.2%) | 0 (0.0%) |
| $1,000 to $1,499 | 41 (29.7%) | 2 (22.2%) |
| $1,500 to $1,999 | 4 (2.9%) | 0 (0.0%) |
| $2,000 to $2,499 | 0 (0.0%) | 0 (0.0%) |
| $2,500 to $2,999 | 0 (0.0%) | 0 (0.0%) |
| $3,000 or more | 0 (0.0%) | 0 (0.0%) |
| Total | 138 (100.0%) | 9 (100.0%) |
Physical Housing Characteristics in Westside
Housing Structures in Westside
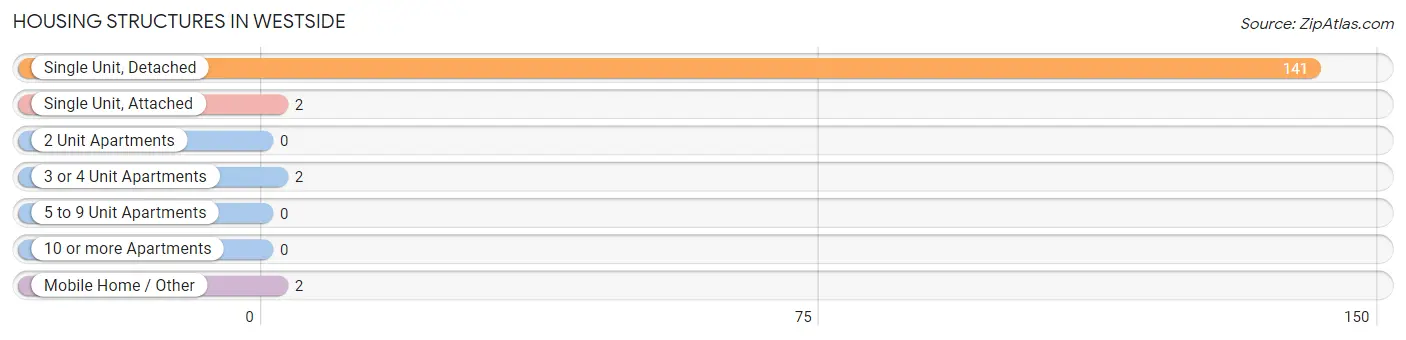
| Structure Type | # Housing Units | % Housing Units |
| Single Unit, Detached | 141 | 95.9% |
| Single Unit, Attached | 2 | 1.4% |
| 2 Unit Apartments | 0 | 0.0% |
| 3 or 4 Unit Apartments | 2 | 1.4% |
| 5 to 9 Unit Apartments | 0 | 0.0% |
| 10 or more Apartments | 0 | 0.0% |
| Mobile Home / Other | 2 | 1.4% |
| Total | 147 | 100.0% |
Housing Structures by Occupancy in Westside

| Structure Type | Owner-occupied | Renter-occupied |
| Single Unit, Detached | 136 (96.5%) | 5 (3.5%) |
| Single Unit, Attached | 2 (100.0%) | 0 (0.0%) |
| 2 Unit Apartments | 0 (0.0%) | 0 (0.0%) |
| 3 or 4 Unit Apartments | 0 (0.0%) | 2 (100.0%) |
| 5 to 9 Unit Apartments | 0 (0.0%) | 0 (0.0%) |
| 10 or more Apartments | 0 (0.0%) | 0 (0.0%) |
| Mobile Home / Other | 0 (0.0%) | 2 (100.0%) |
| Total | 138 (93.9%) | 9 (6.1%) |
Housing Structures by Number of Rooms in Westside
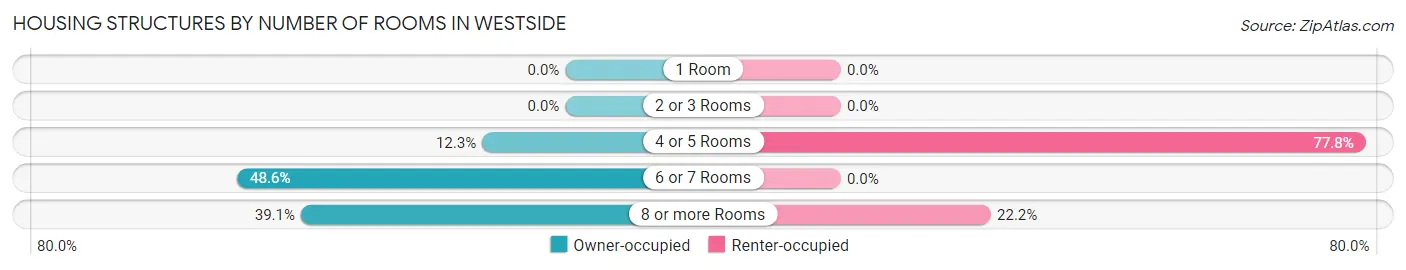
| Number of Rooms | Owner-occupied | Renter-occupied |
| 1 Room | 0 (0.0%) | 0 (0.0%) |
| 2 or 3 Rooms | 0 (0.0%) | 0 (0.0%) |
| 4 or 5 Rooms | 17 (12.3%) | 7 (77.8%) |
| 6 or 7 Rooms | 67 (48.5%) | 0 (0.0%) |
| 8 or more Rooms | 54 (39.1%) | 2 (22.2%) |
| Total | 138 (100.0%) | 9 (100.0%) |
Housing Structure by Heating Type in Westside
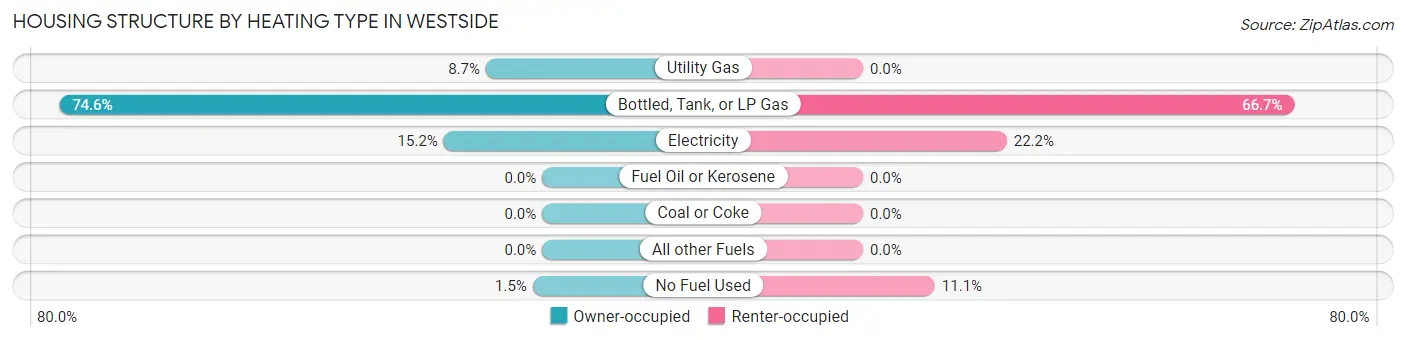
| Heating Type | Owner-occupied | Renter-occupied |
| Utility Gas | 12 (8.7%) | 0 (0.0%) |
| Bottled, Tank, or LP Gas | 103 (74.6%) | 6 (66.7%) |
| Electricity | 21 (15.2%) | 2 (22.2%) |
| Fuel Oil or Kerosene | 0 (0.0%) | 0 (0.0%) |
| Coal or Coke | 0 (0.0%) | 0 (0.0%) |
| All other Fuels | 0 (0.0%) | 0 (0.0%) |
| No Fuel Used | 2 (1.5%) | 1 (11.1%) |
| Total | 138 (100.0%) | 9 (100.0%) |
Household Vehicle Usage in Westside
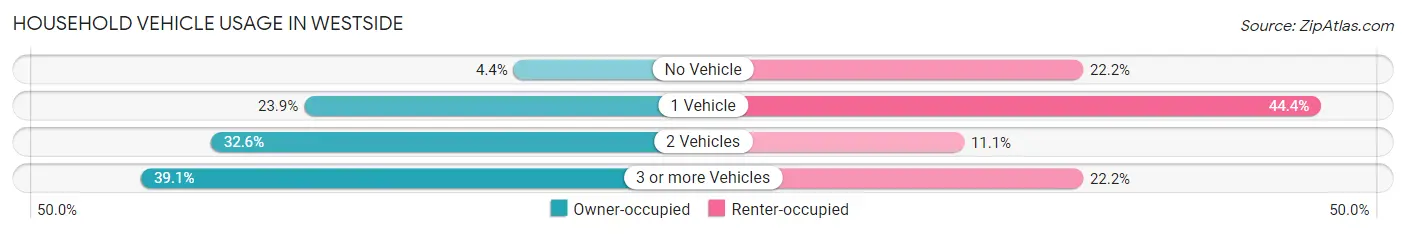
| Vehicles per Household | Owner-occupied | Renter-occupied |
| No Vehicle | 6 (4.3%) | 2 (22.2%) |
| 1 Vehicle | 33 (23.9%) | 4 (44.4%) |
| 2 Vehicles | 45 (32.6%) | 1 (11.1%) |
| 3 or more Vehicles | 54 (39.1%) | 2 (22.2%) |
| Total | 138 (100.0%) | 9 (100.0%) |
Real Estate & Mortgages in Westside
Real Estate and Mortgage Overview in Westside
| Characteristic | Without Mortgage | With Mortgage |
| Housing Units | 60 | 78 |
| Median Property Value | $98,300 | $137,500 |
| Median Household Income | $48,750 | $6 |
| Monthly Housing Costs | $478 | $0 |
| Real Estate Taxes | $1,114 | $2 |
Property Value by Mortgage Status in Westside
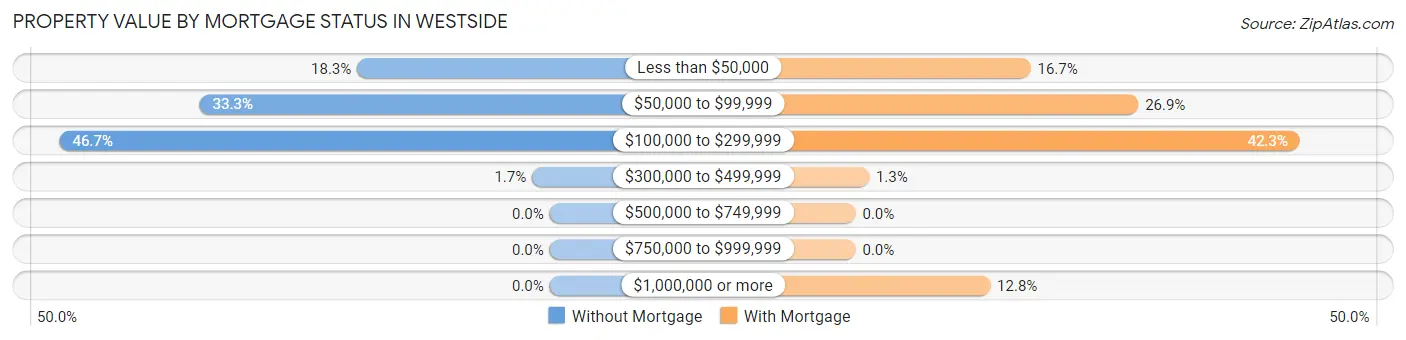
| Property Value | Without Mortgage | With Mortgage |
| Less than $50,000 | 11 (18.3%) | 13 (16.7%) |
| $50,000 to $99,999 | 20 (33.3%) | 21 (26.9%) |
| $100,000 to $299,999 | 28 (46.7%) | 33 (42.3%) |
| $300,000 to $499,999 | 1 (1.7%) | 1 (1.3%) |
| $500,000 to $749,999 | 0 (0.0%) | 0 (0.0%) |
| $750,000 to $999,999 | 0 (0.0%) | 0 (0.0%) |
| $1,000,000 or more | 0 (0.0%) | 10 (12.8%) |
| Total | 60 (100.0%) | 78 (100.0%) |
Household Income by Mortgage Status in Westside
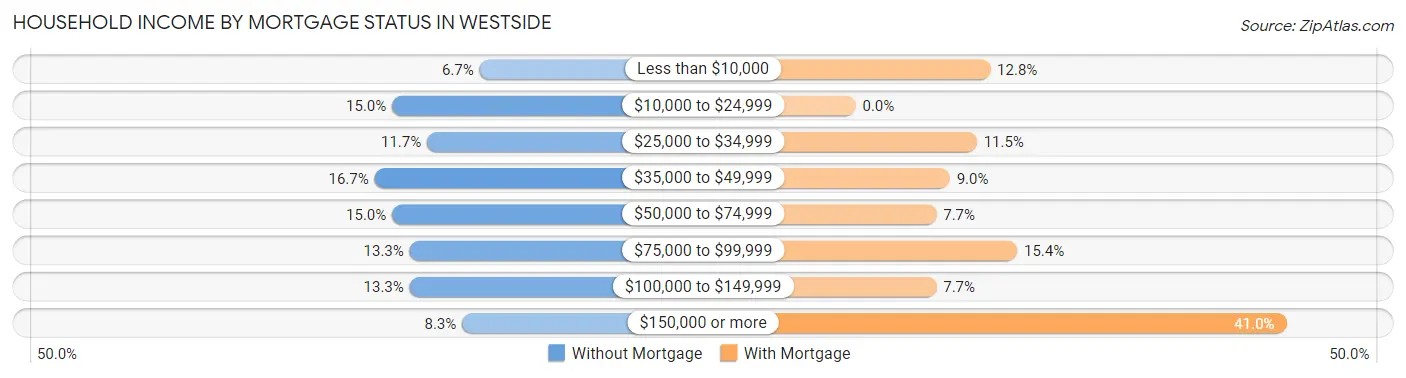
| Household Income | Without Mortgage | With Mortgage |
| Less than $10,000 | 4 (6.7%) | 10 (12.8%) |
| $10,000 to $24,999 | 9 (15.0%) | 0 (0.0%) |
| $25,000 to $34,999 | 7 (11.7%) | 9 (11.5%) |
| $35,000 to $49,999 | 10 (16.7%) | 7 (9.0%) |
| $50,000 to $74,999 | 9 (15.0%) | 6 (7.7%) |
| $75,000 to $99,999 | 8 (13.3%) | 12 (15.4%) |
| $100,000 to $149,999 | 8 (13.3%) | 6 (7.7%) |
| $150,000 or more | 5 (8.3%) | 32 (41.0%) |
| Total | 60 (100.0%) | 78 (100.0%) |
Property Value to Household Income Ratio in Westside
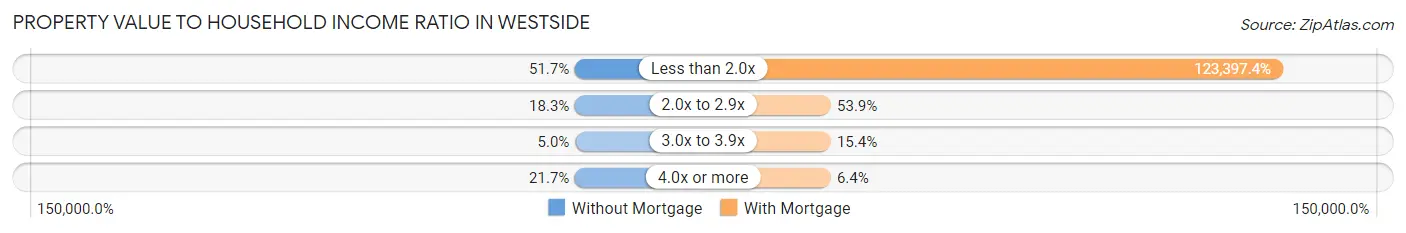
| Value-to-Income Ratio | Without Mortgage | With Mortgage |
| Less than 2.0x | 31 (51.7%) | 96,250 (123,397.4%) |
| 2.0x to 2.9x | 11 (18.3%) | 42 (53.8%) |
| 3.0x to 3.9x | 3 (5.0%) | 12 (15.4%) |
| 4.0x or more | 13 (21.7%) | 5 (6.4%) |
| Total | 60 (100.0%) | 78 (100.0%) |
Real Estate Taxes by Mortgage Status in Westside
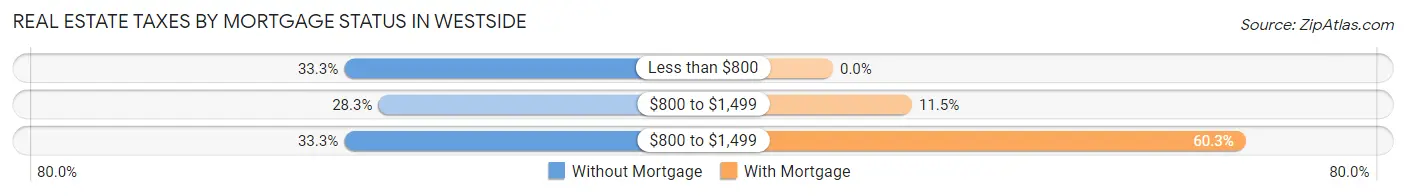
| Property Taxes | Without Mortgage | With Mortgage |
| Less than $800 | 20 (33.3%) | 0 (0.0%) |
| $800 to $1,499 | 17 (28.3%) | 9 (11.5%) |
| $800 to $1,499 | 20 (33.3%) | 47 (60.3%) |
| Total | 60 (100.0%) | 78 (100.0%) |
Health & Disability in Westside
Health Insurance Coverage by Age in Westside
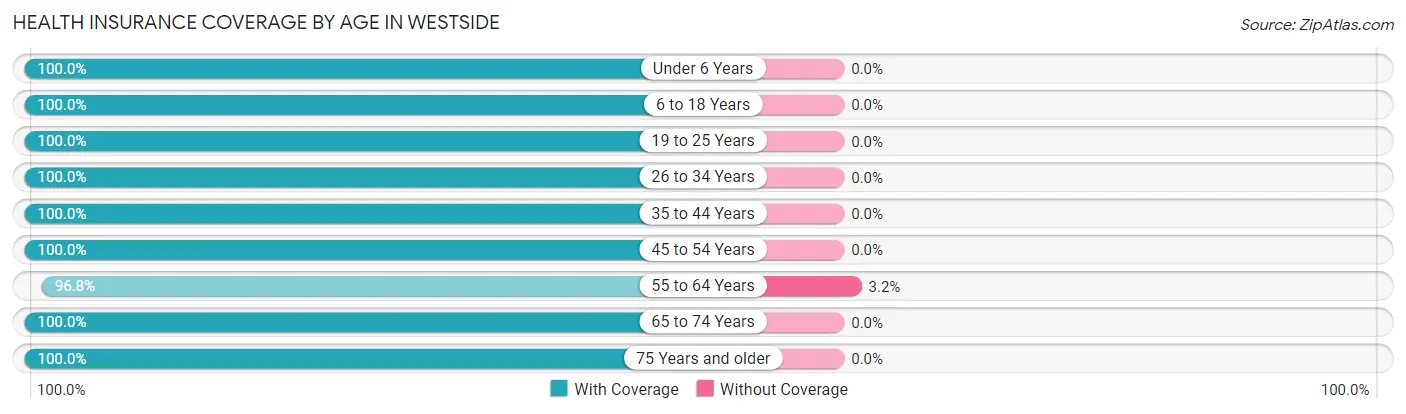
| Age Bracket | With Coverage | Without Coverage |
| Under 6 Years | 30 (100.0%) | 0 (0.0%) |
| 6 to 18 Years | 36 (100.0%) | 0 (0.0%) |
| 19 to 25 Years | 10 (100.0%) | 0 (0.0%) |
| 26 to 34 Years | 27 (100.0%) | 0 (0.0%) |
| 35 to 44 Years | 39 (100.0%) | 0 (0.0%) |
| 45 to 54 Years | 33 (100.0%) | 0 (0.0%) |
| 55 to 64 Years | 30 (96.8%) | 1 (3.2%) |
| 65 to 74 Years | 42 (100.0%) | 0 (0.0%) |
| 75 Years and older | 48 (100.0%) | 0 (0.0%) |
| Total | 295 (99.7%) | 1 (0.3%) |
Health Insurance Coverage by Citizenship Status in Westside
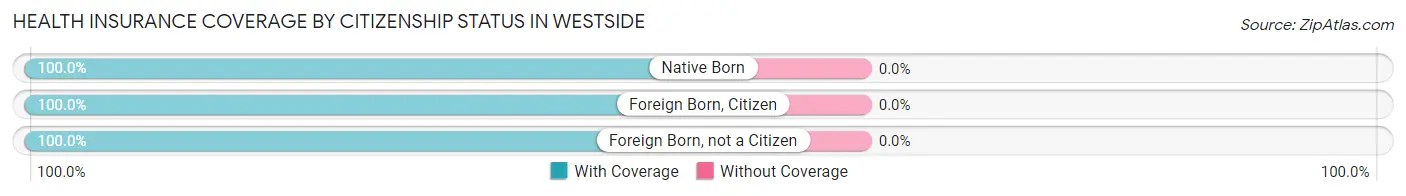
| Citizenship Status | With Coverage | Without Coverage |
| Native Born | 30 (100.0%) | 0 (0.0%) |
| Foreign Born, Citizen | 36 (100.0%) | 0 (0.0%) |
| Foreign Born, not a Citizen | 10 (100.0%) | 0 (0.0%) |
Health Insurance Coverage by Household Income in Westside
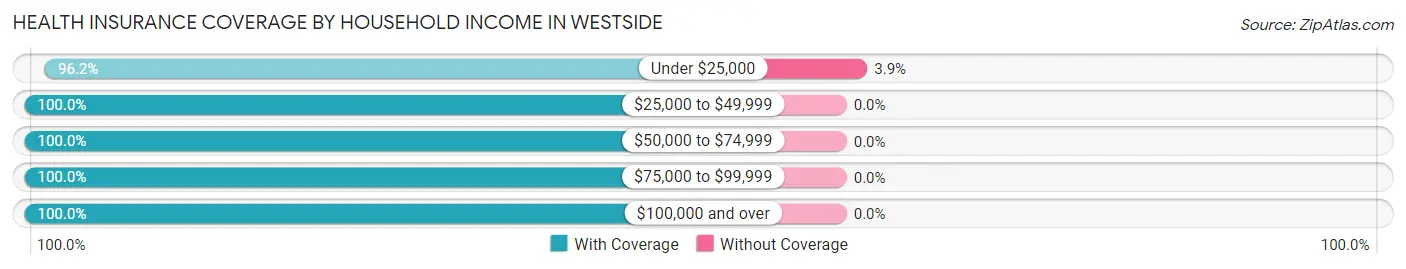
| Household Income | With Coverage | Without Coverage |
| Under $25,000 | 25 (96.2%) | 1 (3.8%) |
| $25,000 to $49,999 | 48 (100.0%) | 0 (0.0%) |
| $50,000 to $74,999 | 36 (100.0%) | 0 (0.0%) |
| $75,000 to $99,999 | 42 (100.0%) | 0 (0.0%) |
| $100,000 and over | 144 (100.0%) | 0 (0.0%) |
Public vs Private Health Insurance Coverage by Age in Westside
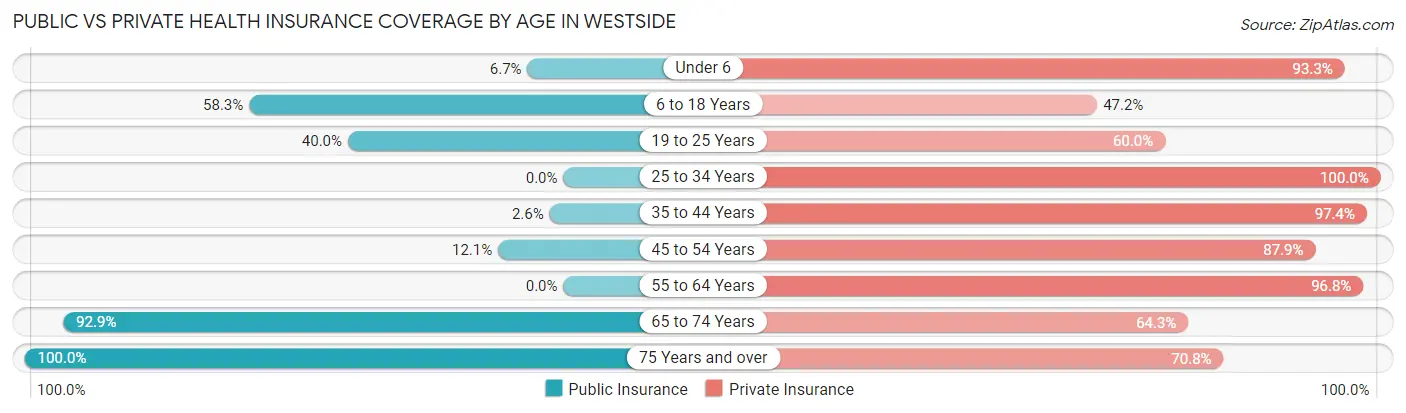
| Age Bracket | Public Insurance | Private Insurance |
| Under 6 | 2 (6.7%) | 28 (93.3%) |
| 6 to 18 Years | 21 (58.3%) | 17 (47.2%) |
| 19 to 25 Years | 4 (40.0%) | 6 (60.0%) |
| 25 to 34 Years | 0 (0.0%) | 27 (100.0%) |
| 35 to 44 Years | 1 (2.6%) | 38 (97.4%) |
| 45 to 54 Years | 4 (12.1%) | 29 (87.9%) |
| 55 to 64 Years | 0 (0.0%) | 30 (96.8%) |
| 65 to 74 Years | 39 (92.9%) | 27 (64.3%) |
| 75 Years and over | 48 (100.0%) | 34 (70.8%) |
| Total | 119 (40.2%) | 236 (79.7%) |
Disability Status by Sex by Age in Westside
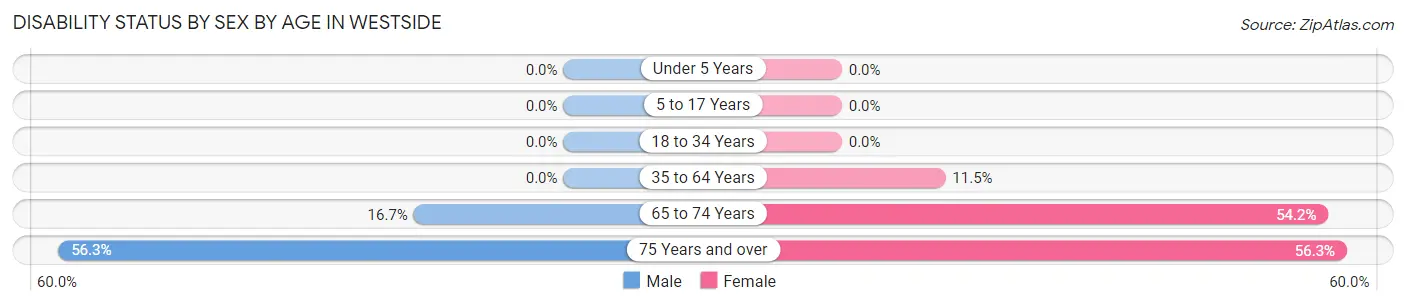
| Age Bracket | Male | Female |
| Under 5 Years | 0 (0.0%) | 0 (0.0%) |
| 5 to 17 Years | 0 (0.0%) | 0 (0.0%) |
| 18 to 34 Years | 0 (0.0%) | 0 (0.0%) |
| 35 to 64 Years | 0 (0.0%) | 6 (11.5%) |
| 65 to 74 Years | 3 (16.7%) | 13 (54.2%) |
| 75 Years and over | 9 (56.2%) | 18 (56.2%) |
Disability Class by Sex by Age in Westside
Disability Class: Hearing Difficulty
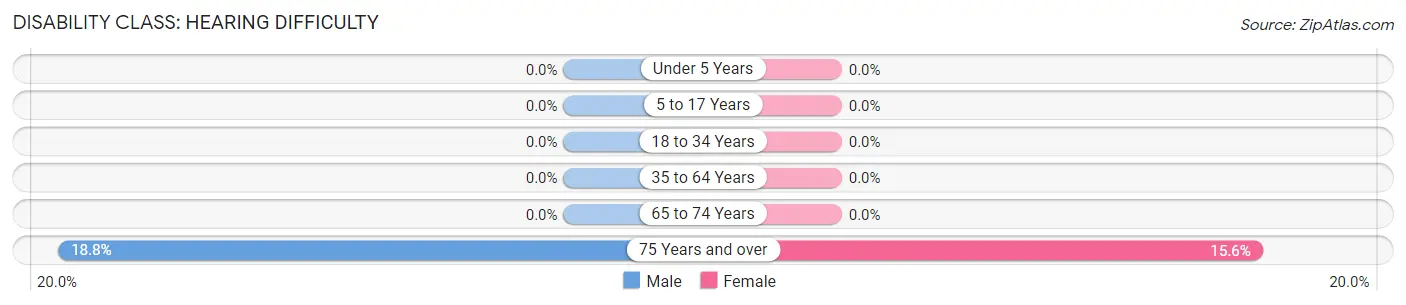
| Age Bracket | Male | Female |
| Under 5 Years | 0 (0.0%) | 0 (0.0%) |
| 5 to 17 Years | 0 (0.0%) | 0 (0.0%) |
| 18 to 34 Years | 0 (0.0%) | 0 (0.0%) |
| 35 to 64 Years | 0 (0.0%) | 0 (0.0%) |
| 65 to 74 Years | 0 (0.0%) | 0 (0.0%) |
| 75 Years and over | 3 (18.8%) | 5 (15.6%) |
Disability Class: Vision Difficulty
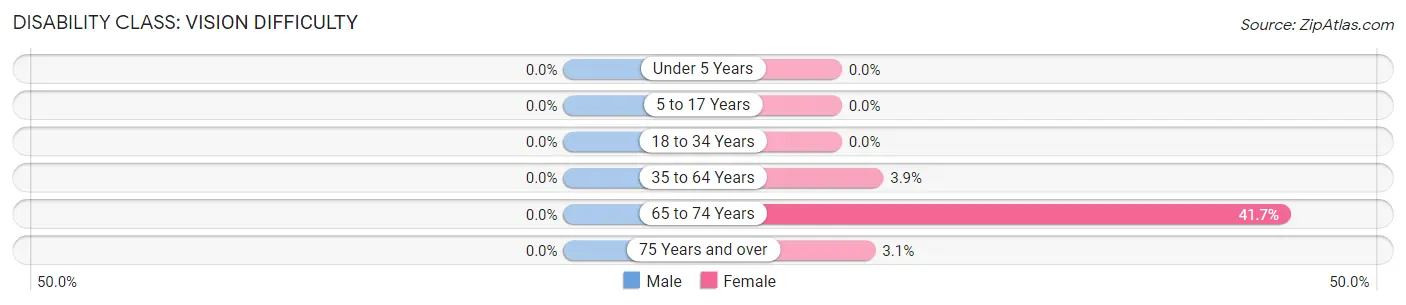
| Age Bracket | Male | Female |
| Under 5 Years | 0 (0.0%) | 0 (0.0%) |
| 5 to 17 Years | 0 (0.0%) | 0 (0.0%) |
| 18 to 34 Years | 0 (0.0%) | 0 (0.0%) |
| 35 to 64 Years | 0 (0.0%) | 2 (3.8%) |
| 65 to 74 Years | 0 (0.0%) | 10 (41.7%) |
| 75 Years and over | 0 (0.0%) | 1 (3.1%) |
Disability Class: Cognitive Difficulty
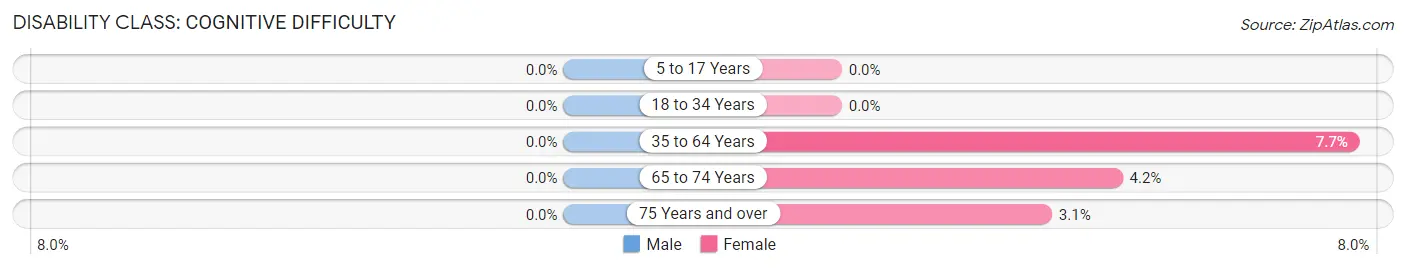
| Age Bracket | Male | Female |
| 5 to 17 Years | 0 (0.0%) | 0 (0.0%) |
| 18 to 34 Years | 0 (0.0%) | 0 (0.0%) |
| 35 to 64 Years | 0 (0.0%) | 4 (7.7%) |
| 65 to 74 Years | 0 (0.0%) | 1 (4.2%) |
| 75 Years and over | 0 (0.0%) | 1 (3.1%) |
Disability Class: Ambulatory Difficulty
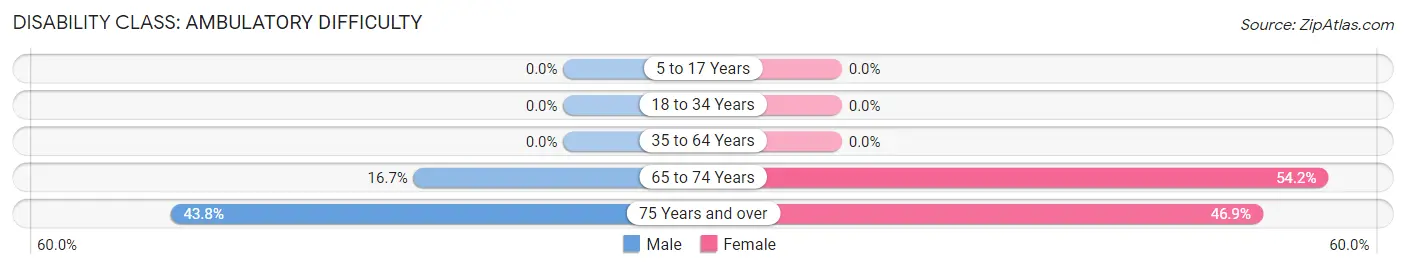
| Age Bracket | Male | Female |
| 5 to 17 Years | 0 (0.0%) | 0 (0.0%) |
| 18 to 34 Years | 0 (0.0%) | 0 (0.0%) |
| 35 to 64 Years | 0 (0.0%) | 0 (0.0%) |
| 65 to 74 Years | 3 (16.7%) | 13 (54.2%) |
| 75 Years and over | 7 (43.8%) | 15 (46.9%) |
Disability Class: Self-Care Difficulty
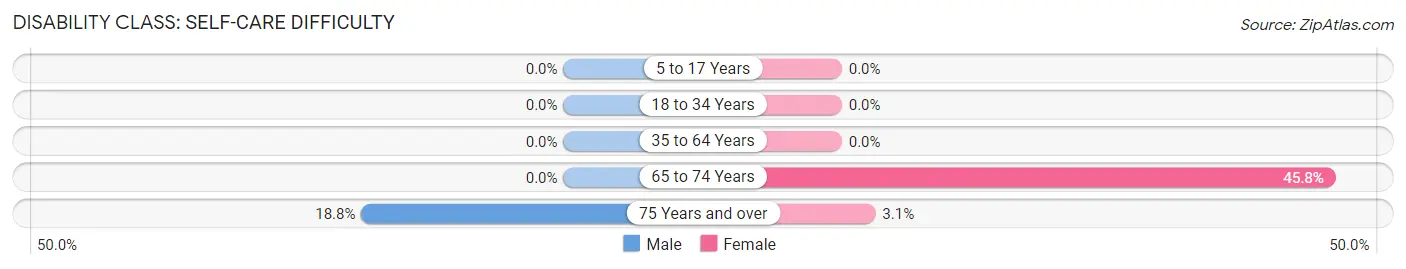
| Age Bracket | Male | Female |
| 5 to 17 Years | 0 (0.0%) | 0 (0.0%) |
| 18 to 34 Years | 0 (0.0%) | 0 (0.0%) |
| 35 to 64 Years | 0 (0.0%) | 0 (0.0%) |
| 65 to 74 Years | 0 (0.0%) | 11 (45.8%) |
| 75 Years and over | 3 (18.8%) | 1 (3.1%) |
Technology Access in Westside
Computing Device Access in Westside
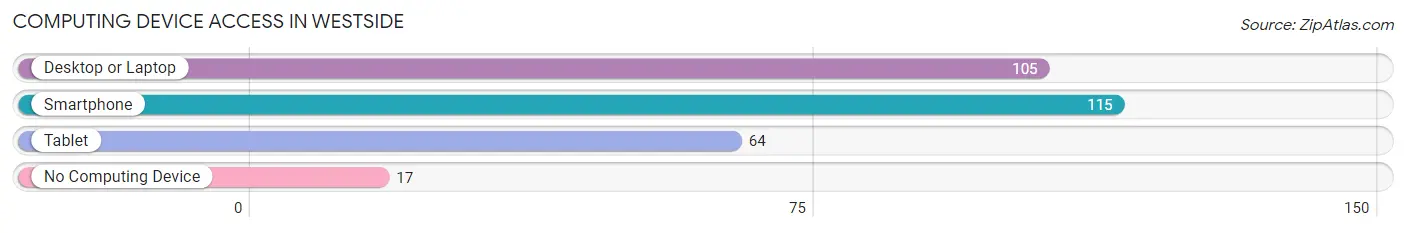
| Device Type | # Households | % Households |
| Desktop or Laptop | 105 | 71.4% |
| Smartphone | 115 | 78.2% |
| Tablet | 64 | 43.5% |
| No Computing Device | 17 | 11.6% |
| Total | 147 | 100.0% |
Internet Access in Westside
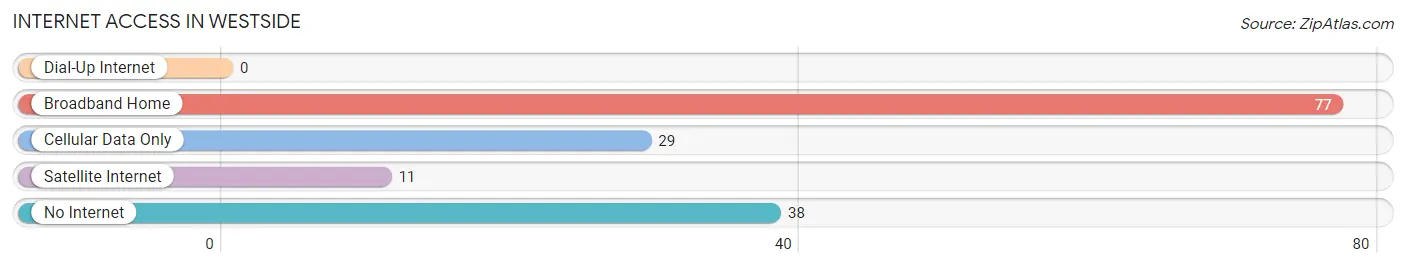
| Internet Type | # Households | % Households |
| Dial-Up Internet | 0 | 0.0% |
| Broadband Home | 77 | 52.4% |
| Cellular Data Only | 29 | 19.7% |
| Satellite Internet | 11 | 7.5% |
| No Internet | 38 | 25.9% |
| Total | 147 | 100.0% |
Westside Summary
Westside, Iowa is a small city located in the western part of the state, just south of the Missouri River. It is part of the Council Bluffs metropolitan area and is home to a population of approximately 2,500 people. The city is known for its small-town charm and its close proximity to Omaha, Nebraska.
Geography
Westside is located in the western part of Iowa, just south of the Missouri River. It is part of the Council Bluffs metropolitan area and is bordered by the cities of Council Bluffs, Carter Lake, and Crescent. The city is situated on the western edge of the Loess Hills, a region of rolling hills and bluffs that were formed by wind-blown silt deposits. The city is located at an elevation of 1,068 feet above sea level.
The climate in Westside is classified as humid continental, with hot, humid summers and cold, dry winters. The average annual temperature is around 50 degrees Fahrenheit, with average highs in the summer reaching into the mid-80s and lows in the winter dipping into the low 20s. The city receives an average of 36 inches of precipitation per year, with most of it falling in the spring and summer months.
Economy
Westside’s economy is largely based on agriculture and manufacturing. The city is home to several large agricultural operations, including a large hog farm and a large dairy farm. The city also has several manufacturing plants, including a plastics plant and a metal fabrication plant.
Westside is also home to several small businesses, including restaurants, retail stores, and service providers. The city is also home to a small airport, which serves as a hub for private and corporate aircraft.
Demographics
As of the 2010 census, Westside had a population of 2,500 people. The racial makeup of the city was 95.2% White, 0.8% African American, 0.4% Native American, 0.4% Asian, 0.2% Pacific Islander, and 2.8% from other races. Hispanic or Latino of any race were 4.4% of the population.
The median household income in Westside was $45,000, and the median family income was $50,000. The per capita income for the city was $20,000. About 11.2% of families and 13.2% of the population were below the poverty line, including 17.2% of those under age 18 and 8.4% of those age 65 or over.
Westside is served by the Council Bluffs Community School District. The city is home to one elementary school, one middle school, and one high school. The city also has several private schools, including a Catholic school and a Lutheran school.
Westside is a small city with a lot of charm and a strong sense of community. It is a great place to live and work, and it offers a variety of activities and amenities for its residents. With its close proximity to Omaha, Nebraska, Westside is a great place to call home.
Common Questions
What is Per Capita Income in Westside?
Per Capita income in Westside is $38,535.
What is the Median Family Income in Westside?
Median Family Income in Westside is $99,375.
What is the Median Household income in Westside?
Median Household Income in Westside is $61,563.
What is Income or Wage Gap in Westside?
Income or Wage Gap in Westside is 1.2%.
Women in Westside earn 98.8 cents for every dollar earned by a man.
What is Inequality or Gini Index in Westside?
Inequality or Gini Index in Westside is 0.40.
What is the Total Population of Westside?
Total Population of Westside is 296.
What is the Total Male Population of Westside?
Total Male Population of Westside is 152.
What is the Total Female Population of Westside?
Total Female Population of Westside is 144.
What is the Ratio of Males per 100 Females in Westside?
There are 105.56 Males per 100 Females in Westside.
What is the Ratio of Females per 100 Males in Westside?
There are 94.74 Females per 100 Males in Westside.
What is the Median Population Age in Westside?
Median Population Age in Westside is 45.5 Years.
What is the Average Family Size in Westside
Average Family Size in Westside is 2.6 People.
What is the Average Household Size in Westside
Average Household Size in Westside is 2.0 People.
How Large is the Labor Force in Westside?
There are 153 People in the Labor Forcein in Westside.
What is the Percentage of People in the Labor Force in Westside?
65.9% of People are in the Labor Force in Westside.