Webster City, IA Map & Demographics
Webster City Map
Webster City Overview
$31,759
PER CAPITA INCOME
$74,112
AVG FAMILY INCOME
$59,665
AVG HOUSEHOLD INCOME
48.3%
WAGE / INCOME GAP [ % ]
51.7¢/ $1
WAGE / INCOME GAP [ $ ]
0.40
INEQUALITY / GINI INDEX
7,787
TOTAL POPULATION
4,174
MALE POPULATION
3,613
FEMALE POPULATION
115.53
MALES / 100 FEMALES
86.56
FEMALES / 100 MALES
40.8
MEDIAN AGE
3.1
AVG FAMILY SIZE
2.3
AVG HOUSEHOLD SIZE
3,732
LABOR FORCE [ PEOPLE ]
60.2%
PERCENT IN LABOR FORCE
4.4%
UNEMPLOYMENT RATE
Webster City Zip Codes
Webster City Area Codes
Income in Webster City
Income Overview in Webster City
Per Capita Income in Webster City is $31,759, while median incomes of families and households are $74,112 and $59,665 respectively.
| Characteristic | Number | Measure |
| Per Capita Income | 7,787 | $31,759 |
| Median Family Income | 1,814 | $74,112 |
| Mean Family Income | 1,814 | $87,443 |
| Median Household Income | 3,292 | $59,665 |
| Mean Household Income | 3,292 | $72,535 |
| Income Deficit | 1,814 | $0 |
| Wage / Income Gap (%) | 7,787 | 48.30% |
| Wage / Income Gap ($) | 7,787 | 51.70¢ per $1 |
| Gini / Inequality Index | 7,787 | 0.40 |
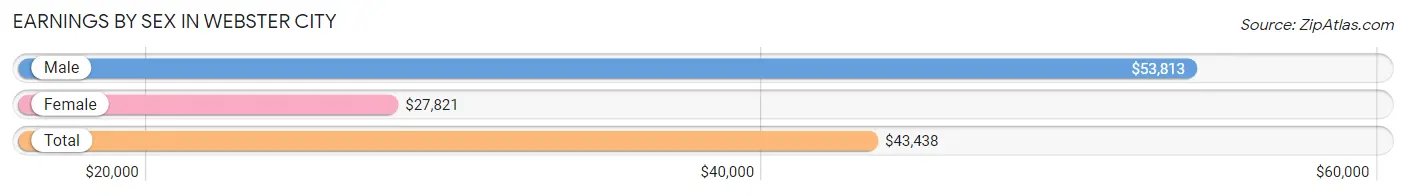
Earnings by Sex in Webster City
Average Earnings in Webster City are $43,438, $53,813 for men and $27,821 for women, a difference of 48.3%.
| Sex | Number | Average Earnings |
| Male | 2,142 (55.6%) | $53,813 |
| Female | 1,708 (44.4%) | $27,821 |
| Total | 3,850 (100.0%) | $43,438 |
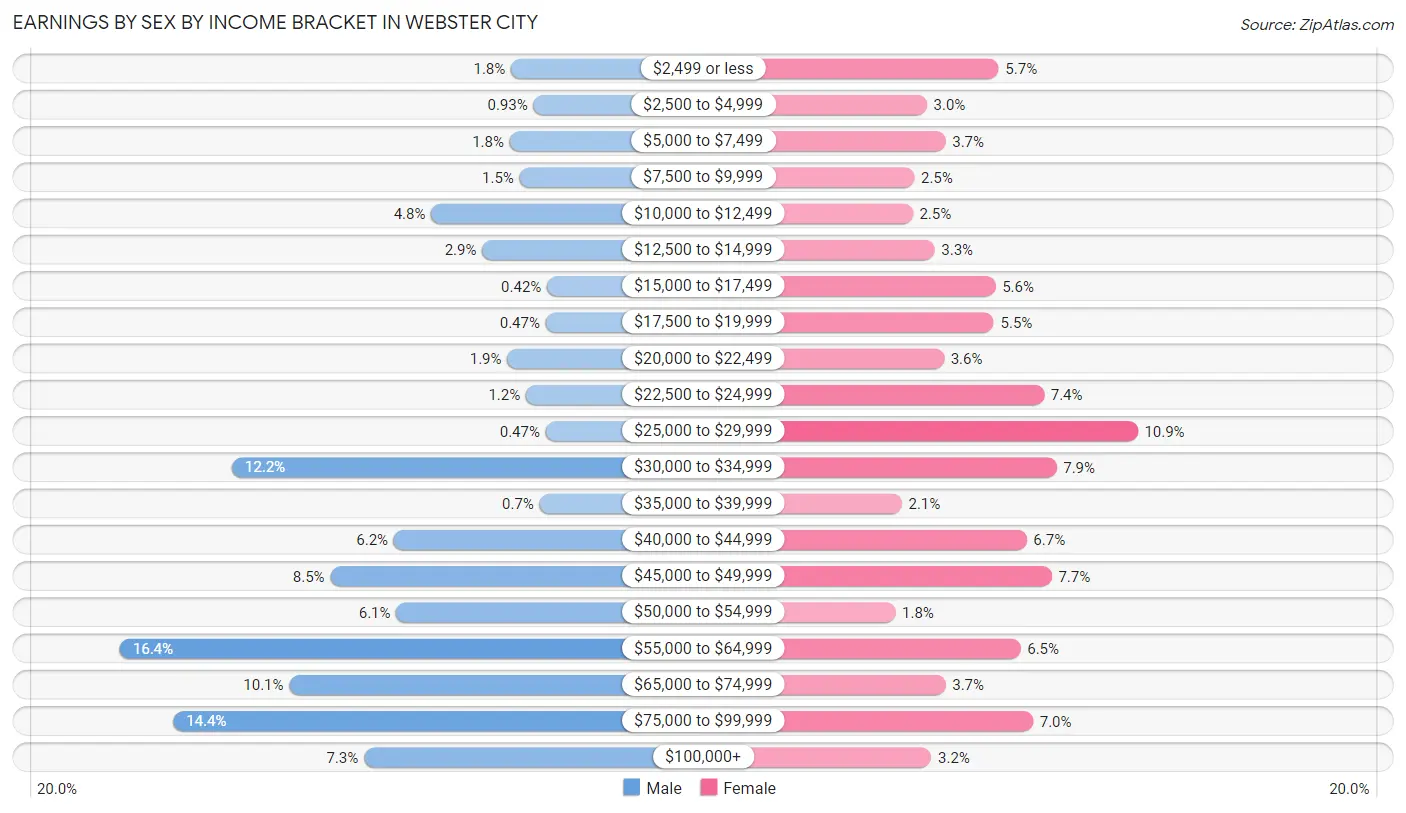
Earnings by Sex by Income Bracket in Webster City
The most common earnings brackets in Webster City are $55,000 to $64,999 for men (352 | 16.4%) and $25,000 to $29,999 for women (186 | 10.9%).
| Income | Male | Female |
| $2,499 or less | 38 (1.8%) | 97 (5.7%) |
| $2,500 to $4,999 | 20 (0.9%) | 51 (3.0%) |
| $5,000 to $7,499 | 39 (1.8%) | 63 (3.7%) |
| $7,500 to $9,999 | 31 (1.5%) | 43 (2.5%) |
| $10,000 to $12,499 | 102 (4.8%) | 42 (2.5%) |
| $12,500 to $14,999 | 61 (2.9%) | 56 (3.3%) |
| $15,000 to $17,499 | 9 (0.4%) | 95 (5.6%) |
| $17,500 to $19,999 | 10 (0.5%) | 94 (5.5%) |
| $20,000 to $22,499 | 41 (1.9%) | 62 (3.6%) |
| $22,500 to $24,999 | 26 (1.2%) | 126 (7.4%) |
| $25,000 to $29,999 | 10 (0.5%) | 186 (10.9%) |
| $30,000 to $34,999 | 262 (12.2%) | 134 (7.9%) |
| $35,000 to $39,999 | 15 (0.7%) | 35 (2.1%) |
| $40,000 to $44,999 | 132 (6.2%) | 115 (6.7%) |
| $45,000 to $49,999 | 183 (8.5%) | 131 (7.7%) |
| $50,000 to $54,999 | 130 (6.1%) | 31 (1.8%) |
| $55,000 to $64,999 | 352 (16.4%) | 111 (6.5%) |
| $65,000 to $74,999 | 216 (10.1%) | 63 (3.7%) |
| $75,000 to $99,999 | 309 (14.4%) | 119 (7.0%) |
| $100,000+ | 156 (7.3%) | 54 (3.2%) |
| Total | 2,142 (100.0%) | 1,708 (100.0%) |
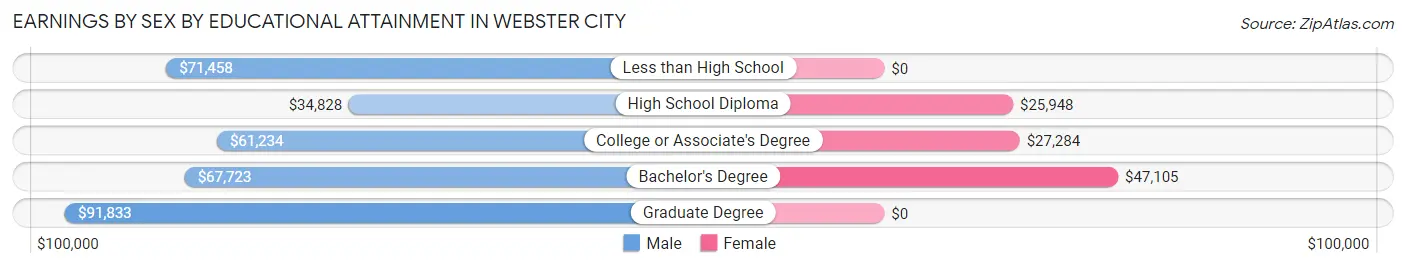
Earnings by Sex by Educational Attainment in Webster City
Average earnings in Webster City are $56,415 for men and $28,768 for women, a difference of 49.0%. Men with an educational attainment of graduate degree enjoy the highest average annual earnings of $91,833, while those with high school diploma education earn the least with $34,828. Women with an educational attainment of bachelor's degree earn the most with the average annual earnings of $47,105, while those with high school diploma education have the smallest earnings of $25,948.
| Educational Attainment | Male Income | Female Income |
| Less than High School | $71,458 | $0 |
| High School Diploma | $34,828 | $25,948 |
| College or Associate's Degree | $61,234 | $27,284 |
| Bachelor's Degree | $67,723 | $47,105 |
| Graduate Degree | $91,833 | $0 |
| Total | $56,415 | $28,768 |
Family Income in Webster City
Family Income Brackets in Webster City
According to the Webster City family income data, there are 385 families falling into the $50,000 to $74,999 income range, which is the most common income bracket and makes up 21.2% of all families. Conversely, the $10,000 to $14,999 income bracket is the least frequent group with only 38 families (2.1%) belonging to this category.
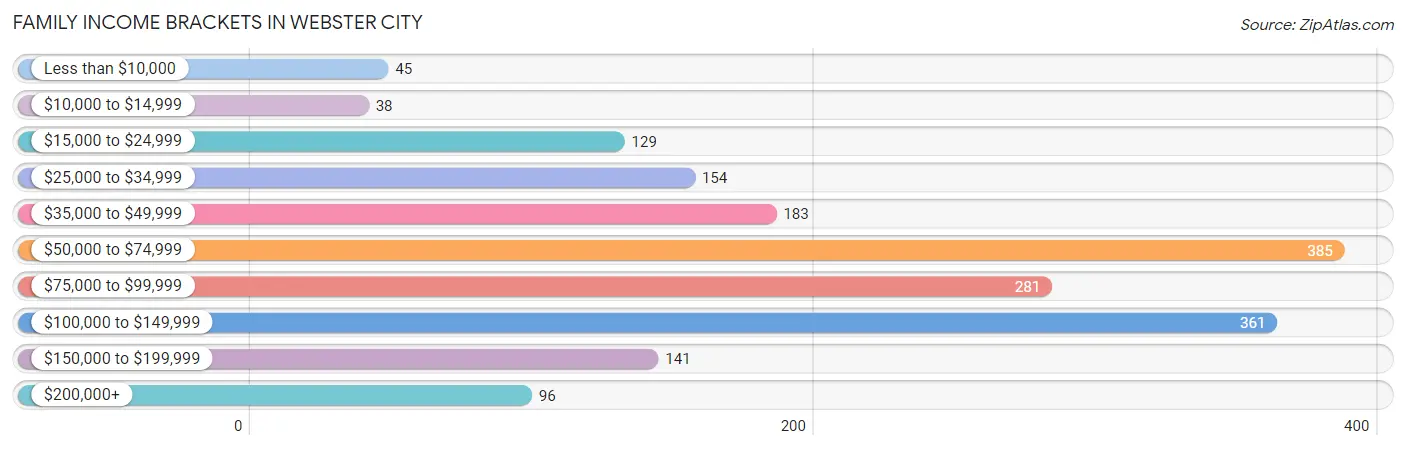
| Income Bracket | # Families | % Families |
| Less than $10,000 | 45 | 2.5% |
| $10,000 to $14,999 | 38 | 2.1% |
| $15,000 to $24,999 | 129 | 7.1% |
| $25,000 to $34,999 | 154 | 8.5% |
| $35,000 to $49,999 | 183 | 10.1% |
| $50,000 to $74,999 | 385 | 21.2% |
| $75,000 to $99,999 | 281 | 15.5% |
| $100,000 to $149,999 | 361 | 19.9% |
| $150,000 to $199,999 | 141 | 7.8% |
| $200,000+ | 96 | 5.3% |
Family Income by Famaliy Size in Webster City
5-person families (271 | 14.9%) account for the highest median family income in Webster City with $87,341 per family, while 2-person families (858 | 47.3%) have the highest median income of $29,181 per family member.
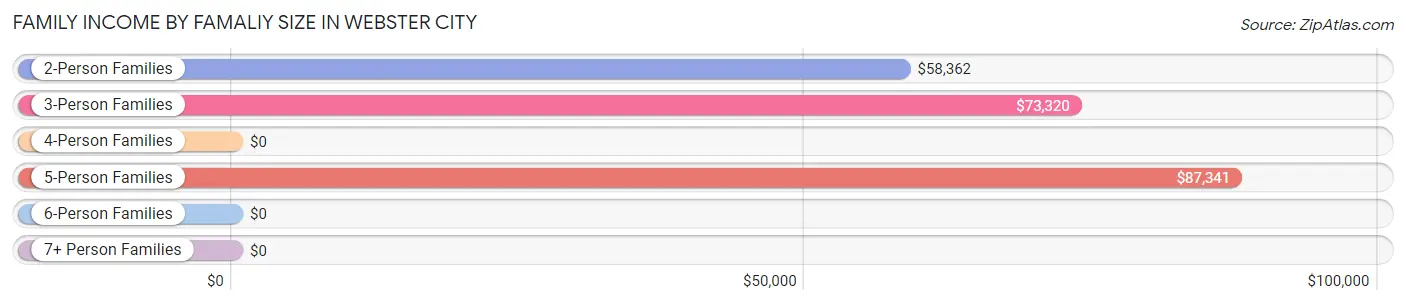
| Income Bracket | # Families | Median Income |
| 2-Person Families | 858 (47.3%) | $58,362 |
| 3-Person Families | 402 (22.2%) | $73,320 |
| 4-Person Families | 256 (14.1%) | $0 |
| 5-Person Families | 271 (14.9%) | $87,341 |
| 6-Person Families | 22 (1.2%) | $0 |
| 7+ Person Families | 5 (0.3%) | $0 |
| Total | 1,814 (100.0%) | $74,112 |
Family Income by Number of Earners in Webster City
The median family income in Webster City is $74,112, with families comprising 3+ earners (115) having the highest median family income of $134,306, while families with no earners (280) have the lowest median family income of $48,095, accounting for 6.3% and 15.4% of families, respectively.
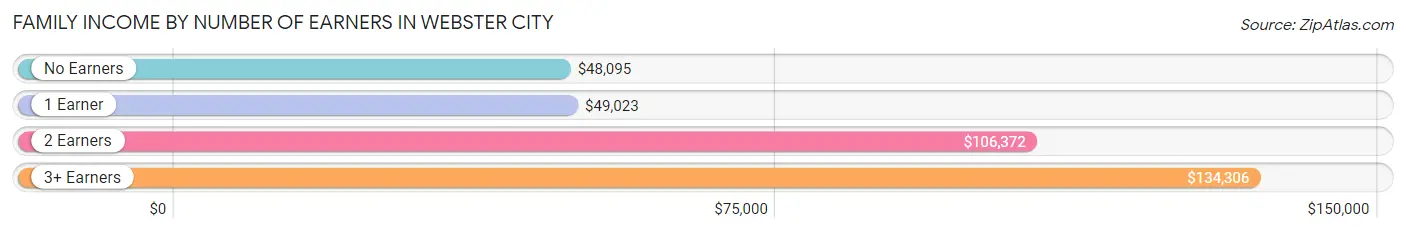
| Number of Earners | # Families | Median Income |
| No Earners | 280 (15.4%) | $48,095 |
| 1 Earner | 548 (30.2%) | $49,023 |
| 2 Earners | 871 (48.0%) | $106,372 |
| 3+ Earners | 115 (6.3%) | $134,306 |
| Total | 1,814 (100.0%) | $74,112 |
Household Income in Webster City
Household Income Brackets in Webster City
With 685 households falling in the category, the $50,000 to $74,999 income range is the most frequent in Webster City, accounting for 20.8% of all households. In contrast, only 109 households (3.3%) fall into the $200,000+ income bracket, making it the least populous group.
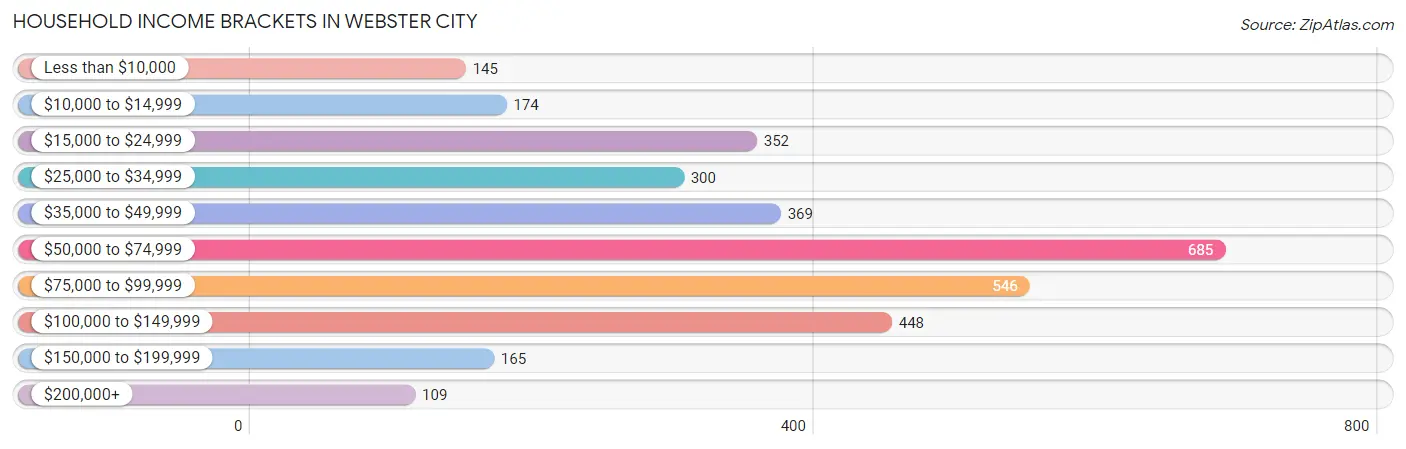
| Income Bracket | # Households | % Households |
| Less than $10,000 | 145 | 4.4% |
| $10,000 to $14,999 | 174 | 5.3% |
| $15,000 to $24,999 | 352 | 10.7% |
| $25,000 to $34,999 | 300 | 9.1% |
| $35,000 to $49,999 | 369 | 11.2% |
| $50,000 to $74,999 | 685 | 20.8% |
| $75,000 to $99,999 | 546 | 16.6% |
| $100,000 to $149,999 | 448 | 13.6% |
| $150,000 to $199,999 | 165 | 5.0% |
| $200,000+ | 109 | 3.3% |
Household Income by Householder Age in Webster City
The median household income in Webster City is $59,665, with the highest median household income of $83,802 found in the 45 to 64 years age bracket for the primary householder. A total of 945 households (28.7%) fall into this category. Meanwhile, the 15 to 24 years age bracket for the primary householder has the lowest median household income of $0, with 161 households (4.9%) in this group.
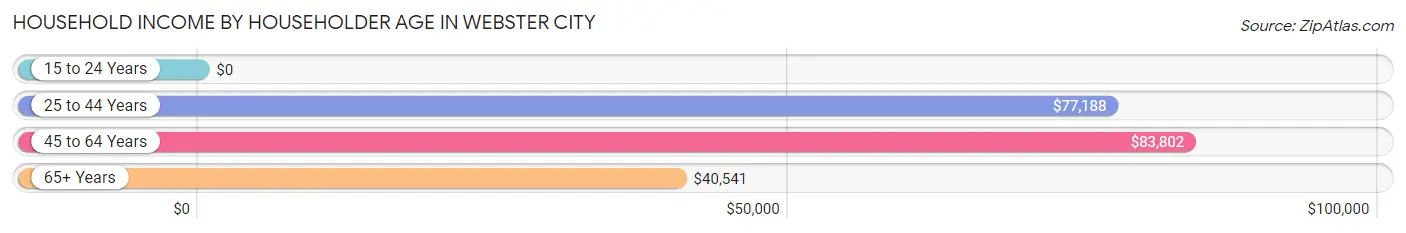
| Income Bracket | # Households | Median Income |
| 15 to 24 Years | 161 (4.9%) | $0 |
| 25 to 44 Years | 1,018 (30.9%) | $77,188 |
| 45 to 64 Years | 945 (28.7%) | $83,802 |
| 65+ Years | 1,168 (35.5%) | $40,541 |
| Total | 3,292 (100.0%) | $59,665 |
Poverty in Webster City
Income Below Poverty by Sex and Age in Webster City
With 7.9% poverty level for males and 9.2% for females among the residents of Webster City, 15 year old males and 15 year old females are the most vulnerable to poverty, with 29 males (35.8%) and 17 females (42.5%) in their respective age groups living below the poverty level.
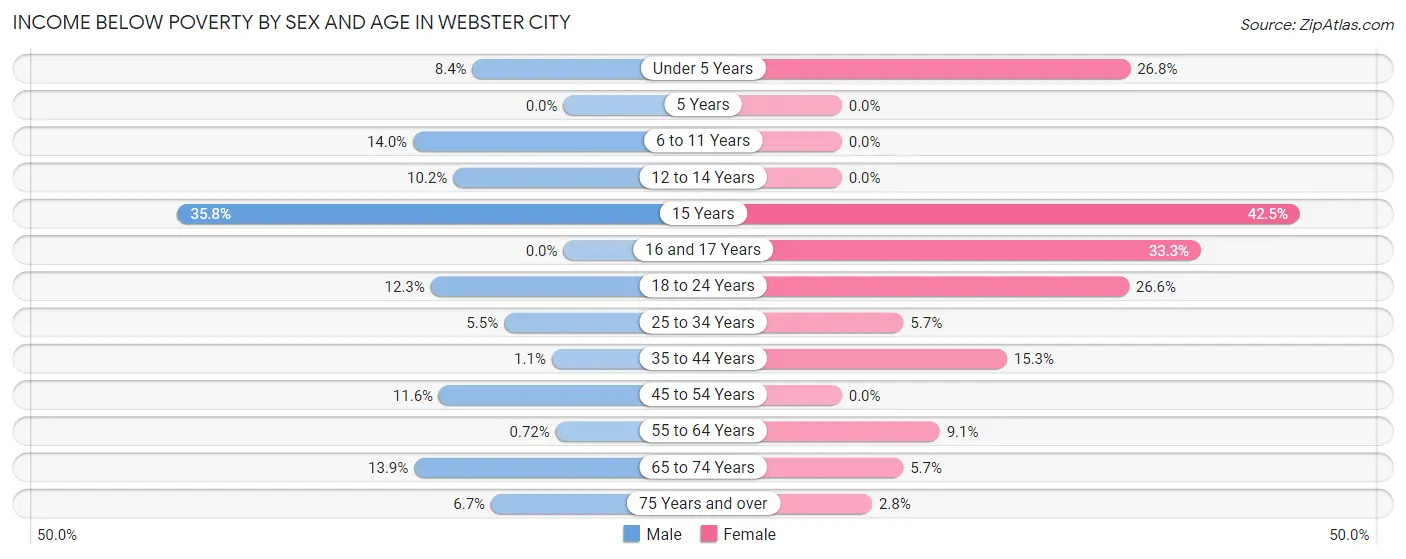
| Age Bracket | Male | Female |
| Under 5 Years | 20 (8.4%) | 53 (26.8%) |
| 5 Years | 0 (0.0%) | 0 (0.0%) |
| 6 to 11 Years | 43 (14.0%) | 0 (0.0%) |
| 12 to 14 Years | 13 (10.2%) | 0 (0.0%) |
| 15 Years | 29 (35.8%) | 17 (42.5%) |
| 16 and 17 Years | 0 (0.0%) | 17 (33.3%) |
| 18 to 24 Years | 35 (12.3%) | 77 (26.6%) |
| 25 to 34 Years | 22 (5.5%) | 23 (5.7%) |
| 35 to 44 Years | 7 (1.1%) | 72 (15.3%) |
| 45 to 54 Years | 58 (11.6%) | 0 (0.0%) |
| 55 to 64 Years | 3 (0.7%) | 32 (9.1%) |
| 65 to 74 Years | 64 (13.9%) | 24 (5.7%) |
| 75 Years and over | 26 (6.7%) | 12 (2.8%) |
| Total | 320 (7.9%) | 327 (9.2%) |
Income Above Poverty by Sex and Age in Webster City
According to the poverty statistics in Webster City, males aged 5 years and females aged 6 to 11 years are the age groups that are most secure financially, with 100.0% of males and 100.0% of females in these age groups living above the poverty line.
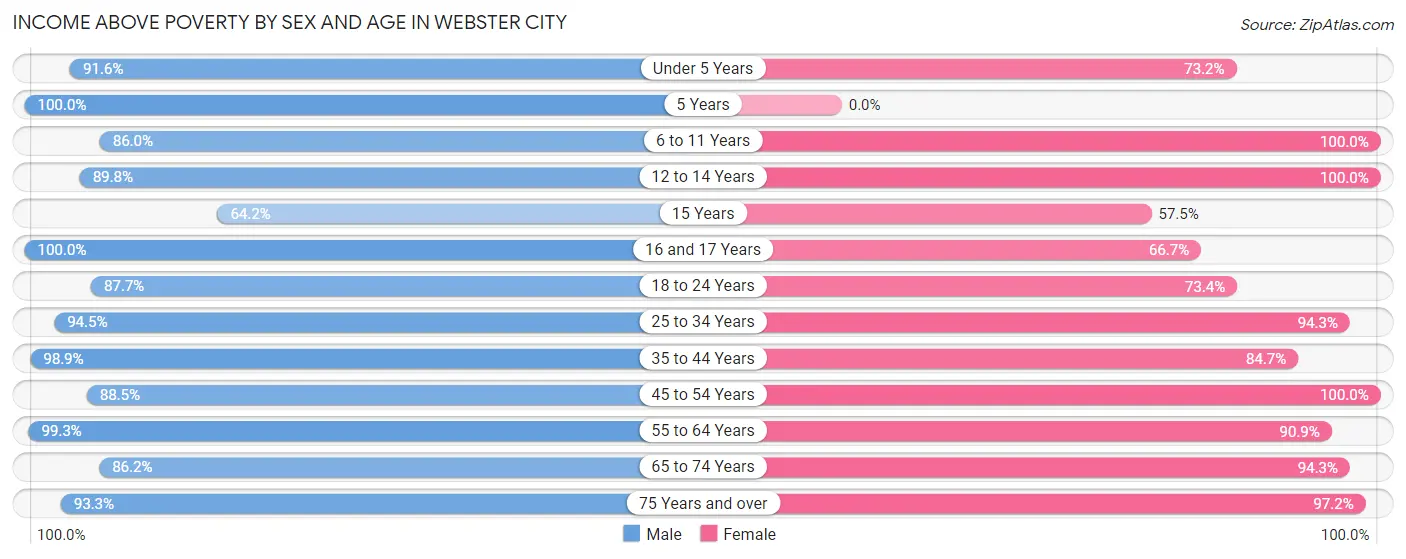
| Age Bracket | Male | Female |
| Under 5 Years | 217 (91.6%) | 145 (73.2%) |
| 5 Years | 82 (100.0%) | 0 (0.0%) |
| 6 to 11 Years | 265 (86.0%) | 316 (100.0%) |
| 12 to 14 Years | 114 (89.8%) | 124 (100.0%) |
| 15 Years | 52 (64.2%) | 23 (57.5%) |
| 16 and 17 Years | 99 (100.0%) | 34 (66.7%) |
| 18 to 24 Years | 249 (87.7%) | 212 (73.4%) |
| 25 to 34 Years | 377 (94.5%) | 379 (94.3%) |
| 35 to 44 Years | 640 (98.9%) | 398 (84.7%) |
| 45 to 54 Years | 444 (88.4%) | 446 (100.0%) |
| 55 to 64 Years | 412 (99.3%) | 320 (90.9%) |
| 65 to 74 Years | 398 (86.2%) | 397 (94.3%) |
| 75 Years and over | 361 (93.3%) | 416 (97.2%) |
| Total | 3,710 (92.1%) | 3,210 (90.7%) |
Income Below Poverty Among Married-Couple Families in Webster City
The poverty statistics for married-couple families in Webster City show that 3.1% or 43 of the total 1,391 families live below the poverty line. Families with 1 or 2 children have the highest poverty rate of 9.7%, comprising of 43 families. On the other hand, families with no children have the lowest poverty rate of 0.0%, which includes 0 families.
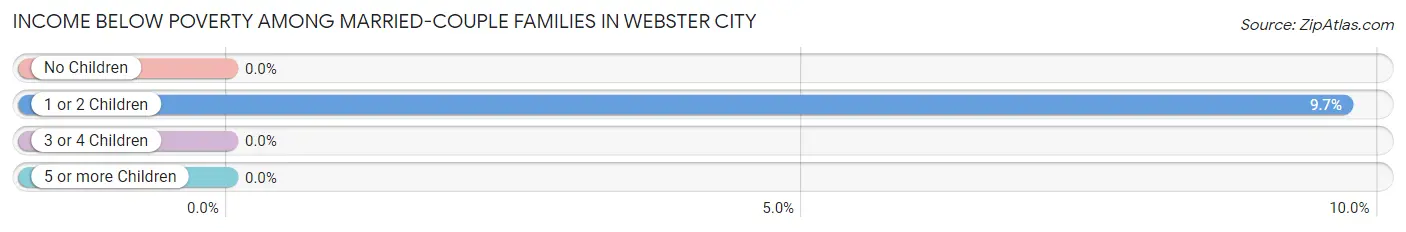
| Children | Above Poverty | Below Poverty |
| No Children | 726 (100.0%) | 0 (0.0%) |
| 1 or 2 Children | 400 (90.3%) | 43 (9.7%) |
| 3 or 4 Children | 222 (100.0%) | 0 (0.0%) |
| 5 or more Children | 0 (0.0%) | 0 (0.0%) |
| Total | 1,348 (96.9%) | 43 (3.1%) |
Income Below Poverty Among Single-Parent Households in Webster City
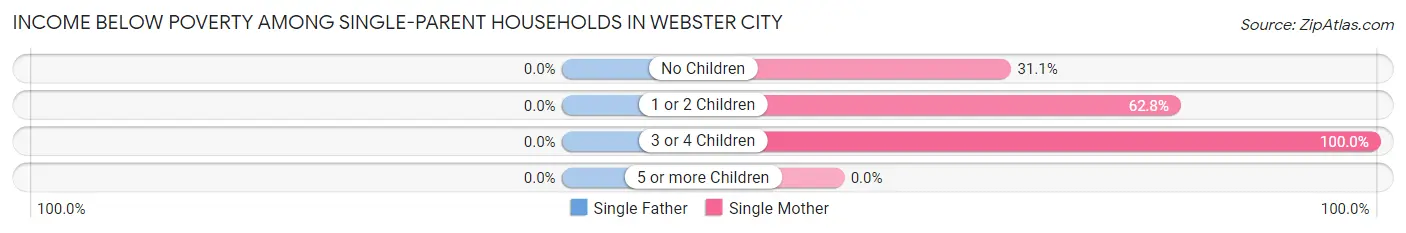
| Children | Single Father | Single Mother |
| No Children | 0 (0.0%) | 46 (31.1%) |
| 1 or 2 Children | 0 (0.0%) | 27 (62.8%) |
| 3 or 4 Children | 0 (0.0%) | 38 (100.0%) |
| 5 or more Children | 0 (0.0%) | 0 (0.0%) |
| Total | 0 (0.0%) | 111 (48.5%) |
Income Below Poverty Among Married-Couple vs Single-Parent Households in Webster City
The poverty data for Webster City shows that 43 of the married-couple family households (3.1%) and 111 of the single-parent households (26.2%) are living below the poverty level. Within the married-couple family households, those with 1 or 2 children have the highest poverty rate, with 43 households (9.7%) falling below the poverty line. Among the single-parent households, those with 3 or 4 children have the highest poverty rate, with 38 household (100.0%) living below poverty.
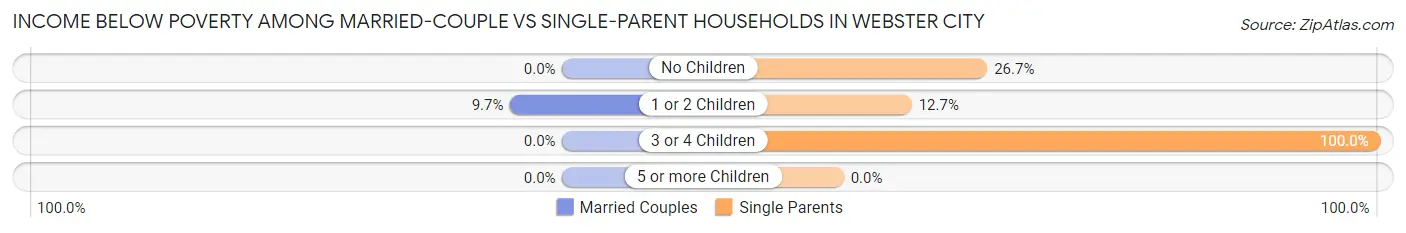
| Children | Married-Couple Families | Single-Parent Households |
| No Children | 0 (0.0%) | 46 (26.7%) |
| 1 or 2 Children | 43 (9.7%) | 27 (12.7%) |
| 3 or 4 Children | 0 (0.0%) | 38 (100.0%) |
| 5 or more Children | 0 (0.0%) | 0 (0.0%) |
| Total | 43 (3.1%) | 111 (26.2%) |
Race in Webster City
The most populous races in Webster City are White / Caucasian (6,731 | 86.4%), Hispanic or Latino (889 | 11.4%), and Two or more Races (466 | 6.0%).
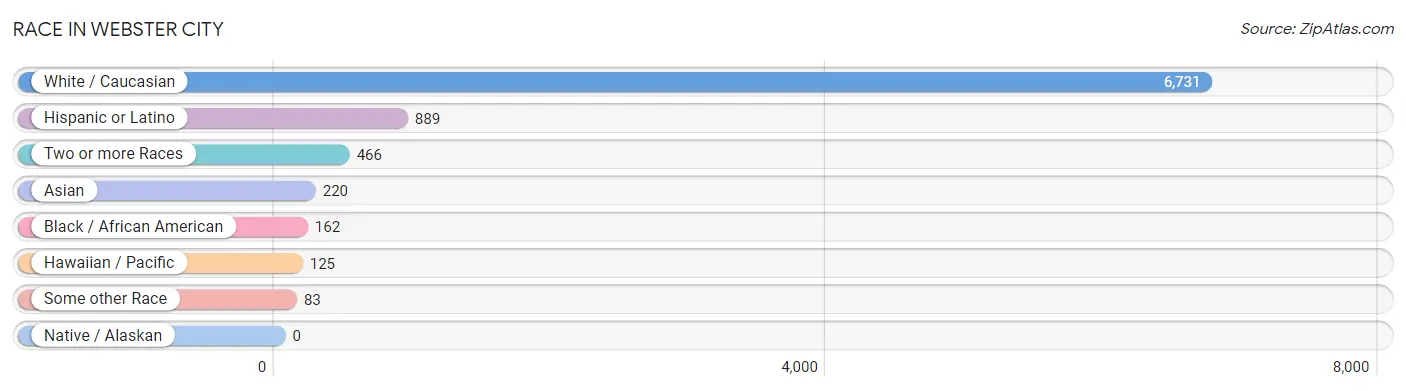
| Race | # Population | % Population |
| Asian | 220 | 2.8% |
| Black / African American | 162 | 2.1% |
| Hawaiian / Pacific | 125 | 1.6% |
| Hispanic or Latino | 889 | 11.4% |
| Native / Alaskan | 0 | 0.0% |
| White / Caucasian | 6,731 | 86.4% |
| Two or more Races | 466 | 6.0% |
| Some other Race | 83 | 1.1% |
| Total | 7,787 | 100.0% |
Ancestry in Webster City
The most populous ancestries reported in Webster City are German (2,572 | 33.0%), Norwegian (829 | 10.6%), Irish (787 | 10.1%), Mexican (731 | 9.4%), and English (399 | 5.1%), together accounting for 68.3% of all Webster City residents.
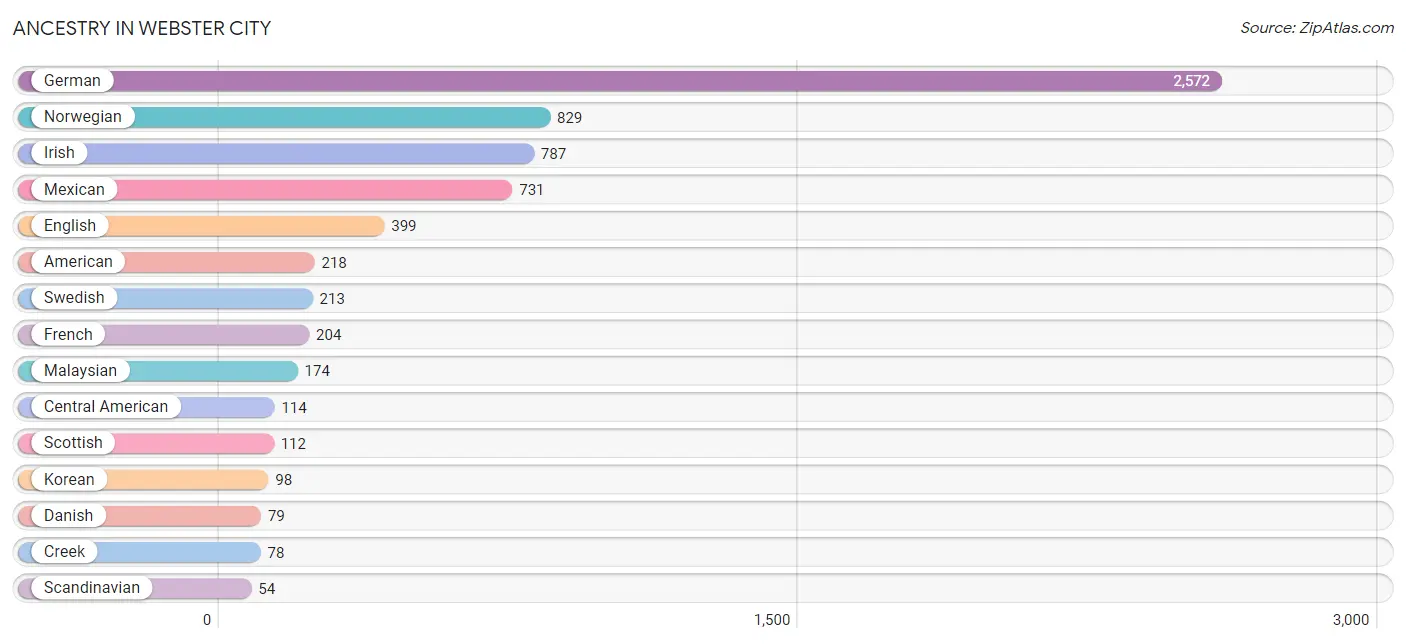
| Ancestry | # Population | % Population |
| American | 218 | 2.8% |
| Belgian | 14 | 0.2% |
| British | 36 | 0.5% |
| Central American | 114 | 1.5% |
| Creek | 78 | 1.0% |
| Danish | 79 | 1.0% |
| Dutch | 46 | 0.6% |
| English | 399 | 5.1% |
| French | 204 | 2.6% |
| German | 2,572 | 33.0% |
| Guatemalan | 51 | 0.6% |
| Hungarian | 6 | 0.1% |
| Irish | 787 | 10.1% |
| Italian | 17 | 0.2% |
| Korean | 98 | 1.3% |
| Malaysian | 174 | 2.2% |
| Mexican | 731 | 9.4% |
| Mexican American Indian | 4 | 0.1% |
| Navajo | 10 | 0.1% |
| Norwegian | 829 | 10.6% |
| Panamanian | 11 | 0.1% |
| Peruvian | 5 | 0.1% |
| Polish | 51 | 0.6% |
| Portuguese | 18 | 0.2% |
| Puerto Rican | 30 | 0.4% |
| Salvadoran | 52 | 0.7% |
| Samoan | 45 | 0.6% |
| Scandinavian | 54 | 0.7% |
| Scotch-Irish | 39 | 0.5% |
| Scottish | 112 | 1.4% |
| South American | 5 | 0.1% |
| Swedish | 213 | 2.7% |
| Swiss | 37 | 0.5% |
| Welsh | 27 | 0.4% | View All 34 Rows |
Immigrants in Webster City
The most numerous immigrant groups reported in Webster City came from Latin America (398 | 5.1%), Central America (393 | 5.1%), Mexico (310 | 4.0%), Asia (98 | 1.3%), and South Eastern Asia (98 | 1.3%), together accounting for 16.7% of all Webster City residents.
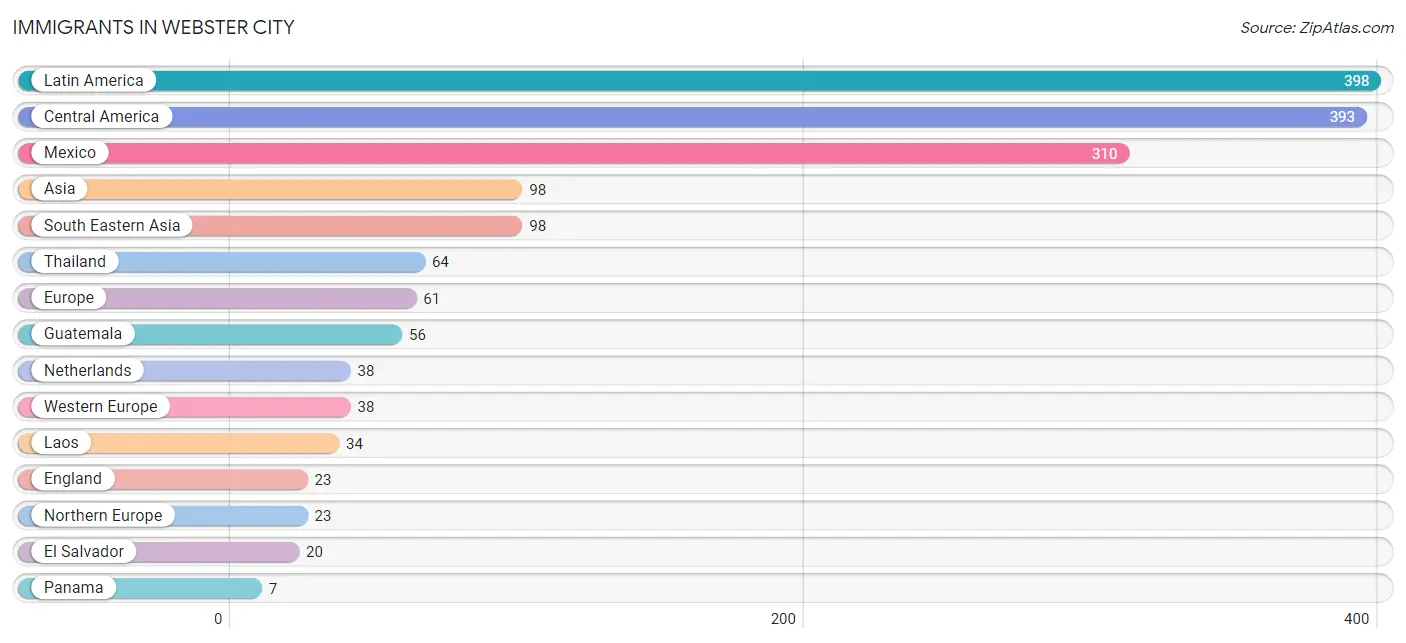
| Immigration Origin | # Population | % Population |
| Asia | 98 | 1.3% |
| Central America | 393 | 5.1% |
| El Salvador | 20 | 0.3% |
| England | 23 | 0.3% |
| Europe | 61 | 0.8% |
| Guatemala | 56 | 0.7% |
| Laos | 34 | 0.4% |
| Latin America | 398 | 5.1% |
| Mexico | 310 | 4.0% |
| Netherlands | 38 | 0.5% |
| Northern Europe | 23 | 0.3% |
| Panama | 7 | 0.1% |
| Peru | 5 | 0.1% |
| South America | 5 | 0.1% |
| South Eastern Asia | 98 | 1.3% |
| Thailand | 64 | 0.8% |
| Western Europe | 38 | 0.5% | View All 17 Rows |
Sex and Age in Webster City
Sex and Age in Webster City
The most populous age groups in Webster City are 35 to 39 Years (423 | 10.1%) for men and 85 Years and over (284 | 7.9%) for women.
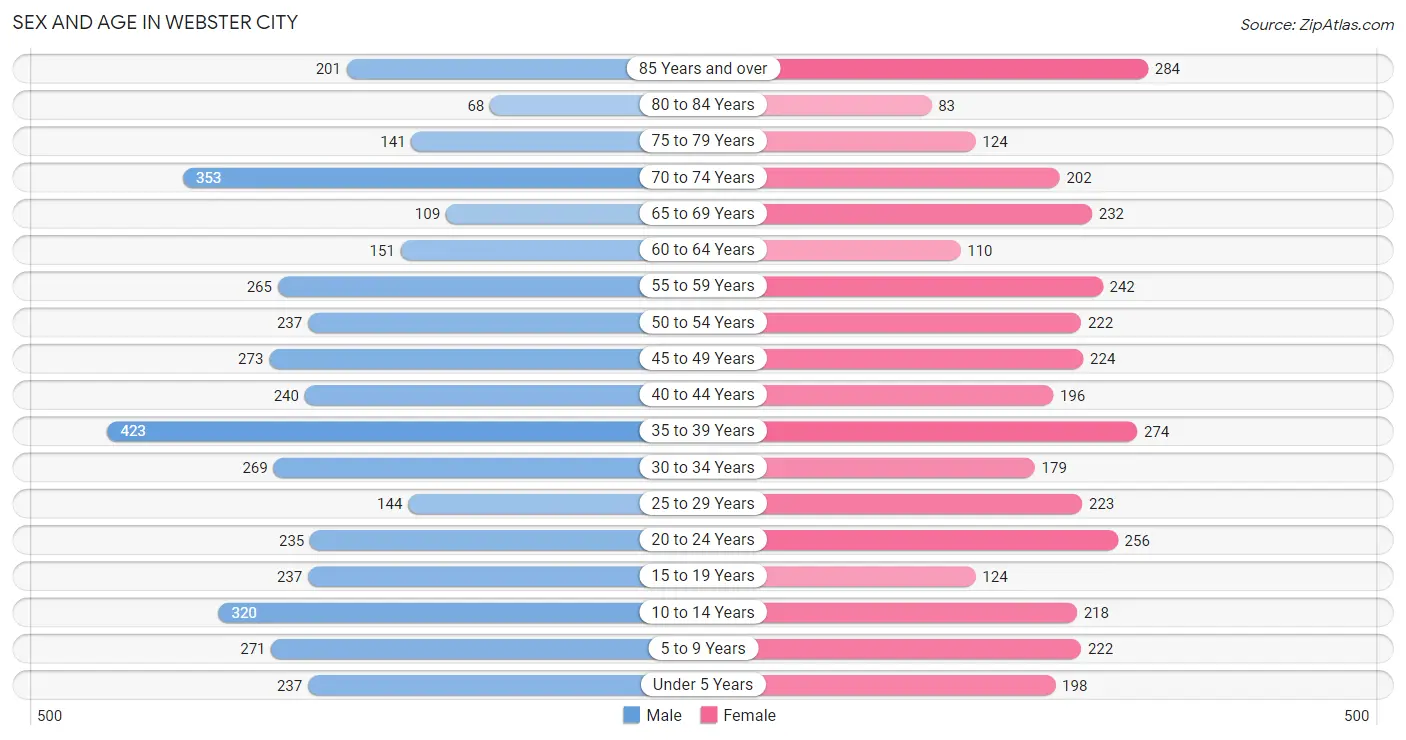
| Age Bracket | Male | Female |
| Under 5 Years | 237 (5.7%) | 198 (5.5%) |
| 5 to 9 Years | 271 (6.5%) | 222 (6.1%) |
| 10 to 14 Years | 320 (7.7%) | 218 (6.0%) |
| 15 to 19 Years | 237 (5.7%) | 124 (3.4%) |
| 20 to 24 Years | 235 (5.6%) | 256 (7.1%) |
| 25 to 29 Years | 144 (3.5%) | 223 (6.2%) |
| 30 to 34 Years | 269 (6.4%) | 179 (5.0%) |
| 35 to 39 Years | 423 (10.1%) | 274 (7.6%) |
| 40 to 44 Years | 240 (5.8%) | 196 (5.4%) |
| 45 to 49 Years | 273 (6.5%) | 224 (6.2%) |
| 50 to 54 Years | 237 (5.7%) | 222 (6.1%) |
| 55 to 59 Years | 265 (6.4%) | 242 (6.7%) |
| 60 to 64 Years | 151 (3.6%) | 110 (3.0%) |
| 65 to 69 Years | 109 (2.6%) | 232 (6.4%) |
| 70 to 74 Years | 353 (8.5%) | 202 (5.6%) |
| 75 to 79 Years | 141 (3.4%) | 124 (3.4%) |
| 80 to 84 Years | 68 (1.6%) | 83 (2.3%) |
| 85 Years and over | 201 (4.8%) | 284 (7.9%) |
| Total | 4,174 (100.0%) | 3,613 (100.0%) |
Families and Households in Webster City
Median Family Size in Webster City
The median family size in Webster City is 3.08 persons per family, with married-couple families (1,391 | 76.7%) accounting for the largest median family size of 3.19 persons per family. On the other hand, single male/father families (194 | 10.7%) represent the smallest median family size with 2.58 persons per family.
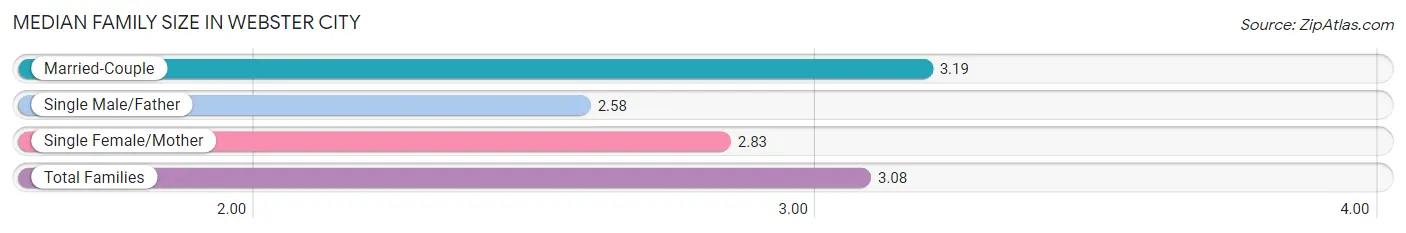
| Family Type | # Families | Family Size |
| Married-Couple | 1,391 (76.7%) | 3.19 |
| Single Male/Father | 194 (10.7%) | 2.58 |
| Single Female/Mother | 229 (12.6%) | 2.83 |
| Total Families | 1,814 (100.0%) | 3.08 |
Median Household Size in Webster City
The median household size in Webster City is 2.32 persons per household, with single male/father households (194 | 5.9%) accounting for the largest median household size of 3.59 persons per household. non-family households (1,478 | 44.9%) represent the smallest median household size with 1.24 persons per household.
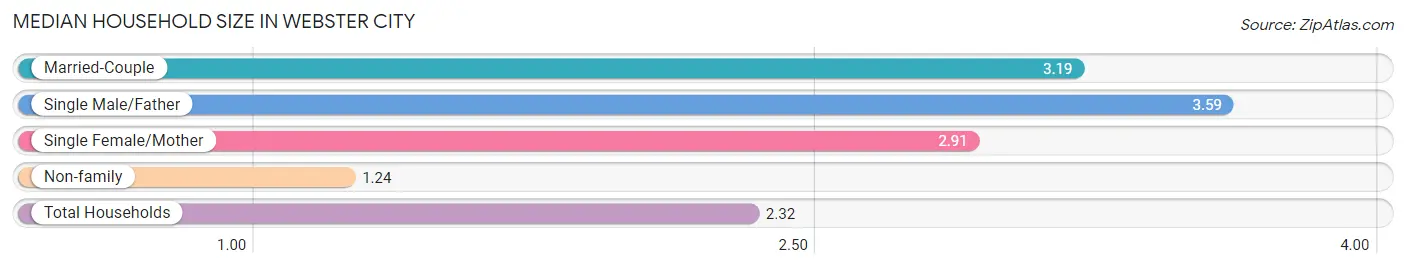
| Household Type | # Households | Household Size |
| Married-Couple | 1,391 (42.2%) | 3.19 |
| Single Male/Father | 194 (5.9%) | 3.59 |
| Single Female/Mother | 229 (7.0%) | 2.91 |
| Non-family | 1,478 (44.9%) | 1.24 |
| Total Households | 3,292 (100.0%) | 2.32 |
Household Size by Marriage Status in Webster City
Out of a total of 3,292 households in Webster City, 1,814 (55.1%) are family households, while 1,478 (44.9%) are nonfamily households. The most numerous type of family households are 2-person households, comprising 744, and the most common type of nonfamily households are 1-person households, comprising 1,232.
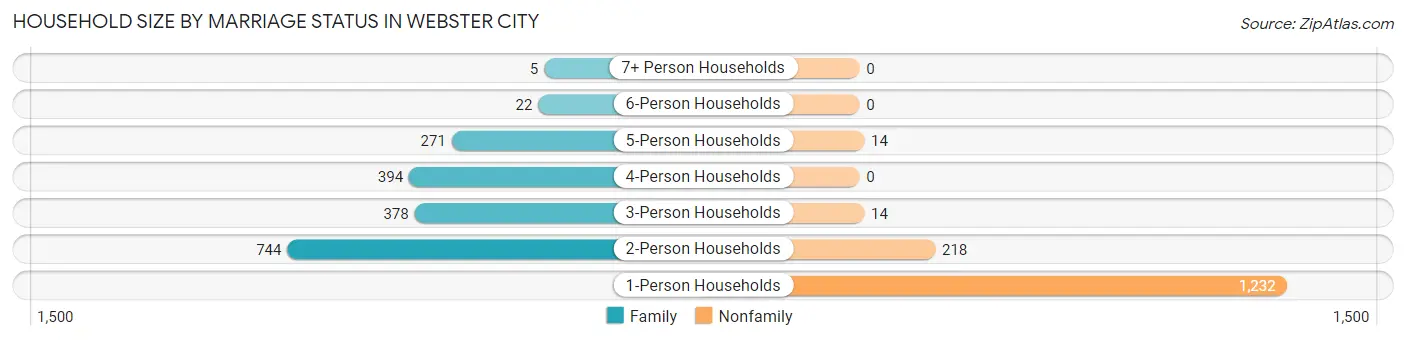
| Household Size | Family Households | Nonfamily Households |
| 1-Person Households | - | 1,232 (37.4%) |
| 2-Person Households | 744 (22.6%) | 218 (6.6%) |
| 3-Person Households | 378 (11.5%) | 14 (0.4%) |
| 4-Person Households | 394 (12.0%) | 0 (0.0%) |
| 5-Person Households | 271 (8.2%) | 14 (0.4%) |
| 6-Person Households | 22 (0.7%) | 0 (0.0%) |
| 7+ Person Households | 5 (0.2%) | 0 (0.0%) |
| Total | 1,814 (55.1%) | 1,478 (44.9%) |
Female Fertility in Webster City
Fertility by Age in Webster City
Average fertility rate in Webster City is 104.0 births per 1,000 women. Women in the age bracket of 20 to 34 years have the highest fertility rate with 240.0 births per 1,000 women. Women in the age bracket of 20 to 34 years acount for 98.8% of all women with births.
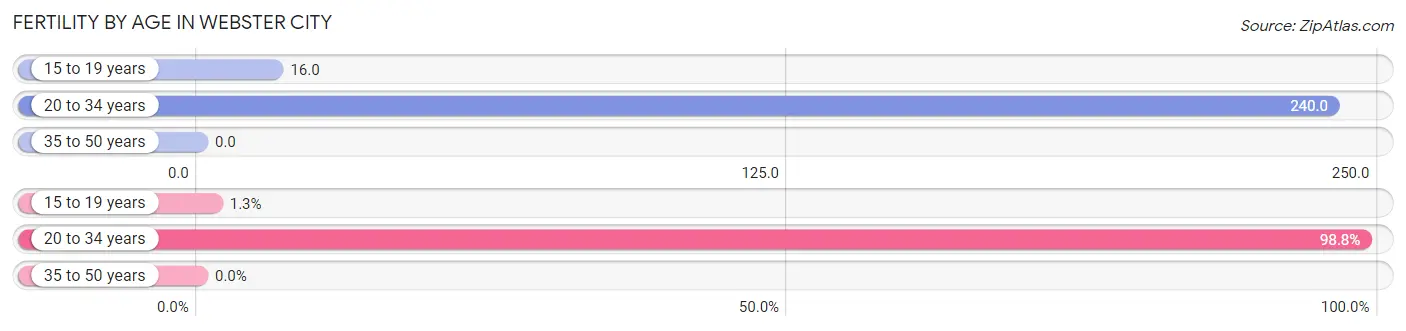
| Age Bracket | Women with Births | Births / 1,000 Women |
| 15 to 19 years | 2 (1.3%) | 16.0 |
| 20 to 34 years | 158 (98.8%) | 240.0 |
| 35 to 50 years | 0 (0.0%) | 0.0 |
| Total | 160 (100.0%) | 104.0 |
Fertility by Age by Marriage Status in Webster City
88.7% of women with births (160) in Webster City are married. The highest percentage of unmarried women with births falls into 15 to 19 years age bracket with 100.0% of them unmarried at the time of birth, while the lowest percentage of unmarried women with births belong to 20 to 34 years age bracket with 10.1% of them unmarried.
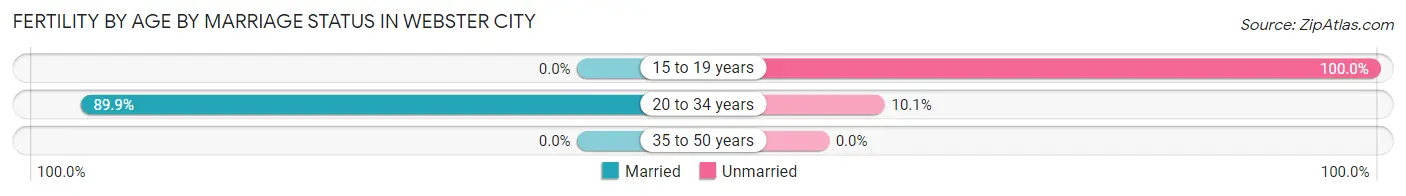
| Age Bracket | Married | Unmarried |
| 15 to 19 years | 0 (0.0%) | 2 (100.0%) |
| 20 to 34 years | 142 (89.9%) | 16 (10.1%) |
| 35 to 50 years | 0 (0.0%) | 0 (0.0%) |
| Total | 142 (88.7%) | 18 (11.3%) |
Fertility by Education in Webster City
Average fertility rate in Webster City is 104.0 births per 1,000 women. Women with the education attainment of graduate degree have the highest fertility rate of 282.0 births per 1,000 women, while women with the education attainment of college or associate's degree have the lowest fertility at 78.0 births per 1,000 women. Women with the education attainment of bachelor's degree represent 31.2% of all women with births.
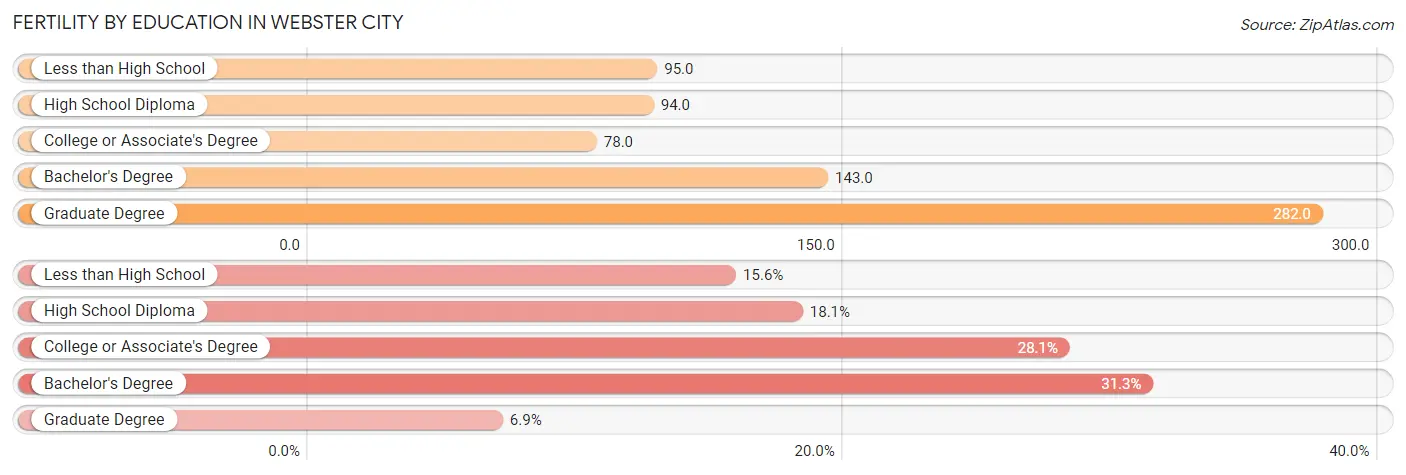
| Educational Attainment | Women with Births | Births / 1,000 Women |
| Less than High School | 25 (15.6%) | 95.0 |
| High School Diploma | 29 (18.1%) | 94.0 |
| College or Associate's Degree | 45 (28.1%) | 78.0 |
| Bachelor's Degree | 50 (31.2%) | 143.0 |
| Graduate Degree | 11 (6.9%) | 282.0 |
| Total | 160 (100.0%) | 104.0 |
Fertility by Education by Marriage Status in Webster City
11.3% of women with births in Webster City are unmarried. Women with the educational attainment of college or associate's degree are most likely to be married with 100.0% of them married at childbirth, while women with the educational attainment of high school diploma are least likely to be married with 55.2% of them unmarried at childbirth.
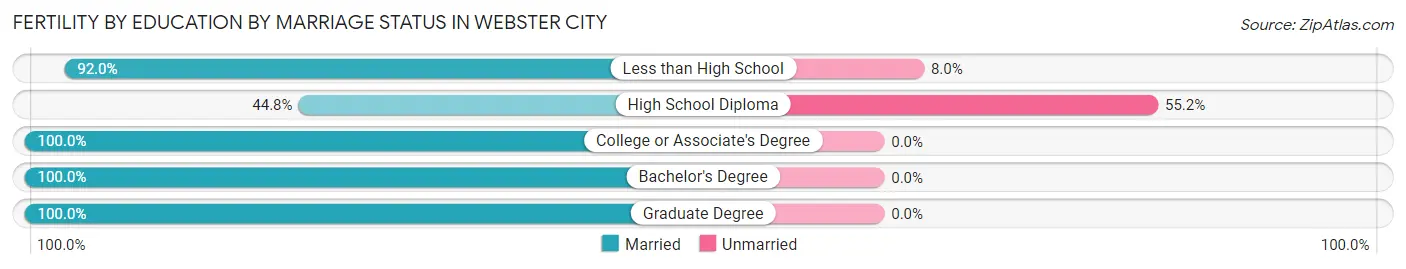
| Educational Attainment | Married | Unmarried |
| Less than High School | 23 (92.0%) | 2 (8.0%) |
| High School Diploma | 13 (44.8%) | 16 (55.2%) |
| College or Associate's Degree | 45 (100.0%) | 0 (0.0%) |
| Bachelor's Degree | 50 (100.0%) | 0 (0.0%) |
| Graduate Degree | 11 (100.0%) | 0 (0.0%) |
| Total | 142 (88.7%) | 18 (11.3%) |
Employment Characteristics in Webster City
Employment by Class of Employer in Webster City
Among the 3,523 employed individuals in Webster City, private company employees (2,567 | 72.9%), local government employees (431 | 12.2%), and self-employed (not incorporated) (172 | 4.9%) make up the most common classes of employment.
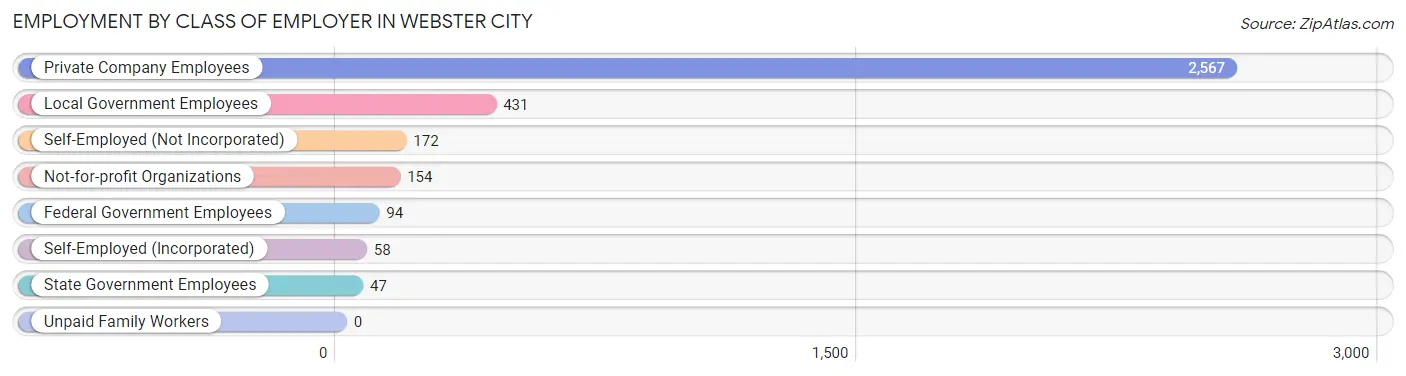
| Employer Class | # Employees | % Employees |
| Private Company Employees | 2,567 | 72.9% |
| Self-Employed (Incorporated) | 58 | 1.7% |
| Self-Employed (Not Incorporated) | 172 | 4.9% |
| Not-for-profit Organizations | 154 | 4.4% |
| Local Government Employees | 431 | 12.2% |
| State Government Employees | 47 | 1.3% |
| Federal Government Employees | 94 | 2.7% |
| Unpaid Family Workers | 0 | 0.0% |
| Total | 3,523 | 100.0% |
Employment Status by Age in Webster City
According to the labor force statistics for Webster City, out of the total population over 16 years of age (6,200), 60.2% or 3,732 individuals are in the labor force, with 4.4% or 164 of them unemployed. The age group with the highest labor force participation rate is 45 to 54 years, with 92.6% or 885 individuals in the labor force. Within the labor force, the 65 to 74 years age range has the highest percentage of unemployed individuals, with 27.2% or 47 of them being unemployed.
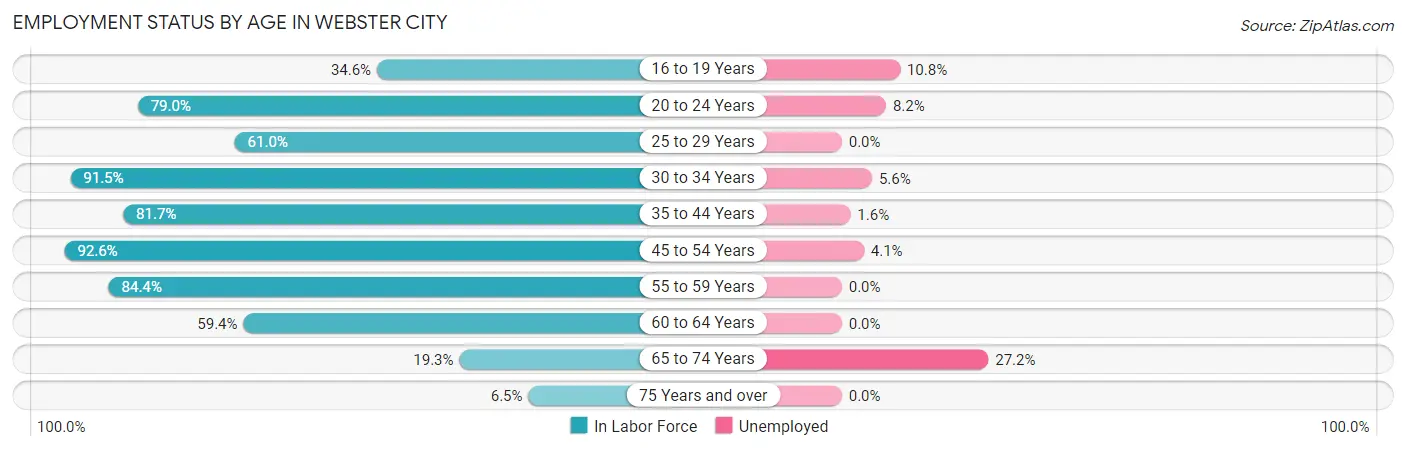
| Age Bracket | In Labor Force | Unemployed |
| 16 to 19 Years | 83 (34.6%) | 9 (10.8%) |
| 20 to 24 Years | 388 (79.0%) | 32 (8.2%) |
| 25 to 29 Years | 224 (61.0%) | 0 (0.0%) |
| 30 to 34 Years | 410 (91.5%) | 23 (5.6%) |
| 35 to 44 Years | 926 (81.7%) | 15 (1.6%) |
| 45 to 54 Years | 885 (92.6%) | 36 (4.1%) |
| 55 to 59 Years | 428 (84.4%) | 0 (0.0%) |
| 60 to 64 Years | 155 (59.4%) | 0 (0.0%) |
| 65 to 74 Years | 173 (19.3%) | 47 (27.2%) |
| 75 Years and over | 59 (6.5%) | 0 (0.0%) |
| Total | 3,732 (60.2%) | 164 (4.4%) |
Employment Status by Educational Attainment in Webster City
According to labor force statistics for Webster City, 82.5% of individuals (3,029) out of the total population between 25 and 64 years of age (3,672) are in the labor force, with 2.4% or 73 of them being unemployed. The group with the highest labor force participation rate are those with the educational attainment of college / associate degree, with 90.0% or 1,095 individuals in the labor force. Within the labor force, individuals with less than high school education have the highest percentage of unemployment, with 13.9% or 23 of them being unemployed.
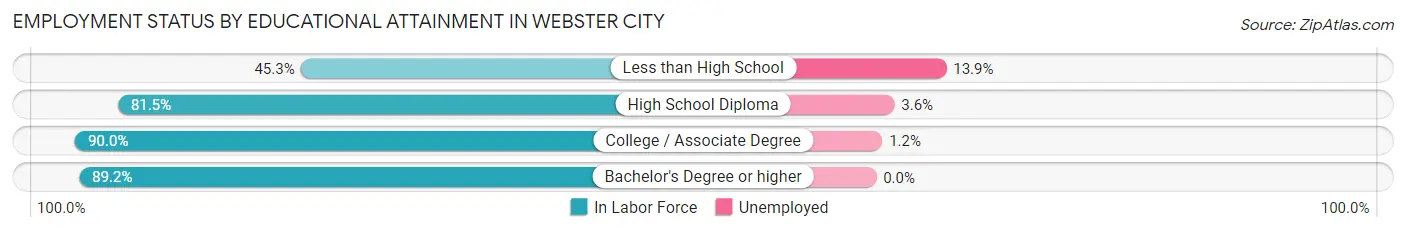
| Educational Attainment | In Labor Force | Unemployed |
| Less than High School | 165 (45.3%) | 51 (13.9%) |
| High School Diploma | 1,027 (81.5%) | 45 (3.6%) |
| College / Associate Degree | 1,095 (90.0%) | 15 (1.2%) |
| Bachelor's Degree or higher | 741 (89.2%) | 0 (0.0%) |
| Total | 3,029 (82.5%) | 88 (2.4%) |
Employment Occupations by Sex in Webster City
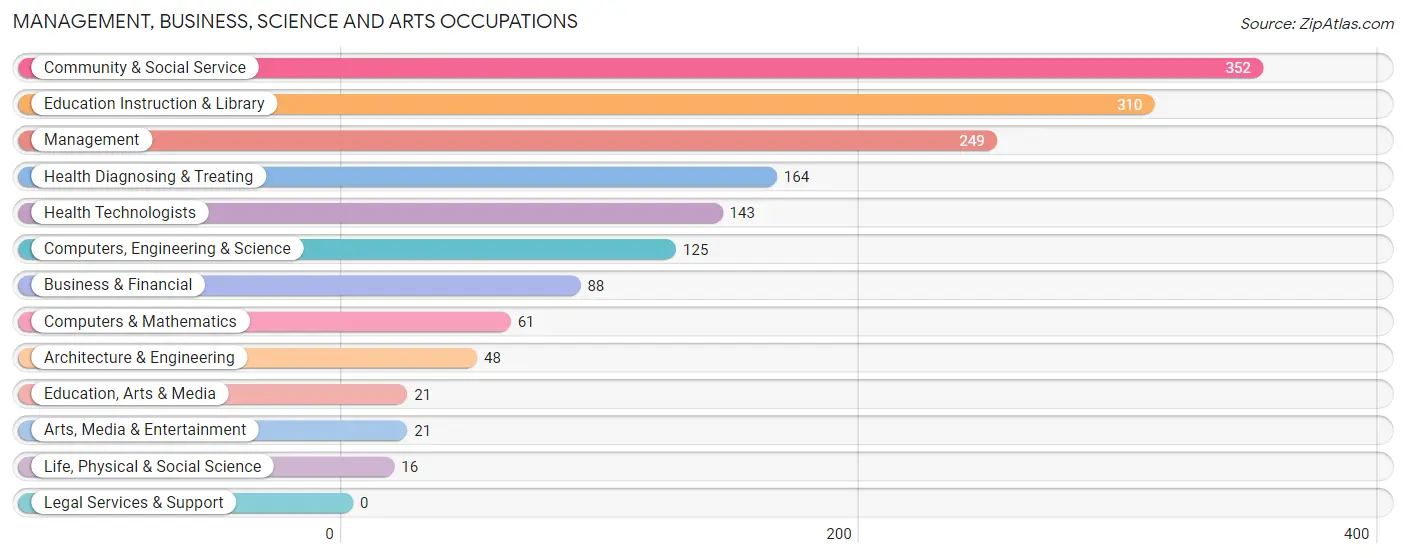
Management, Business, Science and Arts Occupations
The most common Management, Business, Science and Arts occupations in Webster City are Community & Social Service (352 | 10.0%), Education Instruction & Library (310 | 8.8%), Management (249 | 7.0%), Health Diagnosing & Treating (164 | 4.6%), and Health Technologists (143 | 4.0%).
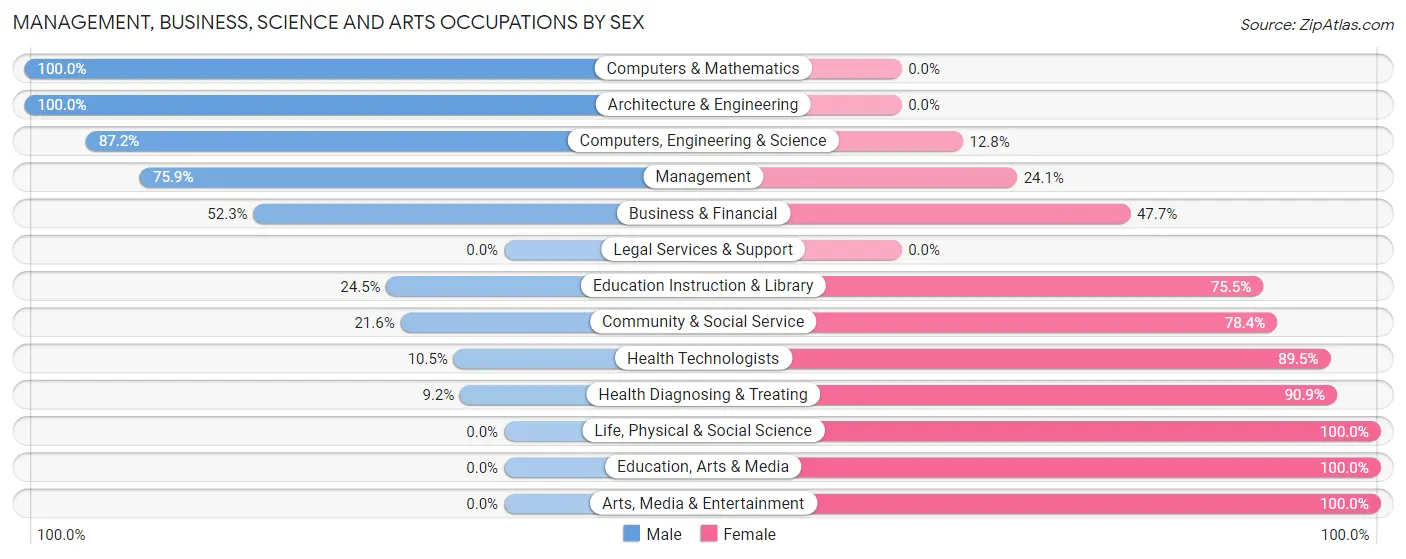
Management, Business, Science and Arts Occupations by Sex
Within the Management, Business, Science and Arts occupations in Webster City, the most male-oriented occupations are Computers & Mathematics (100.0%), Architecture & Engineering (100.0%), and Computers, Engineering & Science (87.2%), while the most female-oriented occupations are Life, Physical & Social Science (100.0%), Education, Arts & Media (100.0%), and Arts, Media & Entertainment (100.0%).
| Occupation | Male | Female |
| Management | 189 (75.9%) | 60 (24.1%) |
| Business & Financial | 46 (52.3%) | 42 (47.7%) |
| Computers, Engineering & Science | 109 (87.2%) | 16 (12.8%) |
| Computers & Mathematics | 61 (100.0%) | 0 (0.0%) |
| Architecture & Engineering | 48 (100.0%) | 0 (0.0%) |
| Life, Physical & Social Science | 0 (0.0%) | 16 (100.0%) |
| Community & Social Service | 76 (21.6%) | 276 (78.4%) |
| Education, Arts & Media | 0 (0.0%) | 21 (100.0%) |
| Legal Services & Support | 0 (0.0%) | 0 (0.0%) |
| Education Instruction & Library | 76 (24.5%) | 234 (75.5%) |
| Arts, Media & Entertainment | 0 (0.0%) | 21 (100.0%) |
| Health Diagnosing & Treating | 15 (9.1%) | 149 (90.8%) |
| Health Technologists | 15 (10.5%) | 128 (89.5%) |
| Total (Category) | 435 (44.5%) | 543 (55.5%) |
| Total (Overall) | 1,968 (55.7%) | 1,568 (44.3%) |
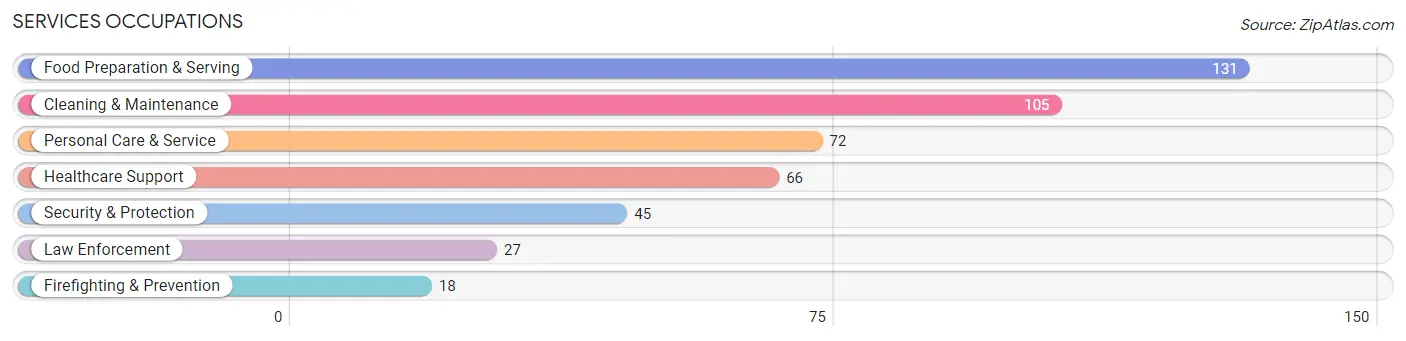
Services Occupations
The most common Services occupations in Webster City are Food Preparation & Serving (131 | 3.7%), Cleaning & Maintenance (105 | 3.0%), Personal Care & Service (72 | 2.0%), Healthcare Support (66 | 1.9%), and Security & Protection (45 | 1.3%).
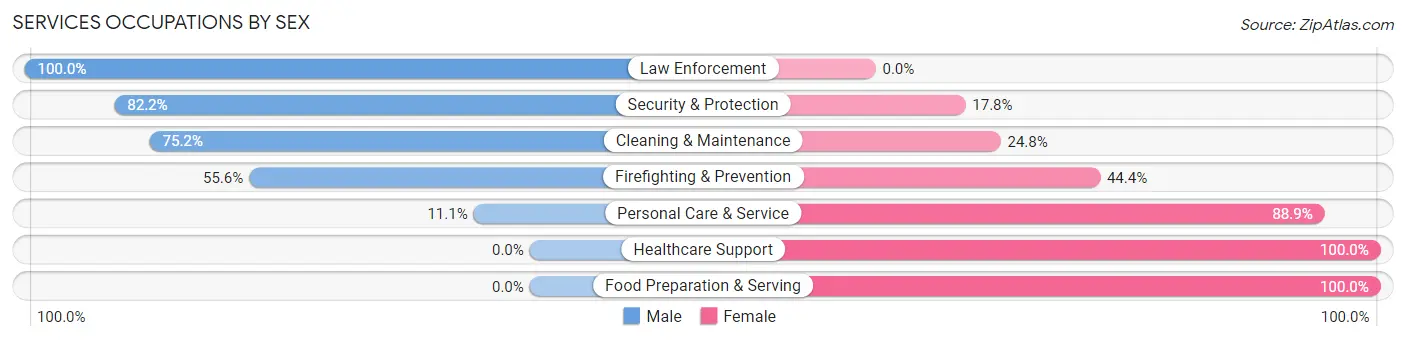
Services Occupations by Sex
Within the Services occupations in Webster City, the most male-oriented occupations are Law Enforcement (100.0%), Security & Protection (82.2%), and Cleaning & Maintenance (75.2%), while the most female-oriented occupations are Healthcare Support (100.0%), Food Preparation & Serving (100.0%), and Personal Care & Service (88.9%).
| Occupation | Male | Female |
| Healthcare Support | 0 (0.0%) | 66 (100.0%) |
| Security & Protection | 37 (82.2%) | 8 (17.8%) |
| Firefighting & Prevention | 10 (55.6%) | 8 (44.4%) |
| Law Enforcement | 27 (100.0%) | 0 (0.0%) |
| Food Preparation & Serving | 0 (0.0%) | 131 (100.0%) |
| Cleaning & Maintenance | 79 (75.2%) | 26 (24.8%) |
| Personal Care & Service | 8 (11.1%) | 64 (88.9%) |
| Total (Category) | 124 (29.6%) | 295 (70.4%) |
| Total (Overall) | 1,968 (55.7%) | 1,568 (44.3%) |
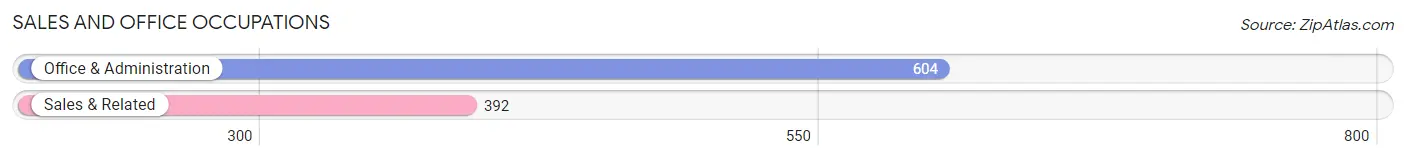
Sales and Office Occupations
The most common Sales and Office occupations in Webster City are Office & Administration (604 | 17.1%), and Sales & Related (392 | 11.1%).
Sales and Office Occupations by Sex
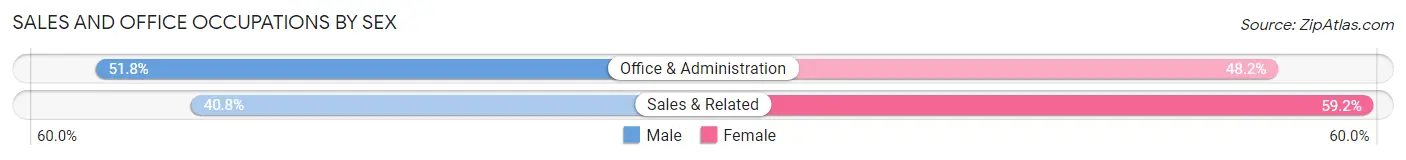
| Occupation | Male | Female |
| Sales & Related | 160 (40.8%) | 232 (59.2%) |
| Office & Administration | 313 (51.8%) | 291 (48.2%) |
| Total (Category) | 473 (47.5%) | 523 (52.5%) |
| Total (Overall) | 1,968 (55.7%) | 1,568 (44.3%) |
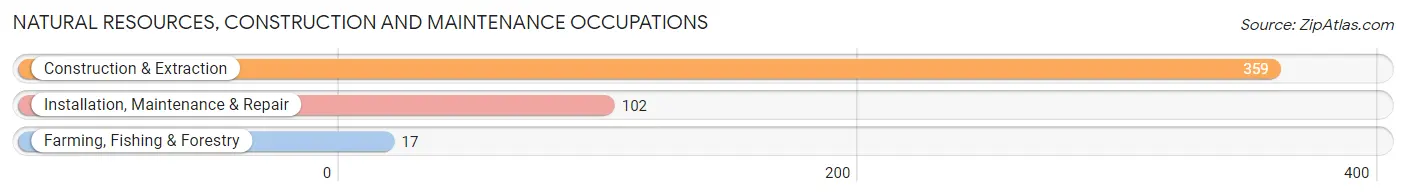
Natural Resources, Construction and Maintenance Occupations
The most common Natural Resources, Construction and Maintenance occupations in Webster City are Construction & Extraction (359 | 10.2%), Installation, Maintenance & Repair (102 | 2.9%), and Farming, Fishing & Forestry (17 | 0.5%).
Natural Resources, Construction and Maintenance Occupations by Sex
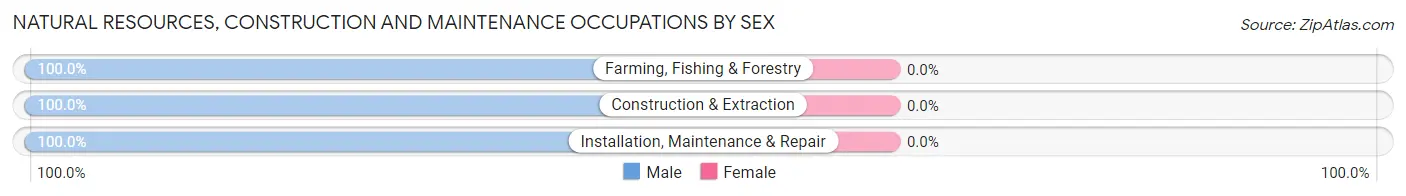
| Occupation | Male | Female |
| Farming, Fishing & Forestry | 17 (100.0%) | 0 (0.0%) |
| Construction & Extraction | 359 (100.0%) | 0 (0.0%) |
| Installation, Maintenance & Repair | 102 (100.0%) | 0 (0.0%) |
| Total (Category) | 478 (100.0%) | 0 (0.0%) |
| Total (Overall) | 1,968 (55.7%) | 1,568 (44.3%) |
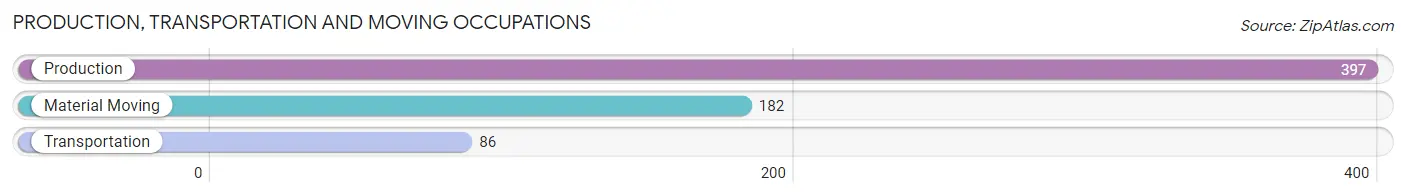
Production, Transportation and Moving Occupations
The most common Production, Transportation and Moving occupations in Webster City are Production (397 | 11.2%), Material Moving (182 | 5.1%), and Transportation (86 | 2.4%).
Production, Transportation and Moving Occupations by Sex
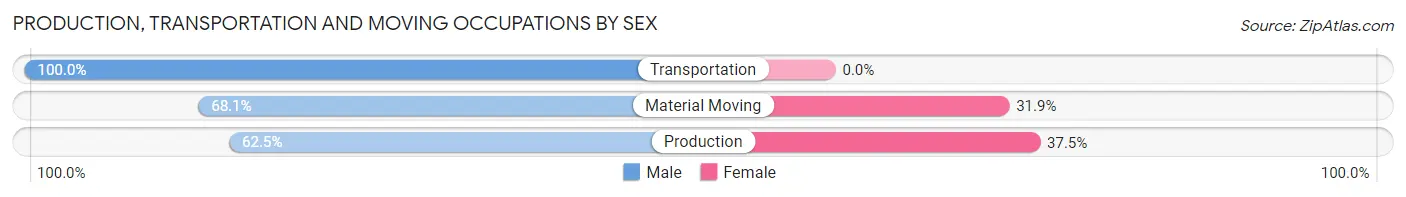
| Occupation | Male | Female |
| Production | 248 (62.5%) | 149 (37.5%) |
| Transportation | 86 (100.0%) | 0 (0.0%) |
| Material Moving | 124 (68.1%) | 58 (31.9%) |
| Total (Category) | 458 (68.9%) | 207 (31.1%) |
| Total (Overall) | 1,968 (55.7%) | 1,568 (44.3%) |
Employment Industries by Sex in Webster City
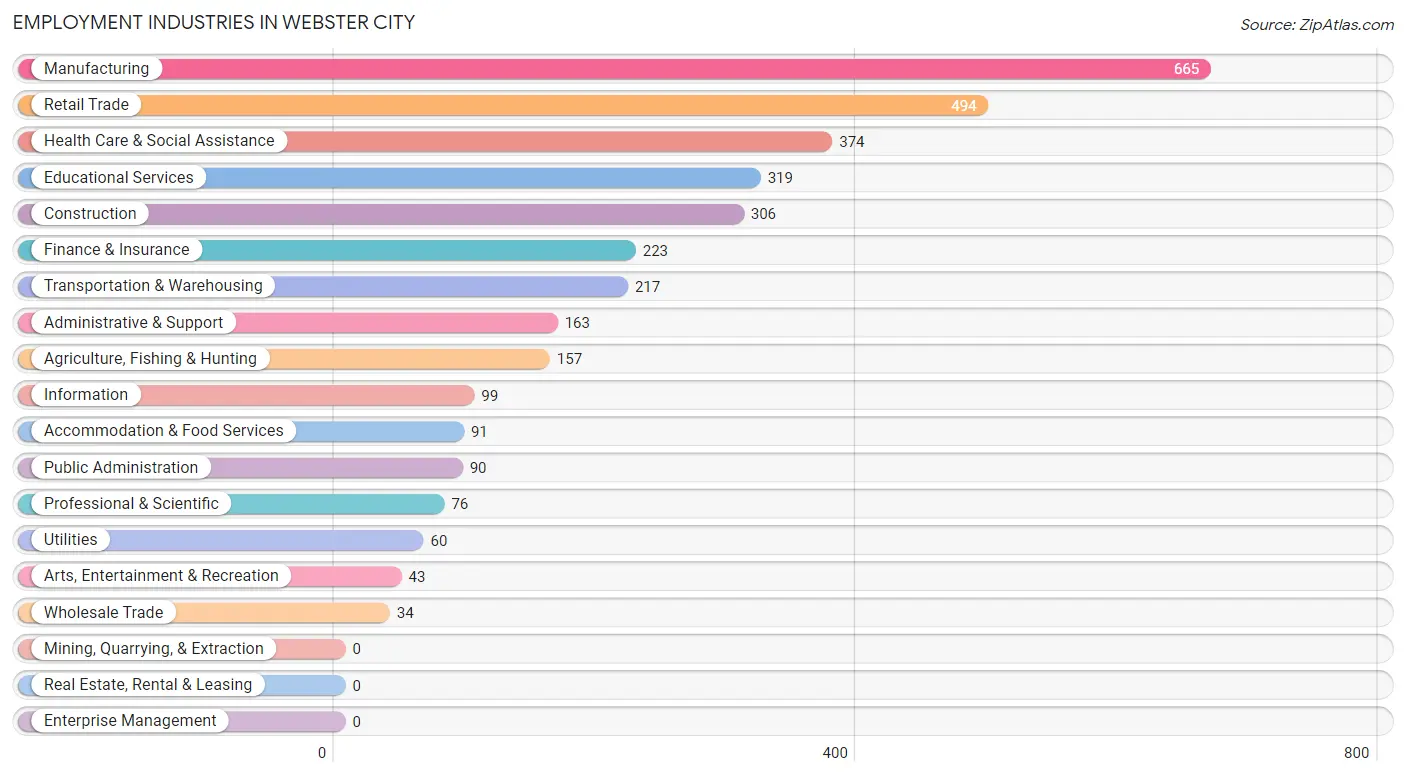
Employment Industries in Webster City
The major employment industries in Webster City include Manufacturing (665 | 18.8%), Retail Trade (494 | 14.0%), Health Care & Social Assistance (374 | 10.6%), Educational Services (319 | 9.0%), and Construction (306 | 8.6%).
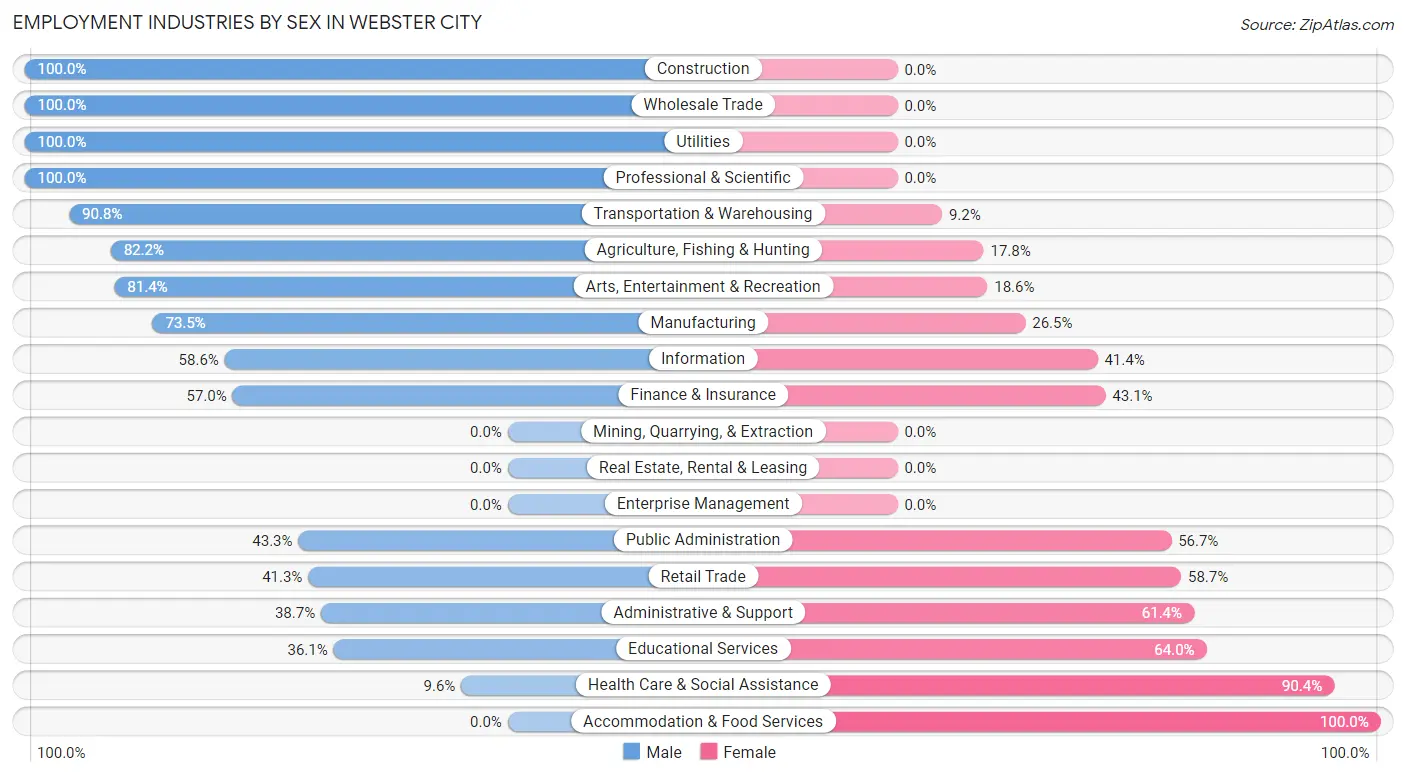
Employment Industries by Sex in Webster City
The Webster City industries that see more men than women are Construction (100.0%), Wholesale Trade (100.0%), and Utilities (100.0%), whereas the industries that tend to have a higher number of women are Accommodation & Food Services (100.0%), Health Care & Social Assistance (90.4%), and Educational Services (63.9%).
| Industry | Male | Female |
| Agriculture, Fishing & Hunting | 129 (82.2%) | 28 (17.8%) |
| Mining, Quarrying, & Extraction | 0 (0.0%) | 0 (0.0%) |
| Construction | 306 (100.0%) | 0 (0.0%) |
| Manufacturing | 489 (73.5%) | 176 (26.5%) |
| Wholesale Trade | 34 (100.0%) | 0 (0.0%) |
| Retail Trade | 204 (41.3%) | 290 (58.7%) |
| Transportation & Warehousing | 197 (90.8%) | 20 (9.2%) |
| Utilities | 60 (100.0%) | 0 (0.0%) |
| Information | 58 (58.6%) | 41 (41.4%) |
| Finance & Insurance | 127 (57.0%) | 96 (43.0%) |
| Real Estate, Rental & Leasing | 0 (0.0%) | 0 (0.0%) |
| Professional & Scientific | 76 (100.0%) | 0 (0.0%) |
| Enterprise Management | 0 (0.0%) | 0 (0.0%) |
| Administrative & Support | 63 (38.7%) | 100 (61.4%) |
| Educational Services | 115 (36.0%) | 204 (63.9%) |
| Health Care & Social Assistance | 36 (9.6%) | 338 (90.4%) |
| Arts, Entertainment & Recreation | 35 (81.4%) | 8 (18.6%) |
| Accommodation & Food Services | 0 (0.0%) | 91 (100.0%) |
| Public Administration | 39 (43.3%) | 51 (56.7%) |
| Total | 1,968 (55.7%) | 1,568 (44.3%) |
Education in Webster City
School Enrollment in Webster City
The most common levels of schooling among the 1,555 students in Webster City are middle school (384 | 24.7%), high school (370 | 23.8%), and elementary school (362 | 23.3%).
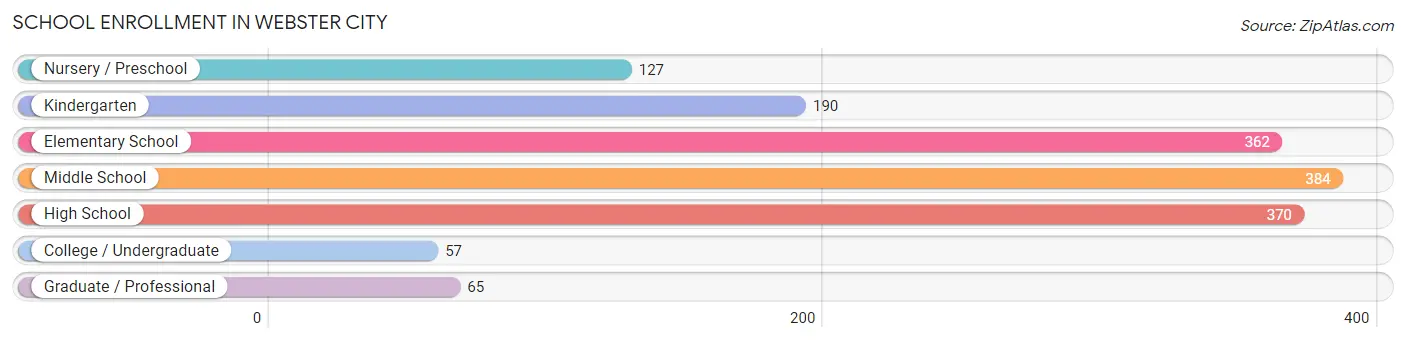
| School Level | # Students | % Students |
| Nursery / Preschool | 127 | 8.2% |
| Kindergarten | 190 | 12.2% |
| Elementary School | 362 | 23.3% |
| Middle School | 384 | 24.7% |
| High School | 370 | 23.8% |
| College / Undergraduate | 57 | 3.7% |
| Graduate / Professional | 65 | 4.2% |
| Total | 1,555 | 100.0% |
School Enrollment by Age by Funding Source in Webster City
Out of a total of 1,555 students who are enrolled in schools in Webster City, 103 (6.6%) attend a private institution, while the remaining 1,452 (93.4%) are enrolled in public schools. The age group of 35 years and over has the highest likelihood of being enrolled in private schools, with 41 (83.7% in the age bracket) enrolled. Conversely, the age group of 18 to 19 year olds has the lowest likelihood of being enrolled in a private school, with 18 (100.0% in the age bracket) attending a public institution.
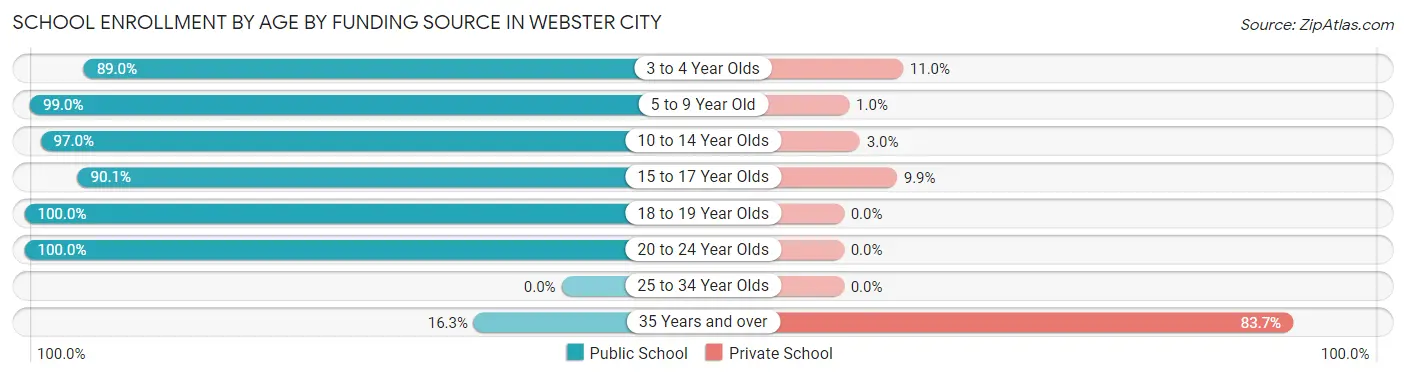
| Age Bracket | Public School | Private School |
| 3 to 4 Year Olds | 113 (89.0%) | 14 (11.0%) |
| 5 to 9 Year Old | 485 (99.0%) | 5 (1.0%) |
| 10 to 14 Year Olds | 518 (97.0%) | 16 (3.0%) |
| 15 to 17 Year Olds | 237 (90.1%) | 26 (9.9%) |
| 18 to 19 Year Olds | 18 (100.0%) | 0 (0.0%) |
| 20 to 24 Year Olds | 74 (100.0%) | 0 (0.0%) |
| 25 to 34 Year Olds | 0 (0.0%) | 0 (0.0%) |
| 35 Years and over | 8 (16.3%) | 41 (83.7%) |
| Total | 1,452 (93.4%) | 103 (6.6%) |
Educational Attainment by Field of Study in Webster City
Education (372 | 29.2%), business (360 | 28.3%), science & technology (139 | 10.9%), bio, nature & agricultural (127 | 10.0%), and arts & humanities (97 | 7.6%) are the most common fields of study among 1,273 individuals in Webster City who have obtained a bachelor's degree or higher.
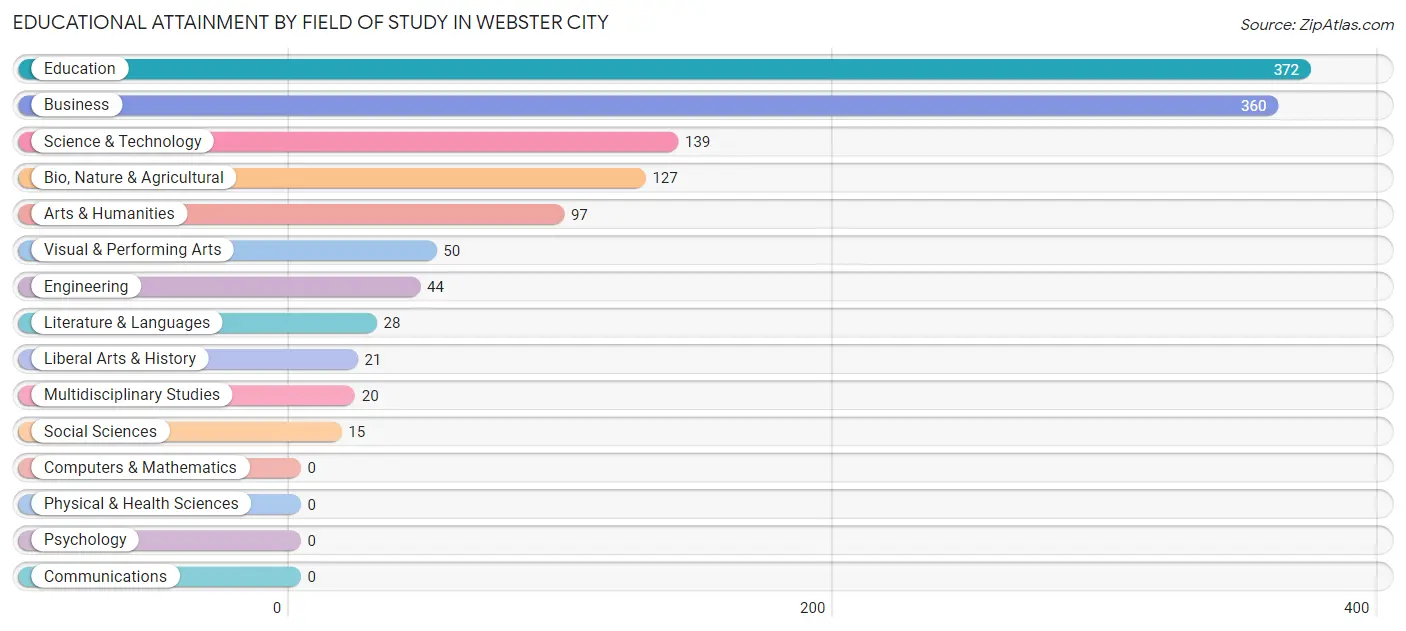
| Field of Study | # Graduates | % Graduates |
| Computers & Mathematics | 0 | 0.0% |
| Bio, Nature & Agricultural | 127 | 10.0% |
| Physical & Health Sciences | 0 | 0.0% |
| Psychology | 0 | 0.0% |
| Social Sciences | 15 | 1.2% |
| Engineering | 44 | 3.5% |
| Multidisciplinary Studies | 20 | 1.6% |
| Science & Technology | 139 | 10.9% |
| Business | 360 | 28.3% |
| Education | 372 | 29.2% |
| Literature & Languages | 28 | 2.2% |
| Liberal Arts & History | 21 | 1.7% |
| Visual & Performing Arts | 50 | 3.9% |
| Communications | 0 | 0.0% |
| Arts & Humanities | 97 | 7.6% |
| Total | 1,273 | 100.0% |
Transportation & Commute in Webster City
Vehicle Availability by Sex in Webster City
The most prevalent vehicle ownership categories in Webster City are males with 2 vehicles (1,104, accounting for 55.4%) and females with 2 vehicles (821, making up 72.2%).
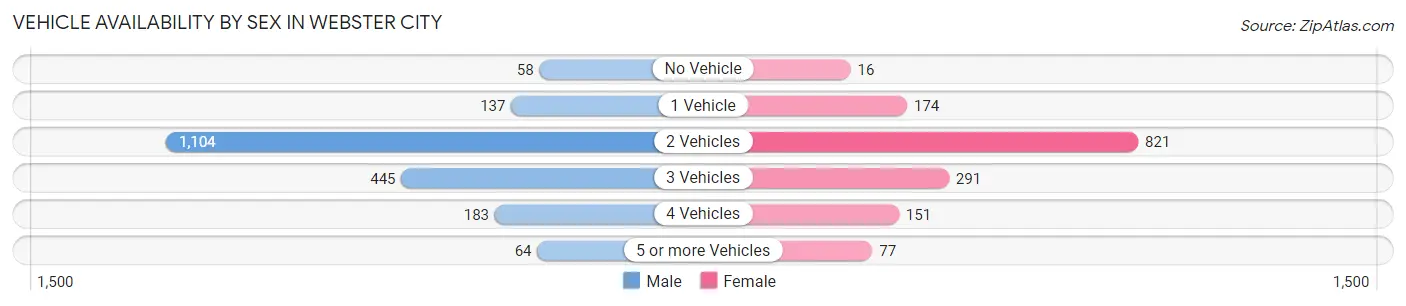
| Vehicles Available | Male | Female |
| No Vehicle | 58 (2.9%) | 16 (1.1%) |
| 1 Vehicle | 137 (6.9%) | 174 (11.4%) |
| 2 Vehicles | 1,104 (55.4%) | 821 (53.7%) |
| 3 Vehicles | 445 (22.4%) | 291 (19.0%) |
| 4 Vehicles | 183 (9.2%) | 151 (9.9%) |
| 5 or more Vehicles | 64 (3.2%) | 77 (5.0%) |
| Total | 1,991 (100.0%) | 1,530 (100.0%) |
Commute Time in Webster City
The most frequently occuring commute durations in Webster City are 5 to 9 minutes (1,036 commuters, 30.4%), 10 to 14 minutes (846 commuters, 24.8%), and 15 to 19 minutes (340 commuters, 10.0%).
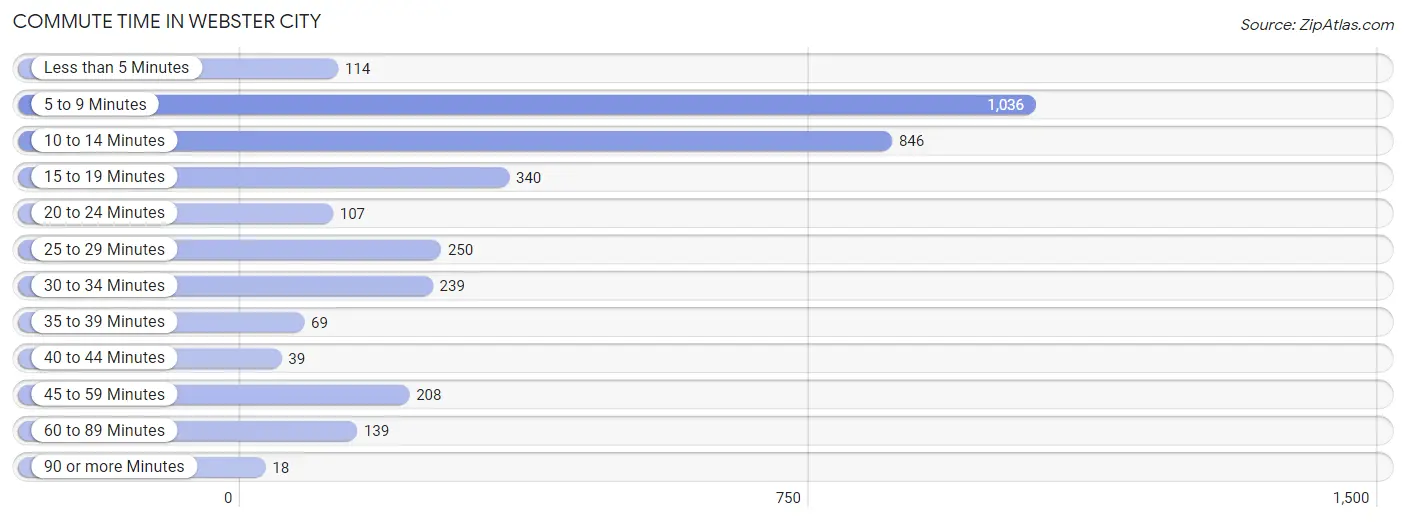
| Commute Time | # Commuters | % Commuters |
| Less than 5 Minutes | 114 | 3.4% |
| 5 to 9 Minutes | 1,036 | 30.4% |
| 10 to 14 Minutes | 846 | 24.8% |
| 15 to 19 Minutes | 340 | 10.0% |
| 20 to 24 Minutes | 107 | 3.1% |
| 25 to 29 Minutes | 250 | 7.3% |
| 30 to 34 Minutes | 239 | 7.0% |
| 35 to 39 Minutes | 69 | 2.0% |
| 40 to 44 Minutes | 39 | 1.1% |
| 45 to 59 Minutes | 208 | 6.1% |
| 60 to 89 Minutes | 139 | 4.1% |
| 90 or more Minutes | 18 | 0.5% |
Commute Time by Sex in Webster City
The most common commute times in Webster City are 5 to 9 minutes (487 commuters, 24.8%) for males and 5 to 9 minutes (549 commuters, 38.0%) for females.
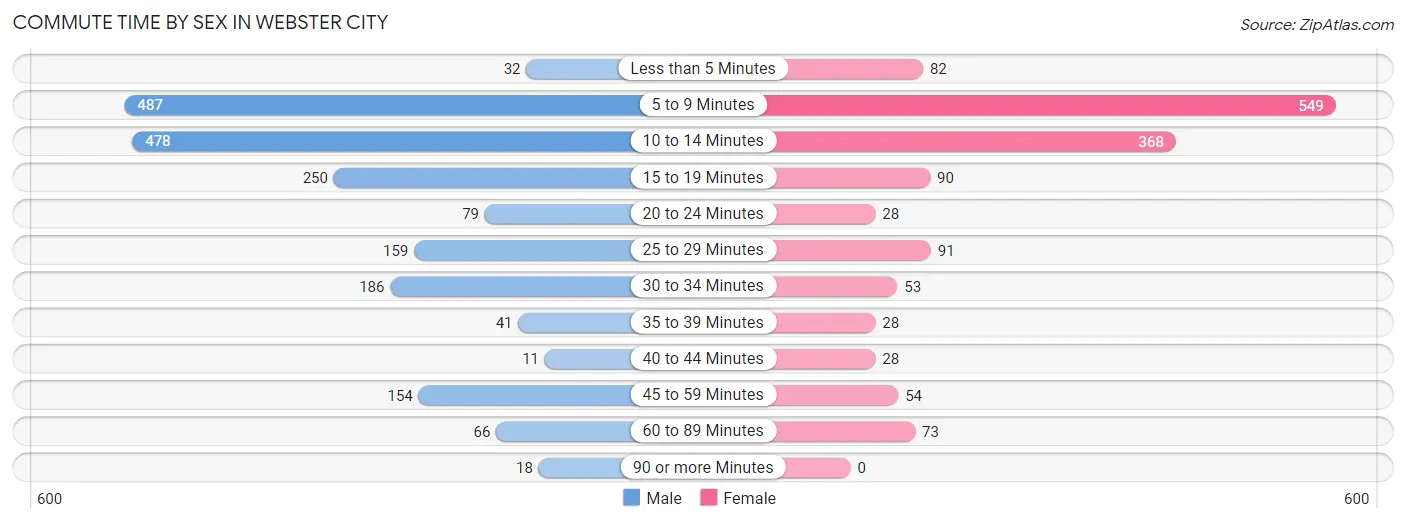
| Commute Time | Male | Female |
| Less than 5 Minutes | 32 (1.6%) | 82 (5.7%) |
| 5 to 9 Minutes | 487 (24.8%) | 549 (38.0%) |
| 10 to 14 Minutes | 478 (24.4%) | 368 (25.5%) |
| 15 to 19 Minutes | 250 (12.8%) | 90 (6.2%) |
| 20 to 24 Minutes | 79 (4.0%) | 28 (1.9%) |
| 25 to 29 Minutes | 159 (8.1%) | 91 (6.3%) |
| 30 to 34 Minutes | 186 (9.5%) | 53 (3.7%) |
| 35 to 39 Minutes | 41 (2.1%) | 28 (1.9%) |
| 40 to 44 Minutes | 11 (0.6%) | 28 (1.9%) |
| 45 to 59 Minutes | 154 (7.9%) | 54 (3.7%) |
| 60 to 89 Minutes | 66 (3.4%) | 73 (5.1%) |
| 90 or more Minutes | 18 (0.9%) | 0 (0.0%) |
Time of Departure to Work by Sex in Webster City
The most frequent times of departure to work in Webster City are 6:30 AM to 6:59 AM (440, 22.4%) for males and 7:30 AM to 7:59 AM (340, 23.5%) for females.
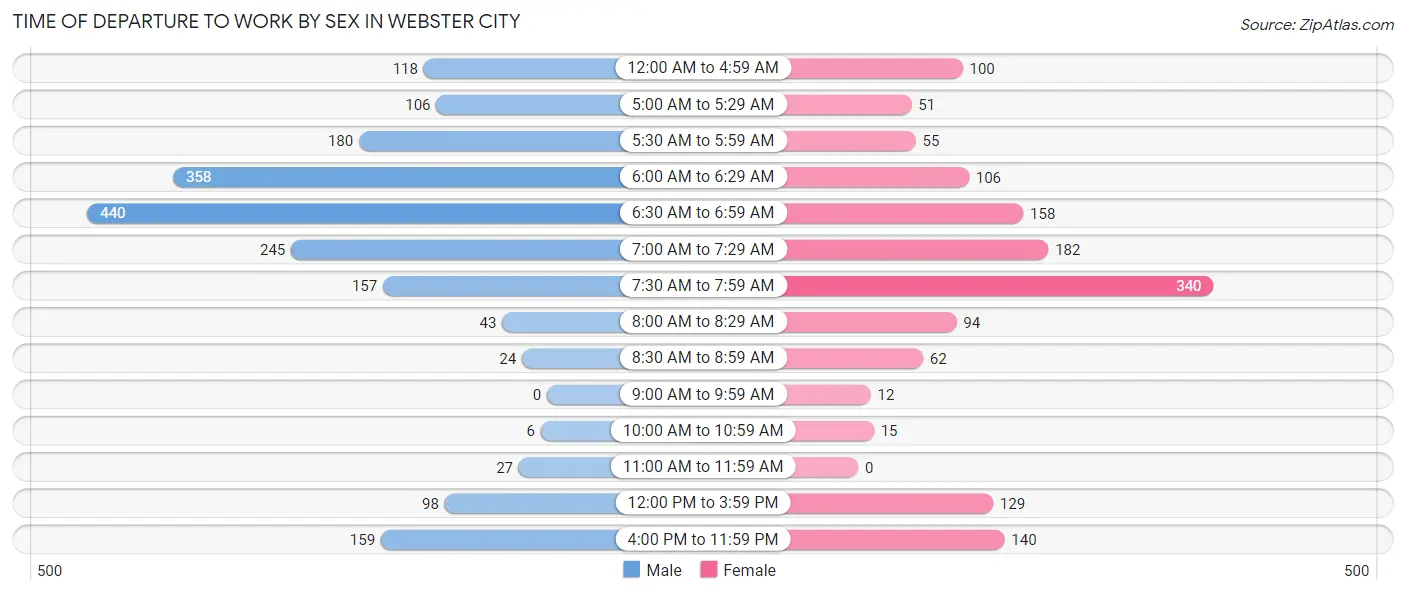
| Time of Departure | Male | Female |
| 12:00 AM to 4:59 AM | 118 (6.0%) | 100 (6.9%) |
| 5:00 AM to 5:29 AM | 106 (5.4%) | 51 (3.5%) |
| 5:30 AM to 5:59 AM | 180 (9.2%) | 55 (3.8%) |
| 6:00 AM to 6:29 AM | 358 (18.3%) | 106 (7.3%) |
| 6:30 AM to 6:59 AM | 440 (22.4%) | 158 (10.9%) |
| 7:00 AM to 7:29 AM | 245 (12.5%) | 182 (12.6%) |
| 7:30 AM to 7:59 AM | 157 (8.0%) | 340 (23.5%) |
| 8:00 AM to 8:29 AM | 43 (2.2%) | 94 (6.5%) |
| 8:30 AM to 8:59 AM | 24 (1.2%) | 62 (4.3%) |
| 9:00 AM to 9:59 AM | 0 (0.0%) | 12 (0.8%) |
| 10:00 AM to 10:59 AM | 6 (0.3%) | 15 (1.0%) |
| 11:00 AM to 11:59 AM | 27 (1.4%) | 0 (0.0%) |
| 12:00 PM to 3:59 PM | 98 (5.0%) | 129 (8.9%) |
| 4:00 PM to 11:59 PM | 159 (8.1%) | 140 (9.7%) |
| Total | 1,961 (100.0%) | 1,444 (100.0%) |
Housing Occupancy in Webster City
Occupancy by Ownership in Webster City
Of the total 3,292 dwellings in Webster City, owner-occupied units account for 2,036 (61.9%), while renter-occupied units make up 1,256 (38.2%).
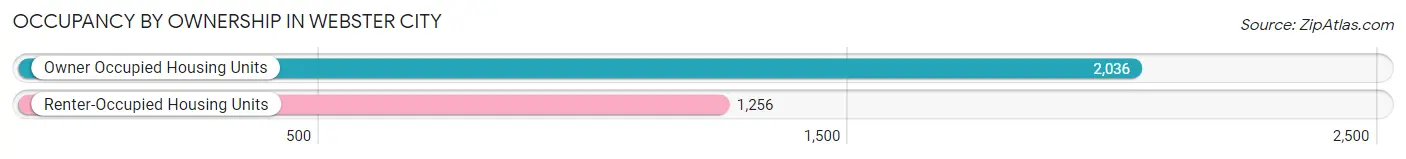
| Occupancy | # Housing Units | % Housing Units |
| Owner Occupied Housing Units | 2,036 | 61.9% |
| Renter-Occupied Housing Units | 1,256 | 38.2% |
| Total Occupied Housing Units | 3,292 | 100.0% |
Occupancy by Household Size in Webster City
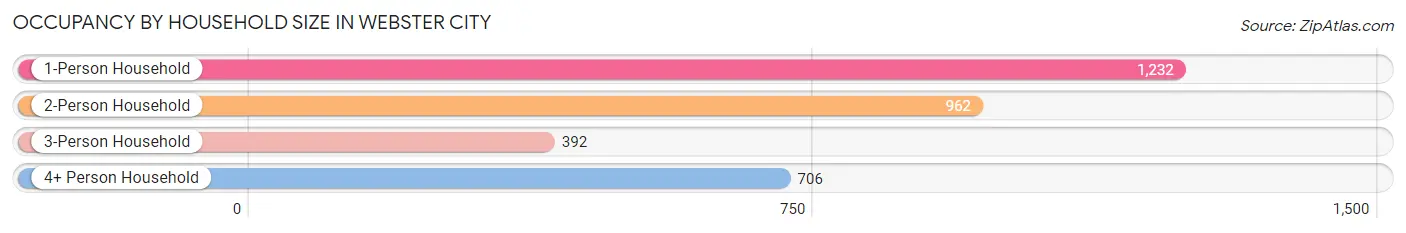
| Household Size | # Housing Units | % Housing Units |
| 1-Person Household | 1,232 | 37.4% |
| 2-Person Household | 962 | 29.2% |
| 3-Person Household | 392 | 11.9% |
| 4+ Person Household | 706 | 21.4% |
| Total Housing Units | 3,292 | 100.0% |
Occupancy by Ownership by Household Size in Webster City
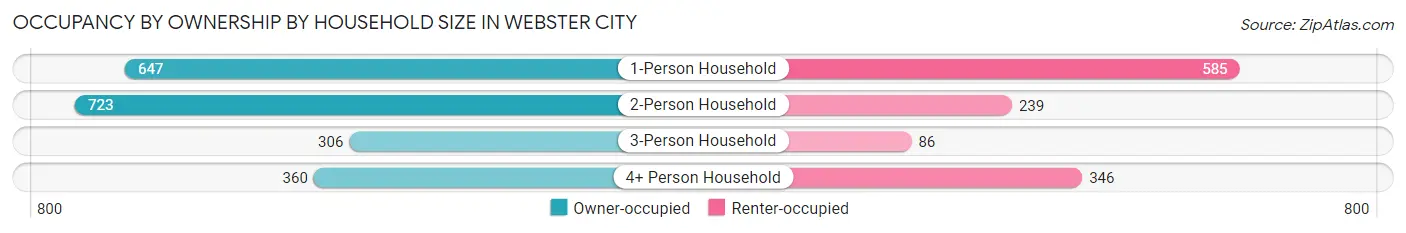
| Household Size | Owner-occupied | Renter-occupied |
| 1-Person Household | 647 (52.5%) | 585 (47.5%) |
| 2-Person Household | 723 (75.2%) | 239 (24.8%) |
| 3-Person Household | 306 (78.1%) | 86 (21.9%) |
| 4+ Person Household | 360 (51.0%) | 346 (49.0%) |
| Total Housing Units | 2,036 (61.9%) | 1,256 (38.2%) |
Occupancy by Educational Attainment in Webster City
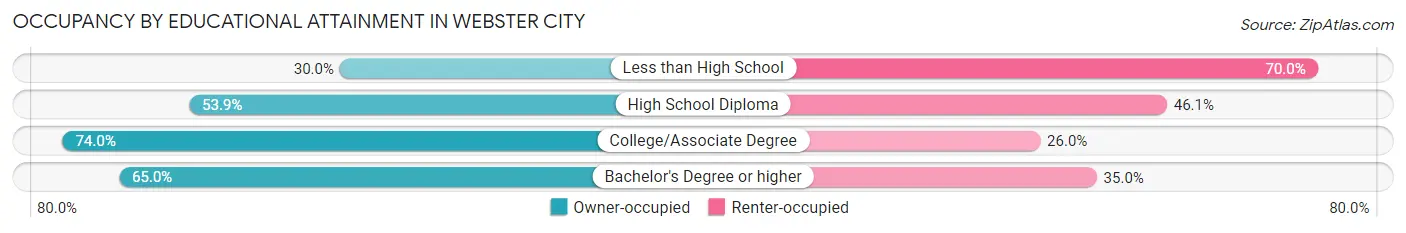
| Household Size | Owner-occupied | Renter-occupied |
| Less than High School | 75 (30.0%) | 175 (70.0%) |
| High School Diploma | 587 (53.9%) | 502 (46.1%) |
| College/Associate Degree | 859 (74.0%) | 302 (26.0%) |
| Bachelor's Degree or higher | 515 (65.0%) | 277 (35.0%) |
Occupancy by Age of Householder in Webster City
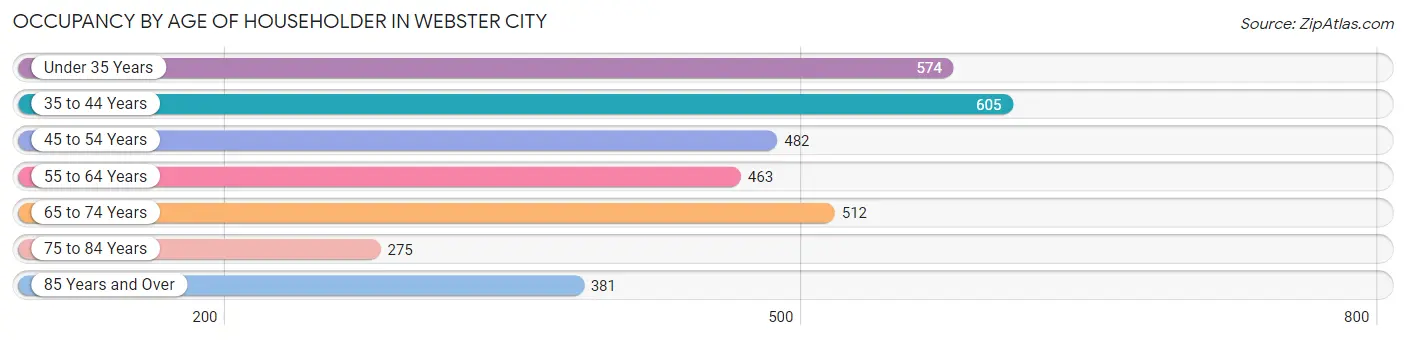
| Age Bracket | # Households | % Households |
| Under 35 Years | 574 | 17.4% |
| 35 to 44 Years | 605 | 18.4% |
| 45 to 54 Years | 482 | 14.6% |
| 55 to 64 Years | 463 | 14.1% |
| 65 to 74 Years | 512 | 15.5% |
| 75 to 84 Years | 275 | 8.4% |
| 85 Years and Over | 381 | 11.6% |
| Total | 3,292 | 100.0% |
Housing Finances in Webster City
Median Income by Occupancy in Webster City
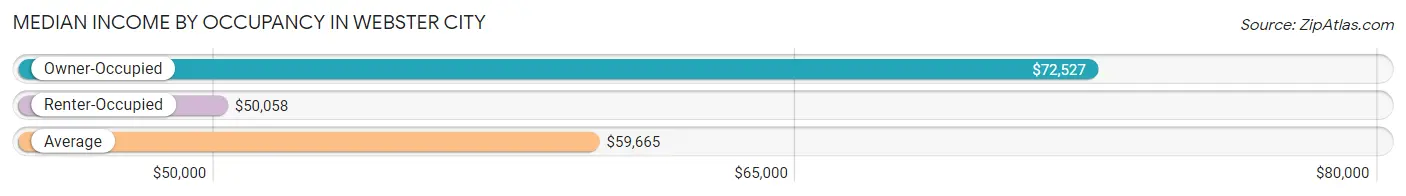
| Occupancy Type | # Households | Median Income |
| Owner-Occupied | 2,036 (61.9%) | $72,527 |
| Renter-Occupied | 1,256 (38.2%) | $50,058 |
| Average | 3,292 (100.0%) | $59,665 |
Occupancy by Householder Income Bracket in Webster City
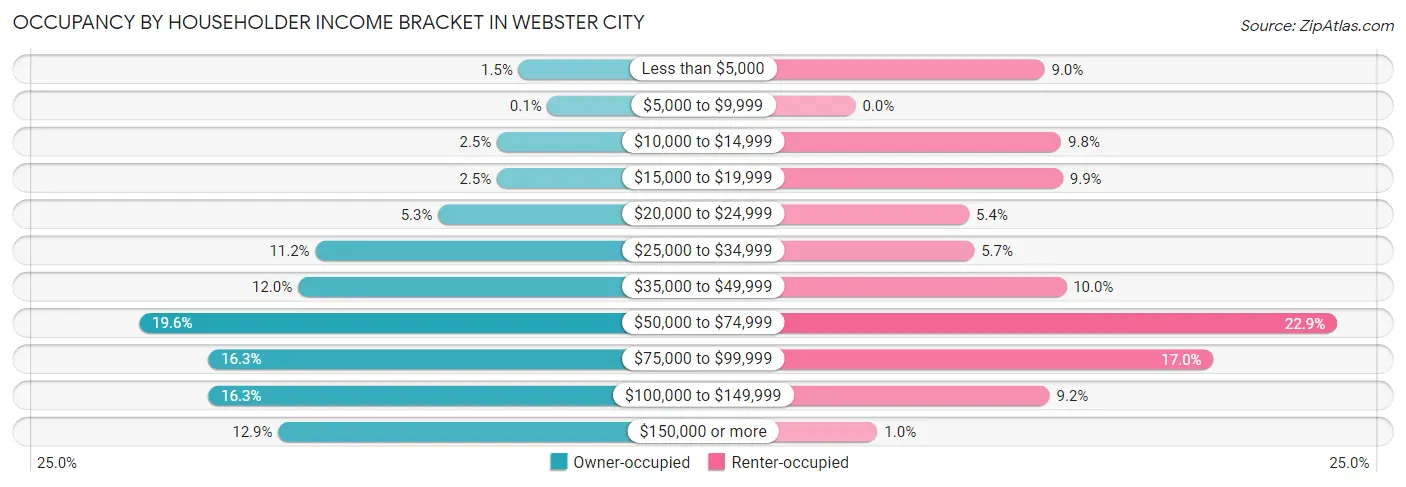
| Income Bracket | Owner-occupied | Renter-occupied |
| Less than $5,000 | 30 (1.5%) | 113 (9.0%) |
| $5,000 to $9,999 | 2 (0.1%) | 0 (0.0%) |
| $10,000 to $14,999 | 51 (2.5%) | 123 (9.8%) |
| $15,000 to $19,999 | 51 (2.5%) | 124 (9.9%) |
| $20,000 to $24,999 | 108 (5.3%) | 68 (5.4%) |
| $25,000 to $34,999 | 227 (11.2%) | 71 (5.7%) |
| $35,000 to $49,999 | 244 (12.0%) | 126 (10.0%) |
| $50,000 to $74,999 | 398 (19.6%) | 288 (22.9%) |
| $75,000 to $99,999 | 331 (16.3%) | 214 (17.0%) |
| $100,000 to $149,999 | 331 (16.3%) | 116 (9.2%) |
| $150,000 or more | 263 (12.9%) | 13 (1.0%) |
| Total | 2,036 (100.0%) | 1,256 (100.0%) |
Monthly Housing Cost Tiers in Webster City
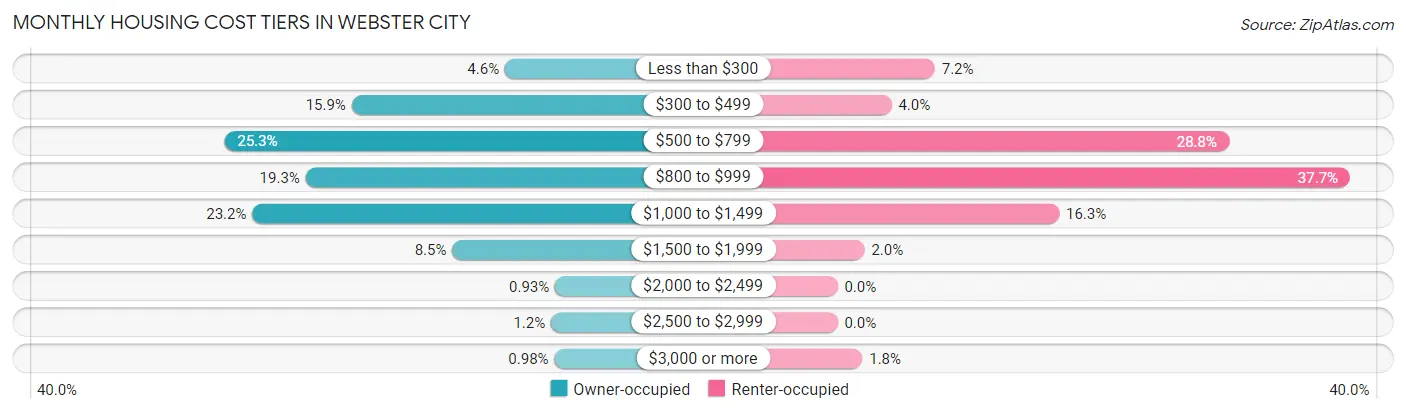
| Monthly Cost | Owner-occupied | Renter-occupied |
| Less than $300 | 94 (4.6%) | 90 (7.2%) |
| $300 to $499 | 324 (15.9%) | 50 (4.0%) |
| $500 to $799 | 515 (25.3%) | 362 (28.8%) |
| $800 to $999 | 393 (19.3%) | 474 (37.7%) |
| $1,000 to $1,499 | 473 (23.2%) | 205 (16.3%) |
| $1,500 to $1,999 | 173 (8.5%) | 25 (2.0%) |
| $2,000 to $2,499 | 19 (0.9%) | 0 (0.0%) |
| $2,500 to $2,999 | 25 (1.2%) | 0 (0.0%) |
| $3,000 or more | 20 (1.0%) | 23 (1.8%) |
| Total | 2,036 (100.0%) | 1,256 (100.0%) |
Physical Housing Characteristics in Webster City
Housing Structures in Webster City
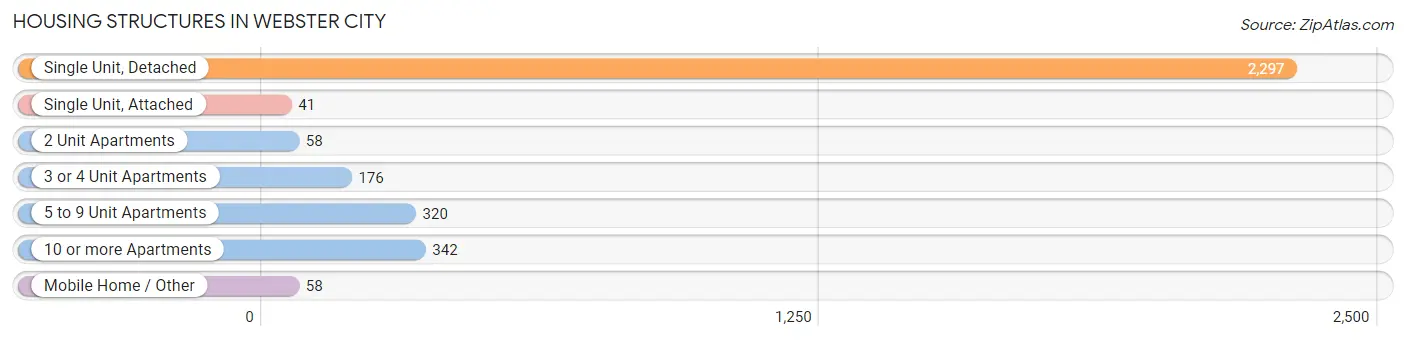
| Structure Type | # Housing Units | % Housing Units |
| Single Unit, Detached | 2,297 | 69.8% |
| Single Unit, Attached | 41 | 1.3% |
| 2 Unit Apartments | 58 | 1.8% |
| 3 or 4 Unit Apartments | 176 | 5.3% |
| 5 to 9 Unit Apartments | 320 | 9.7% |
| 10 or more Apartments | 342 | 10.4% |
| Mobile Home / Other | 58 | 1.8% |
| Total | 3,292 | 100.0% |
Housing Structures by Occupancy in Webster City
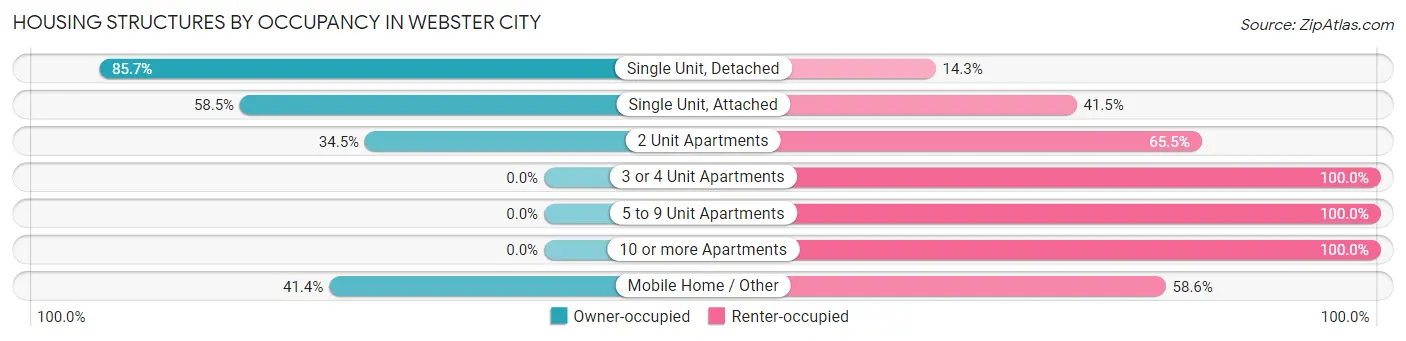
| Structure Type | Owner-occupied | Renter-occupied |
| Single Unit, Detached | 1,968 (85.7%) | 329 (14.3%) |
| Single Unit, Attached | 24 (58.5%) | 17 (41.5%) |
| 2 Unit Apartments | 20 (34.5%) | 38 (65.5%) |
| 3 or 4 Unit Apartments | 0 (0.0%) | 176 (100.0%) |
| 5 to 9 Unit Apartments | 0 (0.0%) | 320 (100.0%) |
| 10 or more Apartments | 0 (0.0%) | 342 (100.0%) |
| Mobile Home / Other | 24 (41.4%) | 34 (58.6%) |
| Total | 2,036 (61.9%) | 1,256 (38.2%) |
Housing Structures by Number of Rooms in Webster City
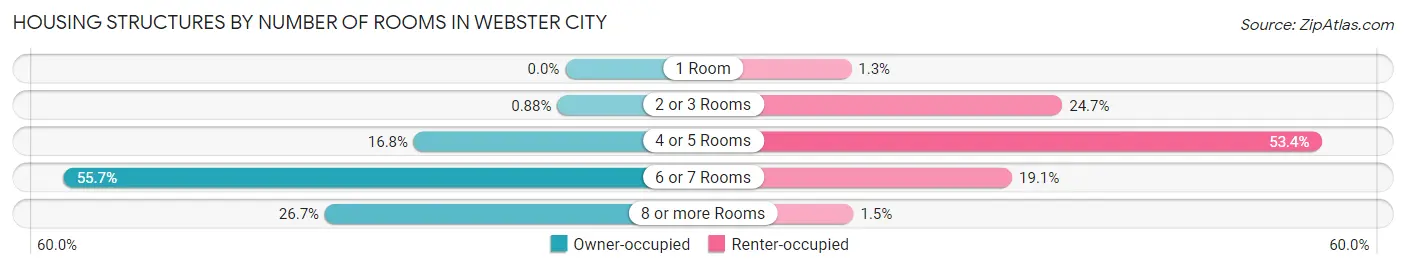
| Number of Rooms | Owner-occupied | Renter-occupied |
| 1 Room | 0 (0.0%) | 16 (1.3%) |
| 2 or 3 Rooms | 18 (0.9%) | 310 (24.7%) |
| 4 or 5 Rooms | 342 (16.8%) | 671 (53.4%) |
| 6 or 7 Rooms | 1,133 (55.6%) | 240 (19.1%) |
| 8 or more Rooms | 543 (26.7%) | 19 (1.5%) |
| Total | 2,036 (100.0%) | 1,256 (100.0%) |
Housing Structure by Heating Type in Webster City

| Heating Type | Owner-occupied | Renter-occupied |
| Utility Gas | 1,756 (86.3%) | 711 (56.6%) |
| Bottled, Tank, or LP Gas | 114 (5.6%) | 88 (7.0%) |
| Electricity | 166 (8.2%) | 457 (36.4%) |
| Fuel Oil or Kerosene | 0 (0.0%) | 0 (0.0%) |
| Coal or Coke | 0 (0.0%) | 0 (0.0%) |
| All other Fuels | 0 (0.0%) | 0 (0.0%) |
| No Fuel Used | 0 (0.0%) | 0 (0.0%) |
| Total | 2,036 (100.0%) | 1,256 (100.0%) |
Household Vehicle Usage in Webster City
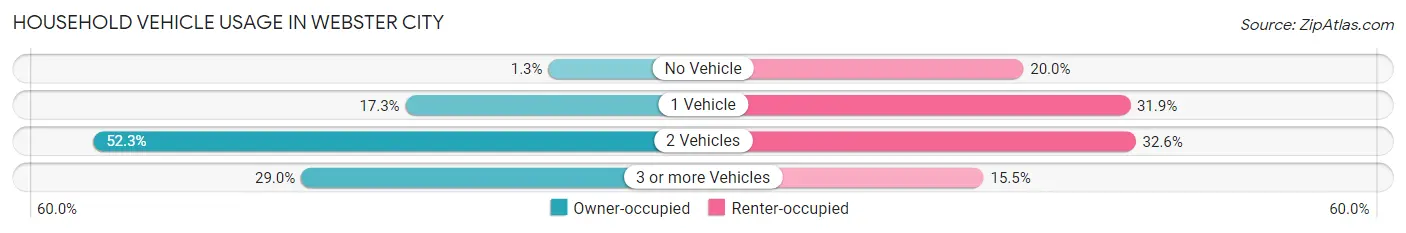
| Vehicles per Household | Owner-occupied | Renter-occupied |
| No Vehicle | 27 (1.3%) | 251 (20.0%) |
| 1 Vehicle | 353 (17.3%) | 401 (31.9%) |
| 2 Vehicles | 1,065 (52.3%) | 409 (32.6%) |
| 3 or more Vehicles | 591 (29.0%) | 195 (15.5%) |
| Total | 2,036 (100.0%) | 1,256 (100.0%) |
Real Estate & Mortgages in Webster City
Real Estate and Mortgage Overview in Webster City
| Characteristic | Without Mortgage | With Mortgage |
| Housing Units | 777 | 1,259 |
| Median Property Value | $90,400 | $95,900 |
| Median Household Income | $48,036 | $156 |
| Monthly Housing Costs | $488 | $20 |
| Real Estate Taxes | $1,644 | $0 |
Property Value by Mortgage Status in Webster City
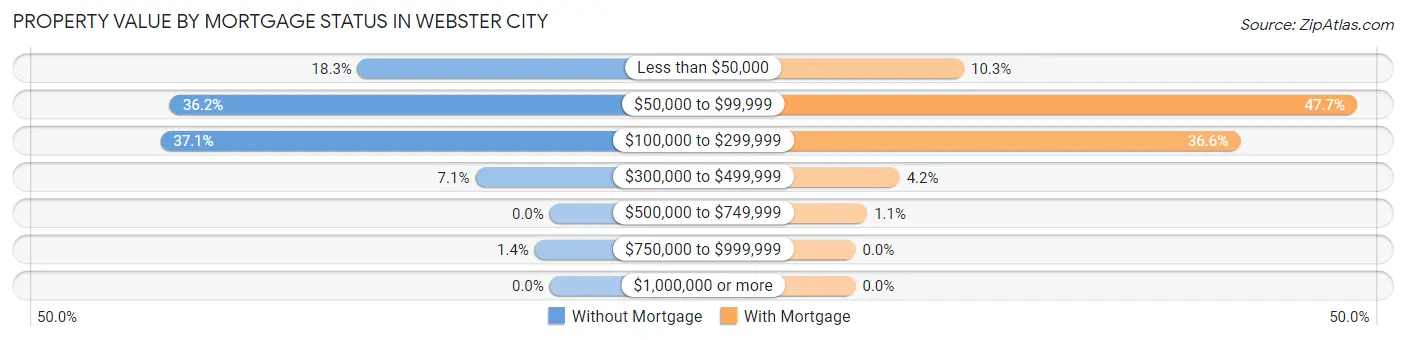
| Property Value | Without Mortgage | With Mortgage |
| Less than $50,000 | 142 (18.3%) | 130 (10.3%) |
| $50,000 to $99,999 | 281 (36.2%) | 601 (47.7%) |
| $100,000 to $299,999 | 288 (37.1%) | 461 (36.6%) |
| $300,000 to $499,999 | 55 (7.1%) | 53 (4.2%) |
| $500,000 to $749,999 | 0 (0.0%) | 14 (1.1%) |
| $750,000 to $999,999 | 11 (1.4%) | 0 (0.0%) |
| $1,000,000 or more | 0 (0.0%) | 0 (0.0%) |
| Total | 777 (100.0%) | 1,259 (100.0%) |
Household Income by Mortgage Status in Webster City
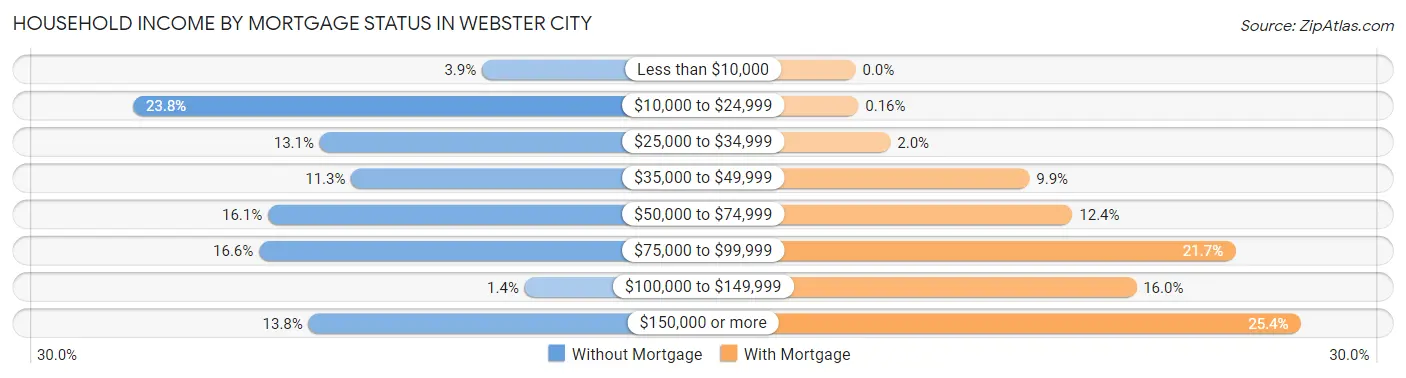
| Household Income | Without Mortgage | With Mortgage |
| Less than $10,000 | 30 (3.9%) | 0 (0.0%) |
| $10,000 to $24,999 | 185 (23.8%) | 2 (0.2%) |
| $25,000 to $34,999 | 102 (13.1%) | 25 (2.0%) |
| $35,000 to $49,999 | 88 (11.3%) | 125 (9.9%) |
| $50,000 to $74,999 | 125 (16.1%) | 156 (12.4%) |
| $75,000 to $99,999 | 129 (16.6%) | 273 (21.7%) |
| $100,000 to $149,999 | 11 (1.4%) | 202 (16.0%) |
| $150,000 or more | 107 (13.8%) | 320 (25.4%) |
| Total | 777 (100.0%) | 1,259 (100.0%) |
Property Value to Household Income Ratio in Webster City
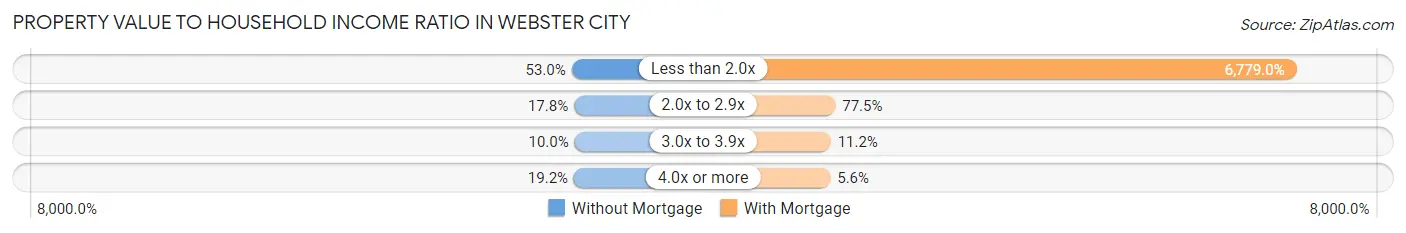
| Value-to-Income Ratio | Without Mortgage | With Mortgage |
| Less than 2.0x | 412 (53.0%) | 85,347 (6,779.0%) |
| 2.0x to 2.9x | 138 (17.8%) | 976 (77.5%) |
| 3.0x to 3.9x | 78 (10.0%) | 141 (11.2%) |
| 4.0x or more | 149 (19.2%) | 71 (5.6%) |
| Total | 777 (100.0%) | 1,259 (100.0%) |
Real Estate Taxes by Mortgage Status in Webster City
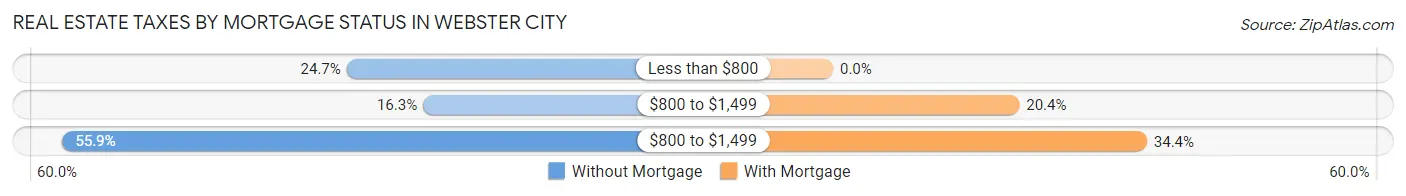
| Property Taxes | Without Mortgage | With Mortgage |
| Less than $800 | 192 (24.7%) | 0 (0.0%) |
| $800 to $1,499 | 127 (16.3%) | 257 (20.4%) |
| $800 to $1,499 | 434 (55.9%) | 433 (34.4%) |
| Total | 777 (100.0%) | 1,259 (100.0%) |
Health & Disability in Webster City
Health Insurance Coverage by Age in Webster City
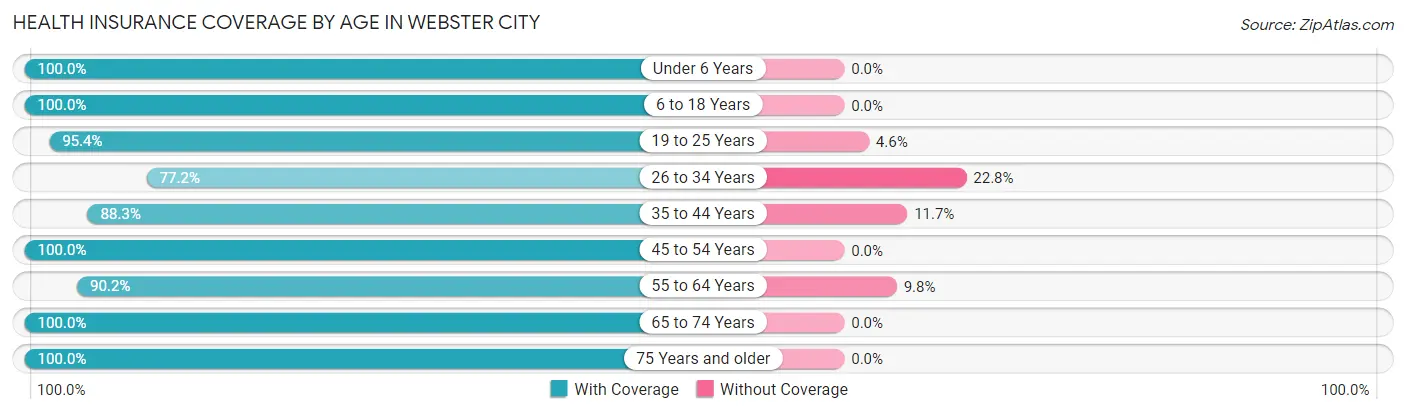
| Age Bracket | With Coverage | Without Coverage |
| Under 6 Years | 517 (100.0%) | 0 (0.0%) |
| 6 to 18 Years | 1,237 (100.0%) | 0 (0.0%) |
| 19 to 25 Years | 624 (95.4%) | 30 (4.6%) |
| 26 to 34 Years | 543 (77.2%) | 160 (22.8%) |
| 35 to 44 Years | 986 (88.3%) | 131 (11.7%) |
| 45 to 54 Years | 914 (100.0%) | 0 (0.0%) |
| 55 to 64 Years | 692 (90.2%) | 75 (9.8%) |
| 65 to 74 Years | 883 (100.0%) | 0 (0.0%) |
| 75 Years and older | 815 (100.0%) | 0 (0.0%) |
| Total | 7,211 (94.8%) | 396 (5.2%) |
Health Insurance Coverage by Citizenship Status in Webster City
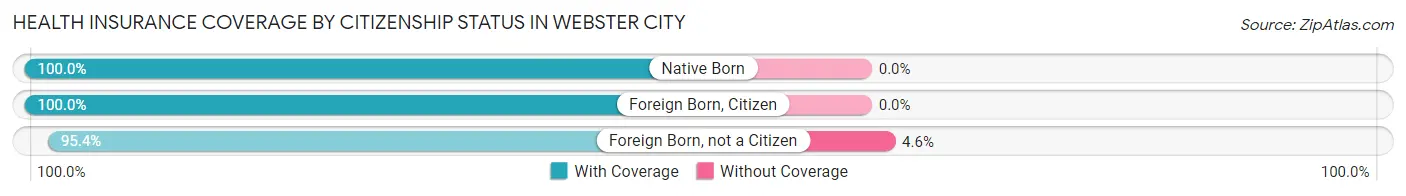
| Citizenship Status | With Coverage | Without Coverage |
| Native Born | 517 (100.0%) | 0 (0.0%) |
| Foreign Born, Citizen | 1,237 (100.0%) | 0 (0.0%) |
| Foreign Born, not a Citizen | 624 (95.4%) | 30 (4.6%) |
Health Insurance Coverage by Household Income in Webster City
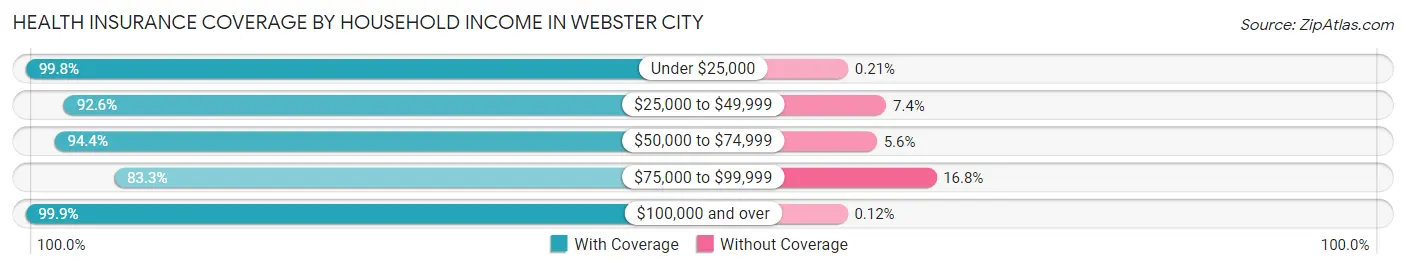
| Household Income | With Coverage | Without Coverage |
| Under $25,000 | 942 (99.8%) | 2 (0.2%) |
| $25,000 to $49,999 | 1,082 (92.6%) | 86 (7.4%) |
| $50,000 to $74,999 | 1,583 (94.4%) | 94 (5.6%) |
| $75,000 to $99,999 | 1,049 (83.3%) | 211 (16.8%) |
| $100,000 and over | 2,543 (99.9%) | 3 (0.1%) |
Public vs Private Health Insurance Coverage by Age in Webster City
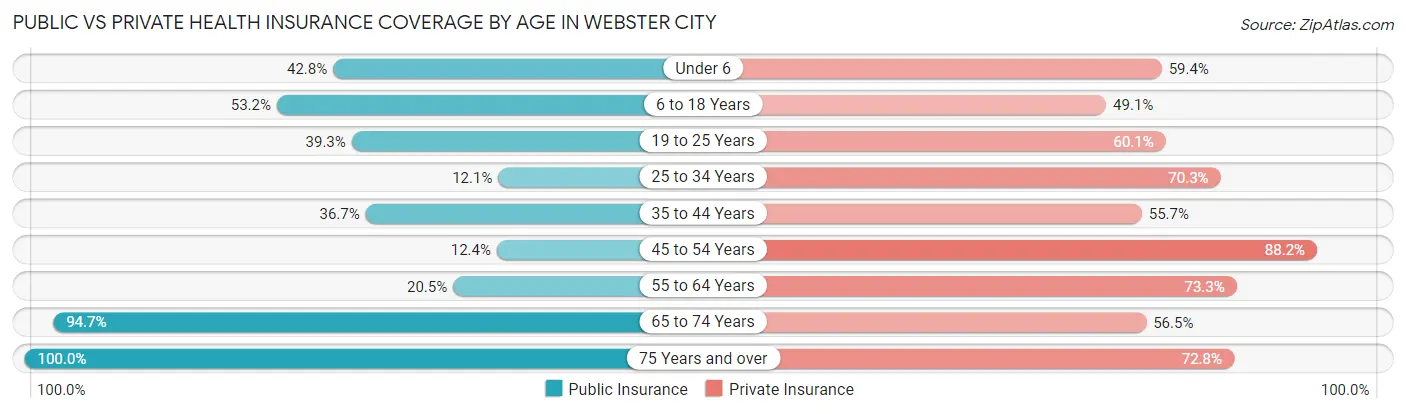
| Age Bracket | Public Insurance | Private Insurance |
| Under 6 | 221 (42.7%) | 307 (59.4%) |
| 6 to 18 Years | 658 (53.2%) | 607 (49.1%) |
| 19 to 25 Years | 257 (39.3%) | 393 (60.1%) |
| 25 to 34 Years | 85 (12.1%) | 494 (70.3%) |
| 35 to 44 Years | 410 (36.7%) | 622 (55.7%) |
| 45 to 54 Years | 113 (12.4%) | 806 (88.2%) |
| 55 to 64 Years | 157 (20.5%) | 562 (73.3%) |
| 65 to 74 Years | 836 (94.7%) | 499 (56.5%) |
| 75 Years and over | 815 (100.0%) | 593 (72.8%) |
| Total | 3,552 (46.7%) | 4,883 (64.2%) |
Disability Status by Sex by Age in Webster City
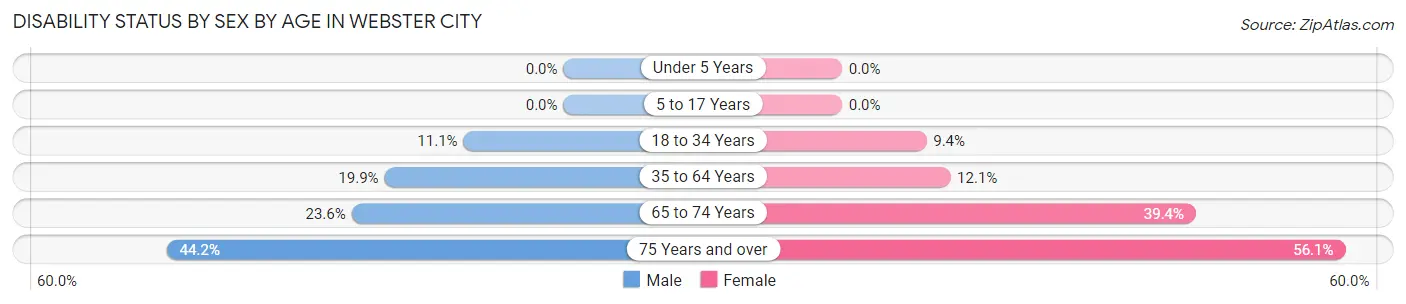
| Age Bracket | Male | Female |
| Under 5 Years | 0 (0.0%) | 0 (0.0%) |
| 5 to 17 Years | 0 (0.0%) | 0 (0.0%) |
| 18 to 34 Years | 76 (11.1%) | 65 (9.4%) |
| 35 to 64 Years | 305 (19.9%) | 153 (12.1%) |
| 65 to 74 Years | 109 (23.6%) | 166 (39.4%) |
| 75 Years and over | 171 (44.2%) | 240 (56.1%) |
Disability Class by Sex by Age in Webster City
Disability Class: Hearing Difficulty
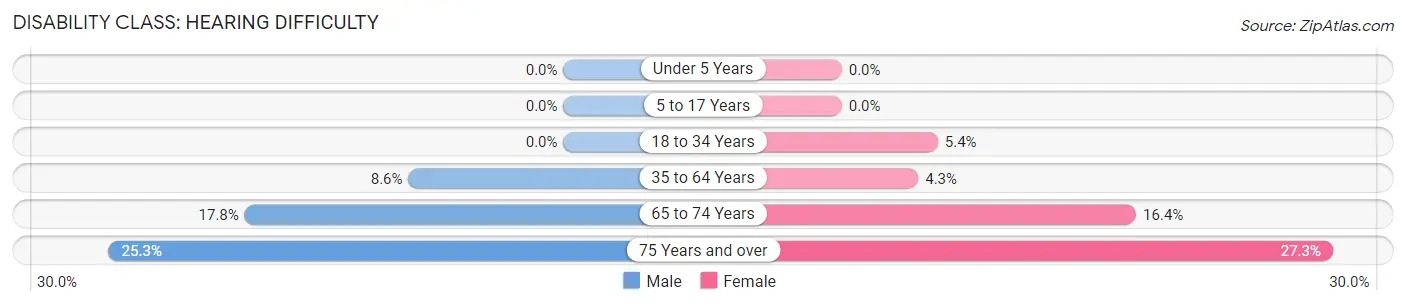
| Age Bracket | Male | Female |
| Under 5 Years | 0 (0.0%) | 0 (0.0%) |
| 5 to 17 Years | 0 (0.0%) | 0 (0.0%) |
| 18 to 34 Years | 0 (0.0%) | 37 (5.3%) |
| 35 to 64 Years | 132 (8.6%) | 54 (4.3%) |
| 65 to 74 Years | 82 (17.7%) | 69 (16.4%) |
| 75 Years and over | 98 (25.3%) | 117 (27.3%) |
Disability Class: Vision Difficulty
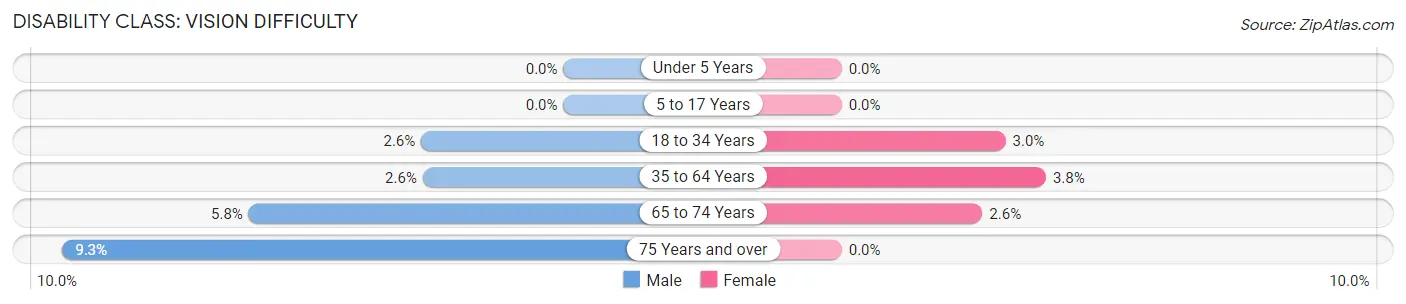
| Age Bracket | Male | Female |
| Under 5 Years | 0 (0.0%) | 0 (0.0%) |
| 5 to 17 Years | 0 (0.0%) | 0 (0.0%) |
| 18 to 34 Years | 18 (2.6%) | 21 (3.0%) |
| 35 to 64 Years | 40 (2.6%) | 48 (3.8%) |
| 65 to 74 Years | 27 (5.8%) | 11 (2.6%) |
| 75 Years and over | 36 (9.3%) | 0 (0.0%) |
Disability Class: Cognitive Difficulty
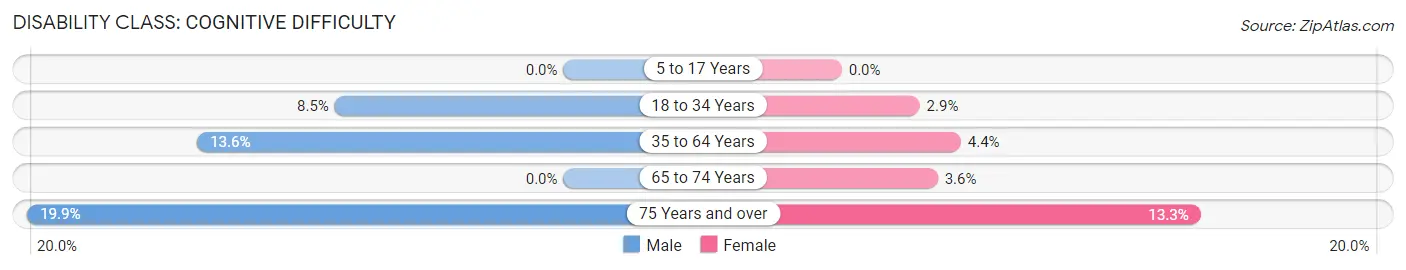
| Age Bracket | Male | Female |
| 5 to 17 Years | 0 (0.0%) | 0 (0.0%) |
| 18 to 34 Years | 58 (8.5%) | 20 (2.9%) |
| 35 to 64 Years | 208 (13.6%) | 56 (4.4%) |
| 65 to 74 Years | 0 (0.0%) | 15 (3.6%) |
| 75 Years and over | 77 (19.9%) | 57 (13.3%) |
Disability Class: Ambulatory Difficulty
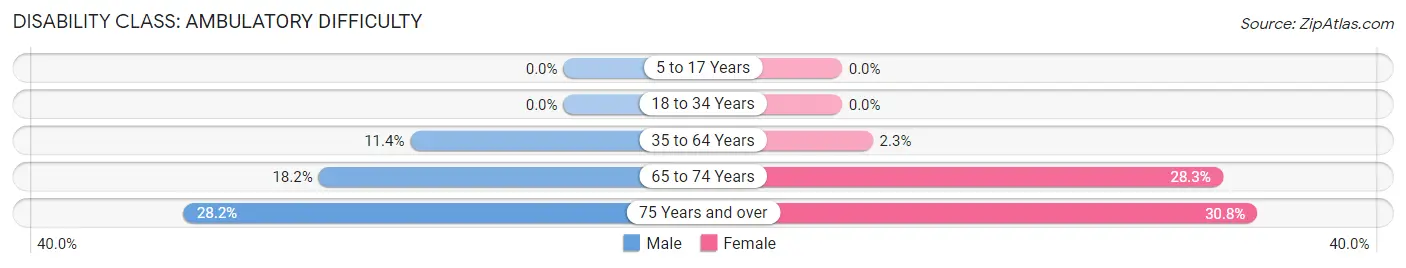
| Age Bracket | Male | Female |
| 5 to 17 Years | 0 (0.0%) | 0 (0.0%) |
| 18 to 34 Years | 0 (0.0%) | 0 (0.0%) |
| 35 to 64 Years | 174 (11.4%) | 29 (2.3%) |
| 65 to 74 Years | 84 (18.2%) | 119 (28.3%) |
| 75 Years and over | 109 (28.2%) | 132 (30.8%) |
Disability Class: Self-Care Difficulty
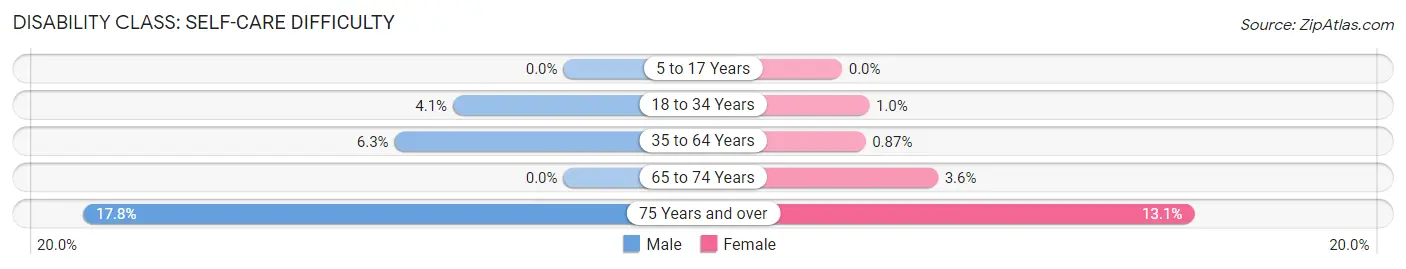
| Age Bracket | Male | Female |
| 5 to 17 Years | 0 (0.0%) | 0 (0.0%) |
| 18 to 34 Years | 28 (4.1%) | 7 (1.0%) |
| 35 to 64 Years | 96 (6.3%) | 11 (0.9%) |
| 65 to 74 Years | 0 (0.0%) | 15 (3.6%) |
| 75 Years and over | 69 (17.8%) | 56 (13.1%) |
Technology Access in Webster City
Computing Device Access in Webster City
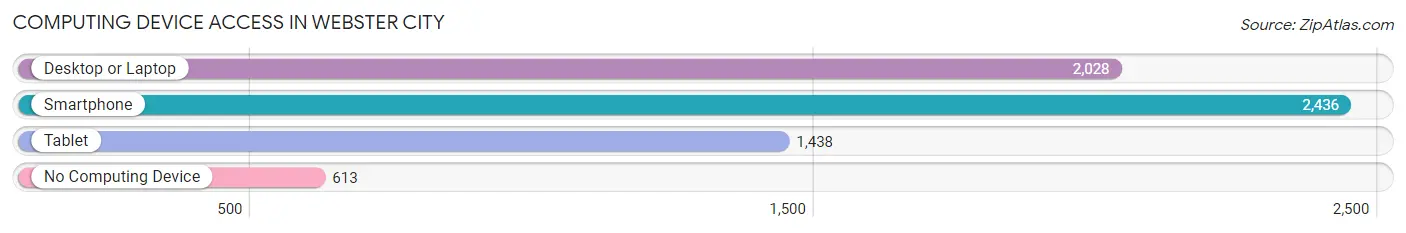
| Device Type | # Households | % Households |
| Desktop or Laptop | 2,028 | 61.6% |
| Smartphone | 2,436 | 74.0% |
| Tablet | 1,438 | 43.7% |
| No Computing Device | 613 | 18.6% |
| Total | 3,292 | 100.0% |
Internet Access in Webster City
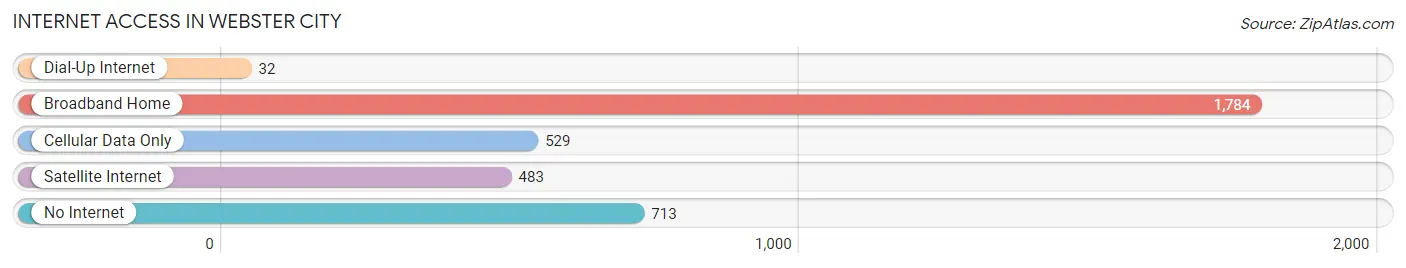
| Internet Type | # Households | % Households |
| Dial-Up Internet | 32 | 1.0% |
| Broadband Home | 1,784 | 54.2% |
| Cellular Data Only | 529 | 16.1% |
| Satellite Internet | 483 | 14.7% |
| No Internet | 713 | 21.7% |
| Total | 3,292 | 100.0% |
Webster City Summary
Webster City, Iowa is a small city located in Hamilton County in the north-central part of the state. It is situated along the Boone River and is part of the Fort Dodge, Iowa Metropolitan Statistical Area. The city has a population of 8,070 as of the 2020 census, making it the largest city in Hamilton County.
History
Webster City was founded in 1855 by John F. Duncombe, a prominent local businessman. The city was named after Daniel Webster, a prominent statesman and orator from the early 19th century. The city was incorporated in 1876 and has since grown to become the largest city in Hamilton County.
The city was an important stop on the Chicago and North Western Railway, which ran through the city from 1882 to 1970. The railway was a major factor in the city's growth and development, and it was also the site of the first telephone exchange in the state of Iowa.
Geography
Webster City is located in north-central Iowa, about 50 miles north of Des Moines. It is situated along the Boone River, which flows through the city and is a popular recreational spot for fishing and boating. The city is surrounded by rolling hills and farmland, and is located in the heart of the Corn Belt.
The city has a total area of 4.3 square miles, all of which is land. The average elevation is 1,068 feet above sea level.
Economy
Webster City has a diverse economy, with a mix of manufacturing, retail, and service industries. The city is home to several large employers, including Van Diest Supply Company, a manufacturer of agricultural products, and Hamilton County Health Center, a medical facility.
The city also has a thriving retail sector, with several large stores and restaurants located in the downtown area. The city is also home to several small businesses, including a number of antique stores and specialty shops.
Demographics
As of the 2020 census, Webster City had a population of 8,070. The racial makeup of the city was 95.2% White, 0.7% African American, 0.3% Native American, 0.7% Asian, 0.1% Pacific Islander, 1.3% from other races, and 1.9% from two or more races. Hispanic or Latino of any race were 3.2% of the population.
The median household income in Webster City was $45,845, and the median family income was $54,945. The per capita income was $22,845. About 11.2% of the population was below the poverty line.
The city is served by the Webster City Community School District, which includes two elementary schools, one middle school, and one high school. The city also has a public library and several parks.
Common Questions
What is Per Capita Income in Webster City?
Per Capita income in Webster City is $31,759.
What is the Median Family Income in Webster City?
Median Family Income in Webster City is $74,112.
What is the Median Household income in Webster City?
Median Household Income in Webster City is $59,665.
What is Income or Wage Gap in Webster City?
Income or Wage Gap in Webster City is 48.3%.
Women in Webster City earn 51.7 cents for every dollar earned by a man.
What is Inequality or Gini Index in Webster City?
Inequality or Gini Index in Webster City is 0.40.
What is the Total Population of Webster City?
Total Population of Webster City is 7,787.
What is the Total Male Population of Webster City?
Total Male Population of Webster City is 4,174.
What is the Total Female Population of Webster City?
Total Female Population of Webster City is 3,613.
What is the Ratio of Males per 100 Females in Webster City?
There are 115.53 Males per 100 Females in Webster City.
What is the Ratio of Females per 100 Males in Webster City?
There are 86.56 Females per 100 Males in Webster City.
What is the Median Population Age in Webster City?
Median Population Age in Webster City is 40.8 Years.
What is the Average Family Size in Webster City
Average Family Size in Webster City is 3.1 People.
What is the Average Household Size in Webster City
Average Household Size in Webster City is 2.3 People.
How Large is the Labor Force in Webster City?
There are 3,732 People in the Labor Forcein in Webster City.
What is the Percentage of People in the Labor Force in Webster City?
60.2% of People are in the Labor Force in Webster City.
What is the Unemployment Rate in Webster City?
Unemployment Rate in Webster City is 4.4%.