Zip Codes with the Highest Percentage of Population Employed in Arts, Entertainment & Recreation in Waterloo, IA
RELATED REPORTS & OPTIONS
Arts, Entertainment & Recreation
Waterloo
Compare Zip Codes
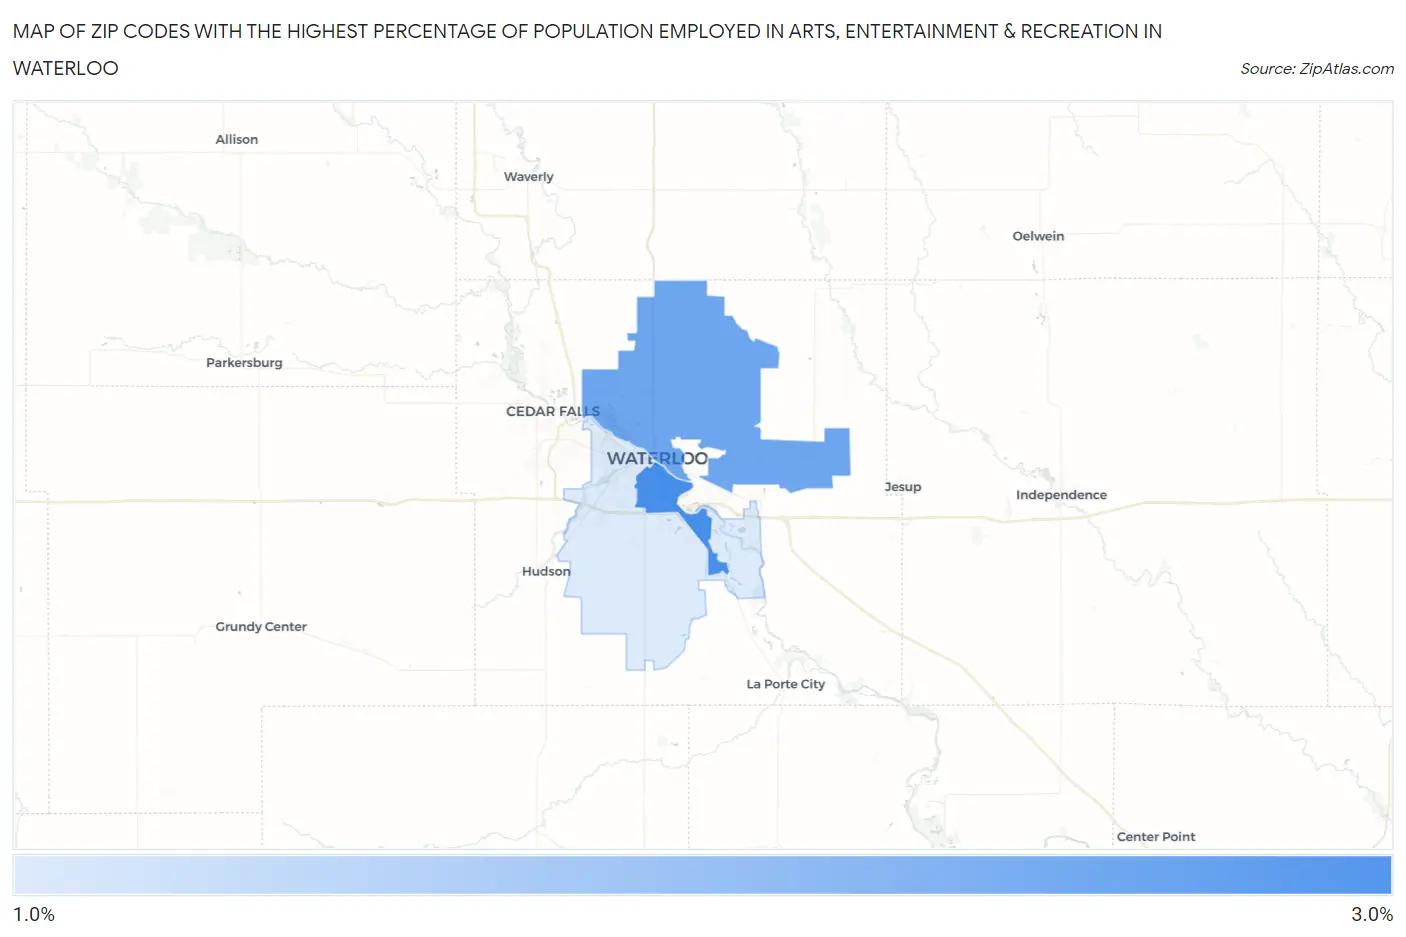
Map of Zip Codes with the Highest Percentage of Population Employed in Arts, Entertainment & Recreation in Waterloo
0.0%
3.0%
Zip Codes with the Highest Percentage of Population Employed in Arts, Entertainment & Recreation in Waterloo, IA
| Zip Code | % Employed | vs State | vs National | |
| 1. | 50702 | 3.0% | 1.5%(+1.47)#88 | 2.1%(+0.906)#5,383 |
| 2. | 50703 | 2.5% | 1.5%(+1.02)#121 | 2.1%(+0.452)#7,025 |
| 3. | 50701 | 1.3% | 1.5%(-0.237)#289 | 2.1%(-0.802)#14,860 |
1
Common Questions
What are the Top Zip Codes with the Highest Percentage of Population Employed in Arts, Entertainment & Recreation in Waterloo, IA?
Top Zip Codes with the Highest Percentage of Population Employed in Arts, Entertainment & Recreation in Waterloo, IA are:
What zip code has the Highest Percentage of Population Employed in Arts, Entertainment & Recreation in Waterloo, IA?
50702 has the Highest Percentage of Population Employed in Arts, Entertainment & Recreation in Waterloo, IA with 3.0%.
What is the Percentage of Population Employed in Arts, Entertainment & Recreation in Waterloo, IA?
Percentage of Population Employed in Arts, Entertainment & Recreation in Waterloo is 2.2%.
What is the Percentage of Population Employed in Arts, Entertainment & Recreation in Iowa?
Percentage of Population Employed in Arts, Entertainment & Recreation in Iowa is 1.5%.
What is the Percentage of Population Employed in Arts, Entertainment & Recreation in the United States?
Percentage of Population Employed in Arts, Entertainment & Recreation in the United States is 2.1%.