Vincent, IA Map & Demographics
Vincent Map
Vincent Overview
$47,530
PER CAPITA INCOME
$57,426
AVG FAMILY INCOME
$57,059
AVG HOUSEHOLD INCOME
36.3%
WAGE / INCOME GAP [ % ]
63.7¢/ $1
WAGE / INCOME GAP [ $ ]
0.42
INEQUALITY / GINI INDEX
119
TOTAL POPULATION
64
MALE POPULATION
55
FEMALE POPULATION
116.36
MALES / 100 FEMALES
85.94
FEMALES / 100 MALES
34.8
MEDIAN AGE
2.1
AVG FAMILY SIZE
1.8
AVG HOUSEHOLD SIZE
78
LABOR FORCE [ PEOPLE ]
72.9%
PERCENT IN LABOR FORCE
1.3%
UNEMPLOYMENT RATE
Vincent Zip Codes
Vincent Area Codes
Income in Vincent
Income Overview in Vincent
Per Capita Income in Vincent is $47,530, while median incomes of families and households are $57,426 and $57,059 respectively.
| Characteristic | Number | Measure |
| Per Capita Income | 119 | $47,530 |
| Median Family Income | 47 | $57,426 |
| Mean Family Income | 47 | $80,538 |
| Median Household Income | 66 | $57,059 |
| Mean Household Income | 66 | $89,453 |
| Income Deficit | 47 | $0 |
| Wage / Income Gap (%) | 119 | 36.31% |
| Wage / Income Gap ($) | 119 | 63.69¢ per $1 |
| Gini / Inequality Index | 119 | 0.42 |
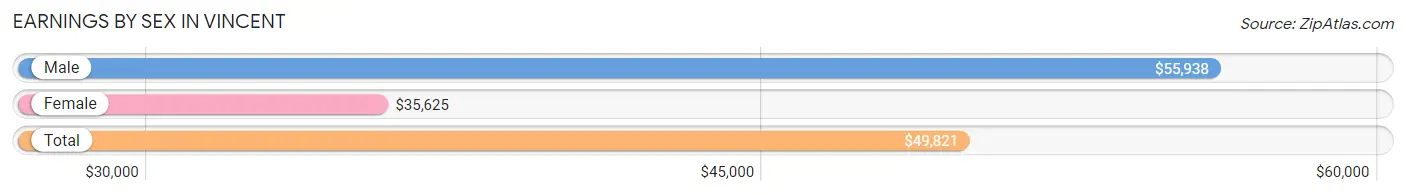
Earnings by Sex in Vincent
Average Earnings in Vincent are $49,821, $55,938 for men and $35,625 for women, a difference of 36.3%.
| Sex | Number | Average Earnings |
| Male | 52 (64.2%) | $55,938 |
| Female | 29 (35.8%) | $35,625 |
| Total | 81 (100.0%) | $49,821 |
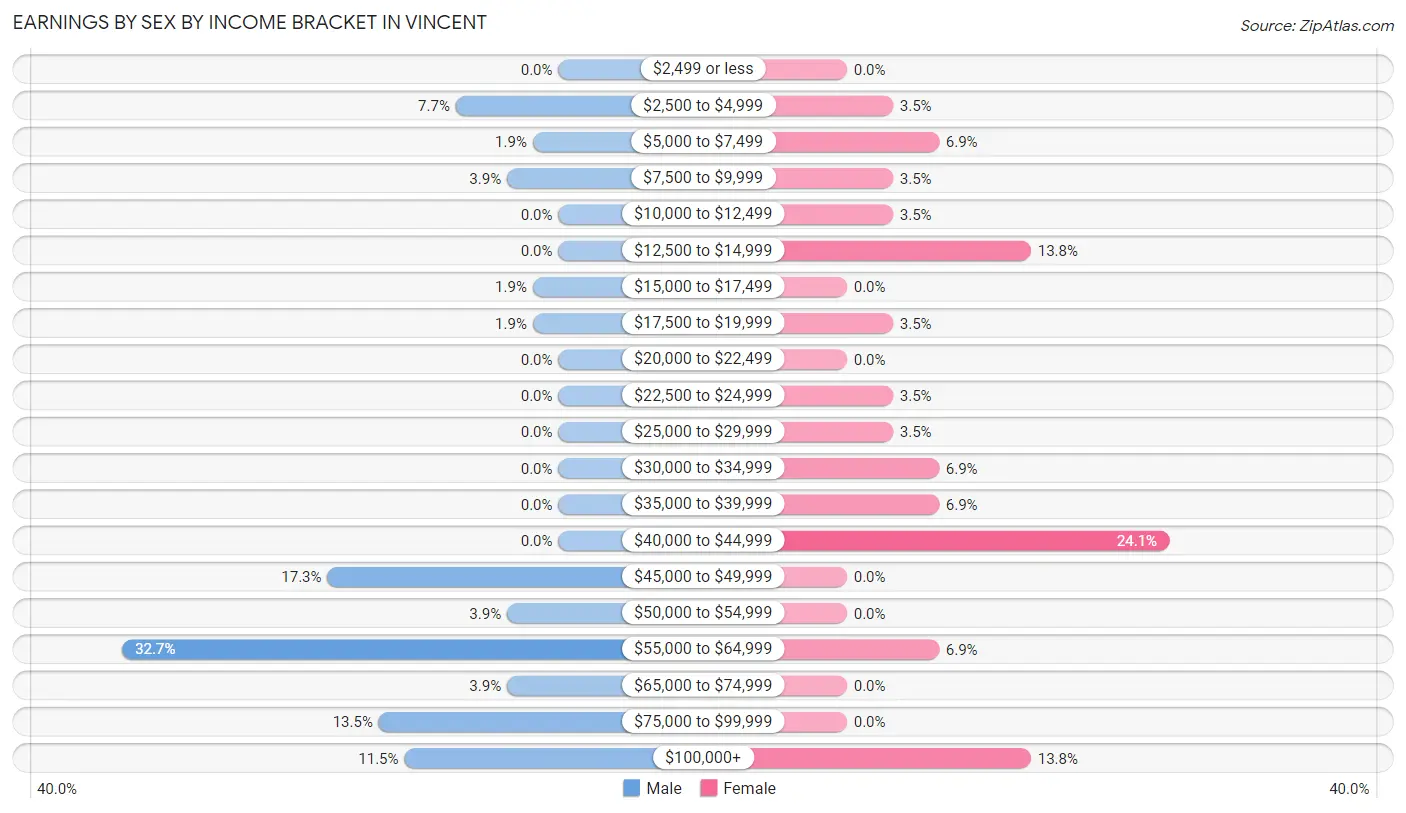
Earnings by Sex by Income Bracket in Vincent
The most common earnings brackets in Vincent are $55,000 to $64,999 for men (17 | 32.7%) and $40,000 to $44,999 for women (7 | 24.1%).
| Income | Male | Female |
| $2,499 or less | 0 (0.0%) | 0 (0.0%) |
| $2,500 to $4,999 | 4 (7.7%) | 1 (3.5%) |
| $5,000 to $7,499 | 1 (1.9%) | 2 (6.9%) |
| $7,500 to $9,999 | 2 (3.8%) | 1 (3.5%) |
| $10,000 to $12,499 | 0 (0.0%) | 1 (3.5%) |
| $12,500 to $14,999 | 0 (0.0%) | 4 (13.8%) |
| $15,000 to $17,499 | 1 (1.9%) | 0 (0.0%) |
| $17,500 to $19,999 | 1 (1.9%) | 1 (3.5%) |
| $20,000 to $22,499 | 0 (0.0%) | 0 (0.0%) |
| $22,500 to $24,999 | 0 (0.0%) | 1 (3.5%) |
| $25,000 to $29,999 | 0 (0.0%) | 1 (3.5%) |
| $30,000 to $34,999 | 0 (0.0%) | 2 (6.9%) |
| $35,000 to $39,999 | 0 (0.0%) | 2 (6.9%) |
| $40,000 to $44,999 | 0 (0.0%) | 7 (24.1%) |
| $45,000 to $49,999 | 9 (17.3%) | 0 (0.0%) |
| $50,000 to $54,999 | 2 (3.8%) | 0 (0.0%) |
| $55,000 to $64,999 | 17 (32.7%) | 2 (6.9%) |
| $65,000 to $74,999 | 2 (3.8%) | 0 (0.0%) |
| $75,000 to $99,999 | 7 (13.5%) | 0 (0.0%) |
| $100,000+ | 6 (11.5%) | 4 (13.8%) |
| Total | 52 (100.0%) | 29 (100.0%) |
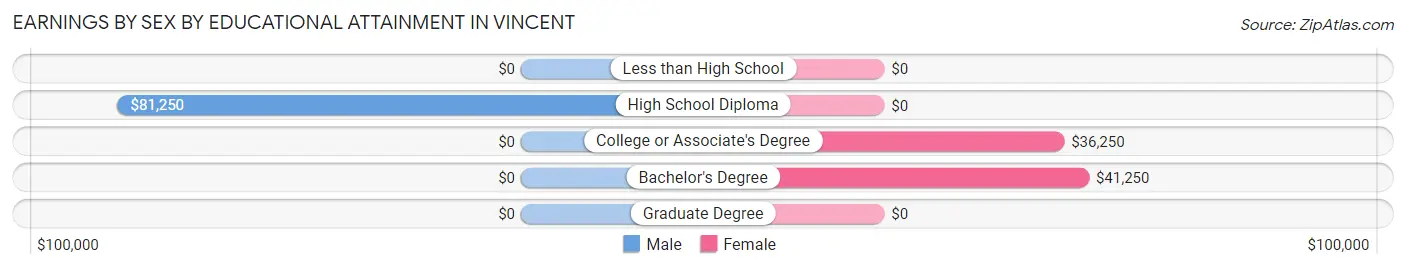
Earnings by Sex by Educational Attainment in Vincent
Average earnings in Vincent are $56,641 for men and $38,750 for women, a difference of 31.6%. Men with an educational attainment of high school diploma enjoy the highest average annual earnings of $81,250, while those with high school diploma education earn the least with $81,250. Women with an educational attainment of bachelor's degree earn the most with the average annual earnings of $41,250, while those with college or associate's degree education have the smallest earnings of $36,250.
| Educational Attainment | Male Income | Female Income |
| Less than High School | - | - |
| High School Diploma | $81,250 | $0 |
| College or Associate's Degree | - | - |
| Bachelor's Degree | - | - |
| Graduate Degree | - | - |
| Total | $56,641 | $38,750 |
Family Income in Vincent
Family Income Brackets in Vincent
According to the Vincent family income data, there are 21 families falling into the $50,000 to $74,999 income range, which is the most common income bracket and makes up 44.7% of all families.
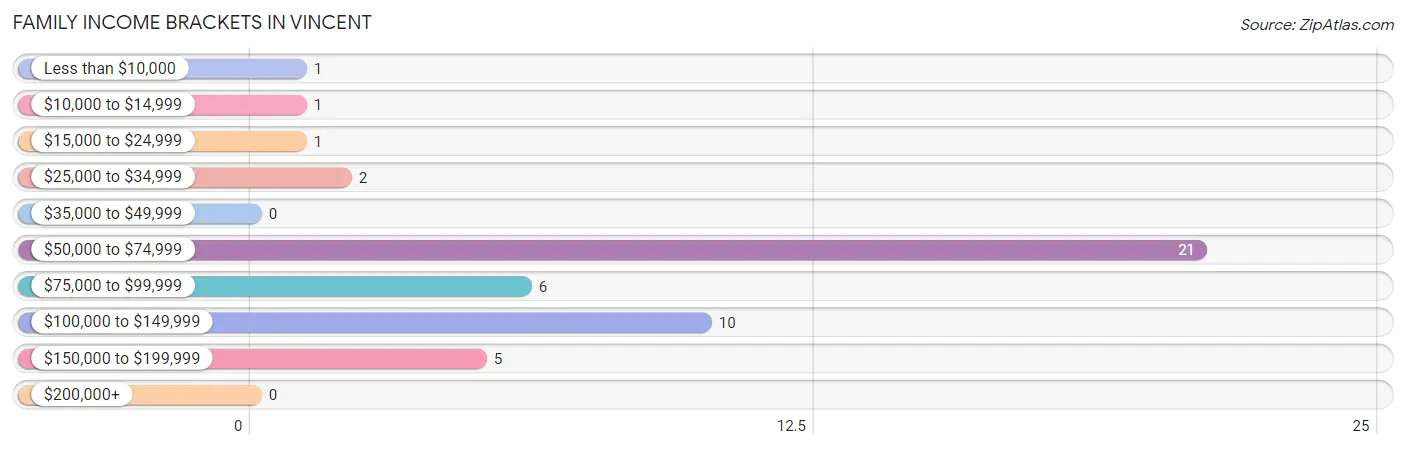
| Income Bracket | # Families | % Families |
| Less than $10,000 | 1 | 2.1% |
| $10,000 to $14,999 | 1 | 2.1% |
| $15,000 to $24,999 | 1 | 2.1% |
| $25,000 to $34,999 | 2 | 4.3% |
| $35,000 to $49,999 | 0 | 0.0% |
| $50,000 to $74,999 | 21 | 44.7% |
| $75,000 to $99,999 | 6 | 12.8% |
| $100,000 to $149,999 | 10 | 21.3% |
| $150,000 to $199,999 | 5 | 10.6% |
| $200,000+ | 0 | 0.0% |
Family Income by Famaliy Size in Vincent
3-person families (14 | 29.8%) account for the highest median family income in Vincent with $145,833 per family, while 3-person families (14 | 29.8%) have the highest median income of $48,611 per family member.
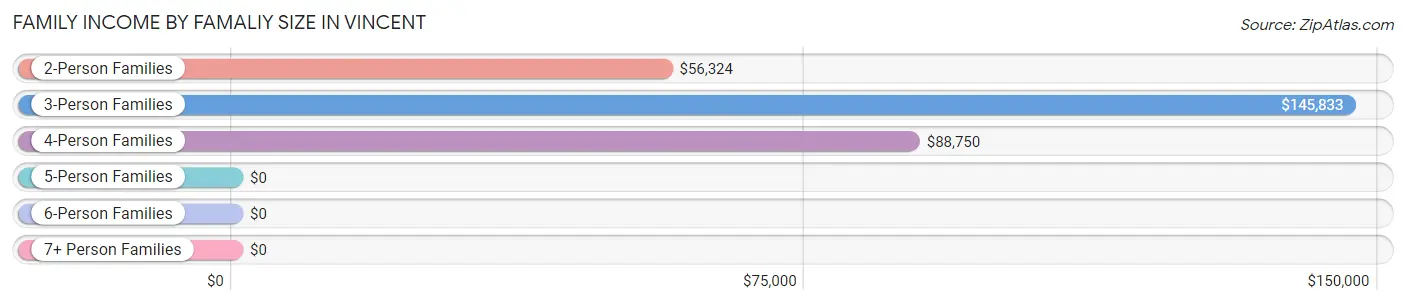
| Income Bracket | # Families | Median Income |
| 2-Person Families | 30 (63.8%) | $56,324 |
| 3-Person Families | 14 (29.8%) | $145,833 |
| 4-Person Families | 3 (6.4%) | $88,750 |
| 5-Person Families | 0 (0.0%) | $0 |
| 6-Person Families | 0 (0.0%) | $0 |
| 7+ Person Families | 0 (0.0%) | $0 |
| Total | 47 (100.0%) | $57,426 |
Family Income by Number of Earners in Vincent
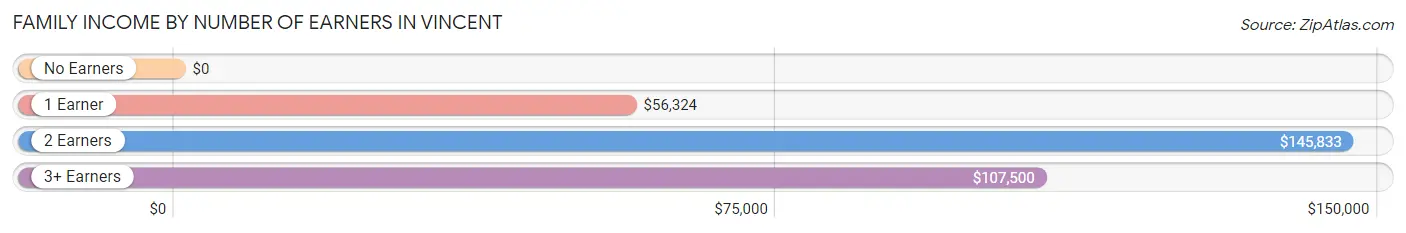
| Number of Earners | # Families | Median Income |
| No Earners | 3 (6.4%) | $0 |
| 1 Earner | 26 (55.3%) | $56,324 |
| 2 Earners | 14 (29.8%) | $145,833 |
| 3+ Earners | 4 (8.5%) | $107,500 |
| Total | 47 (100.0%) | $57,426 |
Household Income in Vincent
Household Income Brackets in Vincent
With 22 households falling in the category, the $50,000 to $74,999 income range is the most frequent in Vincent, accounting for 33.3% of all households. In contrast, only 1 households (1.5%) fall into the $10,000 to $14,999 income bracket, making it the least populous group.
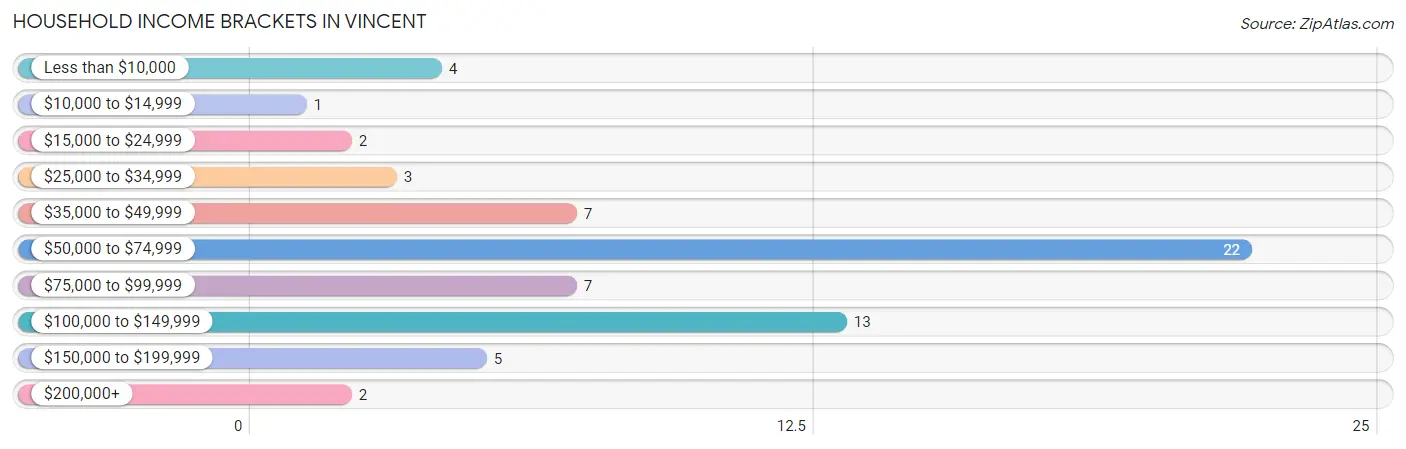
| Income Bracket | # Households | % Households |
| Less than $10,000 | 4 | 6.1% |
| $10,000 to $14,999 | 1 | 1.5% |
| $15,000 to $24,999 | 2 | 3.0% |
| $25,000 to $34,999 | 3 | 4.5% |
| $35,000 to $49,999 | 7 | 10.6% |
| $50,000 to $74,999 | 22 | 33.3% |
| $75,000 to $99,999 | 7 | 10.6% |
| $100,000 to $149,999 | 13 | 19.7% |
| $150,000 to $199,999 | 5 | 7.6% |
| $200,000+ | 2 | 3.0% |
Household Income by Householder Age in Vincent
The median household income in Vincent is $57,059, with the highest median household income of $81,875 found in the 45 to 64 years age bracket for the primary householder. A total of 19 households (28.8%) fall into this category. Meanwhile, the 15 to 24 years age bracket for the primary householder has the lowest median household income of $0, with 7 households (10.6%) in this group.
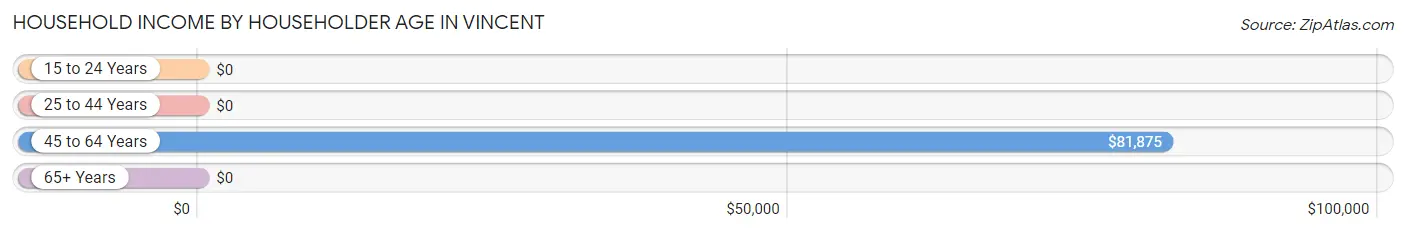
| Income Bracket | # Households | Median Income |
| 15 to 24 Years | 7 (10.6%) | $0 |
| 25 to 44 Years | 31 (47.0%) | $0 |
| 45 to 64 Years | 19 (28.8%) | $81,875 |
| 65+ Years | 9 (13.6%) | $0 |
| Total | 66 (100.0%) | $57,059 |
Poverty in Vincent
Income Below Poverty by Sex and Age in Vincent
With 4.7% poverty level for males and 10.9% for females among the residents of Vincent, 75 year old and over males and 75 year old and over females are the most vulnerable to poverty, with 1 males (50.0%) and 2 females (40.0%) in their respective age groups living below the poverty level.
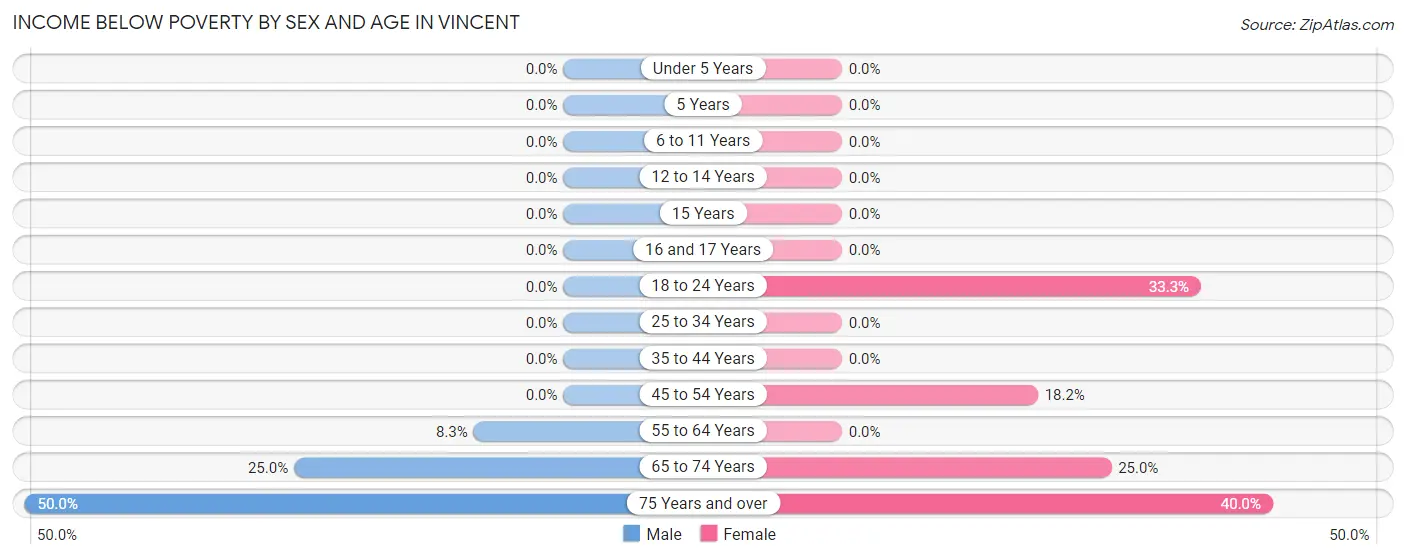
| Age Bracket | Male | Female |
| Under 5 Years | 0 (0.0%) | 0 (0.0%) |
| 5 Years | 0 (0.0%) | 0 (0.0%) |
| 6 to 11 Years | 0 (0.0%) | 0 (0.0%) |
| 12 to 14 Years | 0 (0.0%) | 0 (0.0%) |
| 15 Years | 0 (0.0%) | 0 (0.0%) |
| 16 and 17 Years | 0 (0.0%) | 0 (0.0%) |
| 18 to 24 Years | 0 (0.0%) | 1 (33.3%) |
| 25 to 34 Years | 0 (0.0%) | 0 (0.0%) |
| 35 to 44 Years | 0 (0.0%) | 0 (0.0%) |
| 45 to 54 Years | 0 (0.0%) | 2 (18.2%) |
| 55 to 64 Years | 1 (8.3%) | 0 (0.0%) |
| 65 to 74 Years | 1 (25.0%) | 1 (25.0%) |
| 75 Years and over | 1 (50.0%) | 2 (40.0%) |
| Total | 3 (4.7%) | 6 (10.9%) |
Income Above Poverty by Sex and Age in Vincent
According to the poverty statistics in Vincent, males aged under 5 years and females aged under 5 years are the age groups that are most secure financially, with 100.0% of males and 100.0% of females in these age groups living above the poverty line.
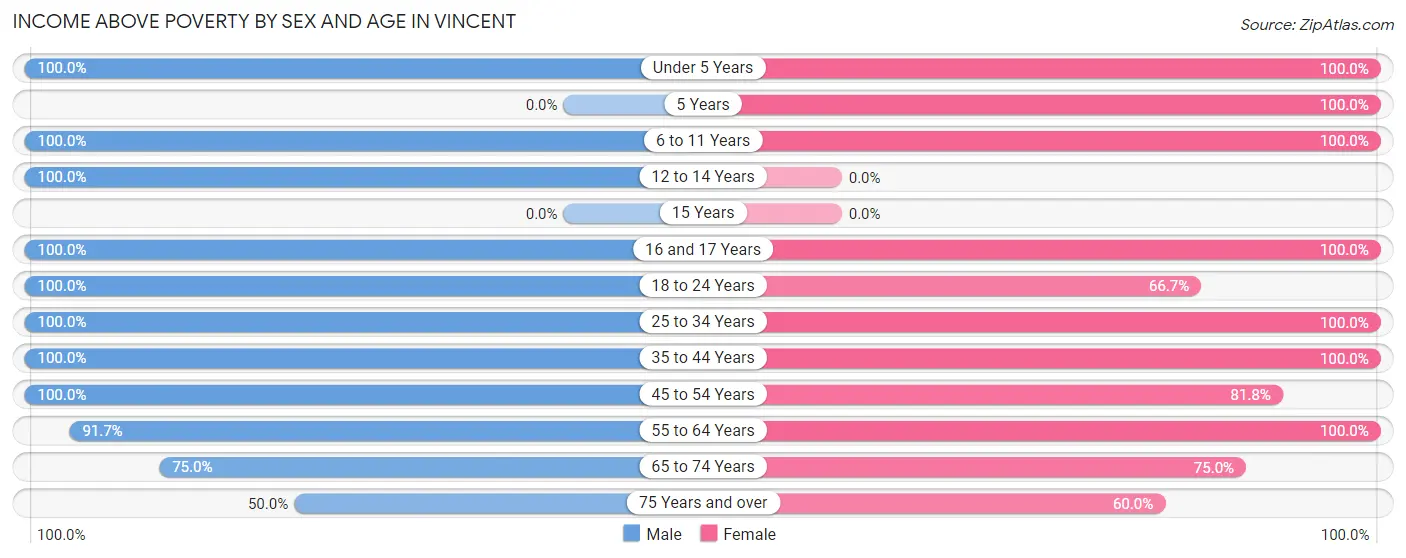
| Age Bracket | Male | Female |
| Under 5 Years | 2 (100.0%) | 4 (100.0%) |
| 5 Years | 0 (0.0%) | 1 (100.0%) |
| 6 to 11 Years | 2 (100.0%) | 1 (100.0%) |
| 12 to 14 Years | 2 (100.0%) | 0 (0.0%) |
| 15 Years | 0 (0.0%) | 0 (0.0%) |
| 16 and 17 Years | 2 (100.0%) | 1 (100.0%) |
| 18 to 24 Years | 8 (100.0%) | 2 (66.7%) |
| 25 to 34 Years | 27 (100.0%) | 10 (100.0%) |
| 35 to 44 Years | 2 (100.0%) | 8 (100.0%) |
| 45 to 54 Years | 1 (100.0%) | 9 (81.8%) |
| 55 to 64 Years | 11 (91.7%) | 7 (100.0%) |
| 65 to 74 Years | 3 (75.0%) | 3 (75.0%) |
| 75 Years and over | 1 (50.0%) | 3 (60.0%) |
| Total | 61 (95.3%) | 49 (89.1%) |
Income Below Poverty Among Married-Couple Families in Vincent
The poverty statistics for married-couple families in Vincent show that 4.5% or 2 of the total 44 families live below the poverty line. Families with no children have the highest poverty rate of 6.7%, comprising of 2 families. On the other hand, families with 1 or 2 children have the lowest poverty rate of 0.0%, which includes 0 families.
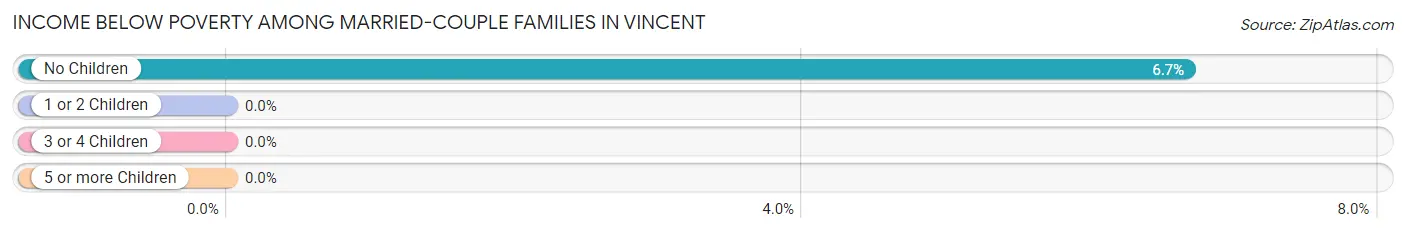
| Children | Above Poverty | Below Poverty |
| No Children | 28 (93.3%) | 2 (6.7%) |
| 1 or 2 Children | 14 (100.0%) | 0 (0.0%) |
| 3 or 4 Children | 0 (0.0%) | 0 (0.0%) |
| 5 or more Children | 0 (0.0%) | 0 (0.0%) |
| Total | 42 (95.5%) | 2 (4.5%) |
Income Below Poverty Among Single-Parent Households in Vincent
| Children | Single Father | Single Mother |
| No Children | 0 (0.0%) | 0 (0.0%) |
| 1 or 2 Children | 0 (0.0%) | 0 (0.0%) |
| 3 or 4 Children | 0 (0.0%) | 0 (0.0%) |
| 5 or more Children | 0 (0.0%) | 0 (0.0%) |
| Total | 0 (0.0%) | 0 (0.0%) |
Income Below Poverty Among Married-Couple vs Single-Parent Households in Vincent
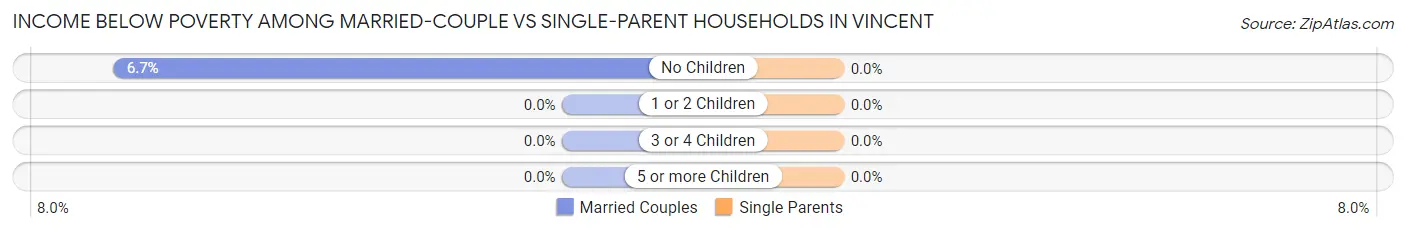
| Children | Married-Couple Families | Single-Parent Households |
| No Children | 2 (6.7%) | 0 (0.0%) |
| 1 or 2 Children | 0 (0.0%) | 0 (0.0%) |
| 3 or 4 Children | 0 (0.0%) | 0 (0.0%) |
| 5 or more Children | 0 (0.0%) | 0 (0.0%) |
| Total | 2 (4.5%) | 0 (0.0%) |
Race in Vincent
The most populous races in Vincent are White / Caucasian (93 | 78.1%), Hispanic or Latino (22 | 18.5%), and Some other Race (22 | 18.5%).
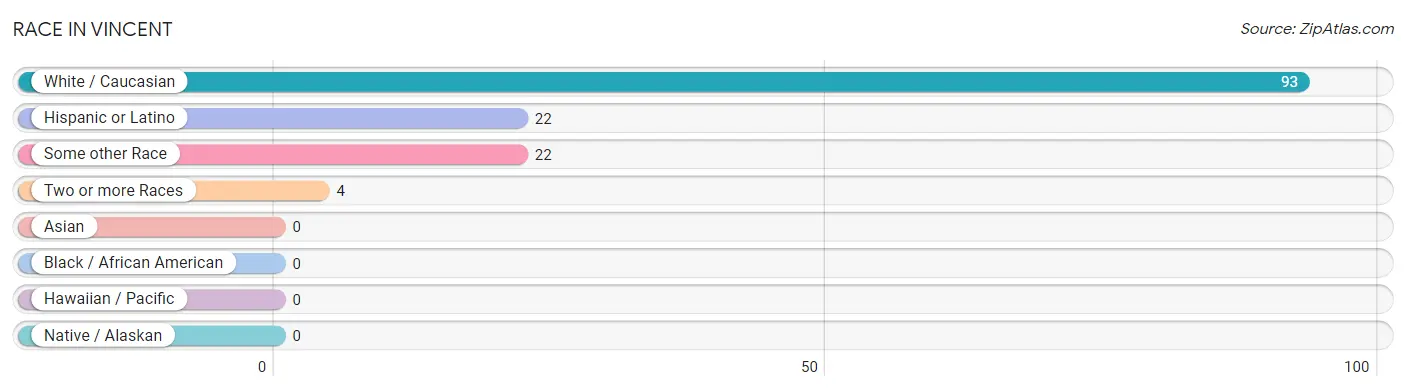
| Race | # Population | % Population |
| Asian | 0 | 0.0% |
| Black / African American | 0 | 0.0% |
| Hawaiian / Pacific | 0 | 0.0% |
| Hispanic or Latino | 22 | 18.5% |
| Native / Alaskan | 0 | 0.0% |
| White / Caucasian | 93 | 78.1% |
| Two or more Races | 4 | 3.4% |
| Some other Race | 22 | 18.5% |
| Total | 119 | 100.0% |
Ancestry in Vincent
The most populous ancestries reported in Vincent are German (53 | 44.5%), Mexican (22 | 18.5%), Norwegian (20 | 16.8%), American (7 | 5.9%), and Irish (7 | 5.9%), together accounting for 91.6% of all Vincent residents.
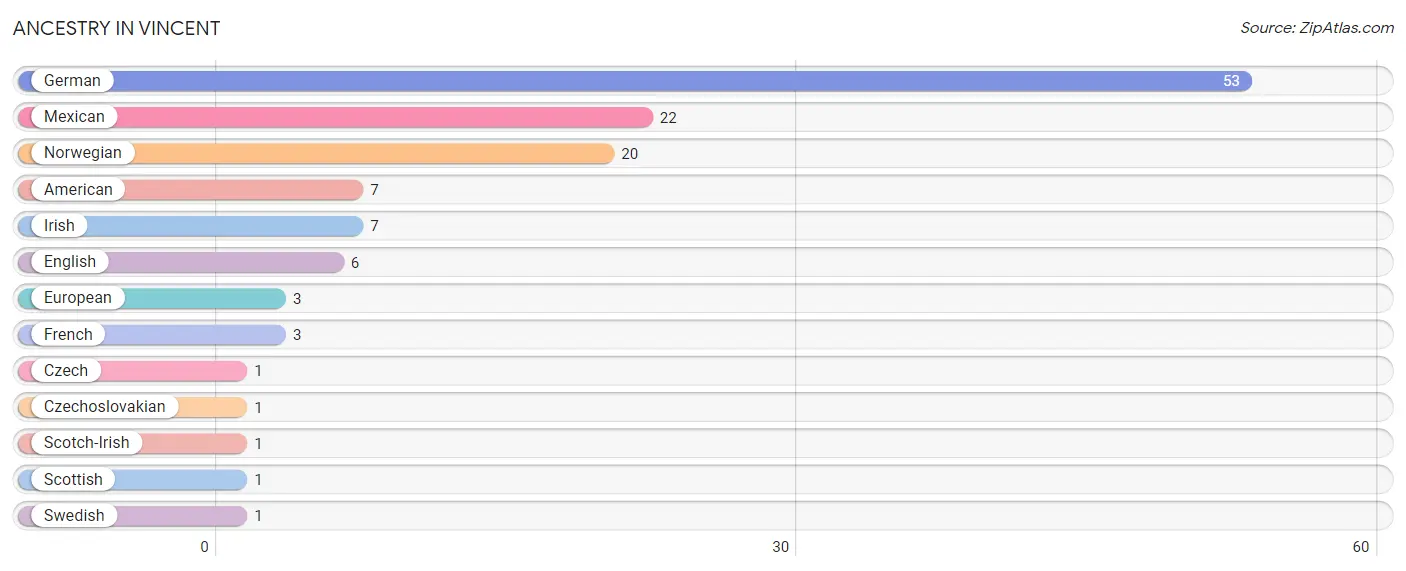
| Ancestry | # Population | % Population |
| American | 7 | 5.9% |
| Czech | 1 | 0.8% |
| Czechoslovakian | 1 | 0.8% |
| English | 6 | 5.0% |
| European | 3 | 2.5% |
| French | 3 | 2.5% |
| German | 53 | 44.5% |
| Irish | 7 | 5.9% |
| Mexican | 22 | 18.5% |
| Norwegian | 20 | 16.8% |
| Scotch-Irish | 1 | 0.8% |
| Scottish | 1 | 0.8% |
| Swedish | 1 | 0.8% | View All 13 Rows |
Immigrants in Vincent
The most numerous immigrant groups reported in Vincent came from Central America (22 | 18.5%), Latin America (22 | 18.5%), Guatemala (16 | 13.5%), and Mexico (6 | 5.0%), together accounting for 55.5% of all Vincent residents.
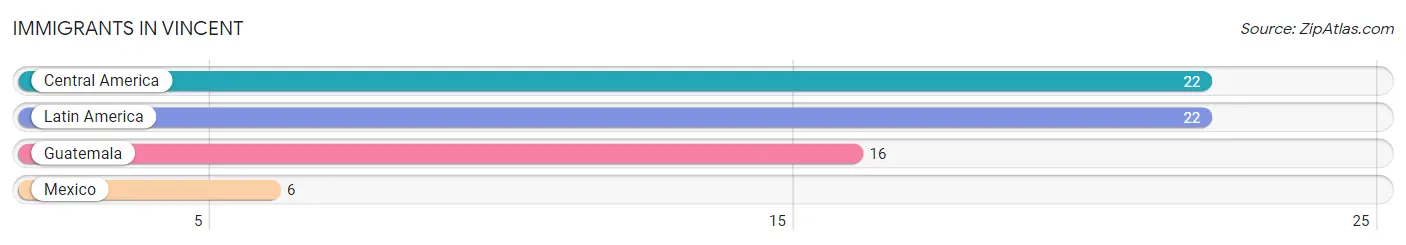
| Immigration Origin | # Population | % Population |
| Central America | 22 | 18.5% |
| Guatemala | 16 | 13.5% |
| Latin America | 22 | 18.5% |
| Mexico | 6 | 5.0% | View All 4 Rows |
Sex and Age in Vincent
Sex and Age in Vincent
The most populous age groups in Vincent are 30 to 34 Years (24 | 37.5%) for men and 45 to 49 Years (7 | 12.7%) for women.
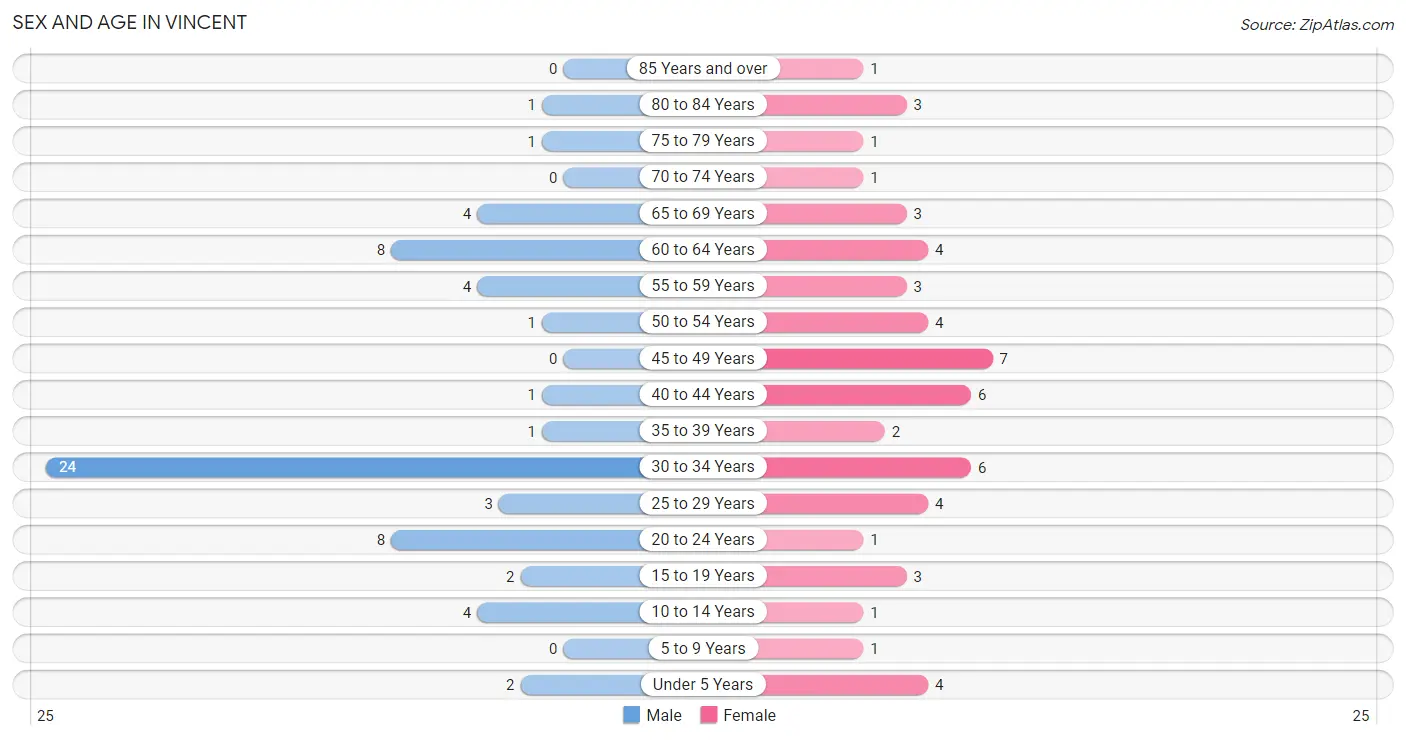
| Age Bracket | Male | Female |
| Under 5 Years | 2 (3.1%) | 4 (7.3%) |
| 5 to 9 Years | 0 (0.0%) | 1 (1.8%) |
| 10 to 14 Years | 4 (6.2%) | 1 (1.8%) |
| 15 to 19 Years | 2 (3.1%) | 3 (5.4%) |
| 20 to 24 Years | 8 (12.5%) | 1 (1.8%) |
| 25 to 29 Years | 3 (4.7%) | 4 (7.3%) |
| 30 to 34 Years | 24 (37.5%) | 6 (10.9%) |
| 35 to 39 Years | 1 (1.6%) | 2 (3.6%) |
| 40 to 44 Years | 1 (1.6%) | 6 (10.9%) |
| 45 to 49 Years | 0 (0.0%) | 7 (12.7%) |
| 50 to 54 Years | 1 (1.6%) | 4 (7.3%) |
| 55 to 59 Years | 4 (6.2%) | 3 (5.4%) |
| 60 to 64 Years | 8 (12.5%) | 4 (7.3%) |
| 65 to 69 Years | 4 (6.2%) | 3 (5.4%) |
| 70 to 74 Years | 0 (0.0%) | 1 (1.8%) |
| 75 to 79 Years | 1 (1.6%) | 1 (1.8%) |
| 80 to 84 Years | 1 (1.6%) | 3 (5.4%) |
| 85 Years and over | 0 (0.0%) | 1 (1.8%) |
| Total | 64 (100.0%) | 55 (100.0%) |
Families and Households in Vincent
Median Family Size in Vincent
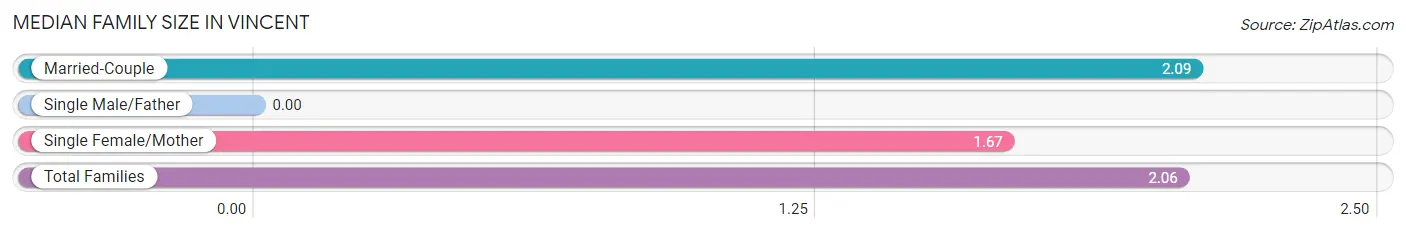
| Family Type | # Families | Family Size |
| Married-Couple | 44 (93.6%) | 2.09 |
| Single Male/Father | 0 (0.0%) | - |
| Single Female/Mother | 3 (6.4%) | 1.67 |
| Total Families | 47 (100.0%) | 2.06 |
Median Household Size in Vincent
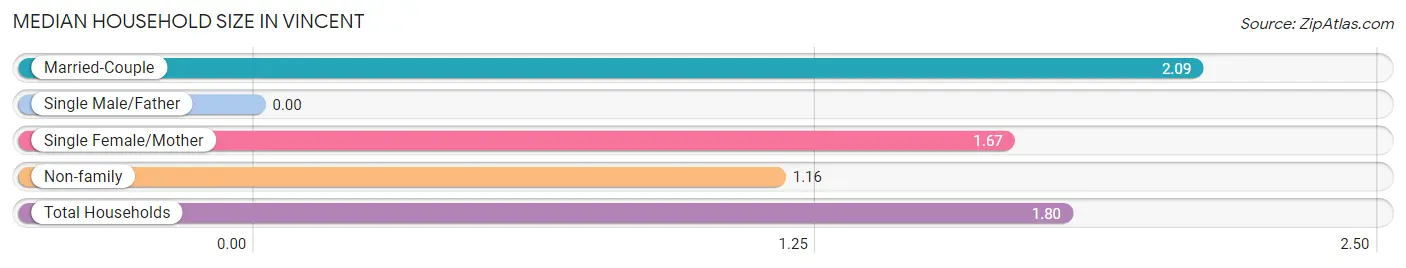
| Household Type | # Households | Household Size |
| Married-Couple | 44 (66.7%) | 2.09 |
| Single Male/Father | 0 (0.0%) | - |
| Single Female/Mother | 3 (4.5%) | 1.67 |
| Non-family | 19 (28.8%) | 1.16 |
| Total Households | 66 (100.0%) | 1.80 |
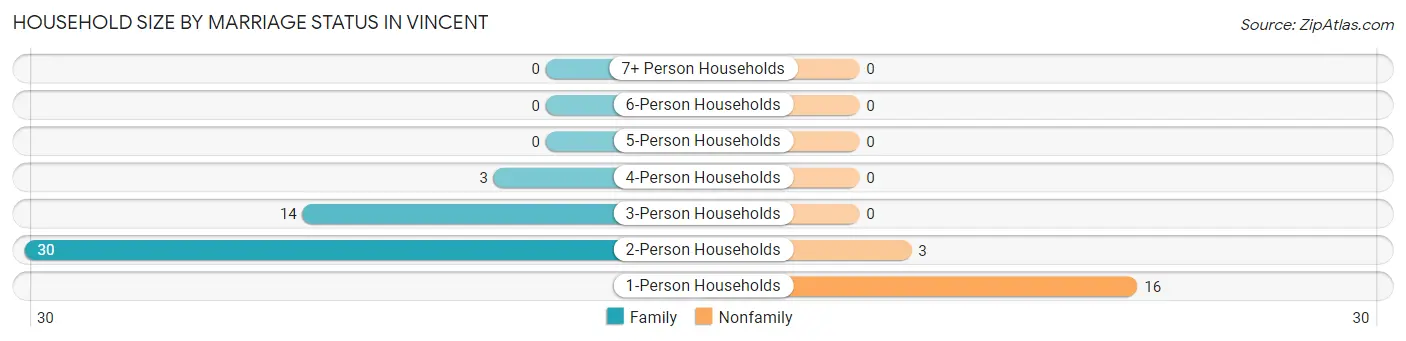
Household Size by Marriage Status in Vincent
Out of a total of 66 households in Vincent, 47 (71.2%) are family households, while 19 (28.8%) are nonfamily households. The most numerous type of family households are 2-person households, comprising 30, and the most common type of nonfamily households are 1-person households, comprising 16.
| Household Size | Family Households | Nonfamily Households |
| 1-Person Households | - | 16 (24.2%) |
| 2-Person Households | 30 (45.5%) | 3 (4.5%) |
| 3-Person Households | 14 (21.2%) | 0 (0.0%) |
| 4-Person Households | 3 (4.5%) | 0 (0.0%) |
| 5-Person Households | 0 (0.0%) | 0 (0.0%) |
| 6-Person Households | 0 (0.0%) | 0 (0.0%) |
| 7+ Person Households | 0 (0.0%) | 0 (0.0%) |
| Total | 47 (71.2%) | 19 (28.8%) |
Female Fertility in Vincent
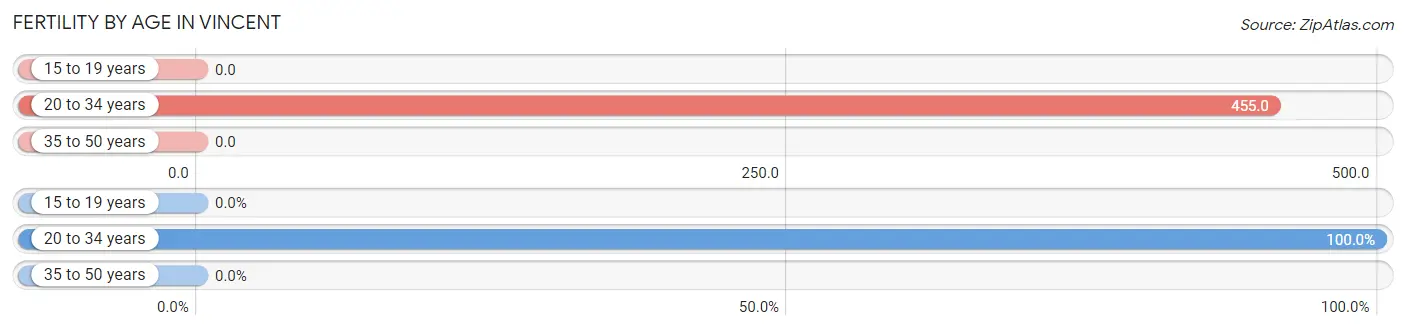
Fertility by Age in Vincent
Average fertility rate in Vincent is 172.0 births per 1,000 women. Women in the age bracket of 20 to 34 years have the highest fertility rate with 455.0 births per 1,000 women. Women in the age bracket of 20 to 34 years acount for 100.0% of all women with births.
| Age Bracket | Women with Births | Births / 1,000 Women |
| 15 to 19 years | 0 (0.0%) | 0.0 |
| 20 to 34 years | 5 (100.0%) | 455.0 |
| 35 to 50 years | 0 (0.0%) | 0.0 |
| Total | 5 (100.0%) | 172.0 |
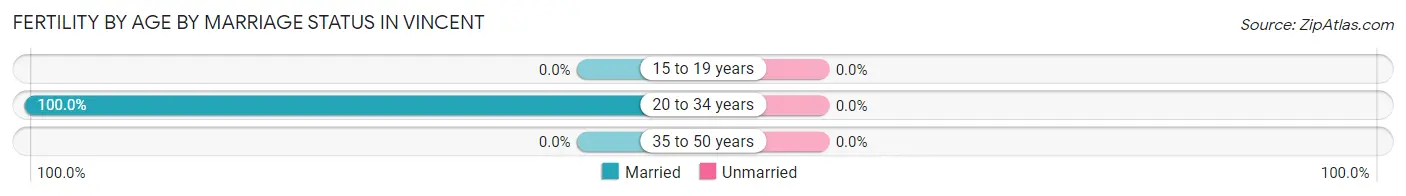
Fertility by Age by Marriage Status in Vincent
| Age Bracket | Married | Unmarried |
| 15 to 19 years | 0 (0.0%) | 0 (0.0%) |
| 20 to 34 years | 5 (100.0%) | 0 (0.0%) |
| 35 to 50 years | 0 (0.0%) | 0 (0.0%) |
| Total | 5 (100.0%) | 0 (0.0%) |
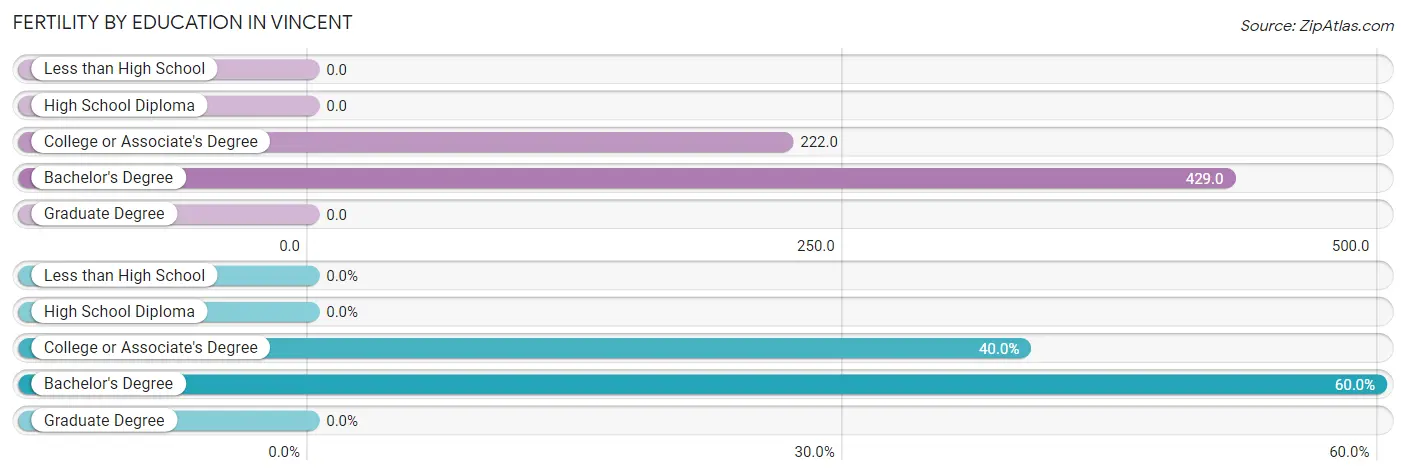
Fertility by Education in Vincent
| Educational Attainment | Women with Births | Births / 1,000 Women |
| Less than High School | 0 (0.0%) | 0.0 |
| High School Diploma | 0 (0.0%) | 0.0 |
| College or Associate's Degree | 2 (40.0%) | 222.0 |
| Bachelor's Degree | 3 (60.0%) | 429.0 |
| Graduate Degree | 0 (0.0%) | 0.0 |
| Total | 5 (100.0%) | 172.0 |
Fertility by Education by Marriage Status in Vincent
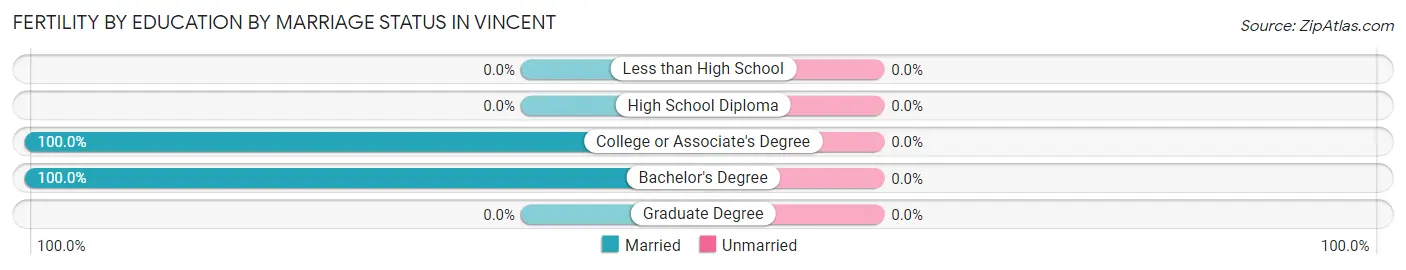
| Educational Attainment | Married | Unmarried |
| Less than High School | 0 (0.0%) | 0 (0.0%) |
| High School Diploma | 0 (0.0%) | 0 (0.0%) |
| College or Associate's Degree | 2 (100.0%) | 0 (0.0%) |
| Bachelor's Degree | 3 (100.0%) | 0 (0.0%) |
| Graduate Degree | 0 (0.0%) | 0 (0.0%) |
| Total | 5 (100.0%) | 0 (0.0%) |
Employment Characteristics in Vincent
Employment by Class of Employer in Vincent
Among the 77 employed individuals in Vincent, private company employees (59 | 76.6%), local government employees (7 | 9.1%), and not-for-profit organizations (6 | 7.8%) make up the most common classes of employment.
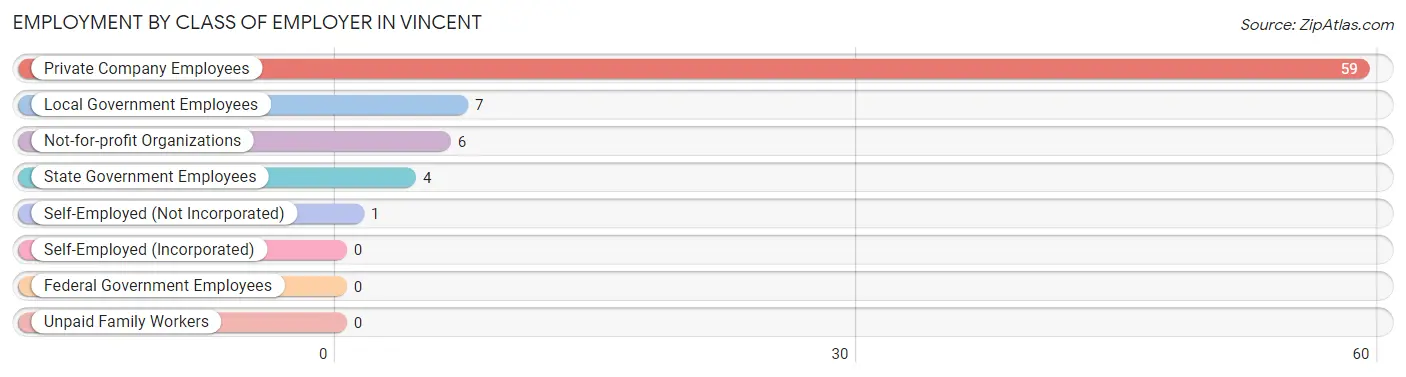
| Employer Class | # Employees | % Employees |
| Private Company Employees | 59 | 76.6% |
| Self-Employed (Incorporated) | 0 | 0.0% |
| Self-Employed (Not Incorporated) | 1 | 1.3% |
| Not-for-profit Organizations | 6 | 7.8% |
| Local Government Employees | 7 | 9.1% |
| State Government Employees | 4 | 5.2% |
| Federal Government Employees | 0 | 0.0% |
| Unpaid Family Workers | 0 | 0.0% |
| Total | 77 | 100.0% |
Employment Status by Age in Vincent
According to the labor force statistics for Vincent, out of the total population over 16 years of age (107), 72.9% or 78 individuals are in the labor force, with 1.3% or 1 of them unemployed. The age group with the highest labor force participation rate is 20 to 24 years, with 100.0% or 9 individuals in the labor force. Within the labor force, the 16 to 19 years age range has the highest percentage of unemployed individuals, with 50.0% or 1 of them being unemployed.
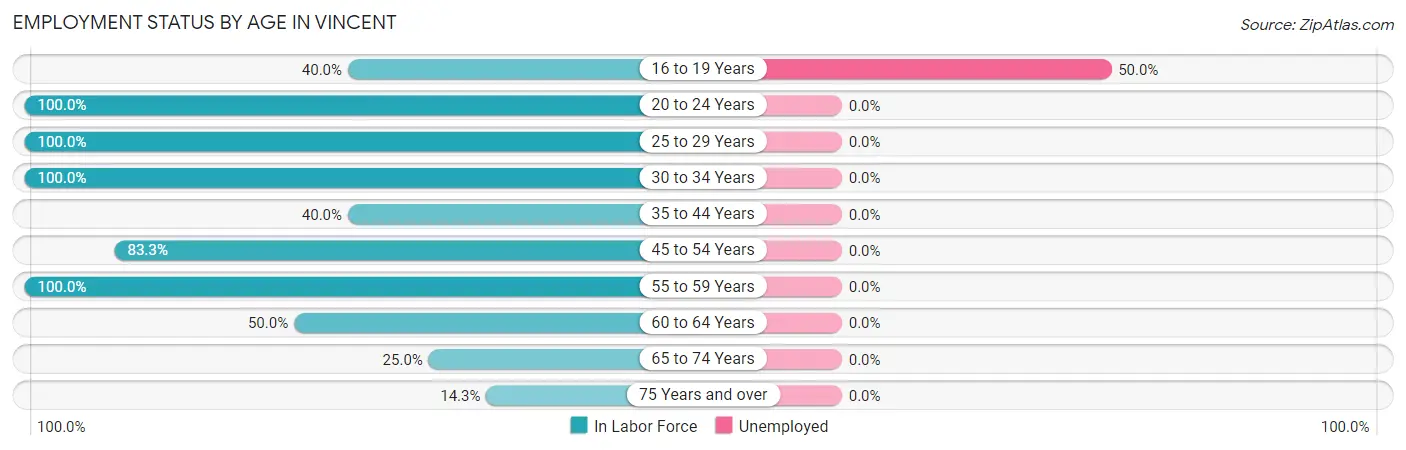
| Age Bracket | In Labor Force | Unemployed |
| 16 to 19 Years | 2 (40.0%) | 1 (50.0%) |
| 20 to 24 Years | 9 (100.0%) | 0 (0.0%) |
| 25 to 29 Years | 7 (100.0%) | 0 (0.0%) |
| 30 to 34 Years | 30 (100.0%) | 0 (0.0%) |
| 35 to 44 Years | 4 (40.0%) | 0 (0.0%) |
| 45 to 54 Years | 10 (83.3%) | 0 (0.0%) |
| 55 to 59 Years | 7 (100.0%) | 0 (0.0%) |
| 60 to 64 Years | 6 (50.0%) | 0 (0.0%) |
| 65 to 74 Years | 2 (25.0%) | 0 (0.0%) |
| 75 Years and over | 1 (14.3%) | 0 (0.0%) |
| Total | 78 (72.9%) | 1 (1.3%) |
Employment Status by Educational Attainment in Vincent
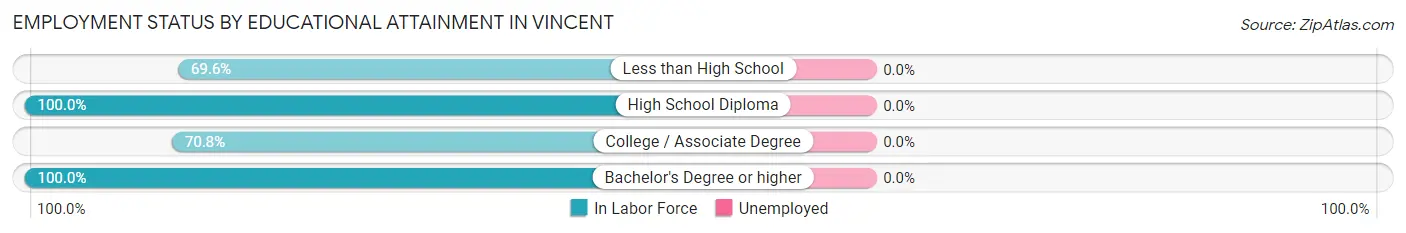
| Educational Attainment | In Labor Force | Unemployed |
| Less than High School | 16 (69.6%) | 0 (0.0%) |
| High School Diploma | 11 (100.0%) | 0 (0.0%) |
| College / Associate Degree | 17 (70.8%) | 0 (0.0%) |
| Bachelor's Degree or higher | 20 (100.0%) | 0 (0.0%) |
| Total | 64 (82.1%) | 0 (0.0%) |
Employment Occupations by Sex in Vincent
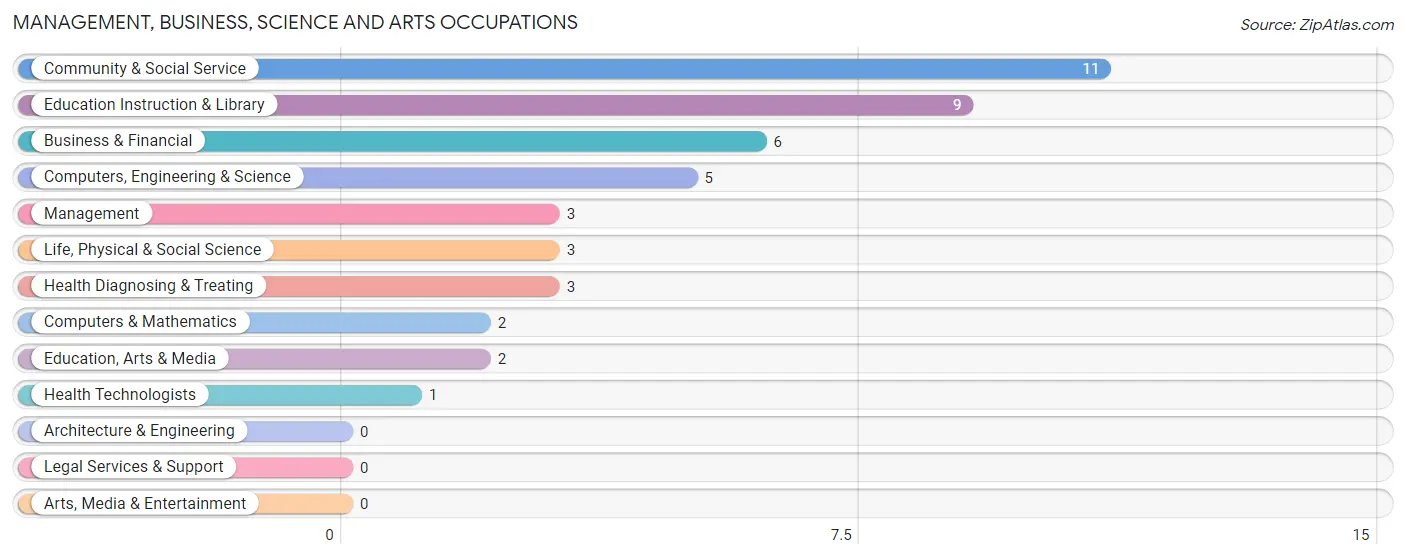
Management, Business, Science and Arts Occupations
The most common Management, Business, Science and Arts occupations in Vincent are Community & Social Service (11 | 14.3%), Education Instruction & Library (9 | 11.7%), Business & Financial (6 | 7.8%), Computers, Engineering & Science (5 | 6.5%), and Management (3 | 3.9%).
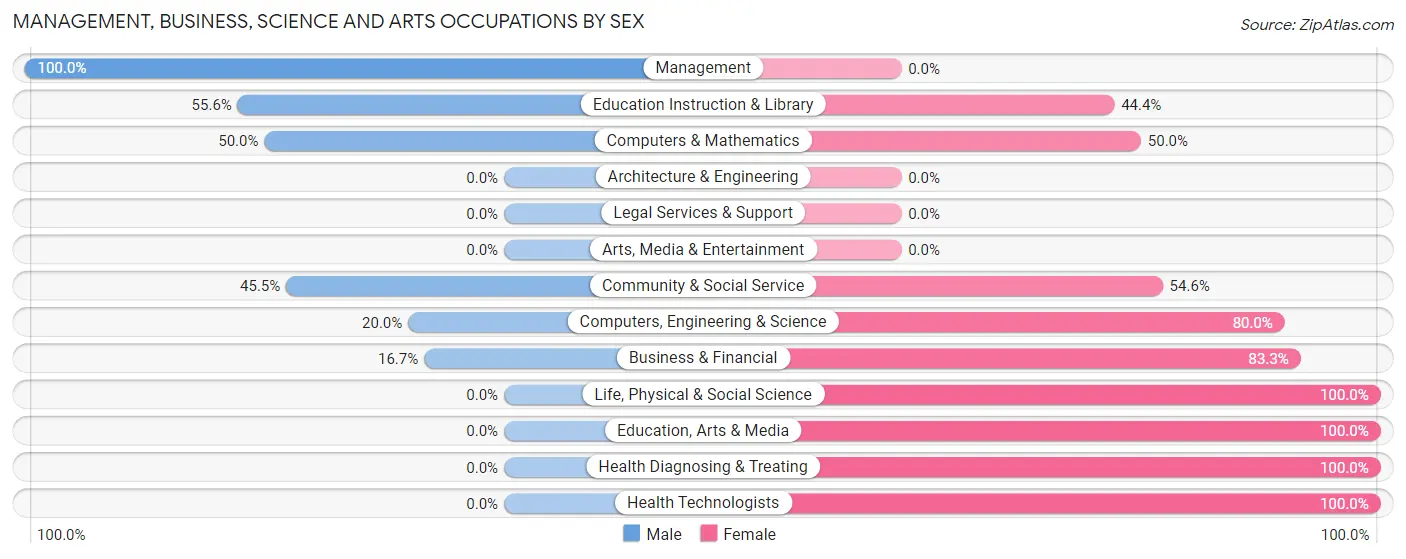
Management, Business, Science and Arts Occupations by Sex
Within the Management, Business, Science and Arts occupations in Vincent, the most male-oriented occupations are Management (100.0%), Education Instruction & Library (55.6%), and Computers & Mathematics (50.0%), while the most female-oriented occupations are Life, Physical & Social Science (100.0%), Education, Arts & Media (100.0%), and Health Diagnosing & Treating (100.0%).
| Occupation | Male | Female |
| Management | 3 (100.0%) | 0 (0.0%) |
| Business & Financial | 1 (16.7%) | 5 (83.3%) |
| Computers, Engineering & Science | 1 (20.0%) | 4 (80.0%) |
| Computers & Mathematics | 1 (50.0%) | 1 (50.0%) |
| Architecture & Engineering | 0 (0.0%) | 0 (0.0%) |
| Life, Physical & Social Science | 0 (0.0%) | 3 (100.0%) |
| Community & Social Service | 5 (45.5%) | 6 (54.5%) |
| Education, Arts & Media | 0 (0.0%) | 2 (100.0%) |
| Legal Services & Support | 0 (0.0%) | 0 (0.0%) |
| Education Instruction & Library | 5 (55.6%) | 4 (44.4%) |
| Arts, Media & Entertainment | 0 (0.0%) | 0 (0.0%) |
| Health Diagnosing & Treating | 0 (0.0%) | 3 (100.0%) |
| Health Technologists | 0 (0.0%) | 1 (100.0%) |
| Total (Category) | 10 (35.7%) | 18 (64.3%) |
| Total (Overall) | 49 (63.6%) | 28 (36.4%) |
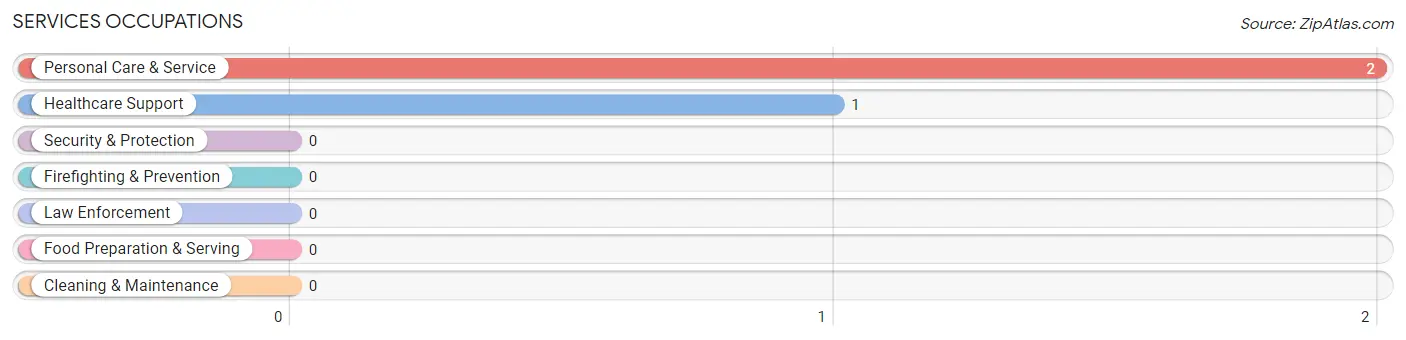
Services Occupations
The most common Services occupations in Vincent are Personal Care & Service (2 | 2.6%), and Healthcare Support (1 | 1.3%).
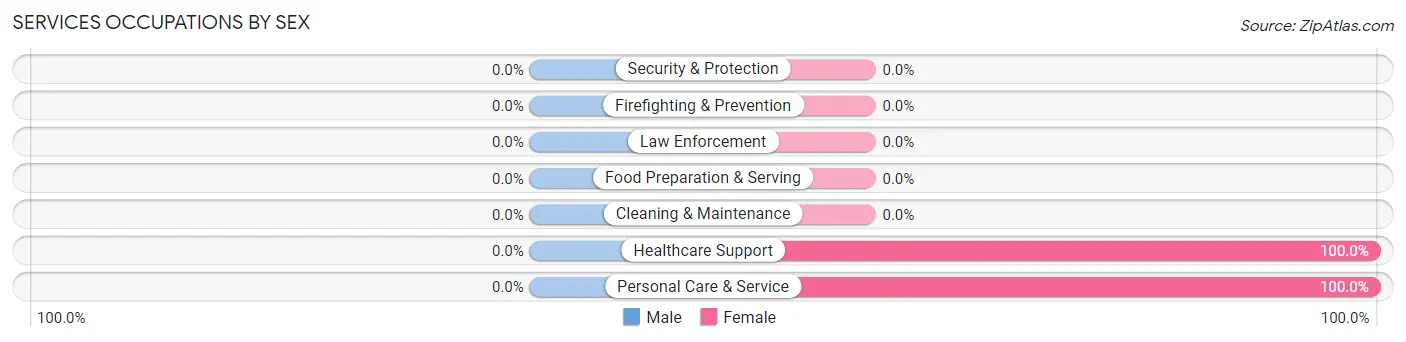
Services Occupations by Sex
| Occupation | Male | Female |
| Healthcare Support | 0 (0.0%) | 1 (100.0%) |
| Security & Protection | 0 (0.0%) | 0 (0.0%) |
| Firefighting & Prevention | 0 (0.0%) | 0 (0.0%) |
| Law Enforcement | 0 (0.0%) | 0 (0.0%) |
| Food Preparation & Serving | 0 (0.0%) | 0 (0.0%) |
| Cleaning & Maintenance | 0 (0.0%) | 0 (0.0%) |
| Personal Care & Service | 0 (0.0%) | 2 (100.0%) |
| Total (Category) | 0 (0.0%) | 3 (100.0%) |
| Total (Overall) | 49 (63.6%) | 28 (36.4%) |
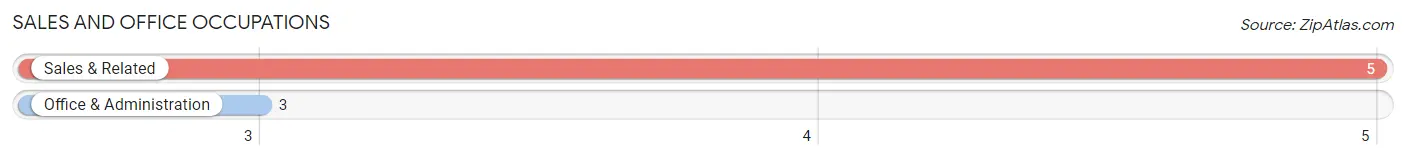
Sales and Office Occupations
The most common Sales and Office occupations in Vincent are Sales & Related (5 | 6.5%), and Office & Administration (3 | 3.9%).
Sales and Office Occupations by Sex
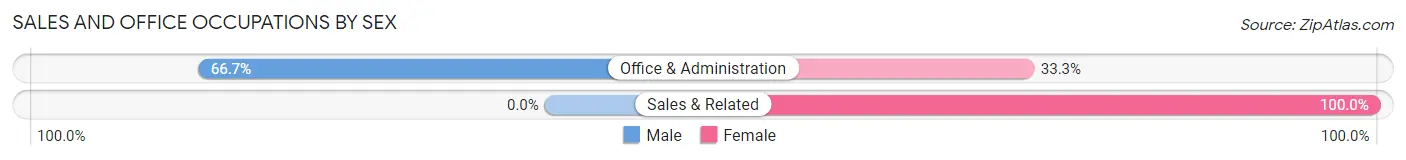
| Occupation | Male | Female |
| Sales & Related | 0 (0.0%) | 5 (100.0%) |
| Office & Administration | 2 (66.7%) | 1 (33.3%) |
| Total (Category) | 2 (25.0%) | 6 (75.0%) |
| Total (Overall) | 49 (63.6%) | 28 (36.4%) |
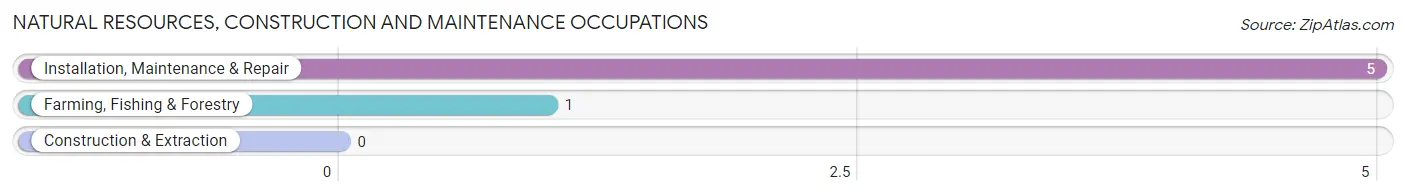
Natural Resources, Construction and Maintenance Occupations
The most common Natural Resources, Construction and Maintenance occupations in Vincent are Installation, Maintenance & Repair (5 | 6.5%), and Farming, Fishing & Forestry (1 | 1.3%).
Natural Resources, Construction and Maintenance Occupations by Sex
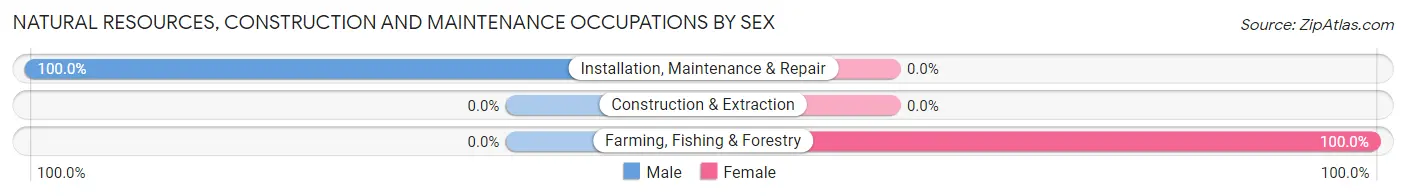
| Occupation | Male | Female |
| Farming, Fishing & Forestry | 0 (0.0%) | 1 (100.0%) |
| Construction & Extraction | 0 (0.0%) | 0 (0.0%) |
| Installation, Maintenance & Repair | 5 (100.0%) | 0 (0.0%) |
| Total (Category) | 5 (83.3%) | 1 (16.7%) |
| Total (Overall) | 49 (63.6%) | 28 (36.4%) |
Production, Transportation and Moving Occupations
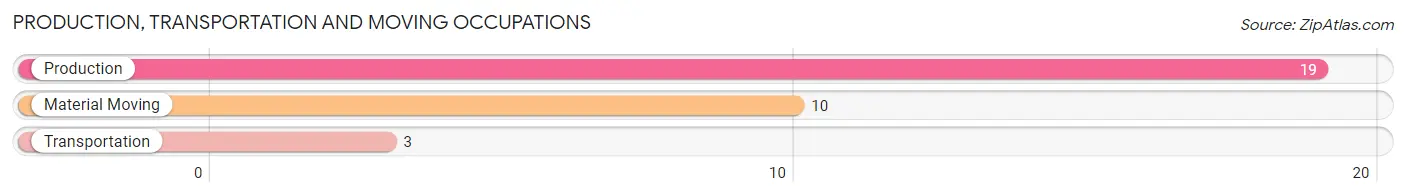
The most common Production, Transportation and Moving occupations in Vincent are Production (19 | 24.7%), Material Moving (10 | 13.0%), and Transportation (3 | 3.9%).
Production, Transportation and Moving Occupations by Sex
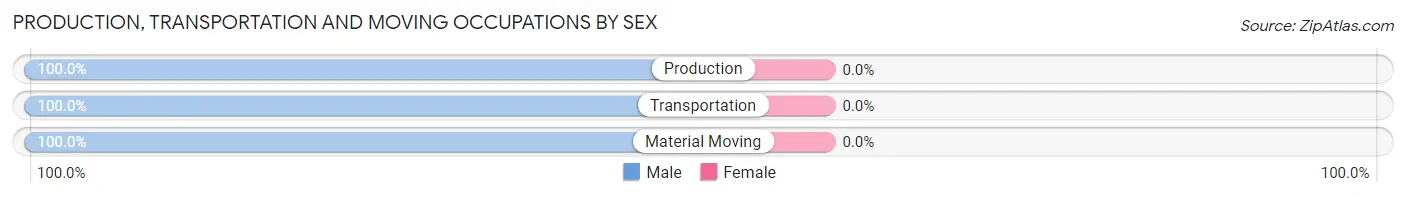
| Occupation | Male | Female |
| Production | 19 (100.0%) | 0 (0.0%) |
| Transportation | 3 (100.0%) | 0 (0.0%) |
| Material Moving | 10 (100.0%) | 0 (0.0%) |
| Total (Category) | 32 (100.0%) | 0 (0.0%) |
| Total (Overall) | 49 (63.6%) | 28 (36.4%) |
Employment Industries by Sex in Vincent
Employment Industries in Vincent
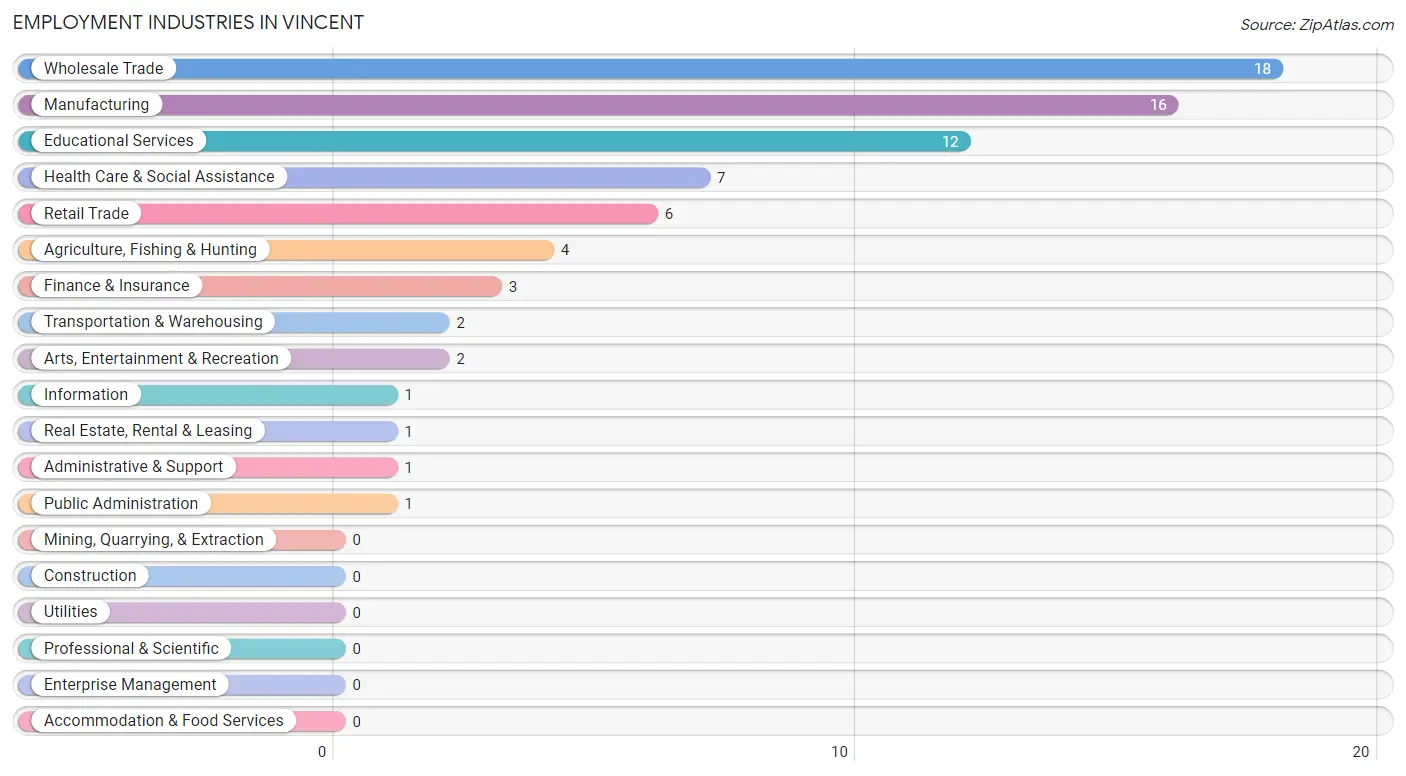
The major employment industries in Vincent include Wholesale Trade (18 | 23.4%), Manufacturing (16 | 20.8%), Educational Services (12 | 15.6%), Health Care & Social Assistance (7 | 9.1%), and Retail Trade (6 | 7.8%).
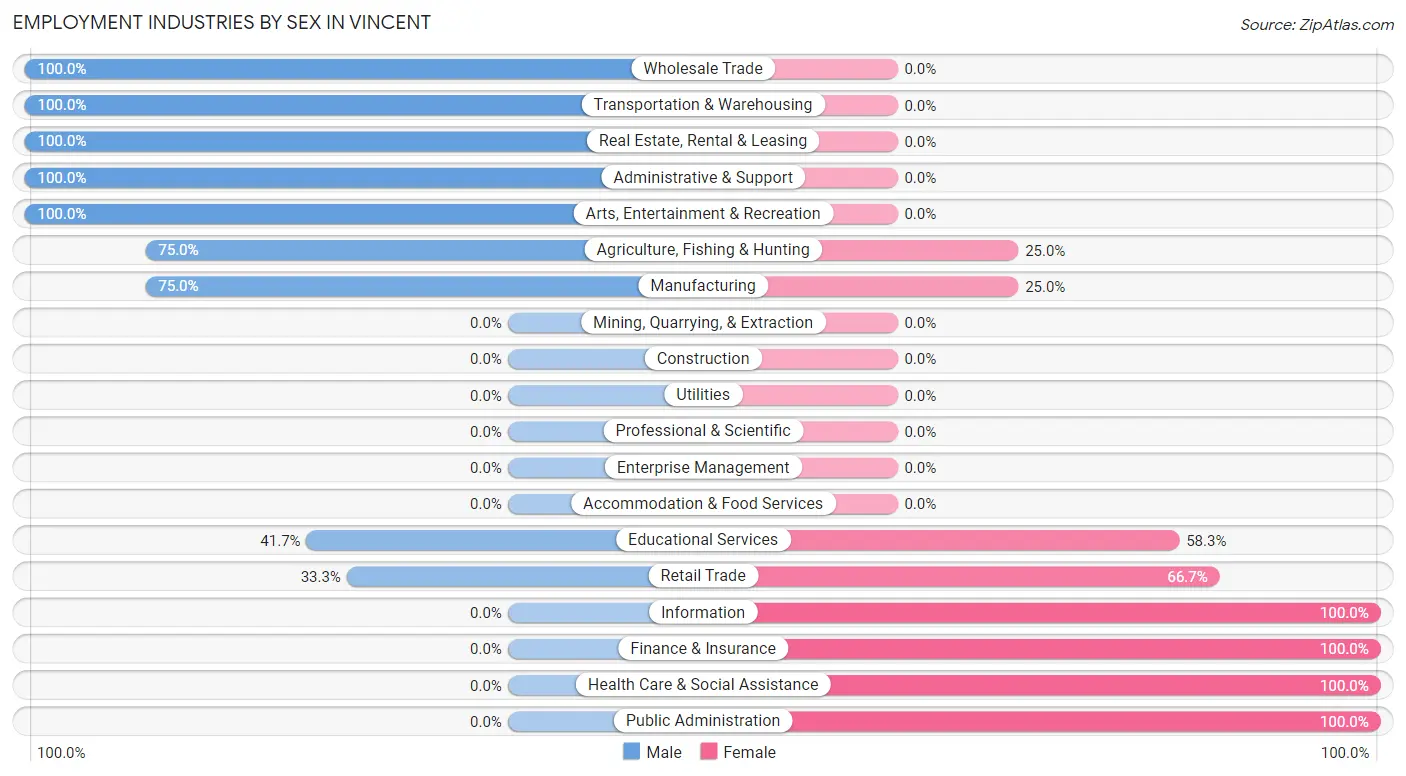
Employment Industries by Sex in Vincent
The Vincent industries that see more men than women are Wholesale Trade (100.0%), Transportation & Warehousing (100.0%), and Real Estate, Rental & Leasing (100.0%), whereas the industries that tend to have a higher number of women are Information (100.0%), Finance & Insurance (100.0%), and Health Care & Social Assistance (100.0%).
| Industry | Male | Female |
| Agriculture, Fishing & Hunting | 3 (75.0%) | 1 (25.0%) |
| Mining, Quarrying, & Extraction | 0 (0.0%) | 0 (0.0%) |
| Construction | 0 (0.0%) | 0 (0.0%) |
| Manufacturing | 12 (75.0%) | 4 (25.0%) |
| Wholesale Trade | 18 (100.0%) | 0 (0.0%) |
| Retail Trade | 2 (33.3%) | 4 (66.7%) |
| Transportation & Warehousing | 2 (100.0%) | 0 (0.0%) |
| Utilities | 0 (0.0%) | 0 (0.0%) |
| Information | 0 (0.0%) | 1 (100.0%) |
| Finance & Insurance | 0 (0.0%) | 3 (100.0%) |
| Real Estate, Rental & Leasing | 1 (100.0%) | 0 (0.0%) |
| Professional & Scientific | 0 (0.0%) | 0 (0.0%) |
| Enterprise Management | 0 (0.0%) | 0 (0.0%) |
| Administrative & Support | 1 (100.0%) | 0 (0.0%) |
| Educational Services | 5 (41.7%) | 7 (58.3%) |
| Health Care & Social Assistance | 0 (0.0%) | 7 (100.0%) |
| Arts, Entertainment & Recreation | 2 (100.0%) | 0 (0.0%) |
| Accommodation & Food Services | 0 (0.0%) | 0 (0.0%) |
| Public Administration | 0 (0.0%) | 1 (100.0%) |
| Total | 49 (63.6%) | 28 (36.4%) |
Education in Vincent
School Enrollment in Vincent
The most common levels of schooling among the 15 students in Vincent are high school (5 | 33.3%), middle school (4 | 26.7%), and college / undergraduate (2 | 13.3%).
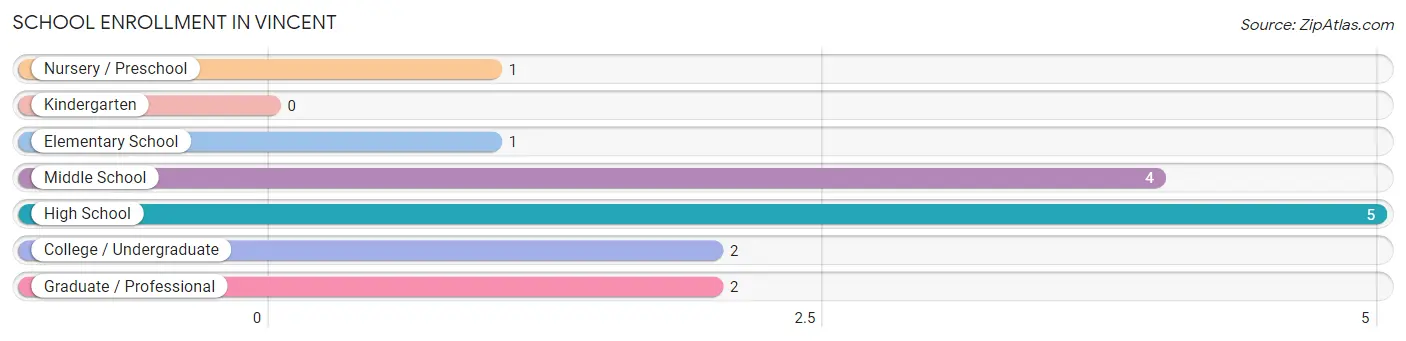
| School Level | # Students | % Students |
| Nursery / Preschool | 1 | 6.7% |
| Kindergarten | 0 | 0.0% |
| Elementary School | 1 | 6.7% |
| Middle School | 4 | 26.7% |
| High School | 5 | 33.3% |
| College / Undergraduate | 2 | 13.3% |
| Graduate / Professional | 2 | 13.3% |
| Total | 15 | 100.0% |
School Enrollment by Age by Funding Source in Vincent
Out of a total of 15 students who are enrolled in schools in Vincent, 1 (6.7%) attend a private institution, while the remaining 14 (93.3%) are enrolled in public schools. The age group of 18 to 19 year olds has the highest likelihood of being enrolled in private schools, with 1 (50.0% in the age bracket) enrolled. Conversely, the age group of 5 to 9 year old has the lowest likelihood of being enrolled in a private school, with 1 (100.0% in the age bracket) attending a public institution.
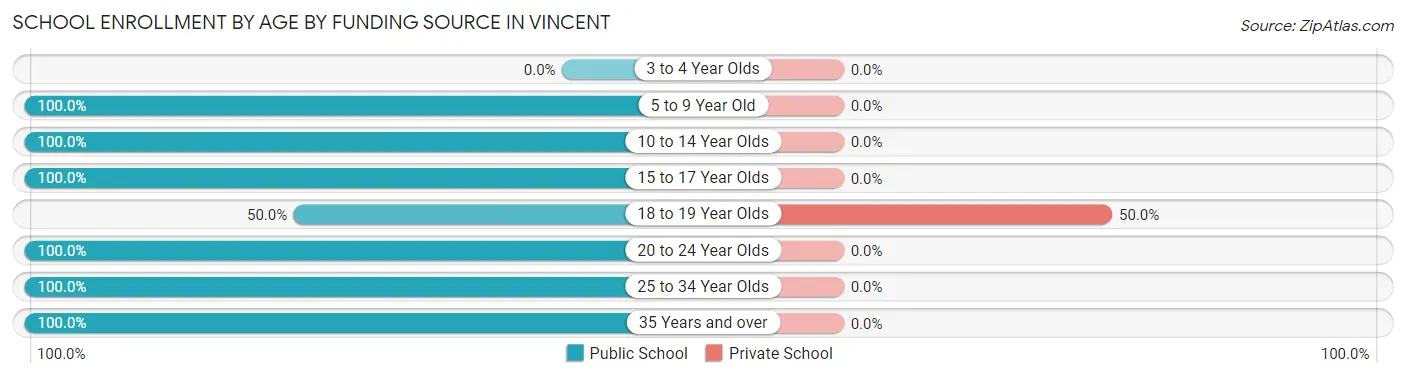
| Age Bracket | Public School | Private School |
| 3 to 4 Year Olds | 0 (0.0%) | 0 (0.0%) |
| 5 to 9 Year Old | 1 (100.0%) | 0 (0.0%) |
| 10 to 14 Year Olds | 5 (100.0%) | 0 (0.0%) |
| 15 to 17 Year Olds | 3 (100.0%) | 0 (0.0%) |
| 18 to 19 Year Olds | 1 (50.0%) | 1 (50.0%) |
| 20 to 24 Year Olds | 1 (100.0%) | 0 (0.0%) |
| 25 to 34 Year Olds | 2 (100.0%) | 0 (0.0%) |
| 35 Years and over | 1 (100.0%) | 0 (0.0%) |
| Total | 14 (93.3%) | 1 (6.7%) |
Educational Attainment by Field of Study in Vincent
Business (9 | 37.5%), education (6 | 25.0%), psychology (2 | 8.3%), science & technology (2 | 8.3%), and liberal arts & history (2 | 8.3%) are the most common fields of study among 24 individuals in Vincent who have obtained a bachelor's degree or higher.
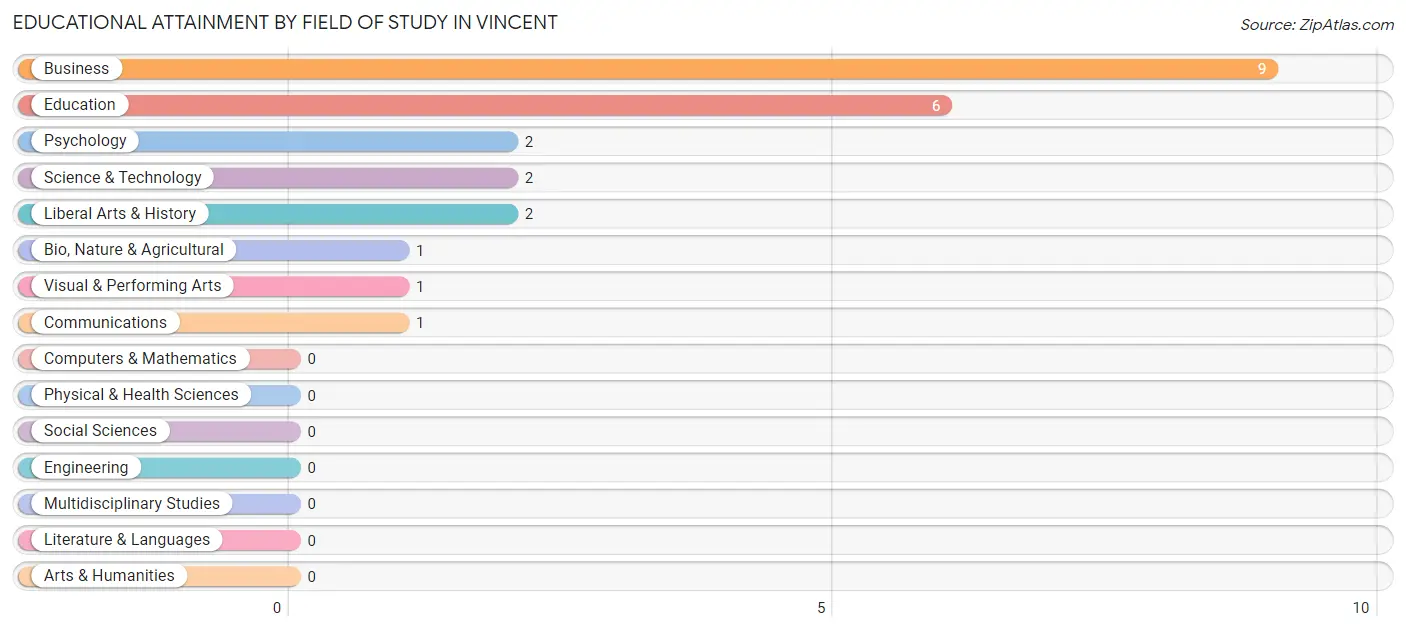
| Field of Study | # Graduates | % Graduates |
| Computers & Mathematics | 0 | 0.0% |
| Bio, Nature & Agricultural | 1 | 4.2% |
| Physical & Health Sciences | 0 | 0.0% |
| Psychology | 2 | 8.3% |
| Social Sciences | 0 | 0.0% |
| Engineering | 0 | 0.0% |
| Multidisciplinary Studies | 0 | 0.0% |
| Science & Technology | 2 | 8.3% |
| Business | 9 | 37.5% |
| Education | 6 | 25.0% |
| Literature & Languages | 0 | 0.0% |
| Liberal Arts & History | 2 | 8.3% |
| Visual & Performing Arts | 1 | 4.2% |
| Communications | 1 | 4.2% |
| Arts & Humanities | 0 | 0.0% |
| Total | 24 | 100.0% |
Transportation & Commute in Vincent
Vehicle Availability by Sex in Vincent
The most prevalent vehicle ownership categories in Vincent are males with 3 vehicles (28, accounting for 57.1%) and females with 3 vehicles (12, making up 100.0%).
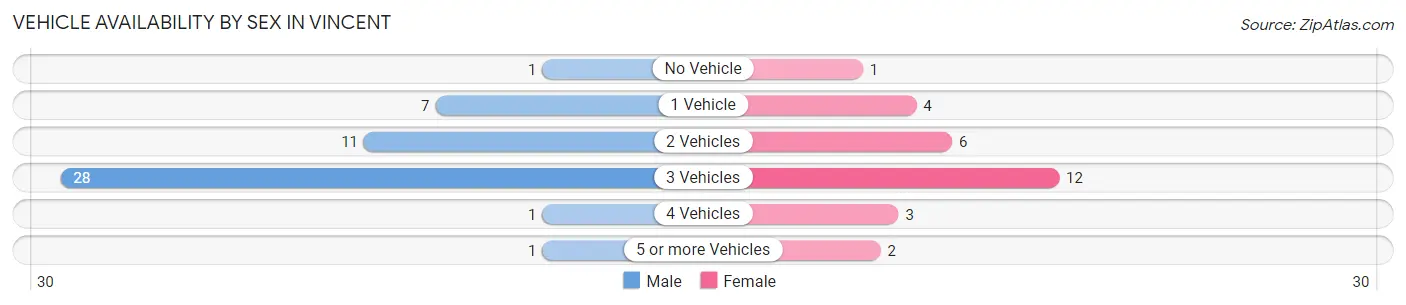
| Vehicles Available | Male | Female |
| No Vehicle | 1 (2.0%) | 1 (3.6%) |
| 1 Vehicle | 7 (14.3%) | 4 (14.3%) |
| 2 Vehicles | 11 (22.5%) | 6 (21.4%) |
| 3 Vehicles | 28 (57.1%) | 12 (42.9%) |
| 4 Vehicles | 1 (2.0%) | 3 (10.7%) |
| 5 or more Vehicles | 1 (2.0%) | 2 (7.1%) |
| Total | 49 (100.0%) | 28 (100.0%) |
Commute Time in Vincent
The most frequently occuring commute durations in Vincent are 15 to 19 minutes (20 commuters, 26.0%), 5 to 9 minutes (18 commuters, 23.4%), and 20 to 24 minutes (18 commuters, 23.4%).
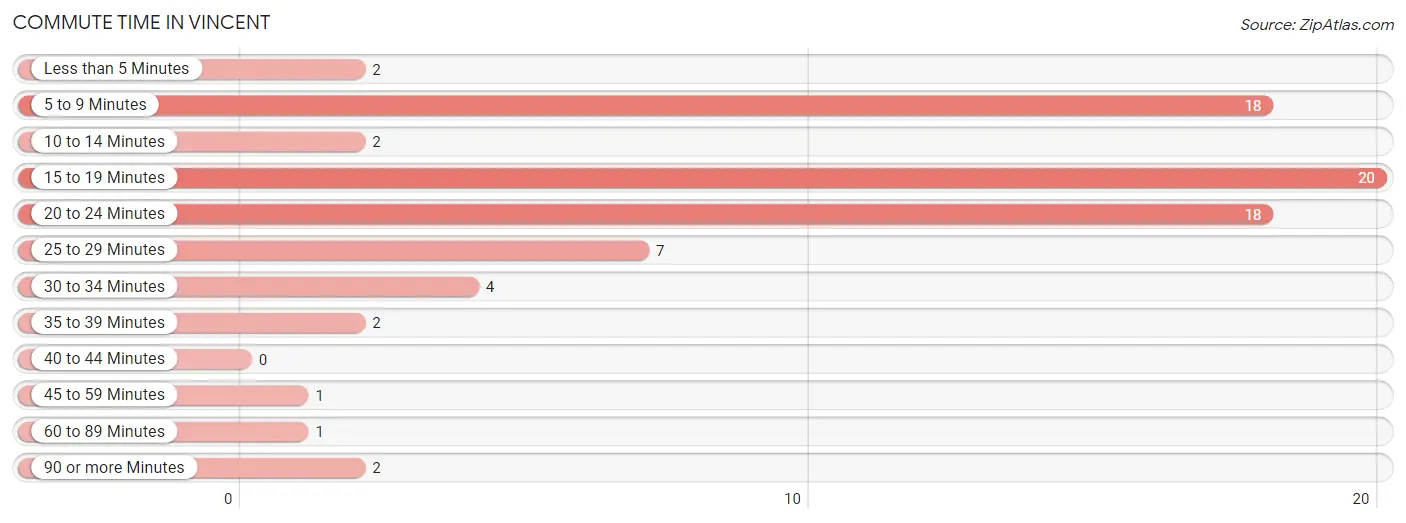
| Commute Time | # Commuters | % Commuters |
| Less than 5 Minutes | 2 | 2.6% |
| 5 to 9 Minutes | 18 | 23.4% |
| 10 to 14 Minutes | 2 | 2.6% |
| 15 to 19 Minutes | 20 | 26.0% |
| 20 to 24 Minutes | 18 | 23.4% |
| 25 to 29 Minutes | 7 | 9.1% |
| 30 to 34 Minutes | 4 | 5.2% |
| 35 to 39 Minutes | 2 | 2.6% |
| 40 to 44 Minutes | 0 | 0.0% |
| 45 to 59 Minutes | 1 | 1.3% |
| 60 to 89 Minutes | 1 | 1.3% |
| 90 or more Minutes | 2 | 2.6% |
Commute Time by Sex in Vincent
The most common commute times in Vincent are 5 to 9 minutes (17 commuters, 34.7%) for males and 15 to 19 minutes (12 commuters, 42.9%) for females.
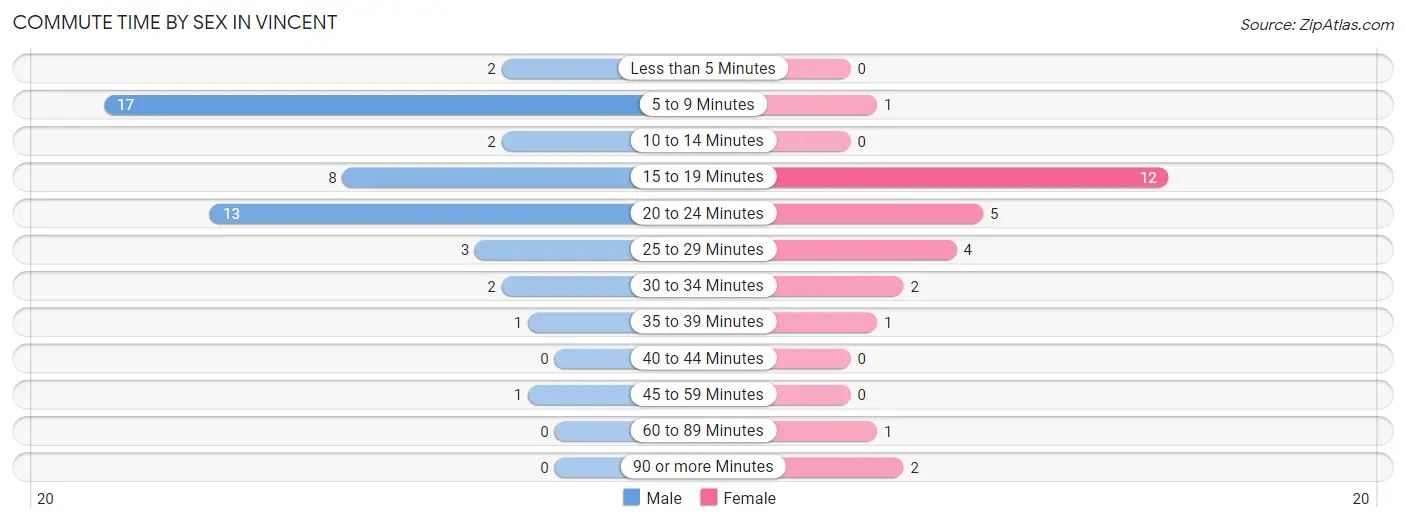
| Commute Time | Male | Female |
| Less than 5 Minutes | 2 (4.1%) | 0 (0.0%) |
| 5 to 9 Minutes | 17 (34.7%) | 1 (3.6%) |
| 10 to 14 Minutes | 2 (4.1%) | 0 (0.0%) |
| 15 to 19 Minutes | 8 (16.3%) | 12 (42.9%) |
| 20 to 24 Minutes | 13 (26.5%) | 5 (17.9%) |
| 25 to 29 Minutes | 3 (6.1%) | 4 (14.3%) |
| 30 to 34 Minutes | 2 (4.1%) | 2 (7.1%) |
| 35 to 39 Minutes | 1 (2.0%) | 1 (3.6%) |
| 40 to 44 Minutes | 0 (0.0%) | 0 (0.0%) |
| 45 to 59 Minutes | 1 (2.0%) | 0 (0.0%) |
| 60 to 89 Minutes | 0 (0.0%) | 1 (3.6%) |
| 90 or more Minutes | 0 (0.0%) | 2 (7.1%) |
Time of Departure to Work by Sex in Vincent
The most frequent times of departure to work in Vincent are 5:30 AM to 5:59 AM (20, 40.8%) for males and 7:30 AM to 7:59 AM (7, 25.0%) for females.
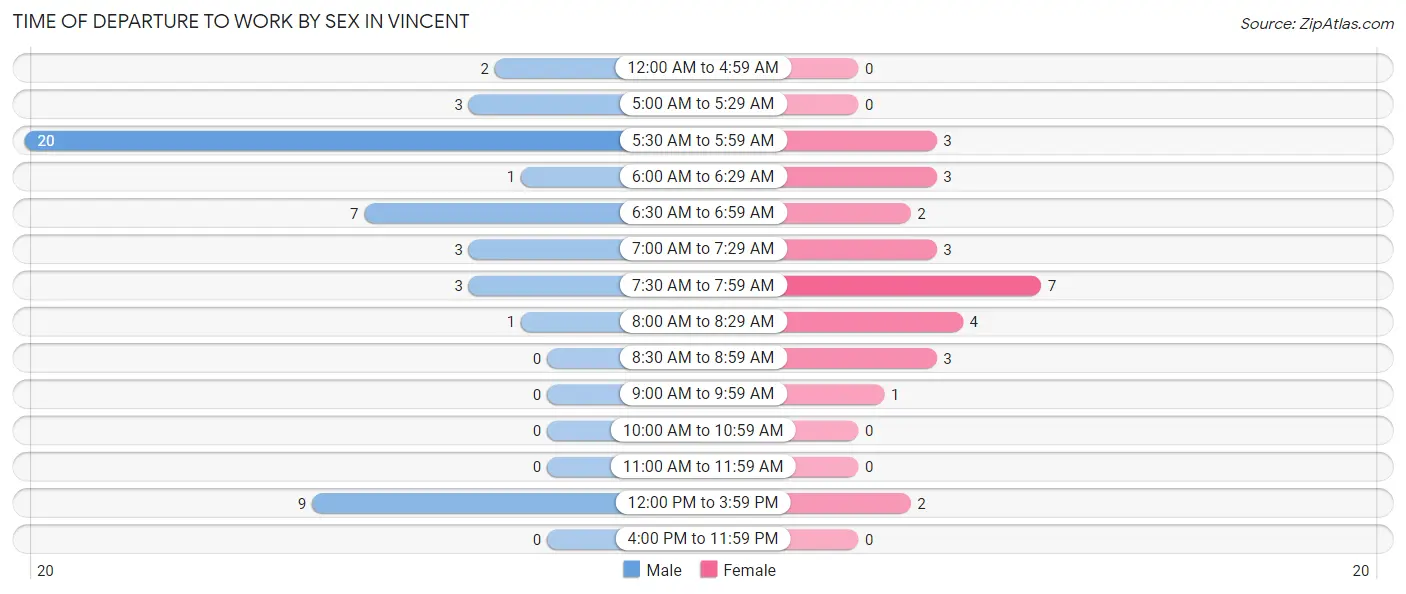
| Time of Departure | Male | Female |
| 12:00 AM to 4:59 AM | 2 (4.1%) | 0 (0.0%) |
| 5:00 AM to 5:29 AM | 3 (6.1%) | 0 (0.0%) |
| 5:30 AM to 5:59 AM | 20 (40.8%) | 3 (10.7%) |
| 6:00 AM to 6:29 AM | 1 (2.0%) | 3 (10.7%) |
| 6:30 AM to 6:59 AM | 7 (14.3%) | 2 (7.1%) |
| 7:00 AM to 7:29 AM | 3 (6.1%) | 3 (10.7%) |
| 7:30 AM to 7:59 AM | 3 (6.1%) | 7 (25.0%) |
| 8:00 AM to 8:29 AM | 1 (2.0%) | 4 (14.3%) |
| 8:30 AM to 8:59 AM | 0 (0.0%) | 3 (10.7%) |
| 9:00 AM to 9:59 AM | 0 (0.0%) | 1 (3.6%) |
| 10:00 AM to 10:59 AM | 0 (0.0%) | 0 (0.0%) |
| 11:00 AM to 11:59 AM | 0 (0.0%) | 0 (0.0%) |
| 12:00 PM to 3:59 PM | 9 (18.4%) | 2 (7.1%) |
| 4:00 PM to 11:59 PM | 0 (0.0%) | 0 (0.0%) |
| Total | 49 (100.0%) | 28 (100.0%) |
Housing Occupancy in Vincent
Occupancy by Ownership in Vincent
Of the total 66 dwellings in Vincent, owner-occupied units account for 42 (63.6%), while renter-occupied units make up 24 (36.4%).
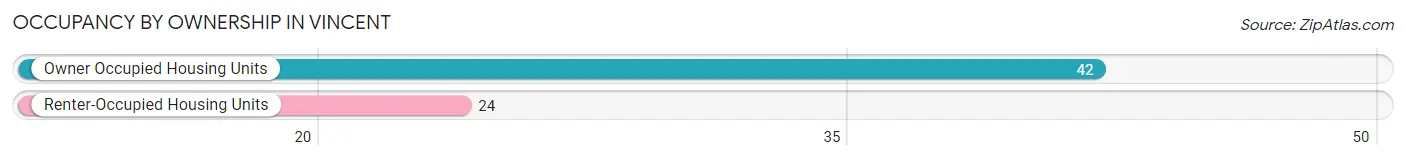
| Occupancy | # Housing Units | % Housing Units |
| Owner Occupied Housing Units | 42 | 63.6% |
| Renter-Occupied Housing Units | 24 | 36.4% |
| Total Occupied Housing Units | 66 | 100.0% |
Occupancy by Household Size in Vincent
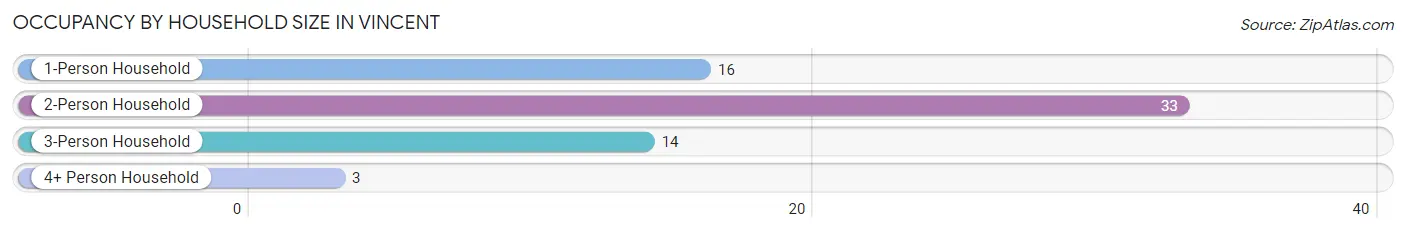
| Household Size | # Housing Units | % Housing Units |
| 1-Person Household | 16 | 24.2% |
| 2-Person Household | 33 | 50.0% |
| 3-Person Household | 14 | 21.2% |
| 4+ Person Household | 3 | 4.5% |
| Total Housing Units | 66 | 100.0% |
Occupancy by Ownership by Household Size in Vincent
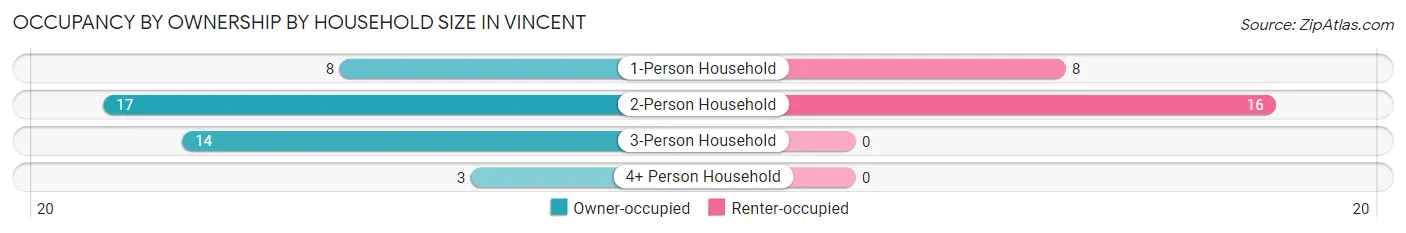
| Household Size | Owner-occupied | Renter-occupied |
| 1-Person Household | 8 (50.0%) | 8 (50.0%) |
| 2-Person Household | 17 (51.5%) | 16 (48.5%) |
| 3-Person Household | 14 (100.0%) | 0 (0.0%) |
| 4+ Person Household | 3 (100.0%) | 0 (0.0%) |
| Total Housing Units | 42 (63.6%) | 24 (36.4%) |
Occupancy by Educational Attainment in Vincent
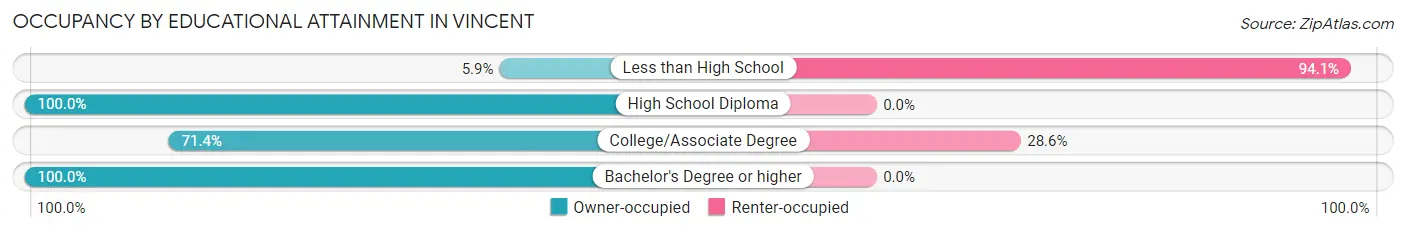
| Household Size | Owner-occupied | Renter-occupied |
| Less than High School | 1 (5.9%) | 16 (94.1%) |
| High School Diploma | 8 (100.0%) | 0 (0.0%) |
| College/Associate Degree | 20 (71.4%) | 8 (28.6%) |
| Bachelor's Degree or higher | 13 (100.0%) | 0 (0.0%) |
Occupancy by Age of Householder in Vincent
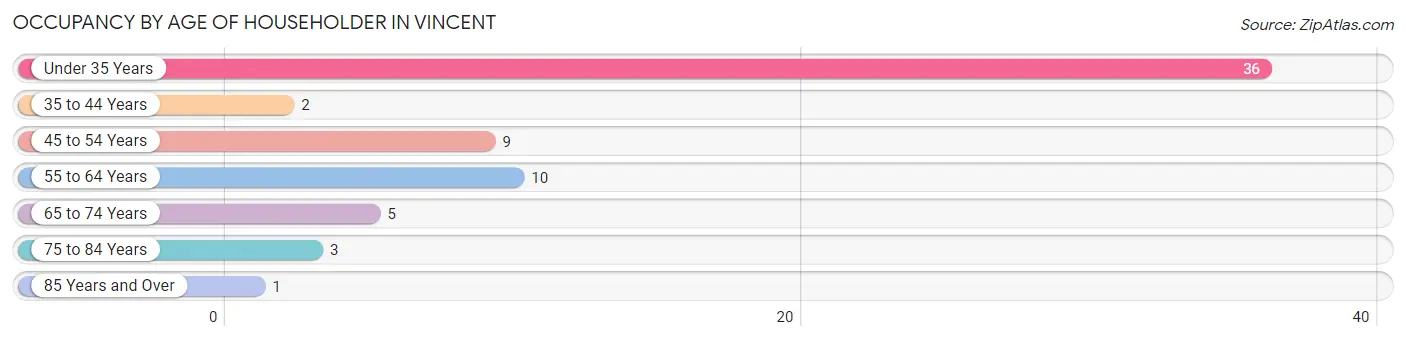
| Age Bracket | # Households | % Households |
| Under 35 Years | 36 | 54.5% |
| 35 to 44 Years | 2 | 3.0% |
| 45 to 54 Years | 9 | 13.6% |
| 55 to 64 Years | 10 | 15.1% |
| 65 to 74 Years | 5 | 7.6% |
| 75 to 84 Years | 3 | 4.5% |
| 85 Years and Over | 1 | 1.5% |
| Total | 66 | 100.0% |
Housing Finances in Vincent
Median Income by Occupancy in Vincent
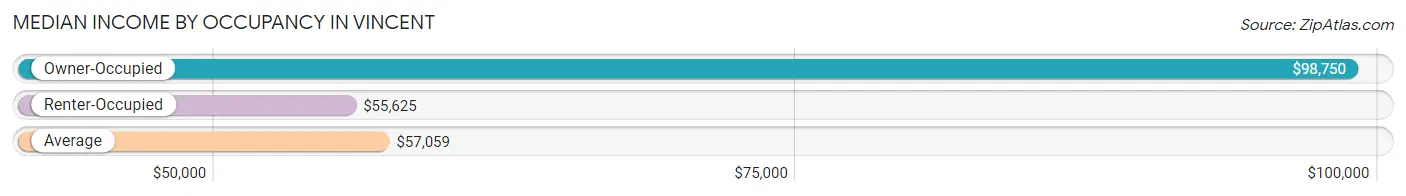
| Occupancy Type | # Households | Median Income |
| Owner-Occupied | 42 (63.6%) | $98,750 |
| Renter-Occupied | 24 (36.4%) | $55,625 |
| Average | 66 (100.0%) | $57,059 |
Occupancy by Householder Income Bracket in Vincent
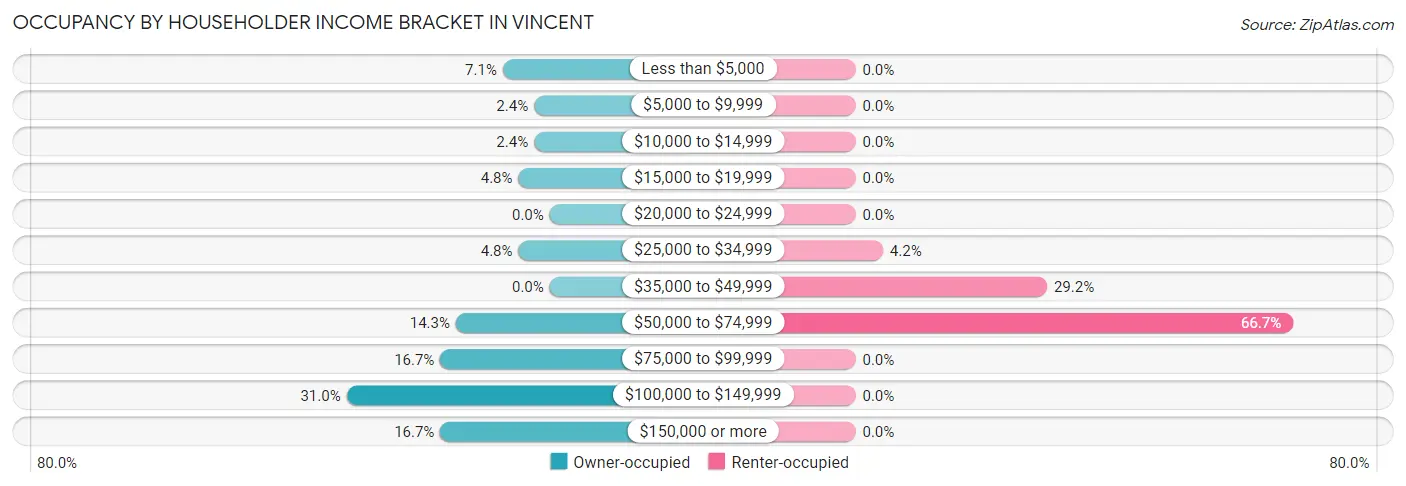
| Income Bracket | Owner-occupied | Renter-occupied |
| Less than $5,000 | 3 (7.1%) | 0 (0.0%) |
| $5,000 to $9,999 | 1 (2.4%) | 0 (0.0%) |
| $10,000 to $14,999 | 1 (2.4%) | 0 (0.0%) |
| $15,000 to $19,999 | 2 (4.8%) | 0 (0.0%) |
| $20,000 to $24,999 | 0 (0.0%) | 0 (0.0%) |
| $25,000 to $34,999 | 2 (4.8%) | 1 (4.2%) |
| $35,000 to $49,999 | 0 (0.0%) | 7 (29.2%) |
| $50,000 to $74,999 | 6 (14.3%) | 16 (66.7%) |
| $75,000 to $99,999 | 7 (16.7%) | 0 (0.0%) |
| $100,000 to $149,999 | 13 (30.9%) | 0 (0.0%) |
| $150,000 or more | 7 (16.7%) | 0 (0.0%) |
| Total | 42 (100.0%) | 24 (100.0%) |
Monthly Housing Cost Tiers in Vincent
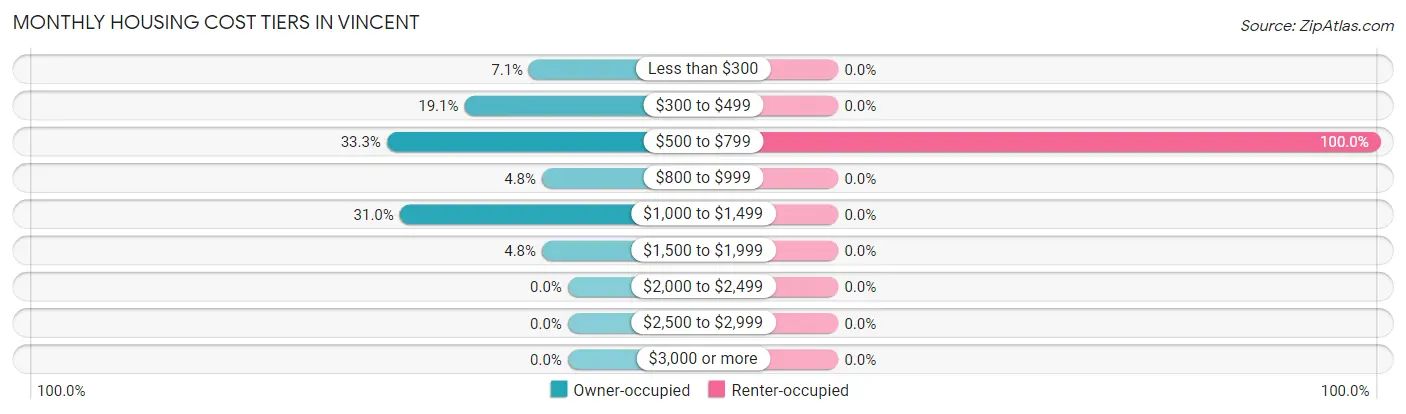
| Monthly Cost | Owner-occupied | Renter-occupied |
| Less than $300 | 3 (7.1%) | 0 (0.0%) |
| $300 to $499 | 8 (19.1%) | 0 (0.0%) |
| $500 to $799 | 14 (33.3%) | 24 (100.0%) |
| $800 to $999 | 2 (4.8%) | 0 (0.0%) |
| $1,000 to $1,499 | 13 (30.9%) | 0 (0.0%) |
| $1,500 to $1,999 | 2 (4.8%) | 0 (0.0%) |
| $2,000 to $2,499 | 0 (0.0%) | 0 (0.0%) |
| $2,500 to $2,999 | 0 (0.0%) | 0 (0.0%) |
| $3,000 or more | 0 (0.0%) | 0 (0.0%) |
| Total | 42 (100.0%) | 24 (100.0%) |
Physical Housing Characteristics in Vincent
Housing Structures in Vincent
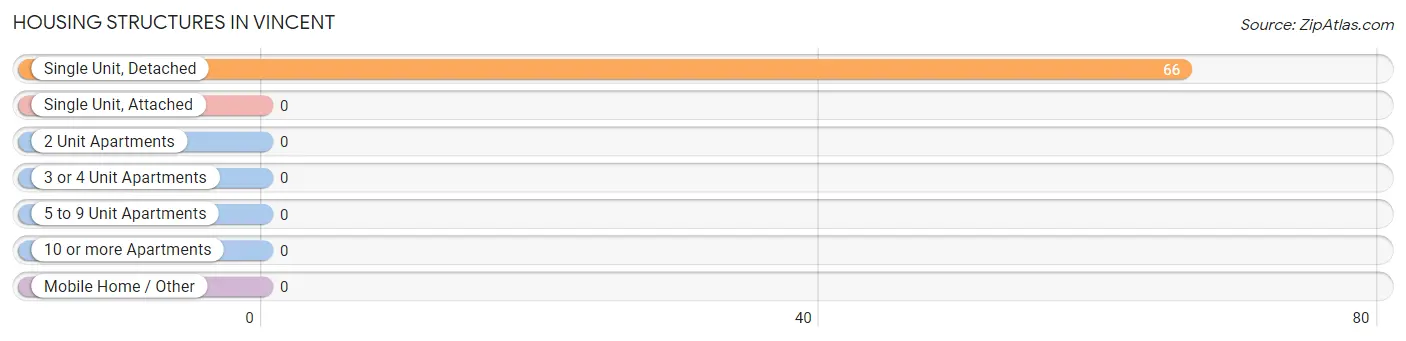
| Structure Type | # Housing Units | % Housing Units |
| Single Unit, Detached | 66 | 100.0% |
| Single Unit, Attached | 0 | 0.0% |
| 2 Unit Apartments | 0 | 0.0% |
| 3 or 4 Unit Apartments | 0 | 0.0% |
| 5 to 9 Unit Apartments | 0 | 0.0% |
| 10 or more Apartments | 0 | 0.0% |
| Mobile Home / Other | 0 | 0.0% |
| Total | 66 | 100.0% |
Housing Structures by Occupancy in Vincent
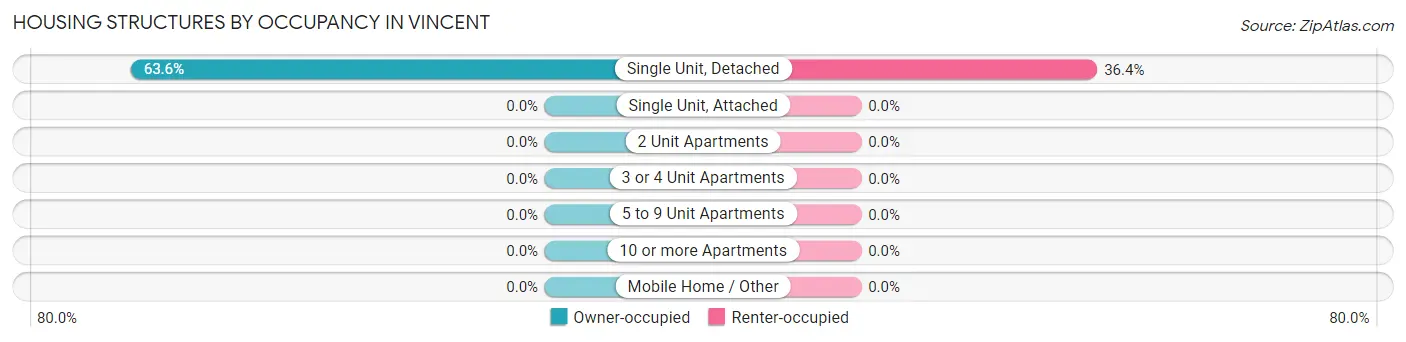
| Structure Type | Owner-occupied | Renter-occupied |
| Single Unit, Detached | 42 (63.6%) | 24 (36.4%) |
| Single Unit, Attached | 0 (0.0%) | 0 (0.0%) |
| 2 Unit Apartments | 0 (0.0%) | 0 (0.0%) |
| 3 or 4 Unit Apartments | 0 (0.0%) | 0 (0.0%) |
| 5 to 9 Unit Apartments | 0 (0.0%) | 0 (0.0%) |
| 10 or more Apartments | 0 (0.0%) | 0 (0.0%) |
| Mobile Home / Other | 0 (0.0%) | 0 (0.0%) |
| Total | 42 (63.6%) | 24 (36.4%) |
Housing Structures by Number of Rooms in Vincent
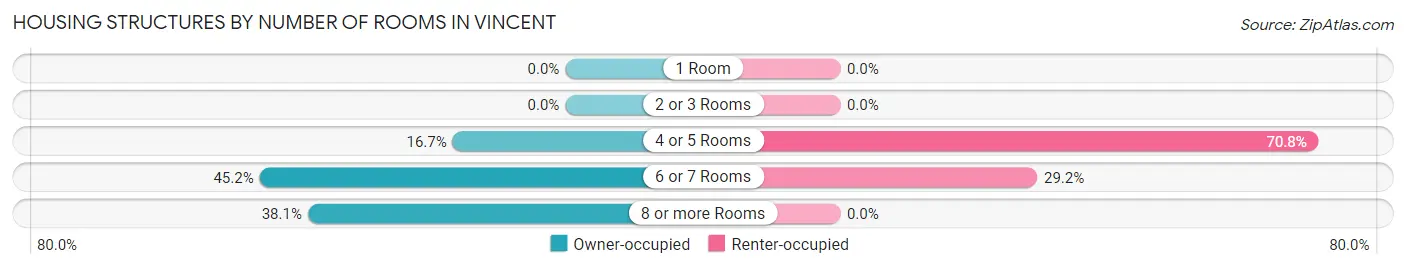
| Number of Rooms | Owner-occupied | Renter-occupied |
| 1 Room | 0 (0.0%) | 0 (0.0%) |
| 2 or 3 Rooms | 0 (0.0%) | 0 (0.0%) |
| 4 or 5 Rooms | 7 (16.7%) | 17 (70.8%) |
| 6 or 7 Rooms | 19 (45.2%) | 7 (29.2%) |
| 8 or more Rooms | 16 (38.1%) | 0 (0.0%) |
| Total | 42 (100.0%) | 24 (100.0%) |
Housing Structure by Heating Type in Vincent
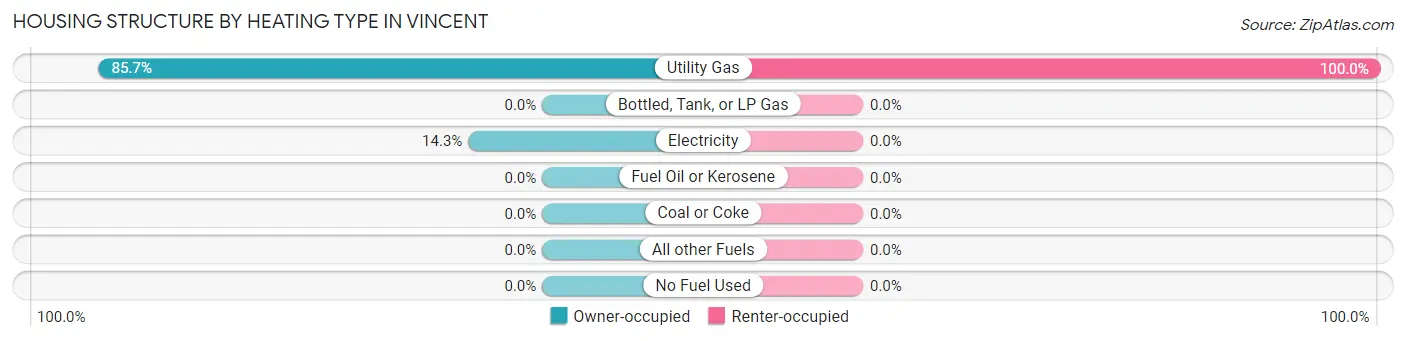
| Heating Type | Owner-occupied | Renter-occupied |
| Utility Gas | 36 (85.7%) | 24 (100.0%) |
| Bottled, Tank, or LP Gas | 0 (0.0%) | 0 (0.0%) |
| Electricity | 6 (14.3%) | 0 (0.0%) |
| Fuel Oil or Kerosene | 0 (0.0%) | 0 (0.0%) |
| Coal or Coke | 0 (0.0%) | 0 (0.0%) |
| All other Fuels | 0 (0.0%) | 0 (0.0%) |
| No Fuel Used | 0 (0.0%) | 0 (0.0%) |
| Total | 42 (100.0%) | 24 (100.0%) |
Household Vehicle Usage in Vincent
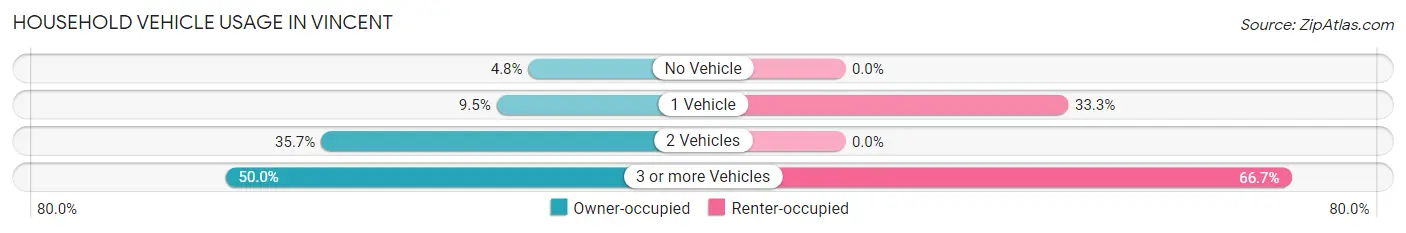
| Vehicles per Household | Owner-occupied | Renter-occupied |
| No Vehicle | 2 (4.8%) | 0 (0.0%) |
| 1 Vehicle | 4 (9.5%) | 8 (33.3%) |
| 2 Vehicles | 15 (35.7%) | 0 (0.0%) |
| 3 or more Vehicles | 21 (50.0%) | 16 (66.7%) |
| Total | 42 (100.0%) | 24 (100.0%) |
Real Estate & Mortgages in Vincent
Real Estate and Mortgage Overview in Vincent
| Characteristic | Without Mortgage | With Mortgage |
| Housing Units | 15 | 27 |
| Median Property Value | $77,500 | $121,900 |
| Median Household Income | $66,875 | $7 |
| Monthly Housing Costs | $413 | $0 |
| Real Estate Taxes | $950 | $0 |
Property Value by Mortgage Status in Vincent
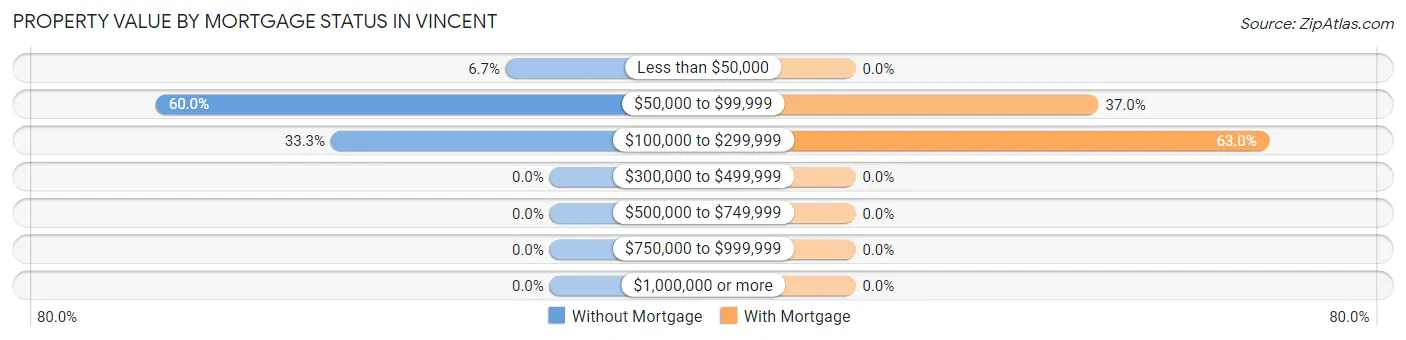
| Property Value | Without Mortgage | With Mortgage |
| Less than $50,000 | 1 (6.7%) | 0 (0.0%) |
| $50,000 to $99,999 | 9 (60.0%) | 10 (37.0%) |
| $100,000 to $299,999 | 5 (33.3%) | 17 (63.0%) |
| $300,000 to $499,999 | 0 (0.0%) | 0 (0.0%) |
| $500,000 to $749,999 | 0 (0.0%) | 0 (0.0%) |
| $750,000 to $999,999 | 0 (0.0%) | 0 (0.0%) |
| $1,000,000 or more | 0 (0.0%) | 0 (0.0%) |
| Total | 15 (100.0%) | 27 (100.0%) |
Household Income by Mortgage Status in Vincent
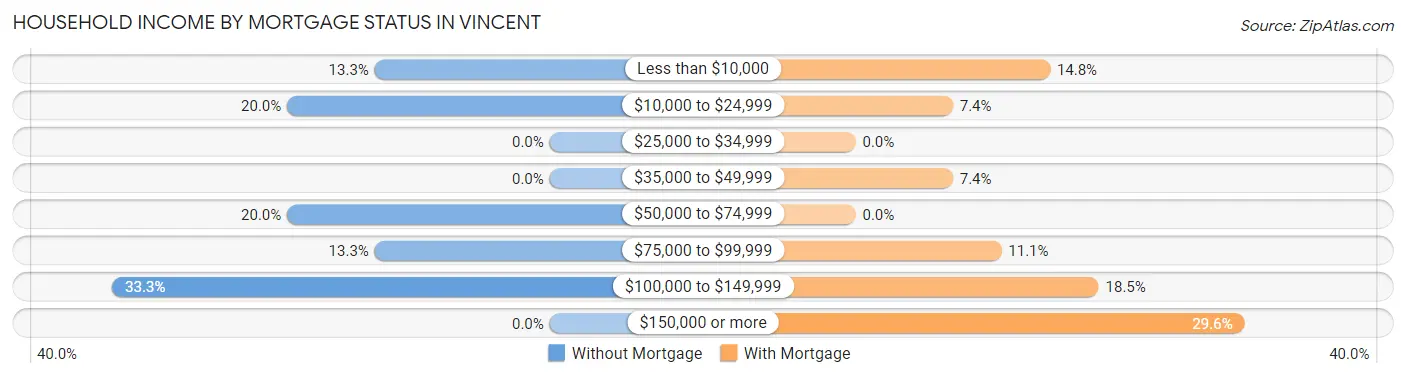
| Household Income | Without Mortgage | With Mortgage |
| Less than $10,000 | 2 (13.3%) | 4 (14.8%) |
| $10,000 to $24,999 | 3 (20.0%) | 2 (7.4%) |
| $25,000 to $34,999 | 0 (0.0%) | 0 (0.0%) |
| $35,000 to $49,999 | 0 (0.0%) | 2 (7.4%) |
| $50,000 to $74,999 | 3 (20.0%) | 0 (0.0%) |
| $75,000 to $99,999 | 2 (13.3%) | 3 (11.1%) |
| $100,000 to $149,999 | 5 (33.3%) | 5 (18.5%) |
| $150,000 or more | 0 (0.0%) | 8 (29.6%) |
| Total | 15 (100.0%) | 27 (100.0%) |
Property Value to Household Income Ratio in Vincent
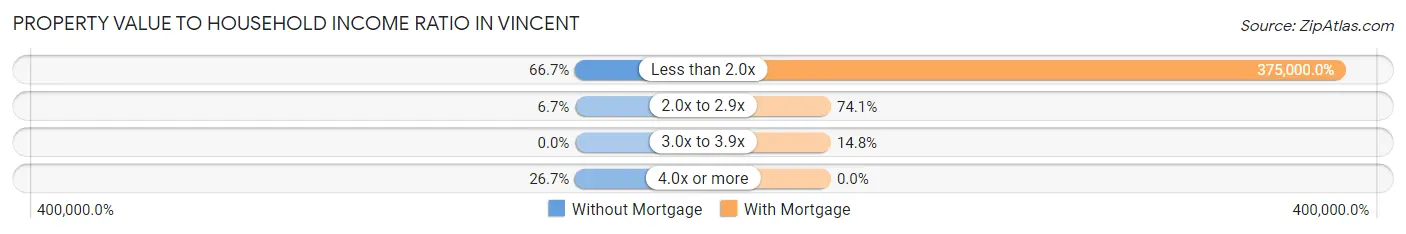
| Value-to-Income Ratio | Without Mortgage | With Mortgage |
| Less than 2.0x | 10 (66.7%) | 101,250 (375,000.0%) |
| 2.0x to 2.9x | 1 (6.7%) | 20 (74.1%) |
| 3.0x to 3.9x | 0 (0.0%) | 4 (14.8%) |
| 4.0x or more | 4 (26.7%) | 0 (0.0%) |
| Total | 15 (100.0%) | 27 (100.0%) |
Real Estate Taxes by Mortgage Status in Vincent
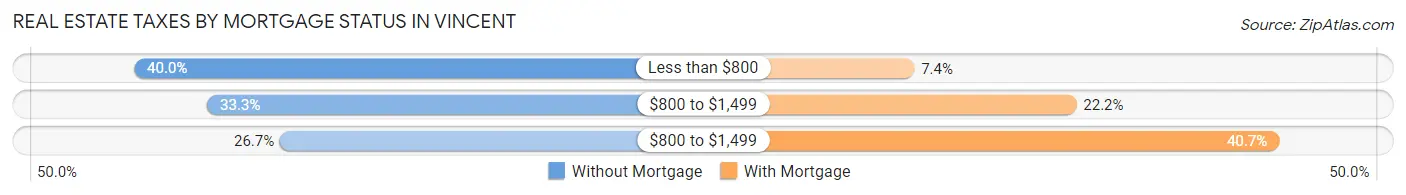
| Property Taxes | Without Mortgage | With Mortgage |
| Less than $800 | 6 (40.0%) | 2 (7.4%) |
| $800 to $1,499 | 5 (33.3%) | 6 (22.2%) |
| $800 to $1,499 | 4 (26.7%) | 11 (40.7%) |
| Total | 15 (100.0%) | 27 (100.0%) |
Health & Disability in Vincent
Health Insurance Coverage by Age in Vincent
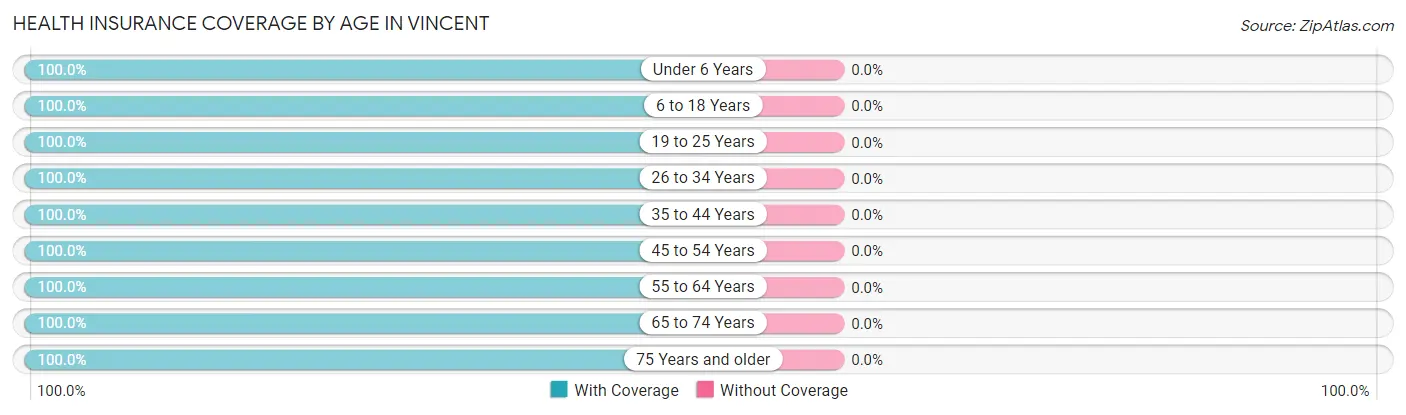
| Age Bracket | With Coverage | Without Coverage |
| Under 6 Years | 7 (100.0%) | 0 (0.0%) |
| 6 to 18 Years | 10 (100.0%) | 0 (0.0%) |
| 19 to 25 Years | 9 (100.0%) | 0 (0.0%) |
| 26 to 34 Years | 37 (100.0%) | 0 (0.0%) |
| 35 to 44 Years | 10 (100.0%) | 0 (0.0%) |
| 45 to 54 Years | 12 (100.0%) | 0 (0.0%) |
| 55 to 64 Years | 19 (100.0%) | 0 (0.0%) |
| 65 to 74 Years | 8 (100.0%) | 0 (0.0%) |
| 75 Years and older | 7 (100.0%) | 0 (0.0%) |
| Total | 119 (100.0%) | 0 (0.0%) |
Health Insurance Coverage by Citizenship Status in Vincent
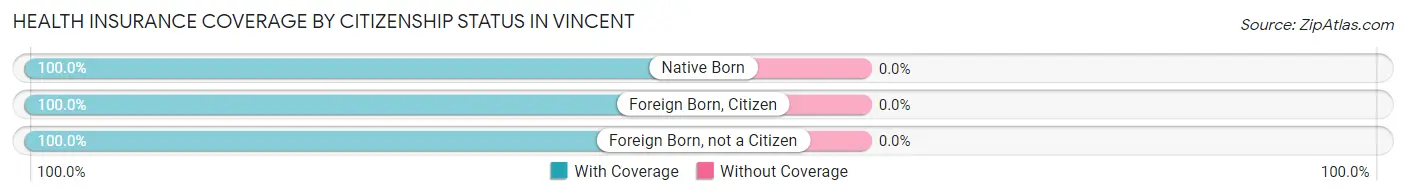
| Citizenship Status | With Coverage | Without Coverage |
| Native Born | 7 (100.0%) | 0 (0.0%) |
| Foreign Born, Citizen | 10 (100.0%) | 0 (0.0%) |
| Foreign Born, not a Citizen | 9 (100.0%) | 0 (0.0%) |
Health Insurance Coverage by Household Income in Vincent
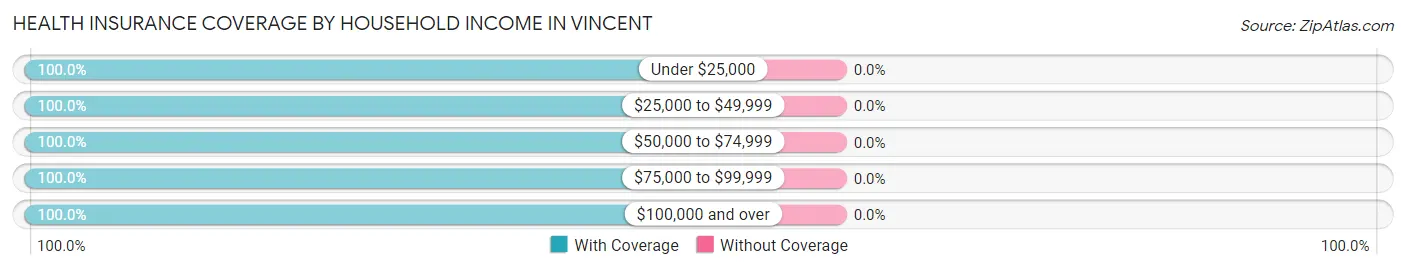
| Household Income | With Coverage | Without Coverage |
| Under $25,000 | 11 (100.0%) | 0 (0.0%) |
| $25,000 to $49,999 | 11 (100.0%) | 0 (0.0%) |
| $50,000 to $74,999 | 36 (100.0%) | 0 (0.0%) |
| $75,000 to $99,999 | 20 (100.0%) | 0 (0.0%) |
| $100,000 and over | 41 (100.0%) | 0 (0.0%) |
Public vs Private Health Insurance Coverage by Age in Vincent
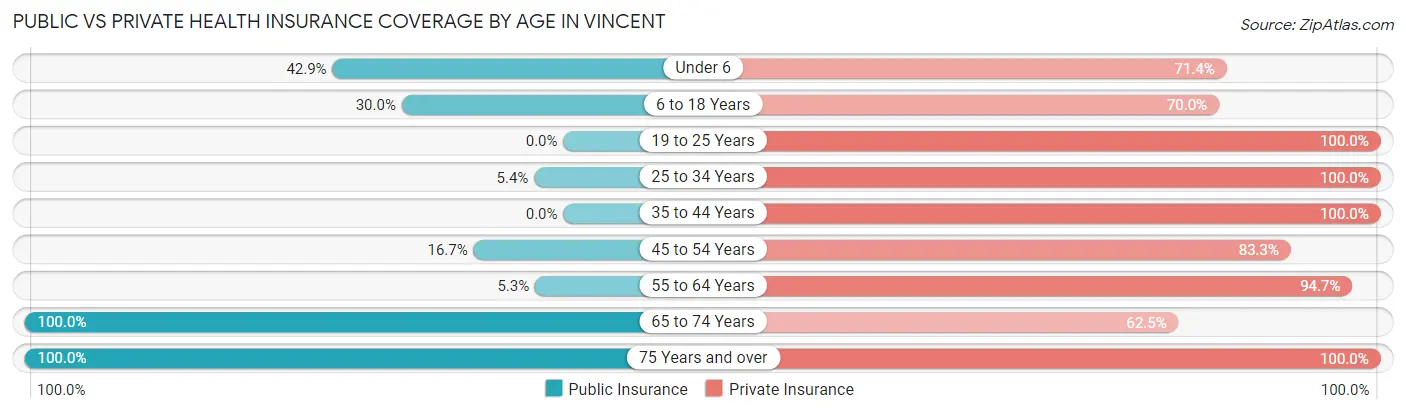
| Age Bracket | Public Insurance | Private Insurance |
| Under 6 | 3 (42.9%) | 5 (71.4%) |
| 6 to 18 Years | 3 (30.0%) | 7 (70.0%) |
| 19 to 25 Years | 0 (0.0%) | 9 (100.0%) |
| 25 to 34 Years | 2 (5.4%) | 37 (100.0%) |
| 35 to 44 Years | 0 (0.0%) | 10 (100.0%) |
| 45 to 54 Years | 2 (16.7%) | 10 (83.3%) |
| 55 to 64 Years | 1 (5.3%) | 18 (94.7%) |
| 65 to 74 Years | 8 (100.0%) | 5 (62.5%) |
| 75 Years and over | 7 (100.0%) | 7 (100.0%) |
| Total | 26 (21.8%) | 108 (90.8%) |
Disability Status by Sex by Age in Vincent
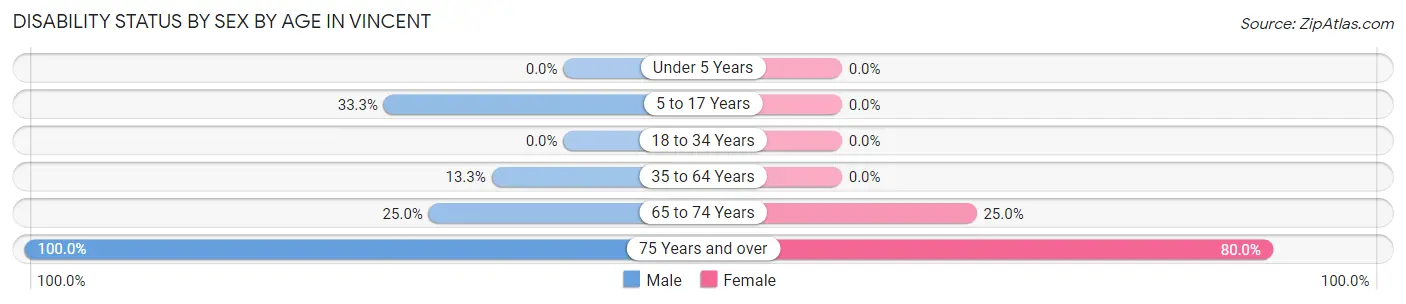
| Age Bracket | Male | Female |
| Under 5 Years | 0 (0.0%) | 0 (0.0%) |
| 5 to 17 Years | 2 (33.3%) | 0 (0.0%) |
| 18 to 34 Years | 0 (0.0%) | 0 (0.0%) |
| 35 to 64 Years | 2 (13.3%) | 0 (0.0%) |
| 65 to 74 Years | 1 (25.0%) | 1 (25.0%) |
| 75 Years and over | 2 (100.0%) | 4 (80.0%) |
Disability Class by Sex by Age in Vincent
Disability Class: Hearing Difficulty
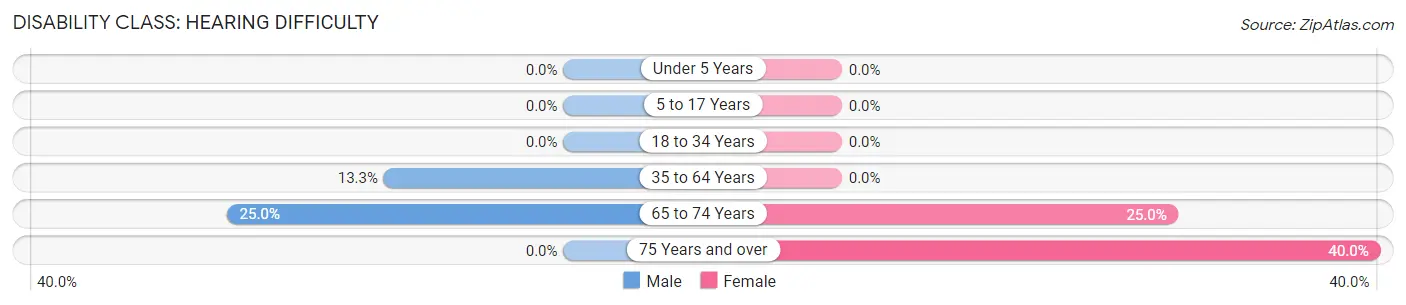
| Age Bracket | Male | Female |
| Under 5 Years | 0 (0.0%) | 0 (0.0%) |
| 5 to 17 Years | 0 (0.0%) | 0 (0.0%) |
| 18 to 34 Years | 0 (0.0%) | 0 (0.0%) |
| 35 to 64 Years | 2 (13.3%) | 0 (0.0%) |
| 65 to 74 Years | 1 (25.0%) | 1 (25.0%) |
| 75 Years and over | 0 (0.0%) | 2 (40.0%) |
Disability Class: Vision Difficulty
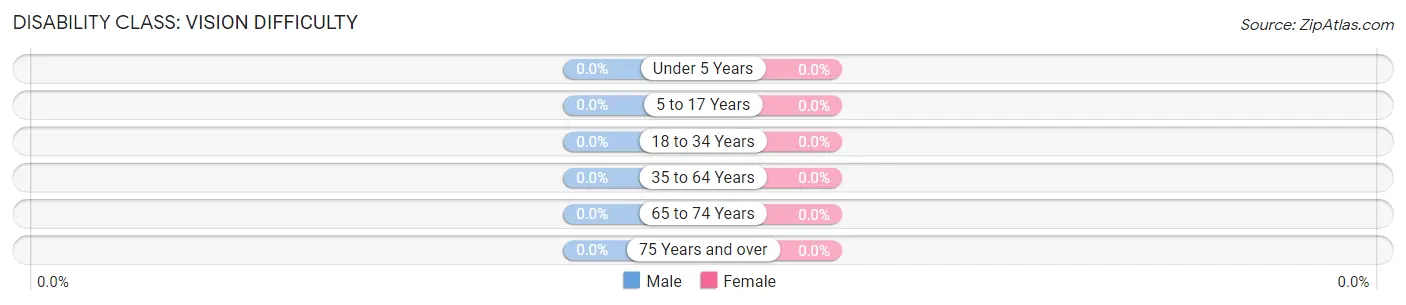
| Age Bracket | Male | Female |
| Under 5 Years | 0 (0.0%) | 0 (0.0%) |
| 5 to 17 Years | 0 (0.0%) | 0 (0.0%) |
| 18 to 34 Years | 0 (0.0%) | 0 (0.0%) |
| 35 to 64 Years | 0 (0.0%) | 0 (0.0%) |
| 65 to 74 Years | 0 (0.0%) | 0 (0.0%) |
| 75 Years and over | 0 (0.0%) | 0 (0.0%) |
Disability Class: Cognitive Difficulty
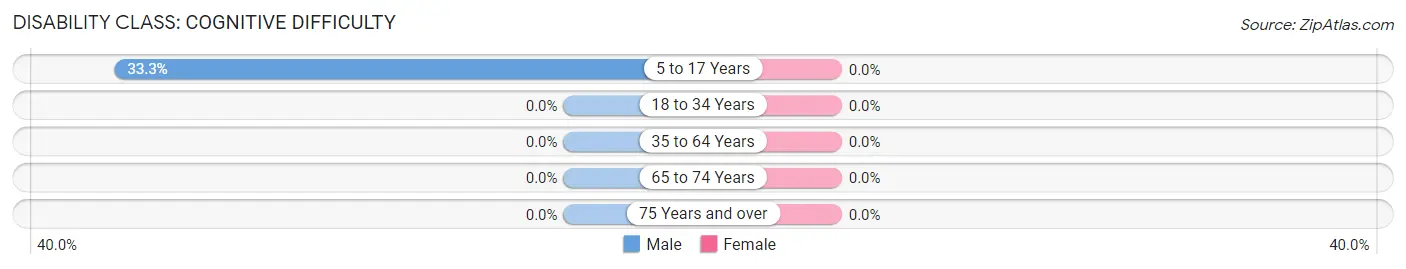
| Age Bracket | Male | Female |
| 5 to 17 Years | 2 (33.3%) | 0 (0.0%) |
| 18 to 34 Years | 0 (0.0%) | 0 (0.0%) |
| 35 to 64 Years | 0 (0.0%) | 0 (0.0%) |
| 65 to 74 Years | 0 (0.0%) | 0 (0.0%) |
| 75 Years and over | 0 (0.0%) | 0 (0.0%) |
Disability Class: Ambulatory Difficulty
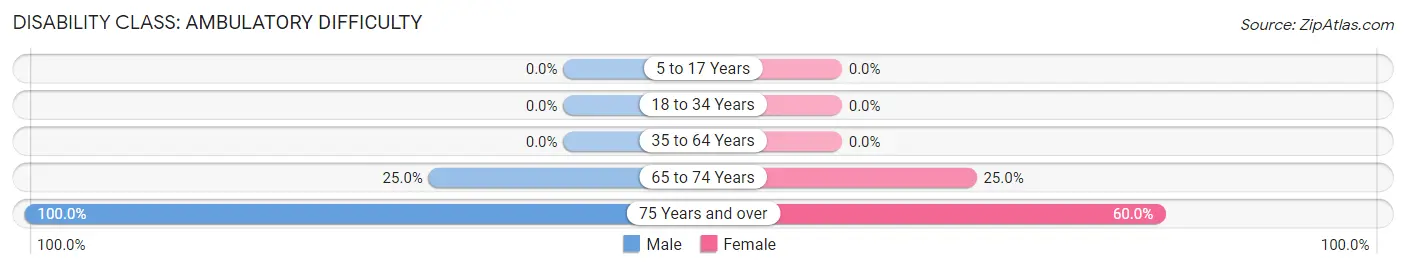
| Age Bracket | Male | Female |
| 5 to 17 Years | 0 (0.0%) | 0 (0.0%) |
| 18 to 34 Years | 0 (0.0%) | 0 (0.0%) |
| 35 to 64 Years | 0 (0.0%) | 0 (0.0%) |
| 65 to 74 Years | 1 (25.0%) | 1 (25.0%) |
| 75 Years and over | 2 (100.0%) | 3 (60.0%) |
Disability Class: Self-Care Difficulty
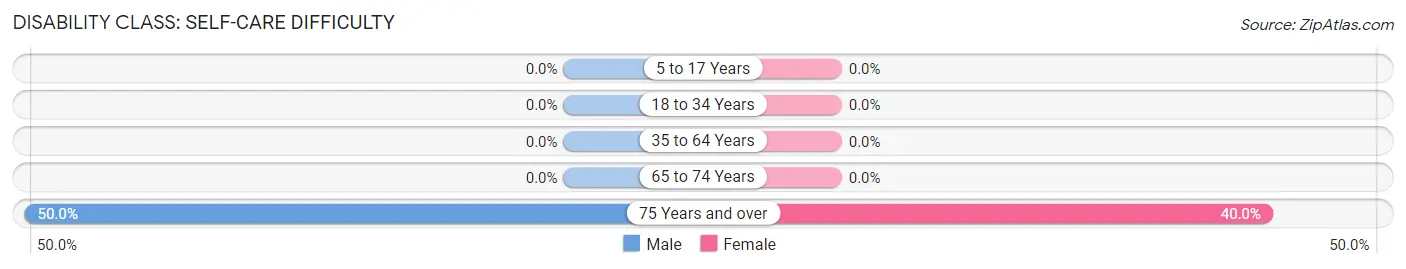
| Age Bracket | Male | Female |
| 5 to 17 Years | 0 (0.0%) | 0 (0.0%) |
| 18 to 34 Years | 0 (0.0%) | 0 (0.0%) |
| 35 to 64 Years | 0 (0.0%) | 0 (0.0%) |
| 65 to 74 Years | 0 (0.0%) | 0 (0.0%) |
| 75 Years and over | 1 (50.0%) | 2 (40.0%) |
Technology Access in Vincent
Computing Device Access in Vincent
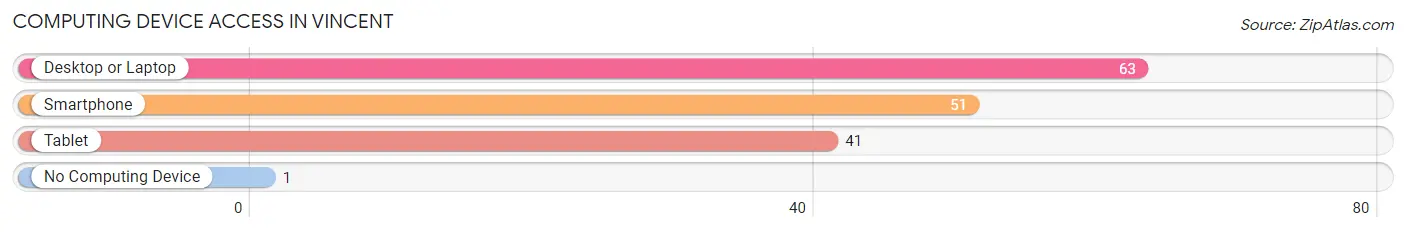
| Device Type | # Households | % Households |
| Desktop or Laptop | 63 | 95.5% |
| Smartphone | 51 | 77.3% |
| Tablet | 41 | 62.1% |
| No Computing Device | 1 | 1.5% |
| Total | 66 | 100.0% |
Internet Access in Vincent
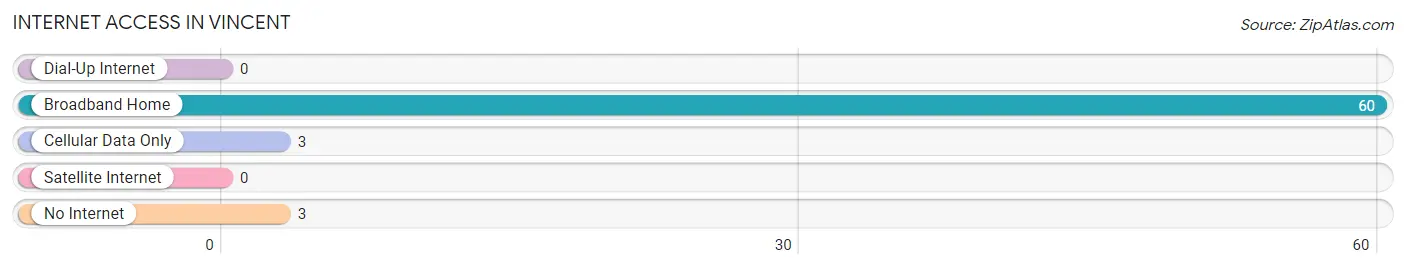
| Internet Type | # Households | % Households |
| Dial-Up Internet | 0 | 0.0% |
| Broadband Home | 60 | 90.9% |
| Cellular Data Only | 3 | 4.5% |
| Satellite Internet | 0 | 0.0% |
| No Internet | 3 | 4.5% |
| Total | 66 | 100.0% |
Vincent Summary
Vincent is a small city located in the state of Iowa, in the United States of America. It is situated in the southwestern corner of the state, in the county of Scott. The city has a population of approximately 1,000 people, and is part of the Davenport-Moline-Rock Island Metropolitan Statistical Area.
History
Vincent was founded in 1854 by a group of settlers from the nearby town of Davenport. The town was named after the first settler, John Vincent, who had purchased the land from the government. The town was originally a farming community, and the main crops grown were corn, wheat, and oats. As the town grew, it became a center for the lumber industry, and the first sawmill was built in 1856.
In the late 19th century, the town began to experience a period of growth and prosperity. The railroad arrived in 1883, and the town was incorporated in 1885. The population of the town grew steadily, and by the turn of the century, it had reached 1,000 people.
Geography
Vincent is located in the southwestern corner of Iowa, in the county of Scott. It is situated on the banks of the Mississippi River, and is bordered by the towns of Davenport, Moline, and Rock Island. The city has a total area of 1.2 square miles, all of which is land.
The climate in Vincent is humid continental, with hot summers and cold winters. The average temperature in the summer is around 75 degrees Fahrenheit, and in the winter it is around 25 degrees Fahrenheit. The average annual precipitation is around 40 inches.
Economy
The economy of Vincent is largely based on agriculture and manufacturing. The main crops grown in the area are corn, soybeans, and wheat. The town is also home to several manufacturing companies, including a paper mill, a furniture factory, and a plastics factory.
The town also has a thriving tourism industry, with many visitors coming to the area to enjoy the natural beauty of the Mississippi River. There are several parks and recreational areas in the area, as well as a number of historic sites.
Demographics
As of the 2010 census, the population of Vincent was 1,000 people. The racial makeup of the town was 97.2% White, 0.7% African American, 0.3% Native American, 0.2% Asian, and 1.6% from other races. The median household income was $41,250, and the median family income was $50,000.
The town has a large number of churches, and the majority of the population is Christian. The largest denominations are Catholic, Lutheran, and Methodist. The town also has a small Jewish population.
Conclusion
Vincent is a small city located in the southwestern corner of Iowa. It has a population of 1,000 people, and is part of the Davenport-Moline-Rock Island Metropolitan Statistical Area. The town was founded in 1854, and has a long history of agriculture and manufacturing. The economy of the town is largely based on agriculture and manufacturing, and the town also has a thriving tourism industry. The population of Vincent is predominantly White, and the majority of the population is Christian.
Common Questions
What is Per Capita Income in Vincent?
Per Capita income in Vincent is $47,530.
What is the Median Family Income in Vincent?
Median Family Income in Vincent is $57,426.
What is the Median Household income in Vincent?
Median Household Income in Vincent is $57,059.
What is Income or Wage Gap in Vincent?
Income or Wage Gap in Vincent is 36.3%.
Women in Vincent earn 63.7 cents for every dollar earned by a man.
What is Inequality or Gini Index in Vincent?
Inequality or Gini Index in Vincent is 0.42.
What is the Total Population of Vincent?
Total Population of Vincent is 119.
What is the Total Male Population of Vincent?
Total Male Population of Vincent is 64.
What is the Total Female Population of Vincent?
Total Female Population of Vincent is 55.
What is the Ratio of Males per 100 Females in Vincent?
There are 116.36 Males per 100 Females in Vincent.
What is the Ratio of Females per 100 Males in Vincent?
There are 85.94 Females per 100 Males in Vincent.
What is the Median Population Age in Vincent?
Median Population Age in Vincent is 34.8 Years.
What is the Average Family Size in Vincent
Average Family Size in Vincent is 2.1 People.
What is the Average Household Size in Vincent
Average Household Size in Vincent is 1.8 People.
How Large is the Labor Force in Vincent?
There are 78 People in the Labor Forcein in Vincent.
What is the Percentage of People in the Labor Force in Vincent?
72.9% of People are in the Labor Force in Vincent.
What is the Unemployment Rate in Vincent?
Unemployment Rate in Vincent is 1.3%.