Ute, IA Map & Demographics
Ute Map
Ute Overview
$30,502
PER CAPITA INCOME
$52,050
AVG FAMILY INCOME
$51,250
AVG HOUSEHOLD INCOME
1.7%
WAGE / INCOME GAP [ % ]
98.3¢/ $1
WAGE / INCOME GAP [ $ ]
0.44
INEQUALITY / GINI INDEX
331
TOTAL POPULATION
141
MALE POPULATION
190
FEMALE POPULATION
74.21
MALES / 100 FEMALES
134.75
FEMALES / 100 MALES
39.5
MEDIAN AGE
2.5
AVG FAMILY SIZE
1.9
AVG HOUSEHOLD SIZE
170
LABOR FORCE [ PEOPLE ]
60.7%
PERCENT IN LABOR FORCE
1.2%
UNEMPLOYMENT RATE
Ute Zip Codes
Ute Area Codes
Income in Ute
Income Overview in Ute
Per Capita Income in Ute is $30,502, while median incomes of families and households are $52,050 and $51,250 respectively.
| Characteristic | Number | Measure |
| Per Capita Income | 331 | $30,502 |
| Median Family Income | 83 | $52,050 |
| Mean Family Income | 83 | $65,328 |
| Median Household Income | 174 | $51,250 |
| Mean Household Income | 174 | $59,849 |
| Income Deficit | 83 | $0 |
| Wage / Income Gap (%) | 331 | 1.68% |
| Wage / Income Gap ($) | 331 | 98.32¢ per $1 |
| Gini / Inequality Index | 331 | 0.44 |
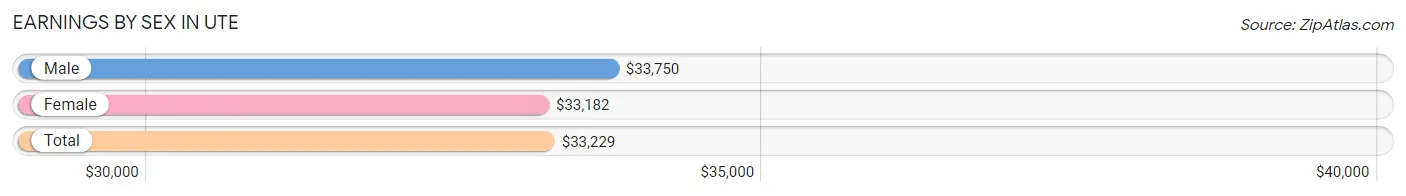
Earnings by Sex in Ute
Average Earnings in Ute are $33,229, $33,750 for men and $33,182 for women, a difference of 1.7%.
| Sex | Number | Average Earnings |
| Male | 77 (38.3%) | $33,750 |
| Female | 124 (61.7%) | $33,182 |
| Total | 201 (100.0%) | $33,229 |
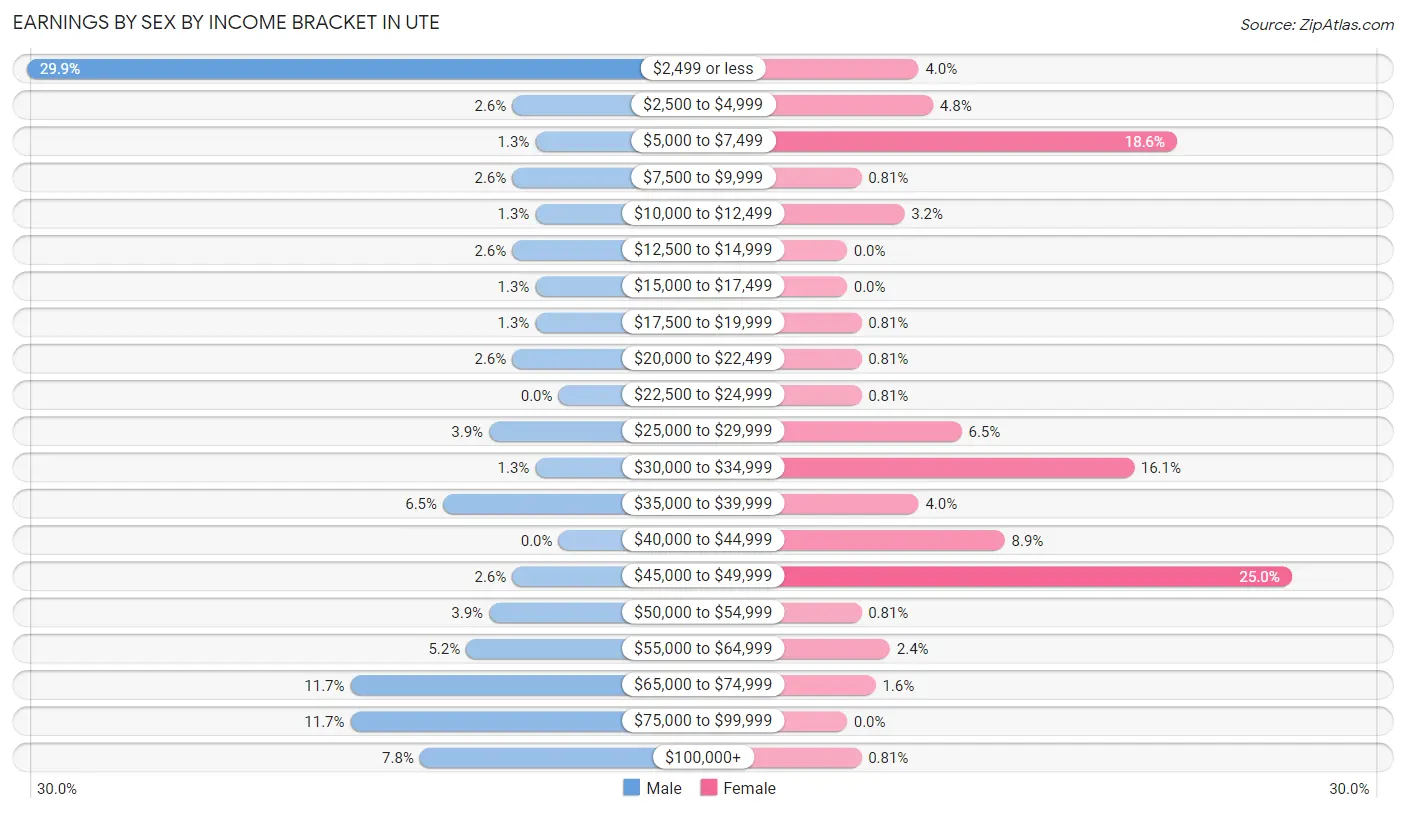
Earnings by Sex by Income Bracket in Ute
The most common earnings brackets in Ute are $2,499 or less for men (23 | 29.9%) and $45,000 to $49,999 for women (31 | 25.0%).
| Income | Male | Female |
| $2,499 or less | 23 (29.9%) | 5 (4.0%) |
| $2,500 to $4,999 | 2 (2.6%) | 6 (4.8%) |
| $5,000 to $7,499 | 1 (1.3%) | 23 (18.5%) |
| $7,500 to $9,999 | 2 (2.6%) | 1 (0.8%) |
| $10,000 to $12,499 | 1 (1.3%) | 4 (3.2%) |
| $12,500 to $14,999 | 2 (2.6%) | 0 (0.0%) |
| $15,000 to $17,499 | 1 (1.3%) | 0 (0.0%) |
| $17,500 to $19,999 | 1 (1.3%) | 1 (0.8%) |
| $20,000 to $22,499 | 2 (2.6%) | 1 (0.8%) |
| $22,500 to $24,999 | 0 (0.0%) | 1 (0.8%) |
| $25,000 to $29,999 | 3 (3.9%) | 8 (6.5%) |
| $30,000 to $34,999 | 1 (1.3%) | 20 (16.1%) |
| $35,000 to $39,999 | 5 (6.5%) | 5 (4.0%) |
| $40,000 to $44,999 | 0 (0.0%) | 11 (8.9%) |
| $45,000 to $49,999 | 2 (2.6%) | 31 (25.0%) |
| $50,000 to $54,999 | 3 (3.9%) | 1 (0.8%) |
| $55,000 to $64,999 | 4 (5.2%) | 3 (2.4%) |
| $65,000 to $74,999 | 9 (11.7%) | 2 (1.6%) |
| $75,000 to $99,999 | 9 (11.7%) | 0 (0.0%) |
| $100,000+ | 6 (7.8%) | 1 (0.8%) |
| Total | 77 (100.0%) | 124 (100.0%) |
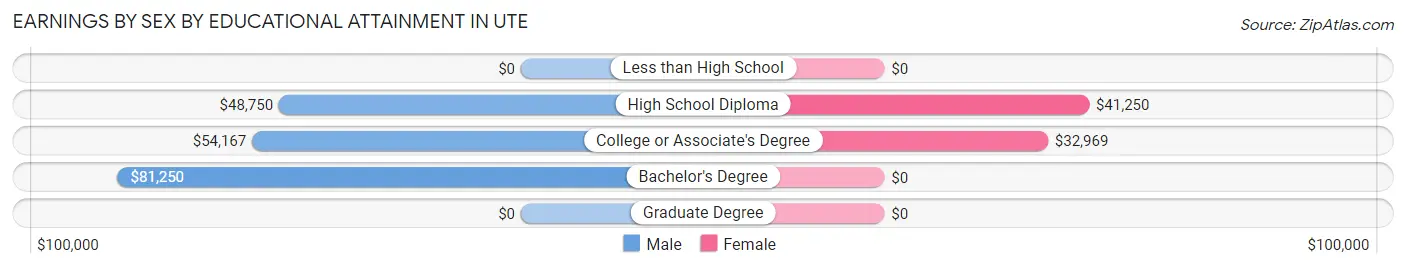
Earnings by Sex by Educational Attainment in Ute
Average earnings in Ute are $55,833 for men and $34,844 for women, a difference of 37.6%. Men with an educational attainment of bachelor's degree enjoy the highest average annual earnings of $81,250, while those with high school diploma education earn the least with $48,750. Women with an educational attainment of high school diploma earn the most with the average annual earnings of $41,250, while those with college or associate's degree education have the smallest earnings of $32,969.
| Educational Attainment | Male Income | Female Income |
| Less than High School | - | - |
| High School Diploma | $48,750 | $41,250 |
| College or Associate's Degree | $54,167 | $32,969 |
| Bachelor's Degree | $81,250 | $0 |
| Graduate Degree | - | - |
| Total | $55,833 | $34,844 |
Family Income in Ute
Family Income Brackets in Ute
According to the Ute family income data, there are 40 families falling into the $50,000 to $74,999 income range, which is the most common income bracket and makes up 48.2% of all families.
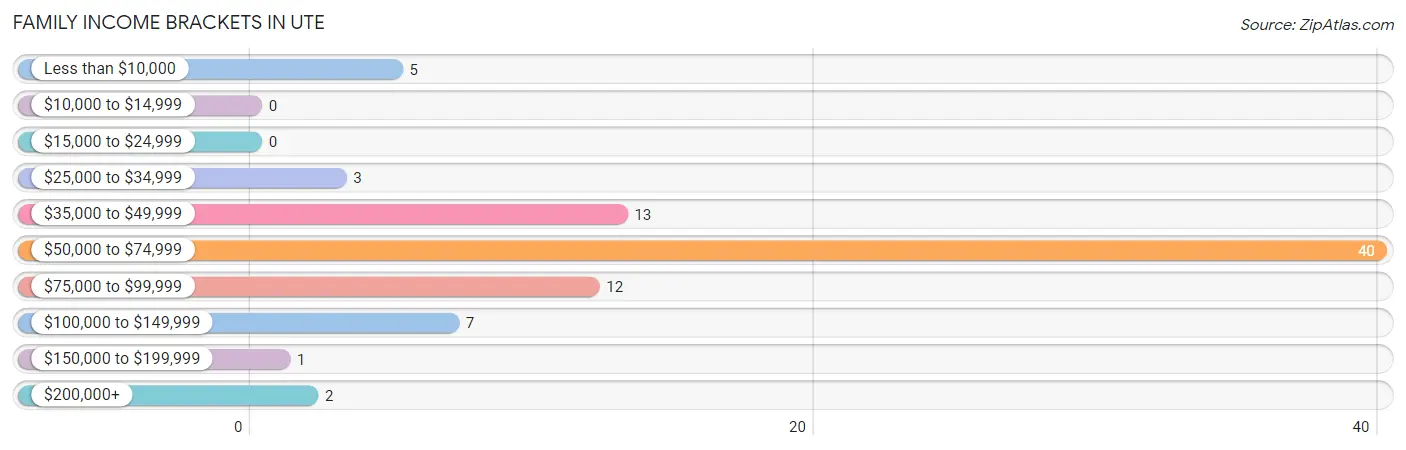
| Income Bracket | # Families | % Families |
| Less than $10,000 | 5 | 6.0% |
| $10,000 to $14,999 | 0 | 0.0% |
| $15,000 to $24,999 | 0 | 0.0% |
| $25,000 to $34,999 | 3 | 3.6% |
| $35,000 to $49,999 | 13 | 15.7% |
| $50,000 to $74,999 | 40 | 48.2% |
| $75,000 to $99,999 | 12 | 14.5% |
| $100,000 to $149,999 | 7 | 8.4% |
| $150,000 to $199,999 | 1 | 1.2% |
| $200,000+ | 2 | 2.4% |
Family Income by Famaliy Size in Ute
5-person families (14 | 16.9%) account for the highest median family income in Ute with $76,667 per family, while 2-person families (59 | 71.1%) have the highest median income of $25,675 per family member.
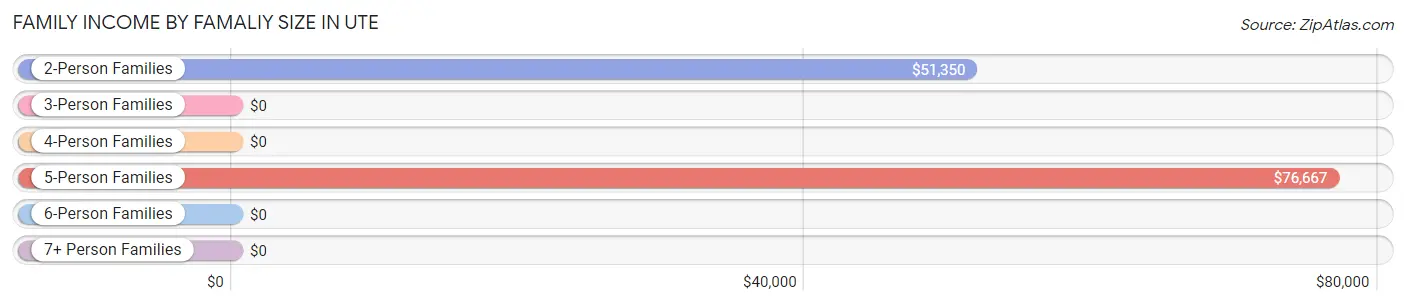
| Income Bracket | # Families | Median Income |
| 2-Person Families | 59 (71.1%) | $51,350 |
| 3-Person Families | 5 (6.0%) | $0 |
| 4-Person Families | 2 (2.4%) | $0 |
| 5-Person Families | 14 (16.9%) | $76,667 |
| 6-Person Families | 3 (3.6%) | $0 |
| 7+ Person Families | 0 (0.0%) | $0 |
| Total | 83 (100.0%) | $52,050 |
Family Income by Number of Earners in Ute
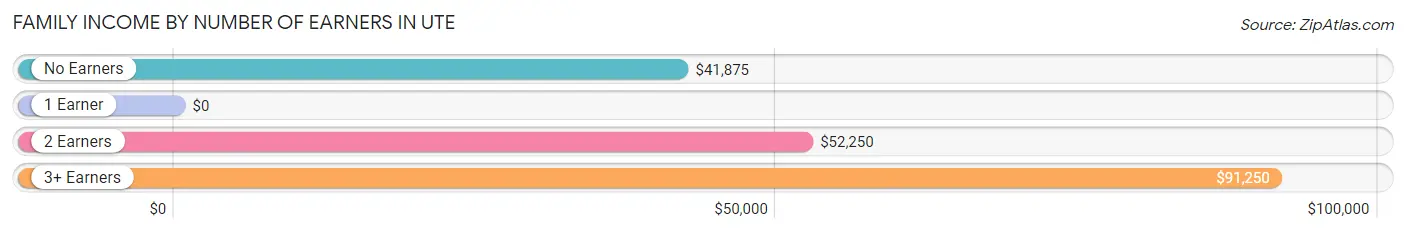
| Number of Earners | # Families | Median Income |
| No Earners | 17 (20.5%) | $41,875 |
| 1 Earner | 12 (14.5%) | $0 |
| 2 Earners | 45 (54.2%) | $52,250 |
| 3+ Earners | 9 (10.8%) | $91,250 |
| Total | 83 (100.0%) | $52,050 |
Household Income in Ute
Household Income Brackets in Ute
With 53 households falling in the category, the $50,000 to $74,999 income range is the most frequent in Ute, accounting for 30.5% of all households.
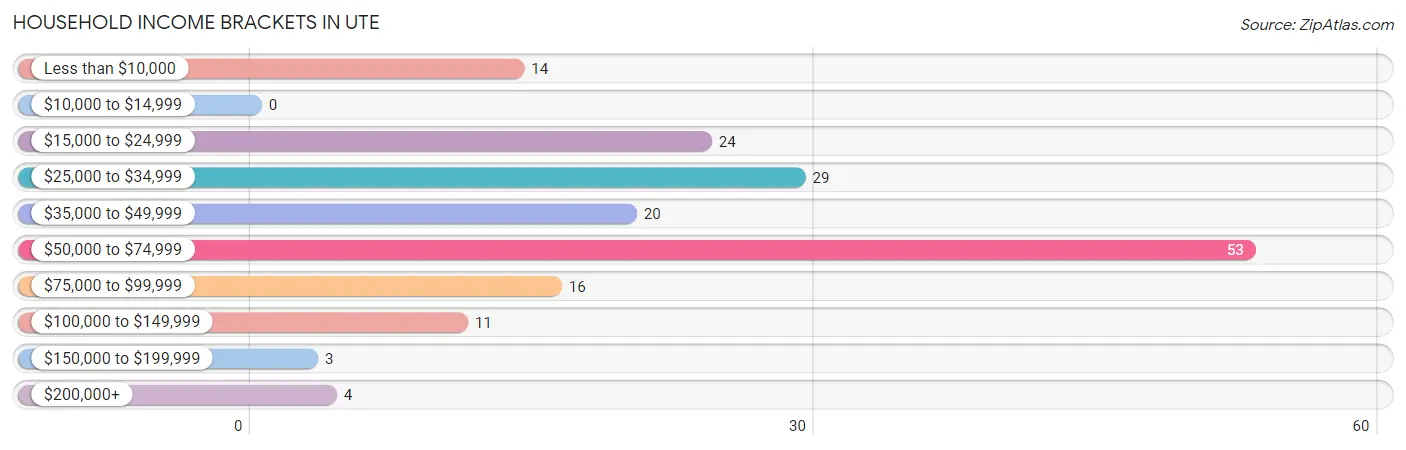
| Income Bracket | # Households | % Households |
| Less than $10,000 | 14 | 8.0% |
| $10,000 to $14,999 | 0 | 0.0% |
| $15,000 to $24,999 | 24 | 13.8% |
| $25,000 to $34,999 | 29 | 16.7% |
| $35,000 to $49,999 | 20 | 11.5% |
| $50,000 to $74,999 | 53 | 30.5% |
| $75,000 to $99,999 | 16 | 9.2% |
| $100,000 to $149,999 | 11 | 6.3% |
| $150,000 to $199,999 | 3 | 1.7% |
| $200,000+ | 4 | 2.3% |
Household Income by Householder Age in Ute
The median household income in Ute is $51,250, with the highest median household income of $56,667 found in the 25 to 44 years age bracket for the primary householder. A total of 50 households (28.7%) fall into this category. Meanwhile, the 15 to 24 years age bracket for the primary householder has the lowest median household income of $0, with 7 households (4.0%) in this group.
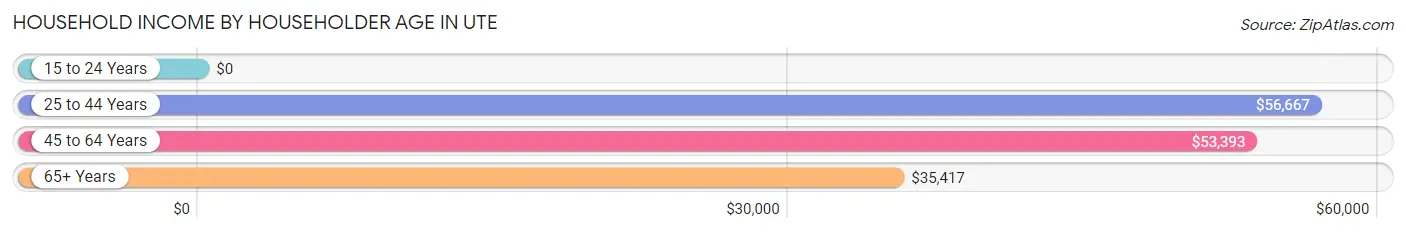
| Income Bracket | # Households | Median Income |
| 15 to 24 Years | 7 (4.0%) | $0 |
| 25 to 44 Years | 50 (28.7%) | $56,667 |
| 45 to 64 Years | 64 (36.8%) | $53,393 |
| 65+ Years | 53 (30.5%) | $35,417 |
| Total | 174 (100.0%) | $51,250 |
Poverty in Ute
Income Below Poverty by Sex and Age in Ute
With 24.8% poverty level for males and 8.4% for females among the residents of Ute, 5 year old males and 18 to 24 year old females are the most vulnerable to poverty, with 1 males (100.0%) and 4 females (40.0%) in their respective age groups living below the poverty level.
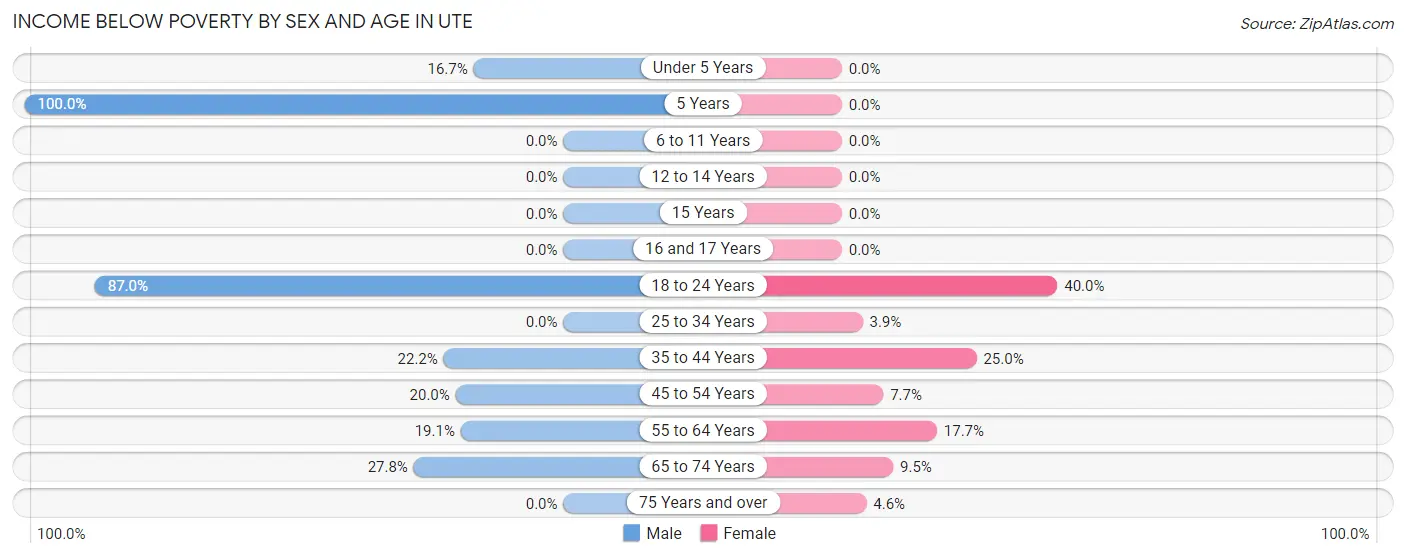
| Age Bracket | Male | Female |
| Under 5 Years | 1 (16.7%) | 0 (0.0%) |
| 5 Years | 1 (100.0%) | 0 (0.0%) |
| 6 to 11 Years | 0 (0.0%) | 0 (0.0%) |
| 12 to 14 Years | 0 (0.0%) | 0 (0.0%) |
| 15 Years | 0 (0.0%) | 0 (0.0%) |
| 16 and 17 Years | 0 (0.0%) | 0 (0.0%) |
| 18 to 24 Years | 20 (87.0%) | 4 (40.0%) |
| 25 to 34 Years | 0 (0.0%) | 2 (3.8%) |
| 35 to 44 Years | 2 (22.2%) | 1 (25.0%) |
| 45 to 54 Years | 2 (20.0%) | 3 (7.7%) |
| 55 to 64 Years | 4 (19.1%) | 3 (17.6%) |
| 65 to 74 Years | 5 (27.8%) | 2 (9.5%) |
| 75 Years and over | 0 (0.0%) | 1 (4.5%) |
| Total | 35 (24.8%) | 16 (8.4%) |
Income Above Poverty by Sex and Age in Ute
According to the poverty statistics in Ute, males aged 6 to 11 years and females aged under 5 years are the age groups that are most secure financially, with 100.0% of males and 100.0% of females in these age groups living above the poverty line.
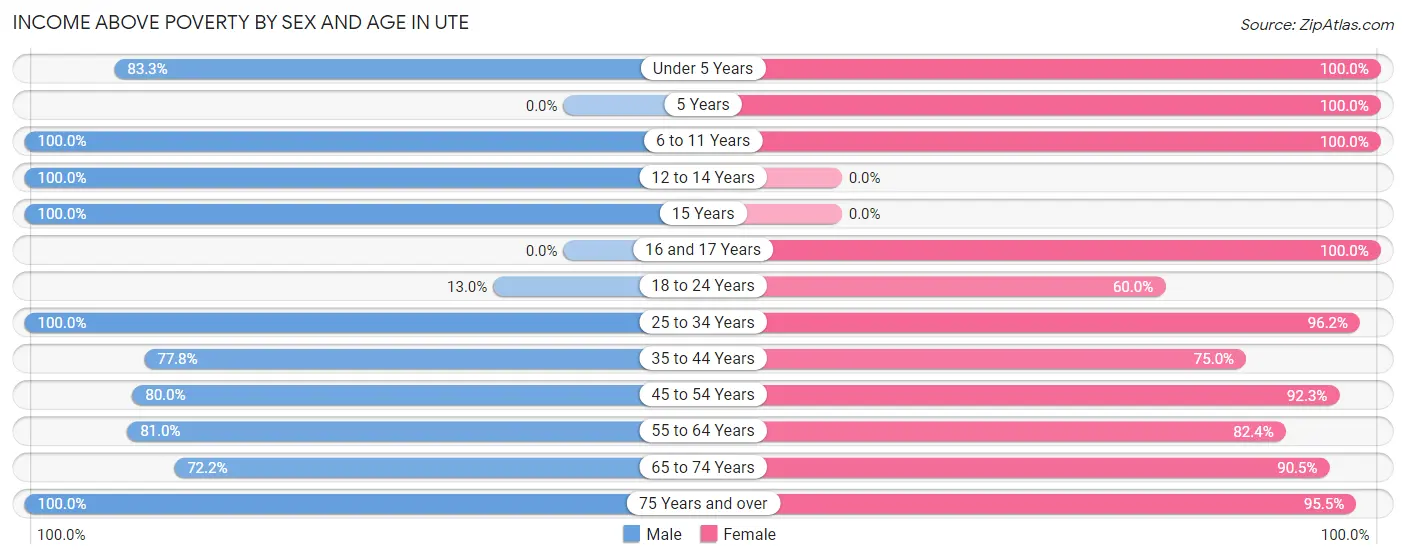
| Age Bracket | Male | Female |
| Under 5 Years | 5 (83.3%) | 5 (100.0%) |
| 5 Years | 0 (0.0%) | 5 (100.0%) |
| 6 to 11 Years | 21 (100.0%) | 10 (100.0%) |
| 12 to 14 Years | 2 (100.0%) | 0 (0.0%) |
| 15 Years | 1 (100.0%) | 0 (0.0%) |
| 16 and 17 Years | 0 (0.0%) | 5 (100.0%) |
| 18 to 24 Years | 3 (13.0%) | 6 (60.0%) |
| 25 to 34 Years | 16 (100.0%) | 50 (96.2%) |
| 35 to 44 Years | 7 (77.8%) | 3 (75.0%) |
| 45 to 54 Years | 8 (80.0%) | 36 (92.3%) |
| 55 to 64 Years | 17 (80.9%) | 14 (82.4%) |
| 65 to 74 Years | 13 (72.2%) | 19 (90.5%) |
| 75 Years and over | 13 (100.0%) | 21 (95.5%) |
| Total | 106 (75.2%) | 174 (91.6%) |
Income Below Poverty Among Married-Couple Families in Ute
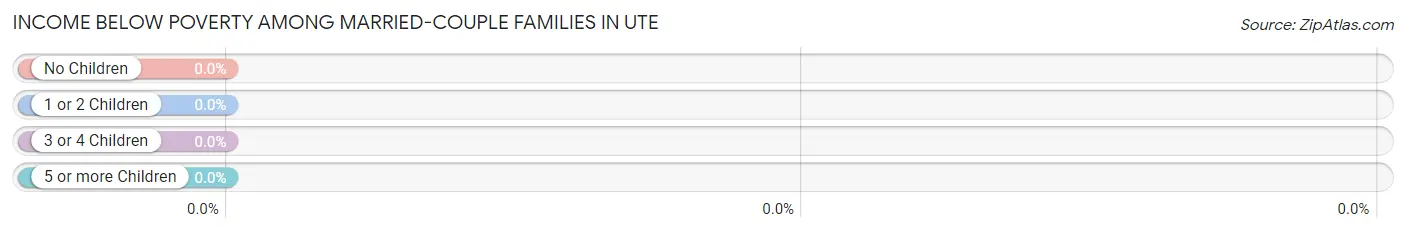
| Children | Above Poverty | Below Poverty |
| No Children | 30 (100.0%) | 0 (0.0%) |
| 1 or 2 Children | 2 (100.0%) | 0 (0.0%) |
| 3 or 4 Children | 10 (100.0%) | 0 (0.0%) |
| 5 or more Children | 0 (0.0%) | 0 (0.0%) |
| Total | 42 (100.0%) | 0 (0.0%) |
Income Below Poverty Among Single-Parent Households in Ute
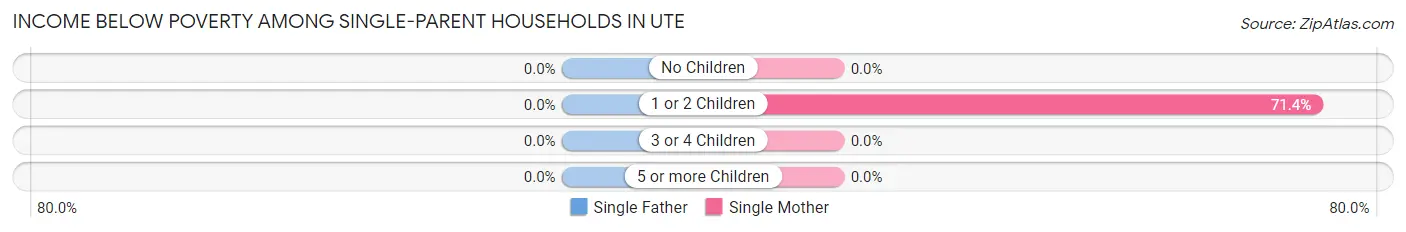
| Children | Single Father | Single Mother |
| No Children | 0 (0.0%) | 0 (0.0%) |
| 1 or 2 Children | 0 (0.0%) | 5 (71.4%) |
| 3 or 4 Children | 0 (0.0%) | 0 (0.0%) |
| 5 or more Children | 0 (0.0%) | 0 (0.0%) |
| Total | 0 (0.0%) | 5 (13.5%) |
Income Below Poverty Among Married-Couple vs Single-Parent Households in Ute
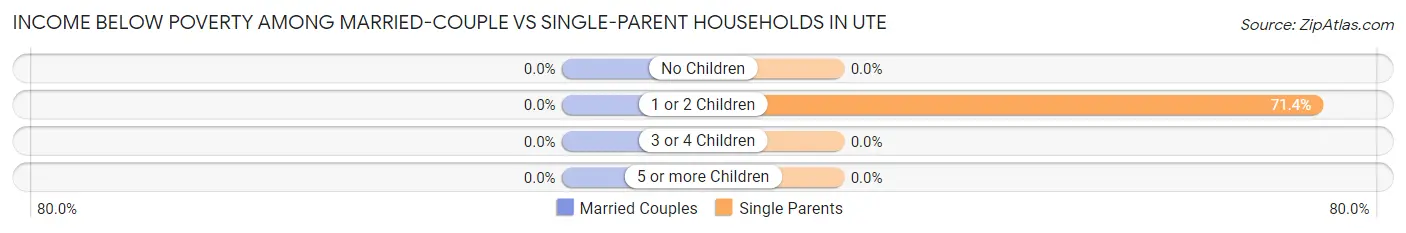
| Children | Married-Couple Families | Single-Parent Households |
| No Children | 0 (0.0%) | 0 (0.0%) |
| 1 or 2 Children | 0 (0.0%) | 5 (71.4%) |
| 3 or 4 Children | 0 (0.0%) | 0 (0.0%) |
| 5 or more Children | 0 (0.0%) | 0 (0.0%) |
| Total | 0 (0.0%) | 5 (12.2%) |
Race in Ute
The most populous races in Ute are White / Caucasian (330 | 99.7%), Hispanic or Latino (4 | 1.2%), and Two or more Races (1 | 0.3%).
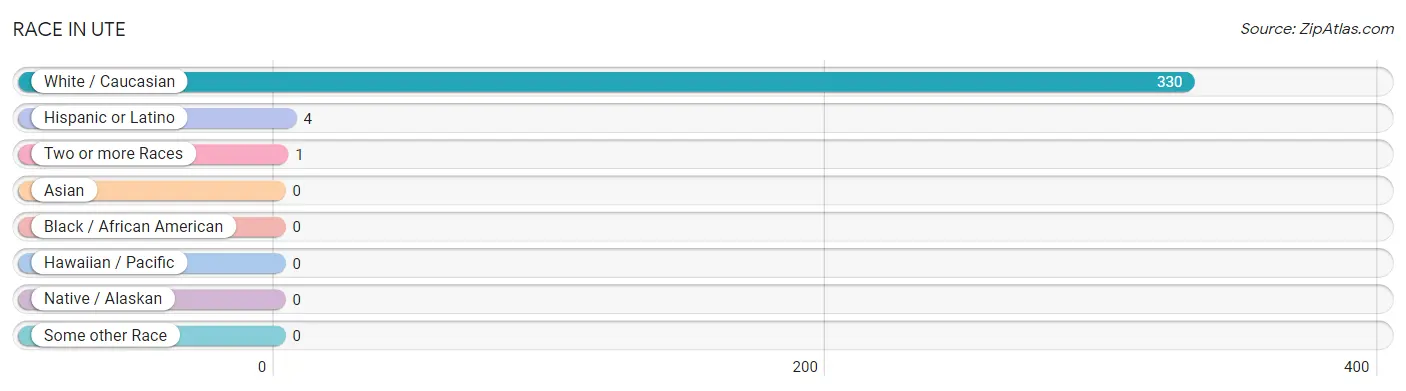
| Race | # Population | % Population |
| Asian | 0 | 0.0% |
| Black / African American | 0 | 0.0% |
| Hawaiian / Pacific | 0 | 0.0% |
| Hispanic or Latino | 4 | 1.2% |
| Native / Alaskan | 0 | 0.0% |
| White / Caucasian | 330 | 99.7% |
| Two or more Races | 1 | 0.3% |
| Some other Race | 0 | 0.0% |
| Total | 331 | 100.0% |
Ancestry in Ute
The most populous ancestries reported in Ute are German (148 | 44.7%), Irish (44 | 13.3%), Norwegian (28 | 8.5%), English (22 | 6.7%), and Polish (12 | 3.6%), together accounting for 76.7% of all Ute residents.
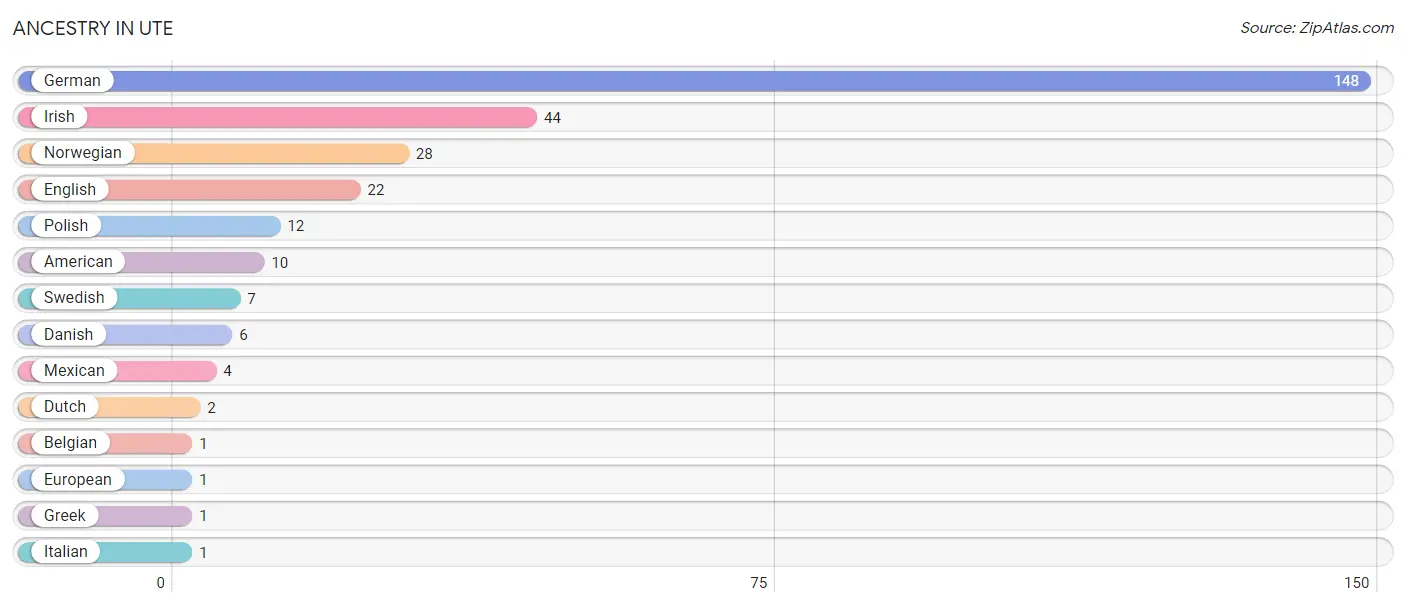
| Ancestry | # Population | % Population |
| American | 10 | 3.0% |
| Belgian | 1 | 0.3% |
| Danish | 6 | 1.8% |
| Dutch | 2 | 0.6% |
| English | 22 | 6.7% |
| European | 1 | 0.3% |
| German | 148 | 44.7% |
| Greek | 1 | 0.3% |
| Irish | 44 | 13.3% |
| Italian | 1 | 0.3% |
| Mexican | 4 | 1.2% |
| Norwegian | 28 | 8.5% |
| Polish | 12 | 3.6% |
| Swedish | 7 | 2.1% | View All 14 Rows |
Immigrants in Ute

| Immigration Origin | # Population | % Population | View All 0 Rows |
Sex and Age in Ute
Sex and Age in Ute
The most populous age groups in Ute are 20 to 24 Years (22 | 15.6%) for men and 25 to 29 Years (35 | 18.4%) for women.
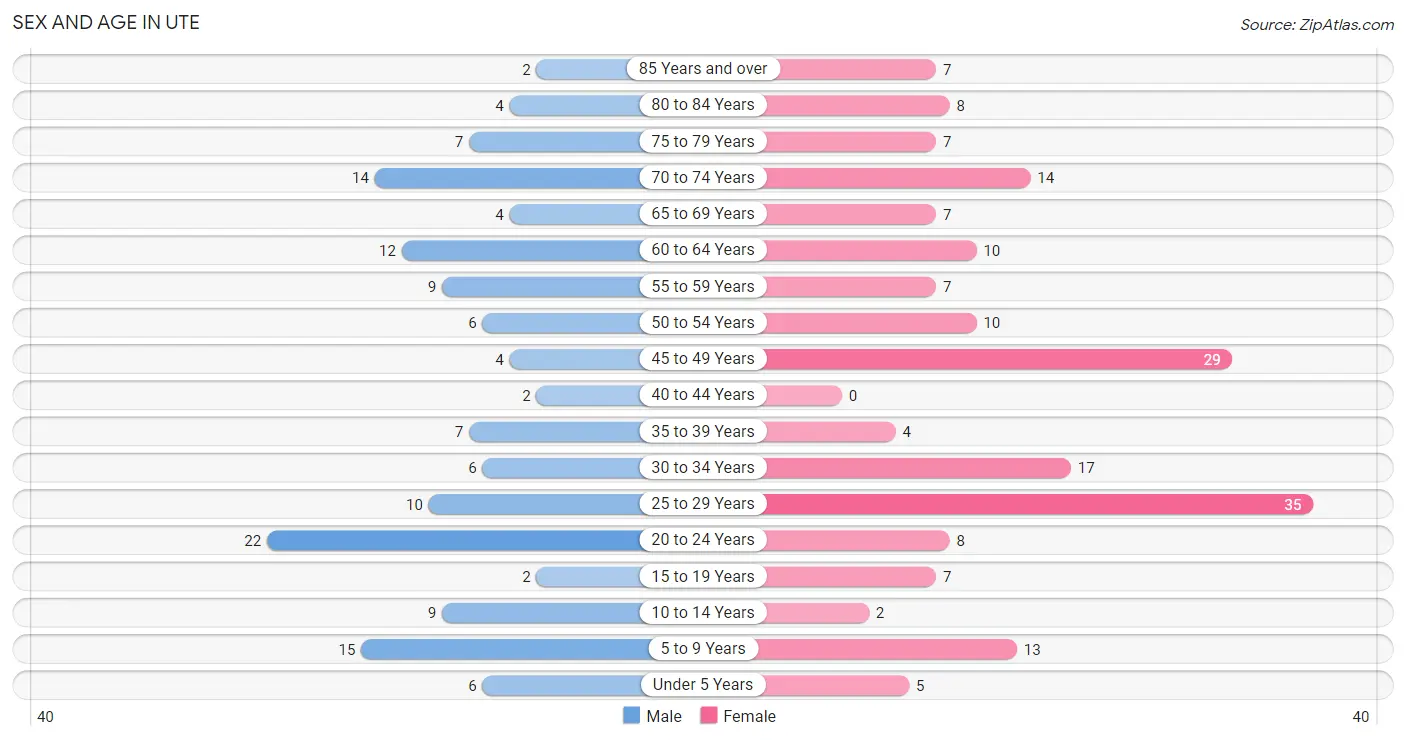
| Age Bracket | Male | Female |
| Under 5 Years | 6 (4.3%) | 5 (2.6%) |
| 5 to 9 Years | 15 (10.6%) | 13 (6.8%) |
| 10 to 14 Years | 9 (6.4%) | 2 (1.1%) |
| 15 to 19 Years | 2 (1.4%) | 7 (3.7%) |
| 20 to 24 Years | 22 (15.6%) | 8 (4.2%) |
| 25 to 29 Years | 10 (7.1%) | 35 (18.4%) |
| 30 to 34 Years | 6 (4.3%) | 17 (8.9%) |
| 35 to 39 Years | 7 (5.0%) | 4 (2.1%) |
| 40 to 44 Years | 2 (1.4%) | 0 (0.0%) |
| 45 to 49 Years | 4 (2.8%) | 29 (15.3%) |
| 50 to 54 Years | 6 (4.3%) | 10 (5.3%) |
| 55 to 59 Years | 9 (6.4%) | 7 (3.7%) |
| 60 to 64 Years | 12 (8.5%) | 10 (5.3%) |
| 65 to 69 Years | 4 (2.8%) | 7 (3.7%) |
| 70 to 74 Years | 14 (9.9%) | 14 (7.4%) |
| 75 to 79 Years | 7 (5.0%) | 7 (3.7%) |
| 80 to 84 Years | 4 (2.8%) | 8 (4.2%) |
| 85 Years and over | 2 (1.4%) | 7 (3.7%) |
| Total | 141 (100.0%) | 190 (100.0%) |
Families and Households in Ute
Median Family Size in Ute
The median family size in Ute is 2.53 persons per family, with single male/father families (4 | 4.8%) accounting for the largest median family size of 3.5 persons per family. On the other hand, single female/mother families (37 | 44.6%) represent the smallest median family size with 2.08 persons per family.
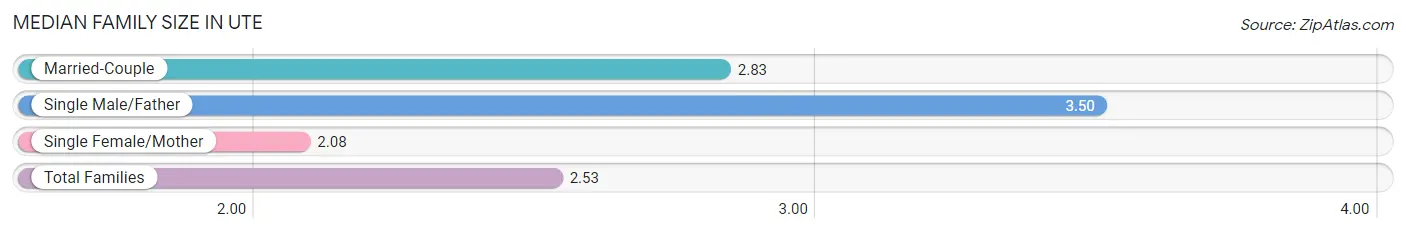
| Family Type | # Families | Family Size |
| Married-Couple | 42 (50.6%) | 2.83 |
| Single Male/Father | 4 (4.8%) | 3.50 |
| Single Female/Mother | 37 (44.6%) | 2.08 |
| Total Families | 83 (100.0%) | 2.53 |
Median Household Size in Ute
The median household size in Ute is 1.90 persons per household, with single male/father households (4 | 2.3%) accounting for the largest median household size of 4 persons per household. non-family households (91 | 52.3%) represent the smallest median household size with 1.07 persons per household.
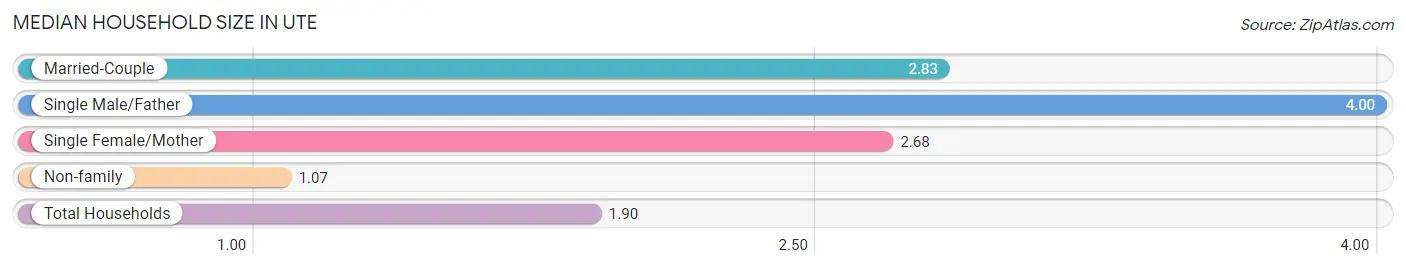
| Household Type | # Households | Household Size |
| Married-Couple | 42 (24.1%) | 2.83 |
| Single Male/Father | 4 (2.3%) | 4.00 |
| Single Female/Mother | 37 (21.3%) | 2.68 |
| Non-family | 91 (52.3%) | 1.07 |
| Total Households | 174 (100.0%) | 1.90 |
Household Size by Marriage Status in Ute
Out of a total of 174 households in Ute, 83 (47.7%) are family households, while 91 (52.3%) are nonfamily households. The most numerous type of family households are 3-person households, comprising 34, and the most common type of nonfamily households are 1-person households, comprising 84.
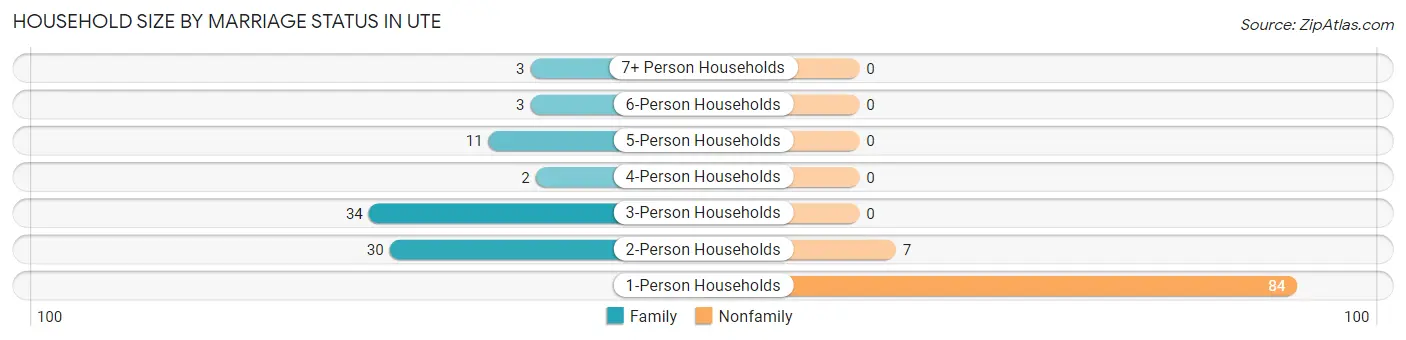
| Household Size | Family Households | Nonfamily Households |
| 1-Person Households | - | 84 (48.3%) |
| 2-Person Households | 30 (17.2%) | 7 (4.0%) |
| 3-Person Households | 34 (19.5%) | 0 (0.0%) |
| 4-Person Households | 2 (1.1%) | 0 (0.0%) |
| 5-Person Households | 11 (6.3%) | 0 (0.0%) |
| 6-Person Households | 3 (1.7%) | 0 (0.0%) |
| 7+ Person Households | 3 (1.7%) | 0 (0.0%) |
| Total | 83 (47.7%) | 91 (52.3%) |
Female Fertility in Ute
Fertility by Age in Ute
Average fertility rate in Ute is 39.0 births per 1,000 women. Women in the age bracket of 20 to 34 years have the highest fertility rate with 67.0 births per 1,000 women. Women in the age bracket of 20 to 34 years acount for 100.0% of all women with births.
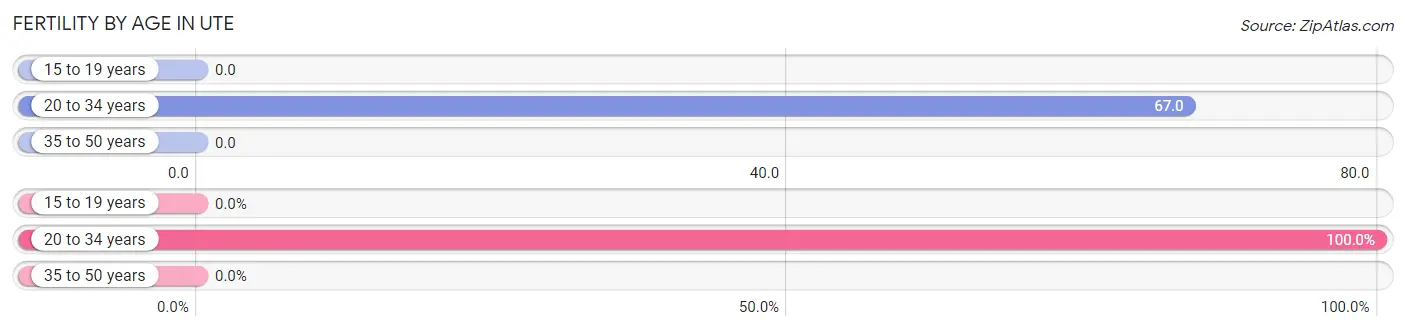
| Age Bracket | Women with Births | Births / 1,000 Women |
| 15 to 19 years | 0 (0.0%) | 0.0 |
| 20 to 34 years | 4 (100.0%) | 67.0 |
| 35 to 50 years | 0 (0.0%) | 0.0 |
| Total | 4 (100.0%) | 39.0 |
Fertility by Age by Marriage Status in Ute
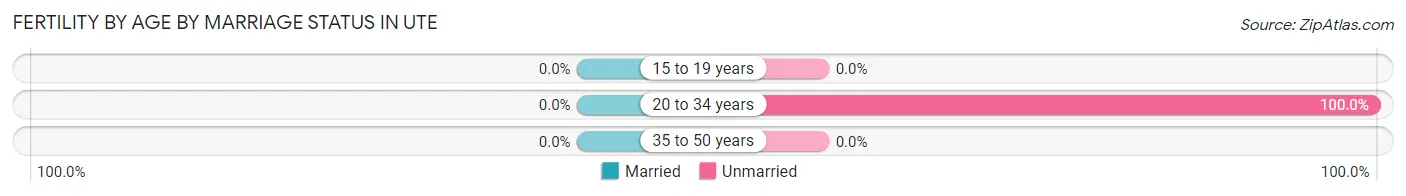
| Age Bracket | Married | Unmarried |
| 15 to 19 years | 0 (0.0%) | 0 (0.0%) |
| 20 to 34 years | 0 (0.0%) | 4 (100.0%) |
| 35 to 50 years | 0 (0.0%) | 0 (0.0%) |
| Total | 0 (0.0%) | 4 (100.0%) |
Fertility by Education in Ute
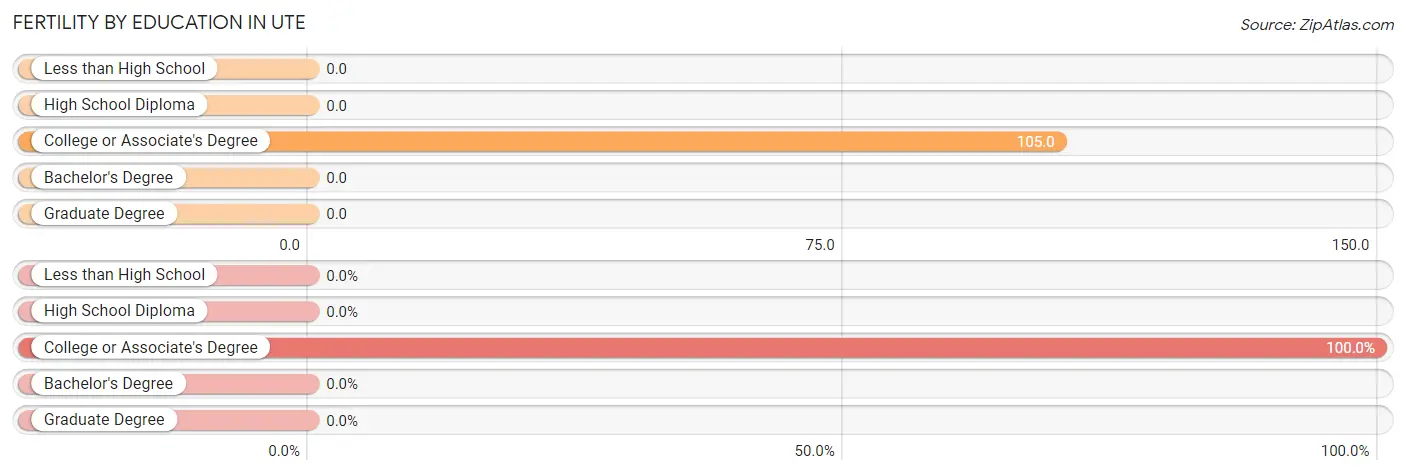
| Educational Attainment | Women with Births | Births / 1,000 Women |
| Less than High School | 0 (0.0%) | 0.0 |
| High School Diploma | 0 (0.0%) | 0.0 |
| College or Associate's Degree | 4 (100.0%) | 105.0 |
| Bachelor's Degree | 0 (0.0%) | 0.0 |
| Graduate Degree | 0 (0.0%) | 0.0 |
| Total | 4 (100.0%) | 39.0 |
Fertility by Education by Marriage Status in Ute
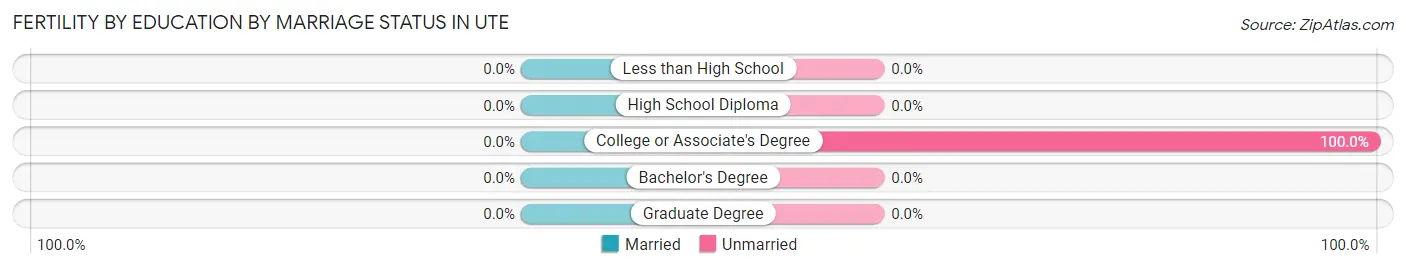
| Educational Attainment | Married | Unmarried |
| Less than High School | 0 (0.0%) | 0 (0.0%) |
| High School Diploma | 0 (0.0%) | 0 (0.0%) |
| College or Associate's Degree | 0 (0.0%) | 4 (100.0%) |
| Bachelor's Degree | 0 (0.0%) | 0 (0.0%) |
| Graduate Degree | 0 (0.0%) | 0 (0.0%) |
| Total | 0 (0.0%) | 4 (100.0%) |
Employment Characteristics in Ute
Employment by Class of Employer in Ute
Among the 147 employed individuals in Ute, private company employees (97 | 66.0%), not-for-profit organizations (19 | 12.9%), and self-employed (not incorporated) (9 | 6.1%) make up the most common classes of employment.
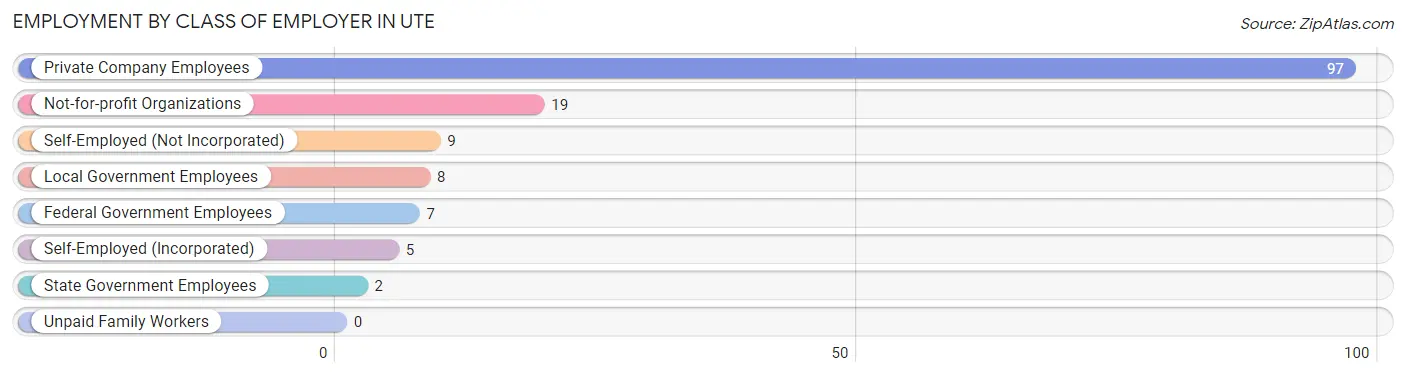
| Employer Class | # Employees | % Employees |
| Private Company Employees | 97 | 66.0% |
| Self-Employed (Incorporated) | 5 | 3.4% |
| Self-Employed (Not Incorporated) | 9 | 6.1% |
| Not-for-profit Organizations | 19 | 12.9% |
| Local Government Employees | 8 | 5.4% |
| State Government Employees | 2 | 1.4% |
| Federal Government Employees | 7 | 4.8% |
| Unpaid Family Workers | 0 | 0.0% |
| Total | 147 | 100.0% |
Employment Status by Age in Ute
According to the labor force statistics for Ute, out of the total population over 16 years of age (280), 60.7% or 170 individuals are in the labor force, with 1.2% or 2 of them unemployed. The age group with the highest labor force participation rate is 16 to 19 years, with 100.0% or 8 individuals in the labor force. Within the labor force, the 55 to 59 years age range has the highest percentage of unemployed individuals, with 16.7% or 2 of them being unemployed.
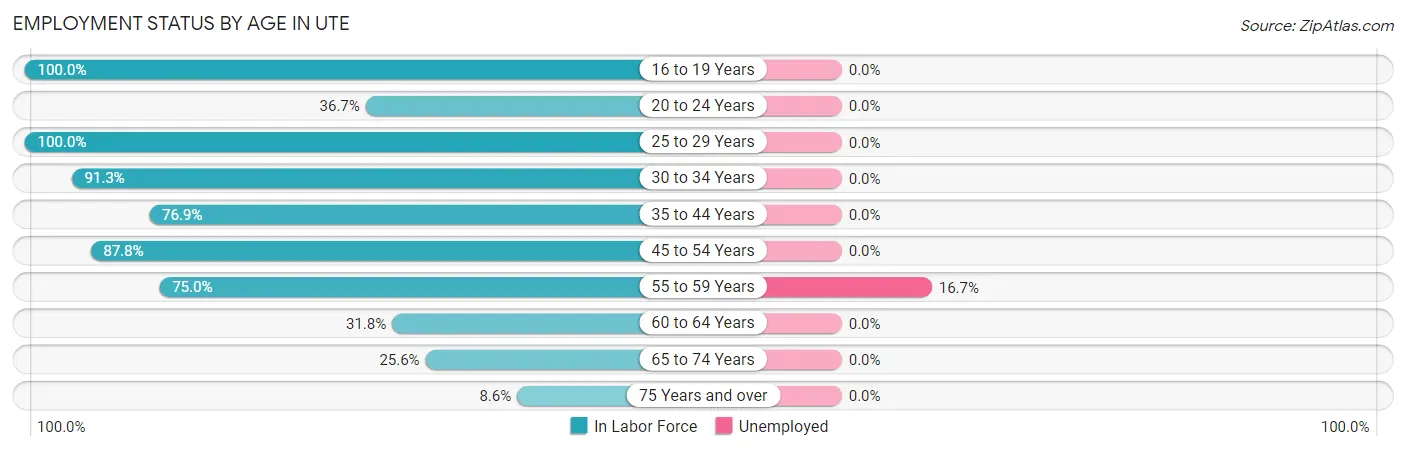
| Age Bracket | In Labor Force | Unemployed |
| 16 to 19 Years | 8 (100.0%) | 0 (0.0%) |
| 20 to 24 Years | 11 (36.7%) | 0 (0.0%) |
| 25 to 29 Years | 45 (100.0%) | 0 (0.0%) |
| 30 to 34 Years | 21 (91.3%) | 0 (0.0%) |
| 35 to 44 Years | 10 (76.9%) | 0 (0.0%) |
| 45 to 54 Years | 43 (87.8%) | 0 (0.0%) |
| 55 to 59 Years | 12 (75.0%) | 2 (16.7%) |
| 60 to 64 Years | 7 (31.8%) | 0 (0.0%) |
| 65 to 74 Years | 10 (25.6%) | 0 (0.0%) |
| 75 Years and over | 3 (8.6%) | 0 (0.0%) |
| Total | 170 (60.7%) | 2 (1.2%) |
Employment Status by Educational Attainment in Ute
According to labor force statistics for Ute, 82.1% of individuals (138) out of the total population between 25 and 64 years of age (168) are in the labor force, with 1.4% or 2 of them being unemployed. The group with the highest labor force participation rate are those with the educational attainment of college / associate degree, with 84.5% or 49 individuals in the labor force. Within the labor force, individuals with high school diploma education have the highest percentage of unemployment, with 2.7% or 2 of them being unemployed.
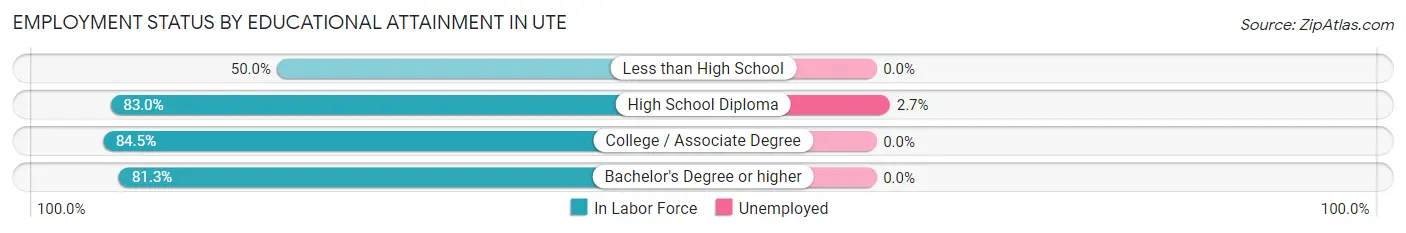
| Educational Attainment | In Labor Force | Unemployed |
| Less than High School | 3 (50.0%) | 0 (0.0%) |
| High School Diploma | 73 (83.0%) | 2 (2.7%) |
| College / Associate Degree | 49 (84.5%) | 0 (0.0%) |
| Bachelor's Degree or higher | 13 (81.3%) | 0 (0.0%) |
| Total | 138 (82.1%) | 2 (1.4%) |
Employment Occupations by Sex in Ute
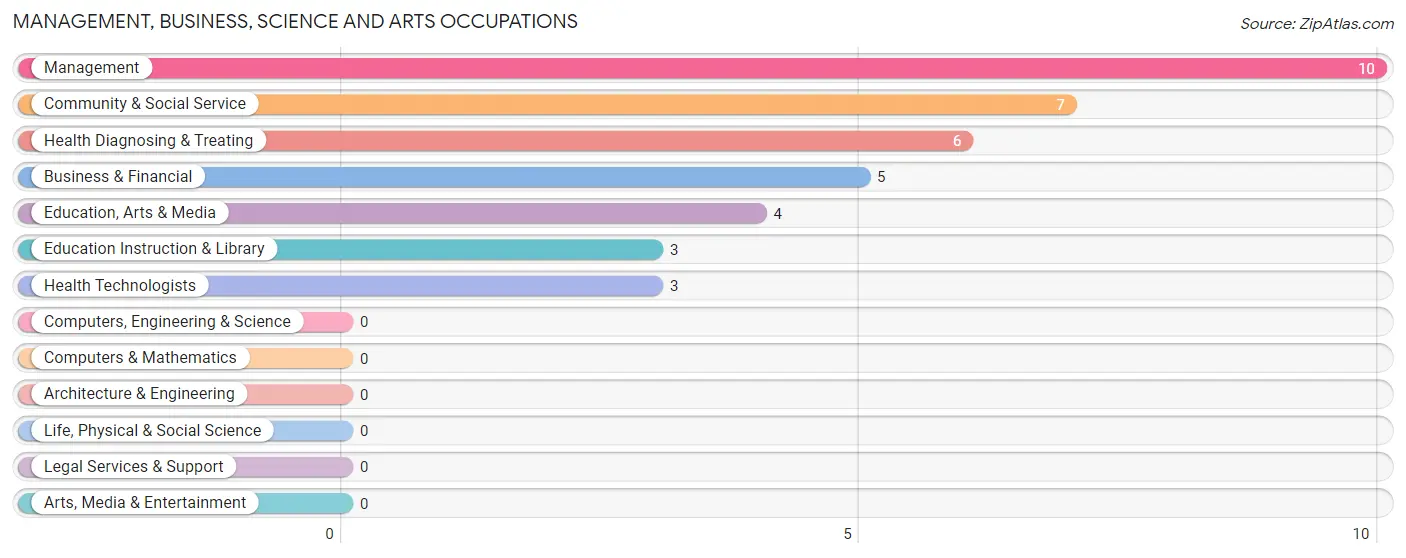
Management, Business, Science and Arts Occupations
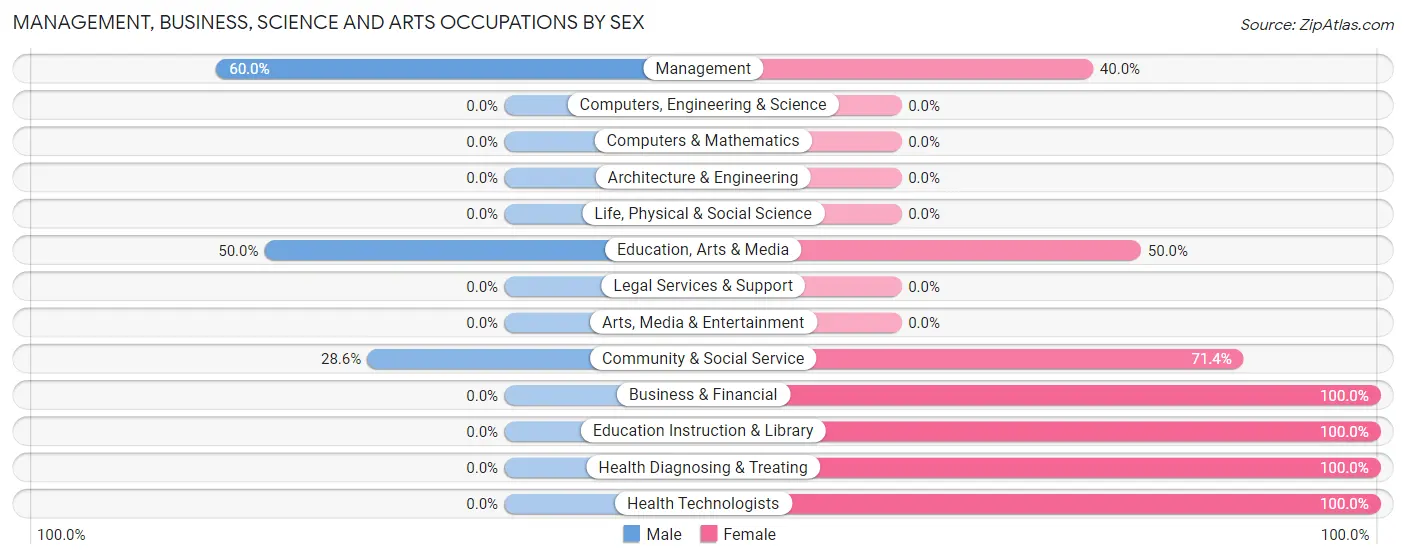
The most common Management, Business, Science and Arts occupations in Ute are Management (10 | 5.9%), Community & Social Service (7 | 4.2%), Health Diagnosing & Treating (6 | 3.6%), Business & Financial (5 | 3.0%), and Education, Arts & Media (4 | 2.4%).
Management, Business, Science and Arts Occupations by Sex
Within the Management, Business, Science and Arts occupations in Ute, the most male-oriented occupations are Management (60.0%), Education, Arts & Media (50.0%), and Community & Social Service (28.6%), while the most female-oriented occupations are Business & Financial (100.0%), Education Instruction & Library (100.0%), and Health Diagnosing & Treating (100.0%).
| Occupation | Male | Female |
| Management | 6 (60.0%) | 4 (40.0%) |
| Business & Financial | 0 (0.0%) | 5 (100.0%) |
| Computers, Engineering & Science | 0 (0.0%) | 0 (0.0%) |
| Computers & Mathematics | 0 (0.0%) | 0 (0.0%) |
| Architecture & Engineering | 0 (0.0%) | 0 (0.0%) |
| Life, Physical & Social Science | 0 (0.0%) | 0 (0.0%) |
| Community & Social Service | 2 (28.6%) | 5 (71.4%) |
| Education, Arts & Media | 2 (50.0%) | 2 (50.0%) |
| Legal Services & Support | 0 (0.0%) | 0 (0.0%) |
| Education Instruction & Library | 0 (0.0%) | 3 (100.0%) |
| Arts, Media & Entertainment | 0 (0.0%) | 0 (0.0%) |
| Health Diagnosing & Treating | 0 (0.0%) | 6 (100.0%) |
| Health Technologists | 0 (0.0%) | 3 (100.0%) |
| Total (Category) | 8 (28.6%) | 20 (71.4%) |
| Total (Overall) | 49 (29.2%) | 119 (70.8%) |
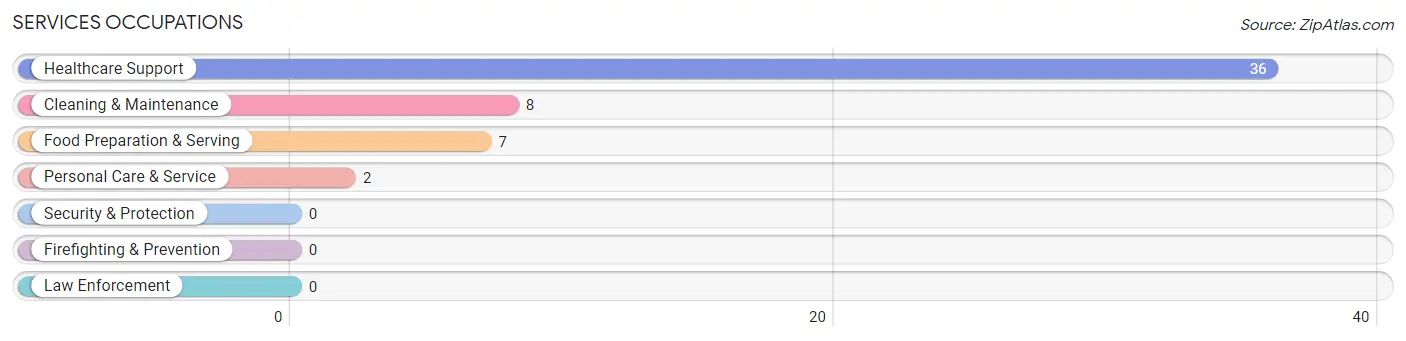
Services Occupations
The most common Services occupations in Ute are Healthcare Support (36 | 21.4%), Cleaning & Maintenance (8 | 4.8%), Food Preparation & Serving (7 | 4.2%), and Personal Care & Service (2 | 1.2%).
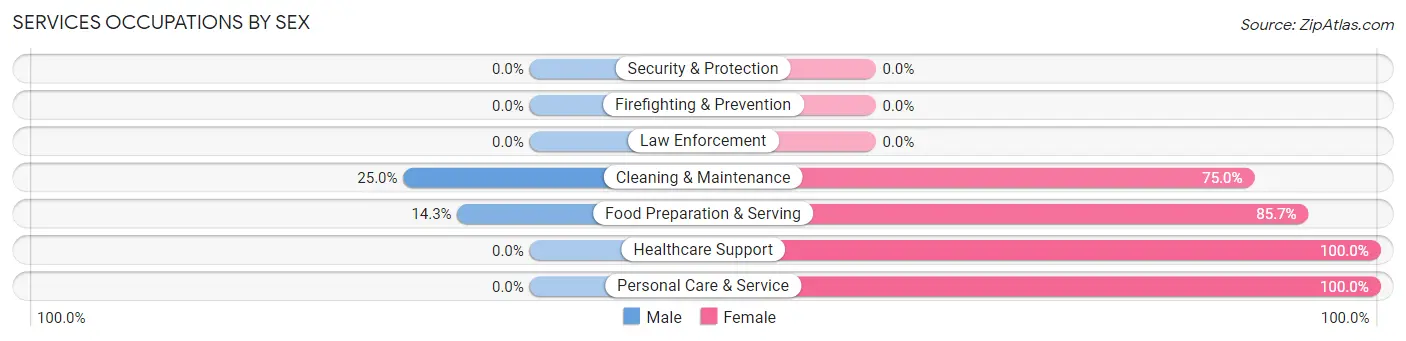
Services Occupations by Sex
Within the Services occupations in Ute, the most male-oriented occupations are Cleaning & Maintenance (25.0%), and Food Preparation & Serving (14.3%), while the most female-oriented occupations are Healthcare Support (100.0%), Personal Care & Service (100.0%), and Food Preparation & Serving (85.7%).
| Occupation | Male | Female |
| Healthcare Support | 0 (0.0%) | 36 (100.0%) |
| Security & Protection | 0 (0.0%) | 0 (0.0%) |
| Firefighting & Prevention | 0 (0.0%) | 0 (0.0%) |
| Law Enforcement | 0 (0.0%) | 0 (0.0%) |
| Food Preparation & Serving | 1 (14.3%) | 6 (85.7%) |
| Cleaning & Maintenance | 2 (25.0%) | 6 (75.0%) |
| Personal Care & Service | 0 (0.0%) | 2 (100.0%) |
| Total (Category) | 3 (5.7%) | 50 (94.3%) |
| Total (Overall) | 49 (29.2%) | 119 (70.8%) |
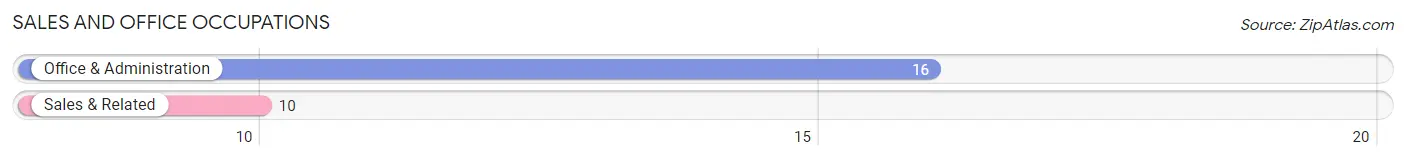
Sales and Office Occupations
The most common Sales and Office occupations in Ute are Office & Administration (16 | 9.5%), and Sales & Related (10 | 5.9%).
Sales and Office Occupations by Sex
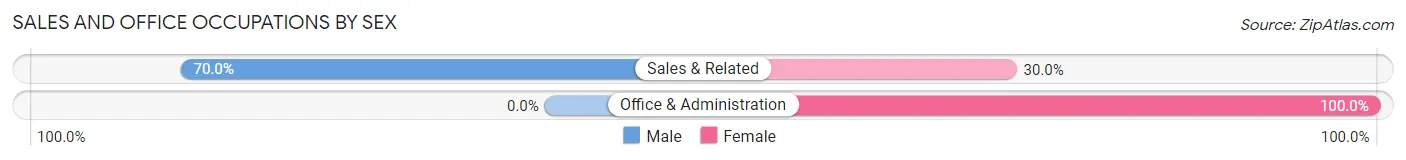
| Occupation | Male | Female |
| Sales & Related | 7 (70.0%) | 3 (30.0%) |
| Office & Administration | 0 (0.0%) | 16 (100.0%) |
| Total (Category) | 7 (26.9%) | 19 (73.1%) |
| Total (Overall) | 49 (29.2%) | 119 (70.8%) |
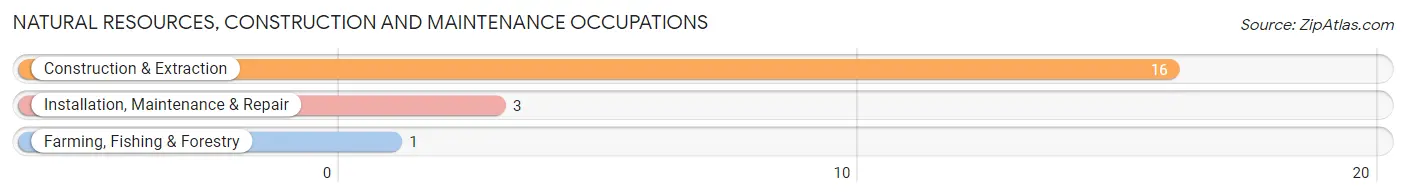
Natural Resources, Construction and Maintenance Occupations
The most common Natural Resources, Construction and Maintenance occupations in Ute are Construction & Extraction (16 | 9.5%), Installation, Maintenance & Repair (3 | 1.8%), and Farming, Fishing & Forestry (1 | 0.6%).
Natural Resources, Construction and Maintenance Occupations by Sex
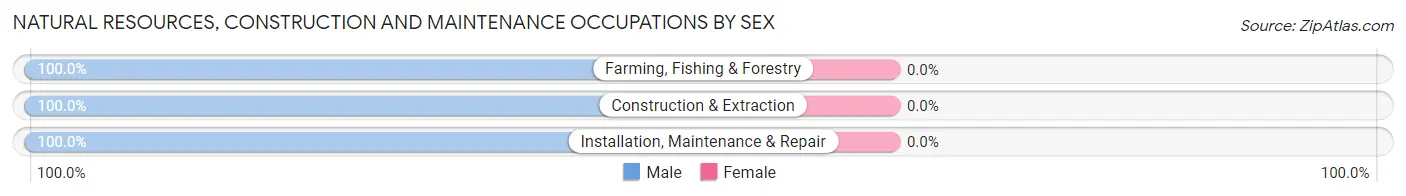
| Occupation | Male | Female |
| Farming, Fishing & Forestry | 1 (100.0%) | 0 (0.0%) |
| Construction & Extraction | 16 (100.0%) | 0 (0.0%) |
| Installation, Maintenance & Repair | 3 (100.0%) | 0 (0.0%) |
| Total (Category) | 20 (100.0%) | 0 (0.0%) |
| Total (Overall) | 49 (29.2%) | 119 (70.8%) |
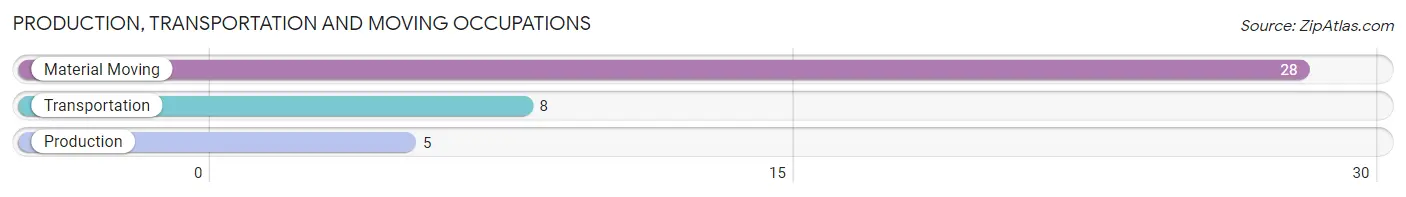
Production, Transportation and Moving Occupations
The most common Production, Transportation and Moving occupations in Ute are Material Moving (28 | 16.7%), Transportation (8 | 4.8%), and Production (5 | 3.0%).
Production, Transportation and Moving Occupations by Sex
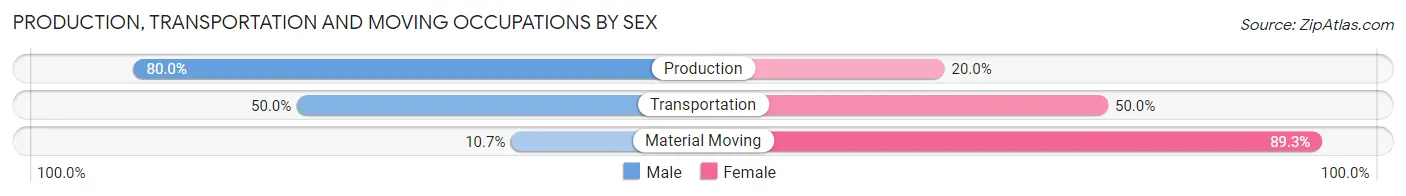
| Occupation | Male | Female |
| Production | 4 (80.0%) | 1 (20.0%) |
| Transportation | 4 (50.0%) | 4 (50.0%) |
| Material Moving | 3 (10.7%) | 25 (89.3%) |
| Total (Category) | 11 (26.8%) | 30 (73.2%) |
| Total (Overall) | 49 (29.2%) | 119 (70.8%) |
Employment Industries by Sex in Ute
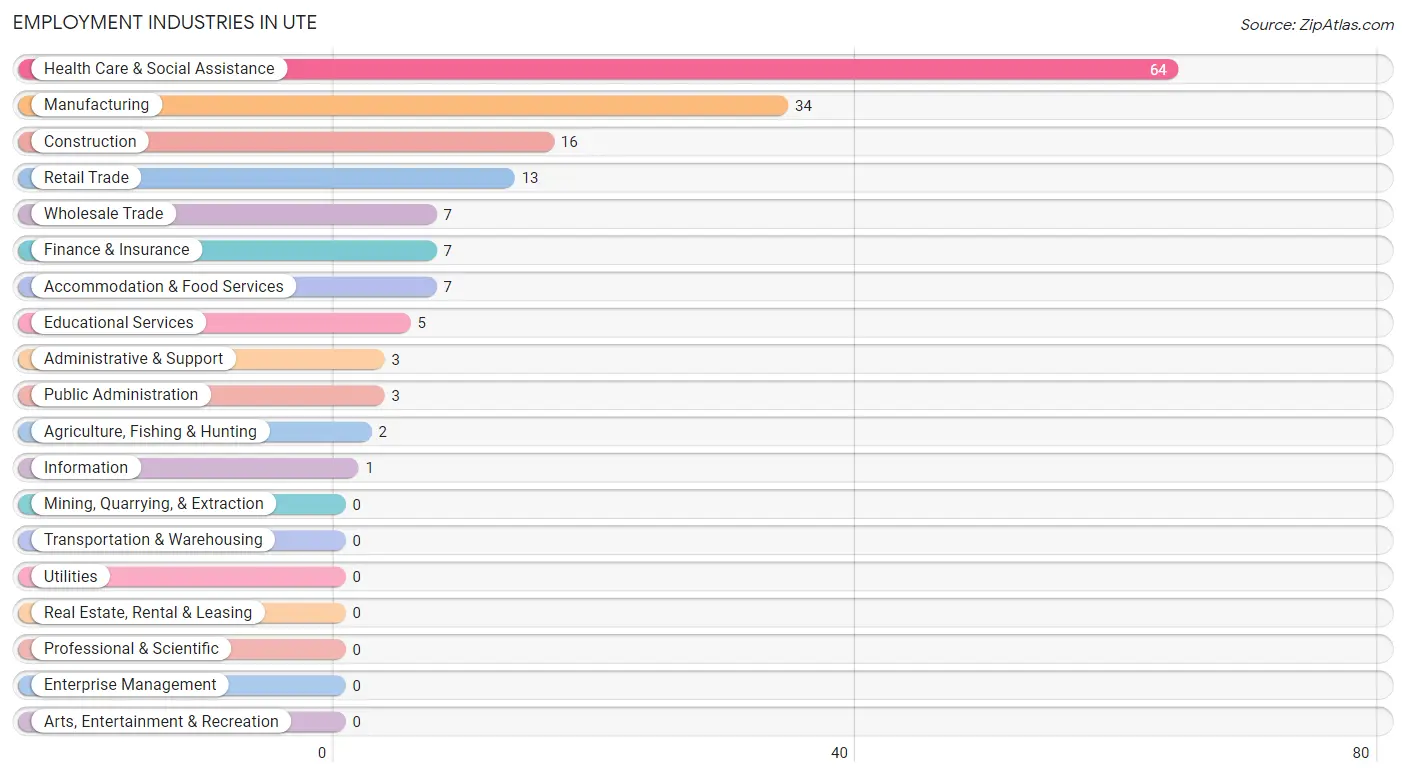
Employment Industries in Ute
The major employment industries in Ute include Health Care & Social Assistance (64 | 38.1%), Manufacturing (34 | 20.2%), Construction (16 | 9.5%), Retail Trade (13 | 7.7%), and Wholesale Trade (7 | 4.2%).
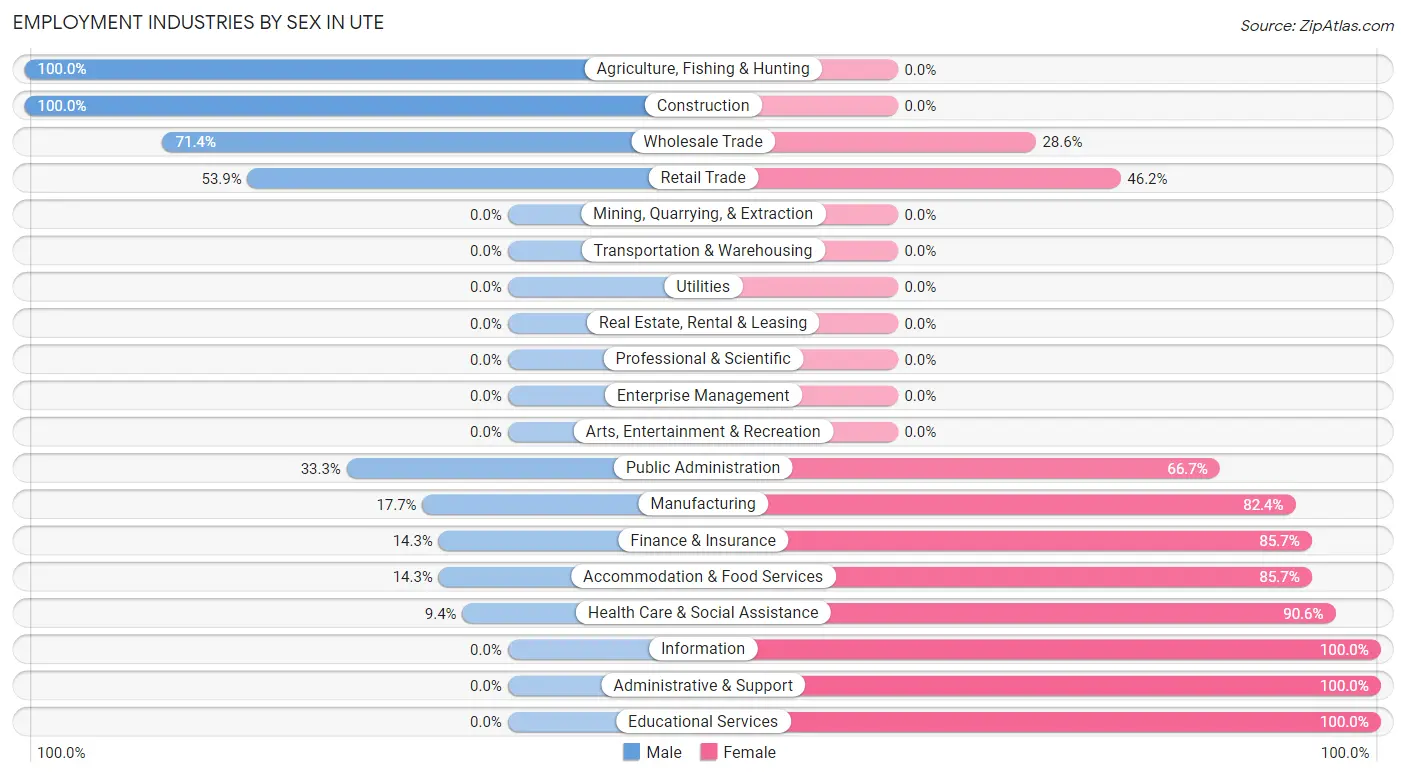
Employment Industries by Sex in Ute
The Ute industries that see more men than women are Agriculture, Fishing & Hunting (100.0%), Construction (100.0%), and Wholesale Trade (71.4%), whereas the industries that tend to have a higher number of women are Information (100.0%), Administrative & Support (100.0%), and Educational Services (100.0%).
| Industry | Male | Female |
| Agriculture, Fishing & Hunting | 2 (100.0%) | 0 (0.0%) |
| Mining, Quarrying, & Extraction | 0 (0.0%) | 0 (0.0%) |
| Construction | 16 (100.0%) | 0 (0.0%) |
| Manufacturing | 6 (17.6%) | 28 (82.4%) |
| Wholesale Trade | 5 (71.4%) | 2 (28.6%) |
| Retail Trade | 7 (53.8%) | 6 (46.2%) |
| Transportation & Warehousing | 0 (0.0%) | 0 (0.0%) |
| Utilities | 0 (0.0%) | 0 (0.0%) |
| Information | 0 (0.0%) | 1 (100.0%) |
| Finance & Insurance | 1 (14.3%) | 6 (85.7%) |
| Real Estate, Rental & Leasing | 0 (0.0%) | 0 (0.0%) |
| Professional & Scientific | 0 (0.0%) | 0 (0.0%) |
| Enterprise Management | 0 (0.0%) | 0 (0.0%) |
| Administrative & Support | 0 (0.0%) | 3 (100.0%) |
| Educational Services | 0 (0.0%) | 5 (100.0%) |
| Health Care & Social Assistance | 6 (9.4%) | 58 (90.6%) |
| Arts, Entertainment & Recreation | 0 (0.0%) | 0 (0.0%) |
| Accommodation & Food Services | 1 (14.3%) | 6 (85.7%) |
| Public Administration | 1 (33.3%) | 2 (66.7%) |
| Total | 49 (29.2%) | 119 (70.8%) |
Education in Ute
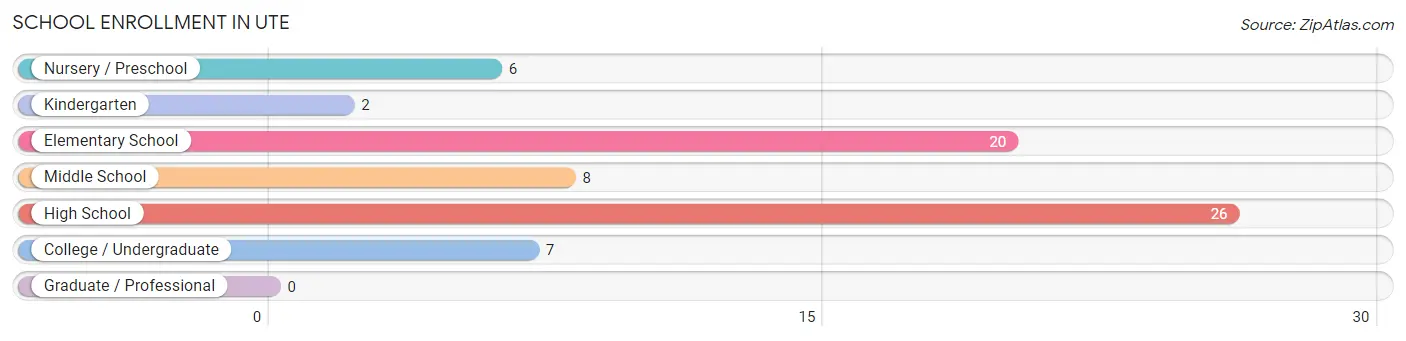
School Enrollment in Ute
The most common levels of schooling among the 69 students in Ute are high school (26 | 37.7%), elementary school (20 | 29.0%), and middle school (8 | 11.6%).
| School Level | # Students | % Students |
| Nursery / Preschool | 6 | 8.7% |
| Kindergarten | 2 | 2.9% |
| Elementary School | 20 | 29.0% |
| Middle School | 8 | 11.6% |
| High School | 26 | 37.7% |
| College / Undergraduate | 7 | 10.1% |
| Graduate / Professional | 0 | 0.0% |
| Total | 69 | 100.0% |
School Enrollment by Age by Funding Source in Ute
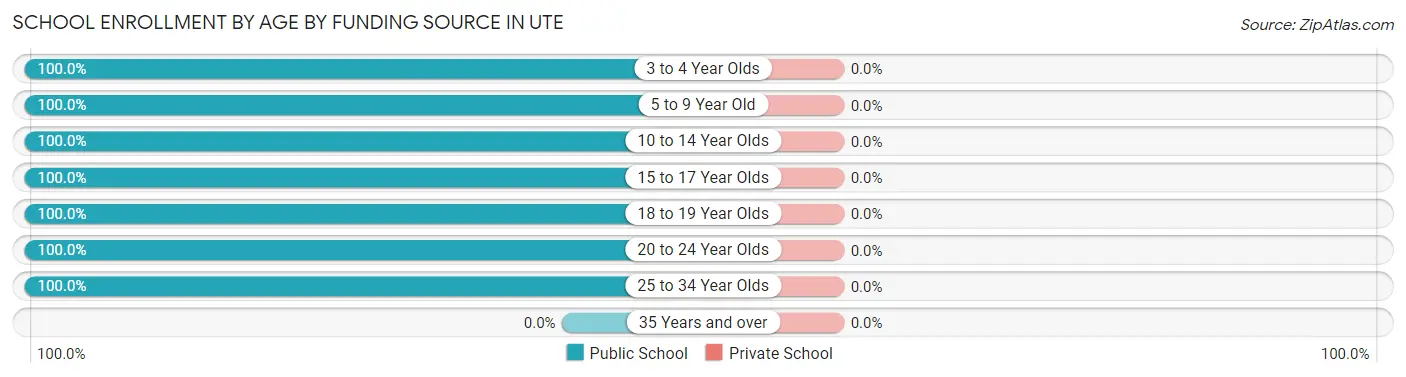
| Age Bracket | Public School | Private School |
| 3 to 4 Year Olds | 2 (100.0%) | 0 (0.0%) |
| 5 to 9 Year Old | 23 (100.0%) | 0 (0.0%) |
| 10 to 14 Year Olds | 11 (100.0%) | 0 (0.0%) |
| 15 to 17 Year Olds | 6 (100.0%) | 0 (0.0%) |
| 18 to 19 Year Olds | 1 (100.0%) | 0 (0.0%) |
| 20 to 24 Year Olds | 23 (100.0%) | 0 (0.0%) |
| 25 to 34 Year Olds | 3 (100.0%) | 0 (0.0%) |
| 35 Years and over | 0 (0.0%) | 0 (0.0%) |
| Total | 69 (100.0%) | 0 (0.0%) |
Educational Attainment by Field of Study in Ute
Bio, nature & agricultural (8 | 29.6%), liberal arts & history (5 | 18.5%), education (4 | 14.8%), literature & languages (4 | 14.8%), and science & technology (3 | 11.1%) are the most common fields of study among 27 individuals in Ute who have obtained a bachelor's degree or higher.
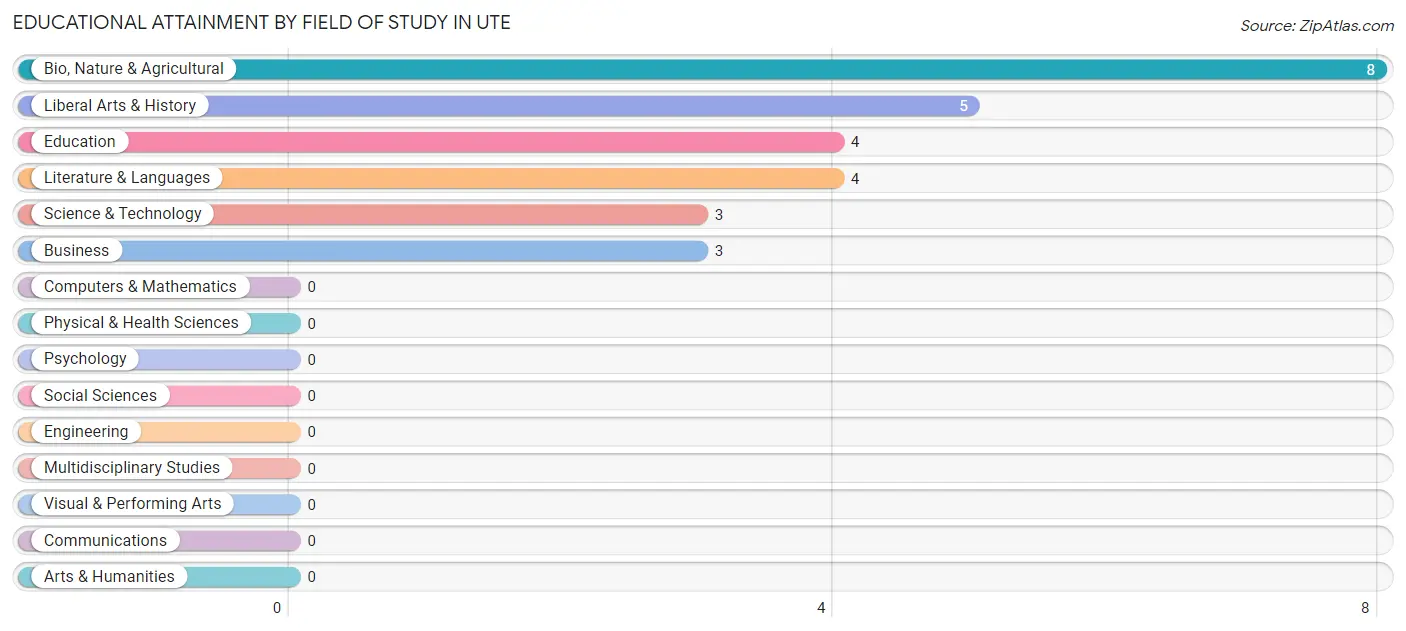
| Field of Study | # Graduates | % Graduates |
| Computers & Mathematics | 0 | 0.0% |
| Bio, Nature & Agricultural | 8 | 29.6% |
| Physical & Health Sciences | 0 | 0.0% |
| Psychology | 0 | 0.0% |
| Social Sciences | 0 | 0.0% |
| Engineering | 0 | 0.0% |
| Multidisciplinary Studies | 0 | 0.0% |
| Science & Technology | 3 | 11.1% |
| Business | 3 | 11.1% |
| Education | 4 | 14.8% |
| Literature & Languages | 4 | 14.8% |
| Liberal Arts & History | 5 | 18.5% |
| Visual & Performing Arts | 0 | 0.0% |
| Communications | 0 | 0.0% |
| Arts & Humanities | 0 | 0.0% |
| Total | 27 | 100.0% |
Transportation & Commute in Ute
Vehicle Availability by Sex in Ute
The most prevalent vehicle ownership categories in Ute are males with 2 vehicles (26, accounting for 53.1%) and females with 2 vehicles (17, making up 26.5%).
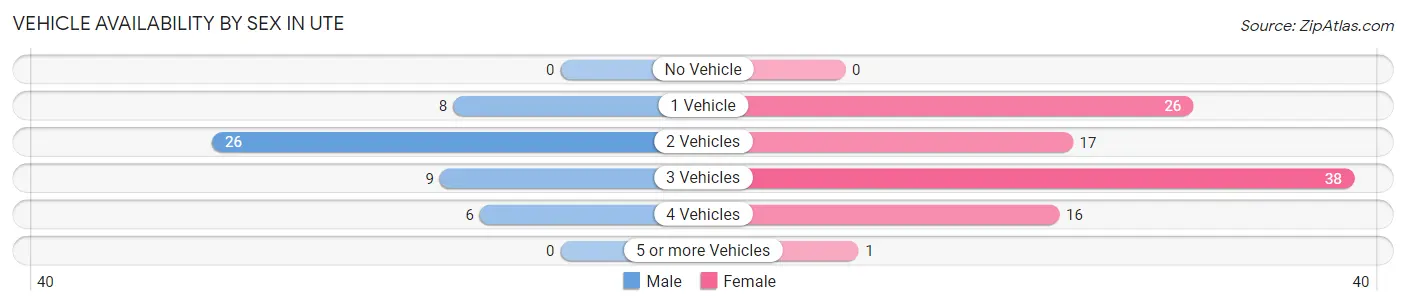
| Vehicles Available | Male | Female |
| No Vehicle | 0 (0.0%) | 0 (0.0%) |
| 1 Vehicle | 8 (16.3%) | 26 (26.5%) |
| 2 Vehicles | 26 (53.1%) | 17 (17.3%) |
| 3 Vehicles | 9 (18.4%) | 38 (38.8%) |
| 4 Vehicles | 6 (12.2%) | 16 (16.3%) |
| 5 or more Vehicles | 0 (0.0%) | 1 (1.0%) |
| Total | 49 (100.0%) | 98 (100.0%) |
Commute Time in Ute
The most frequently occuring commute durations in Ute are 25 to 29 minutes (54 commuters, 38.3%), 30 to 34 minutes (24 commuters, 17.0%), and 20 to 24 minutes (20 commuters, 14.2%).
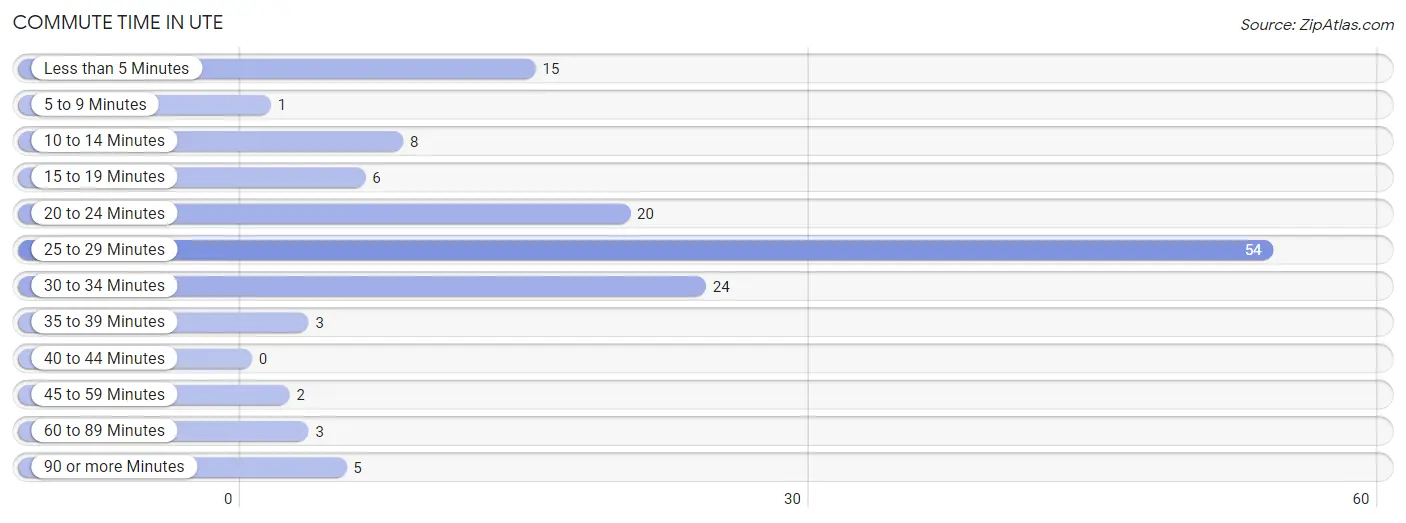
| Commute Time | # Commuters | % Commuters |
| Less than 5 Minutes | 15 | 10.6% |
| 5 to 9 Minutes | 1 | 0.7% |
| 10 to 14 Minutes | 8 | 5.7% |
| 15 to 19 Minutes | 6 | 4.3% |
| 20 to 24 Minutes | 20 | 14.2% |
| 25 to 29 Minutes | 54 | 38.3% |
| 30 to 34 Minutes | 24 | 17.0% |
| 35 to 39 Minutes | 3 | 2.1% |
| 40 to 44 Minutes | 0 | 0.0% |
| 45 to 59 Minutes | 2 | 1.4% |
| 60 to 89 Minutes | 3 | 2.1% |
| 90 or more Minutes | 5 | 3.5% |
Commute Time by Sex in Ute
The most common commute times in Ute are 25 to 29 minutes (9 commuters, 19.6%) for males and 25 to 29 minutes (45 commuters, 47.4%) for females.
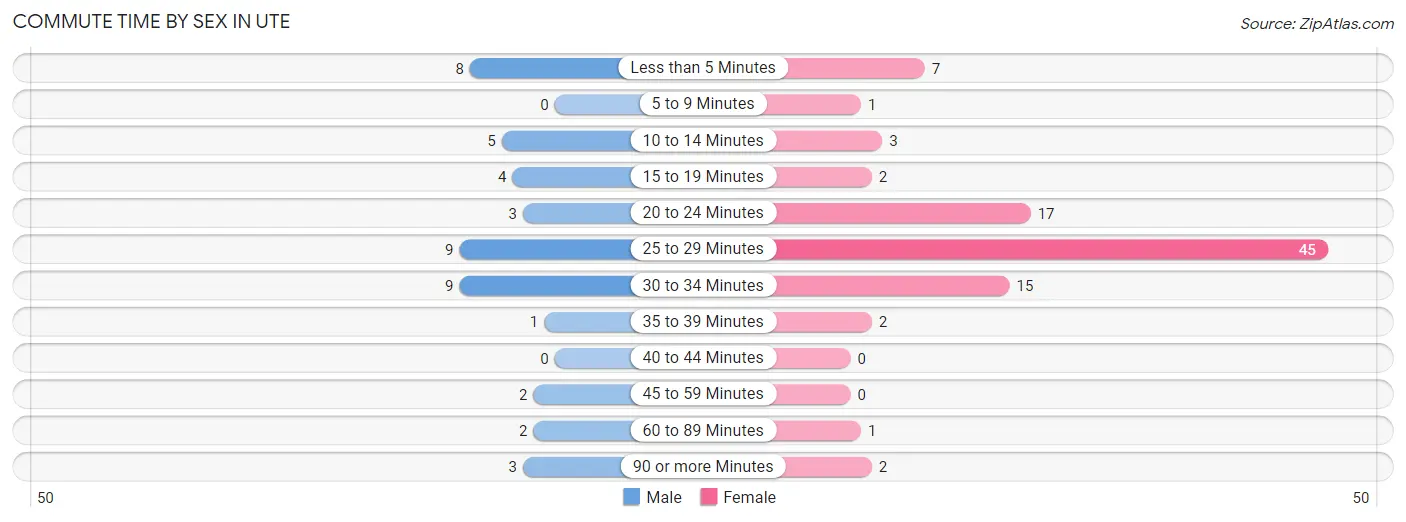
| Commute Time | Male | Female |
| Less than 5 Minutes | 8 (17.4%) | 7 (7.4%) |
| 5 to 9 Minutes | 0 (0.0%) | 1 (1.1%) |
| 10 to 14 Minutes | 5 (10.9%) | 3 (3.2%) |
| 15 to 19 Minutes | 4 (8.7%) | 2 (2.1%) |
| 20 to 24 Minutes | 3 (6.5%) | 17 (17.9%) |
| 25 to 29 Minutes | 9 (19.6%) | 45 (47.4%) |
| 30 to 34 Minutes | 9 (19.6%) | 15 (15.8%) |
| 35 to 39 Minutes | 1 (2.2%) | 2 (2.1%) |
| 40 to 44 Minutes | 0 (0.0%) | 0 (0.0%) |
| 45 to 59 Minutes | 2 (4.3%) | 0 (0.0%) |
| 60 to 89 Minutes | 2 (4.3%) | 1 (1.1%) |
| 90 or more Minutes | 3 (6.5%) | 2 (2.1%) |
Time of Departure to Work by Sex in Ute
The most frequent times of departure to work in Ute are 7:00 AM to 7:29 AM (12, 26.1%) for males and 7:00 AM to 7:29 AM (29, 30.5%) for females.
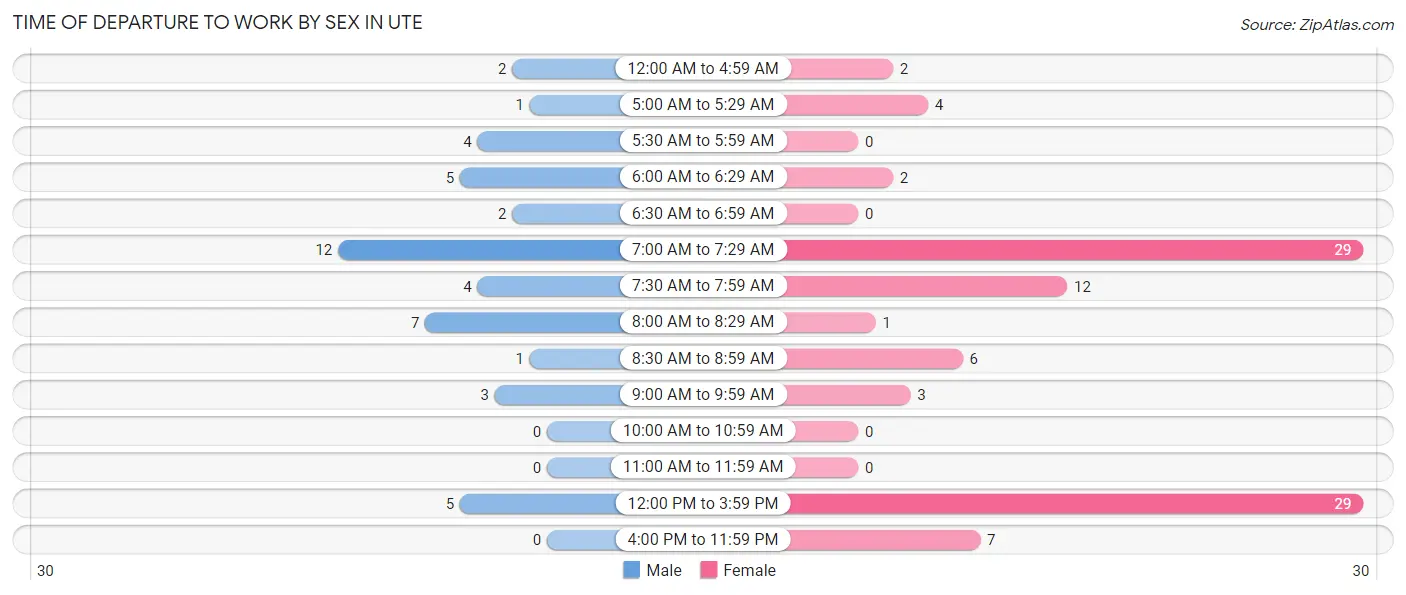
| Time of Departure | Male | Female |
| 12:00 AM to 4:59 AM | 2 (4.3%) | 2 (2.1%) |
| 5:00 AM to 5:29 AM | 1 (2.2%) | 4 (4.2%) |
| 5:30 AM to 5:59 AM | 4 (8.7%) | 0 (0.0%) |
| 6:00 AM to 6:29 AM | 5 (10.9%) | 2 (2.1%) |
| 6:30 AM to 6:59 AM | 2 (4.3%) | 0 (0.0%) |
| 7:00 AM to 7:29 AM | 12 (26.1%) | 29 (30.5%) |
| 7:30 AM to 7:59 AM | 4 (8.7%) | 12 (12.6%) |
| 8:00 AM to 8:29 AM | 7 (15.2%) | 1 (1.1%) |
| 8:30 AM to 8:59 AM | 1 (2.2%) | 6 (6.3%) |
| 9:00 AM to 9:59 AM | 3 (6.5%) | 3 (3.2%) |
| 10:00 AM to 10:59 AM | 0 (0.0%) | 0 (0.0%) |
| 11:00 AM to 11:59 AM | 0 (0.0%) | 0 (0.0%) |
| 12:00 PM to 3:59 PM | 5 (10.9%) | 29 (30.5%) |
| 4:00 PM to 11:59 PM | 0 (0.0%) | 7 (7.4%) |
| Total | 46 (100.0%) | 95 (100.0%) |
Housing Occupancy in Ute
Occupancy by Ownership in Ute
Of the total 174 dwellings in Ute, owner-occupied units account for 115 (66.1%), while renter-occupied units make up 59 (33.9%).
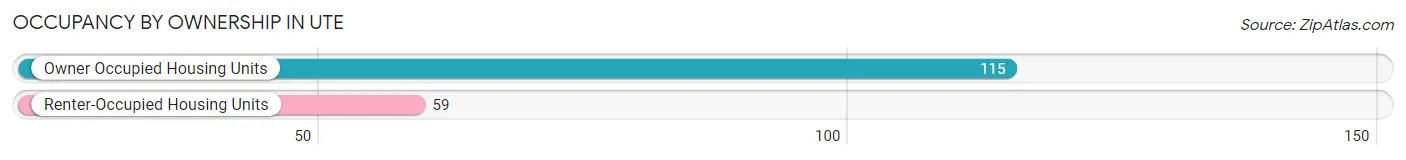
| Occupancy | # Housing Units | % Housing Units |
| Owner Occupied Housing Units | 115 | 66.1% |
| Renter-Occupied Housing Units | 59 | 33.9% |
| Total Occupied Housing Units | 174 | 100.0% |
Occupancy by Household Size in Ute
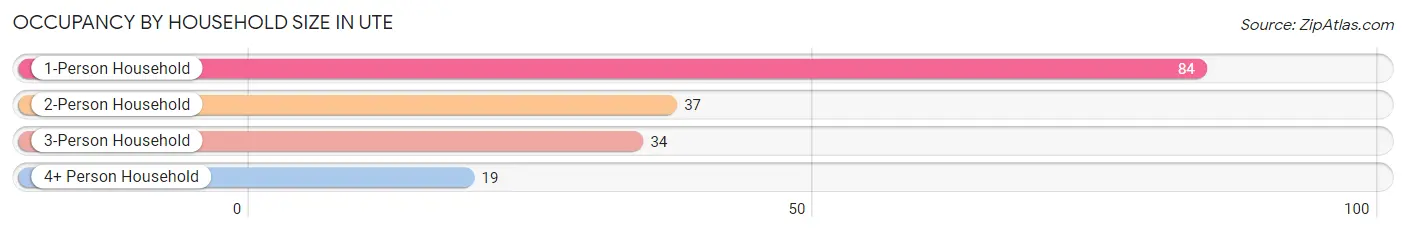
| Household Size | # Housing Units | % Housing Units |
| 1-Person Household | 84 | 48.3% |
| 2-Person Household | 37 | 21.3% |
| 3-Person Household | 34 | 19.5% |
| 4+ Person Household | 19 | 10.9% |
| Total Housing Units | 174 | 100.0% |
Occupancy by Ownership by Household Size in Ute
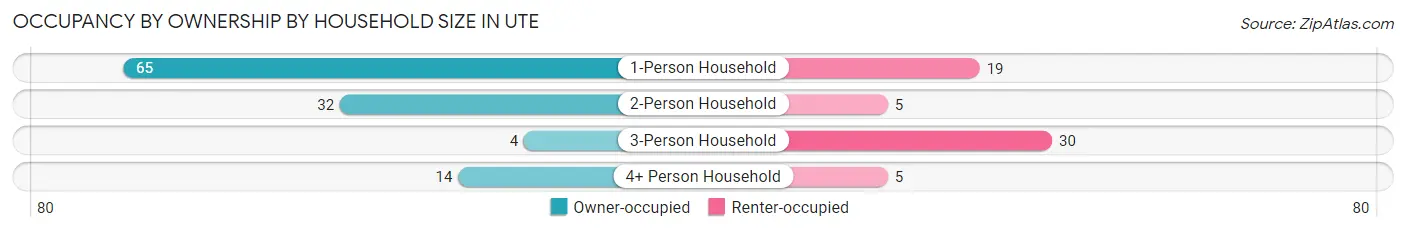
| Household Size | Owner-occupied | Renter-occupied |
| 1-Person Household | 65 (77.4%) | 19 (22.6%) |
| 2-Person Household | 32 (86.5%) | 5 (13.5%) |
| 3-Person Household | 4 (11.8%) | 30 (88.2%) |
| 4+ Person Household | 14 (73.7%) | 5 (26.3%) |
| Total Housing Units | 115 (66.1%) | 59 (33.9%) |
Occupancy by Educational Attainment in Ute
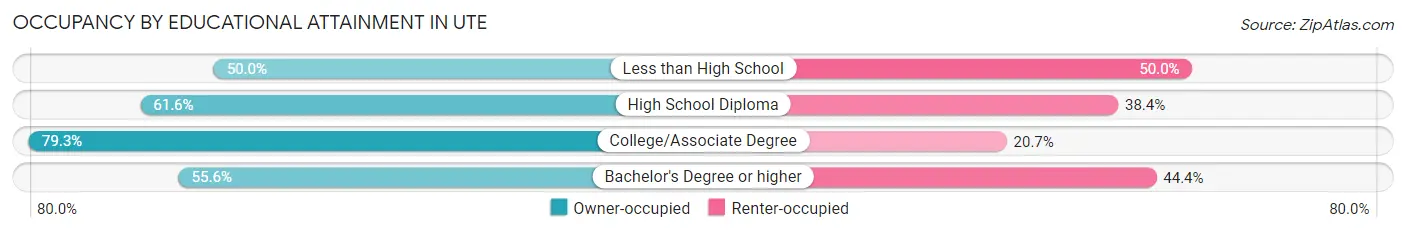
| Household Size | Owner-occupied | Renter-occupied |
| Less than High School | 6 (50.0%) | 6 (50.0%) |
| High School Diploma | 53 (61.6%) | 33 (38.4%) |
| College/Associate Degree | 46 (79.3%) | 12 (20.7%) |
| Bachelor's Degree or higher | 10 (55.6%) | 8 (44.4%) |
Occupancy by Age of Householder in Ute
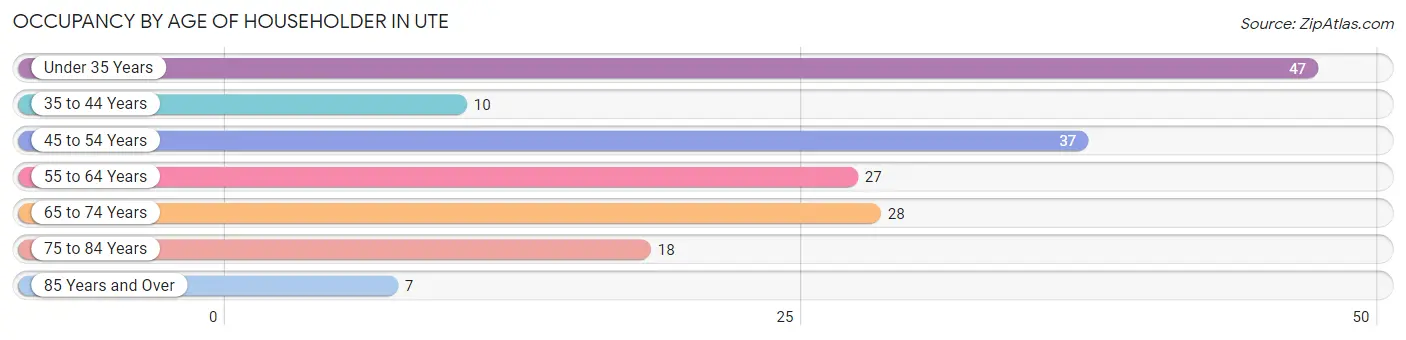
| Age Bracket | # Households | % Households |
| Under 35 Years | 47 | 27.0% |
| 35 to 44 Years | 10 | 5.8% |
| 45 to 54 Years | 37 | 21.3% |
| 55 to 64 Years | 27 | 15.5% |
| 65 to 74 Years | 28 | 16.1% |
| 75 to 84 Years | 18 | 10.3% |
| 85 Years and Over | 7 | 4.0% |
| Total | 174 | 100.0% |
Housing Finances in Ute
Median Income by Occupancy in Ute
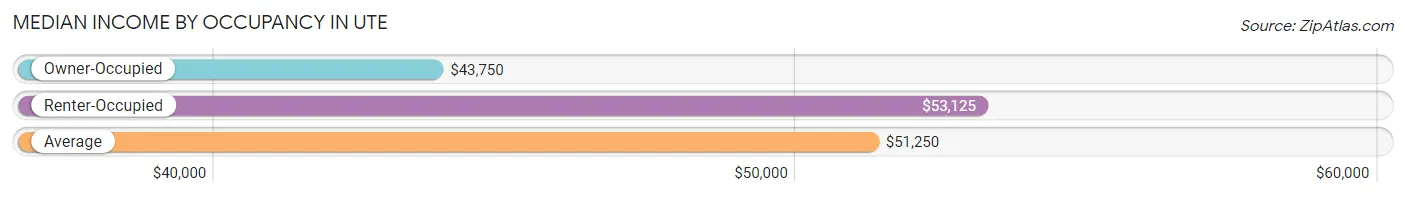
| Occupancy Type | # Households | Median Income |
| Owner-Occupied | 115 (66.1%) | $43,750 |
| Renter-Occupied | 59 (33.9%) | $53,125 |
| Average | 174 (100.0%) | $51,250 |
Occupancy by Householder Income Bracket in Ute
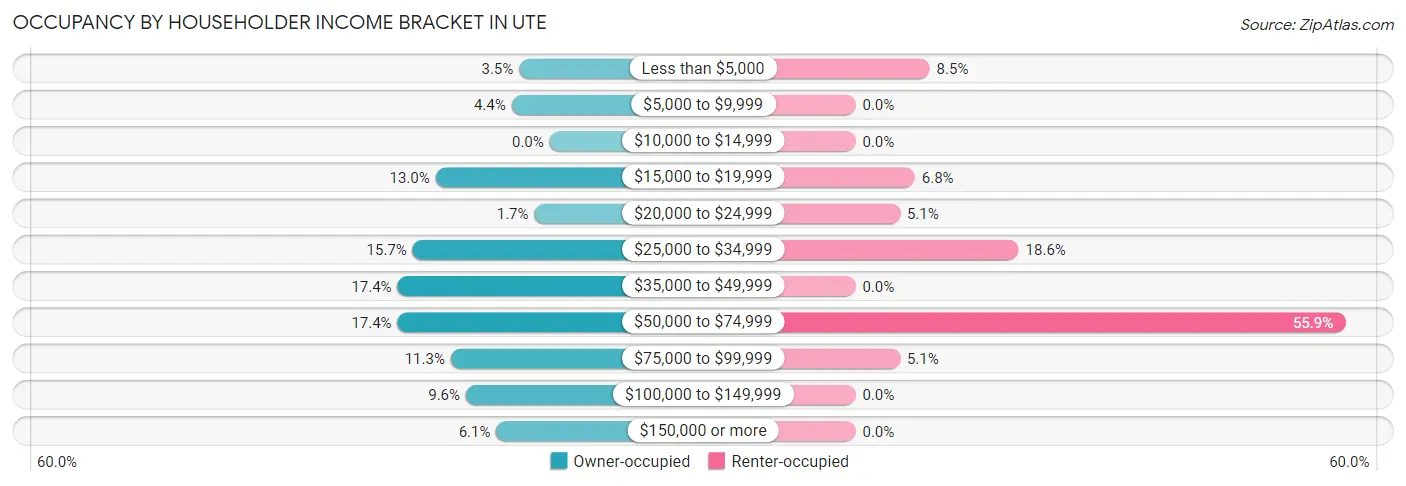
| Income Bracket | Owner-occupied | Renter-occupied |
| Less than $5,000 | 4 (3.5%) | 5 (8.5%) |
| $5,000 to $9,999 | 5 (4.3%) | 0 (0.0%) |
| $10,000 to $14,999 | 0 (0.0%) | 0 (0.0%) |
| $15,000 to $19,999 | 15 (13.0%) | 4 (6.8%) |
| $20,000 to $24,999 | 2 (1.7%) | 3 (5.1%) |
| $25,000 to $34,999 | 18 (15.7%) | 11 (18.6%) |
| $35,000 to $49,999 | 20 (17.4%) | 0 (0.0%) |
| $50,000 to $74,999 | 20 (17.4%) | 33 (55.9%) |
| $75,000 to $99,999 | 13 (11.3%) | 3 (5.1%) |
| $100,000 to $149,999 | 11 (9.6%) | 0 (0.0%) |
| $150,000 or more | 7 (6.1%) | 0 (0.0%) |
| Total | 115 (100.0%) | 59 (100.0%) |
Monthly Housing Cost Tiers in Ute
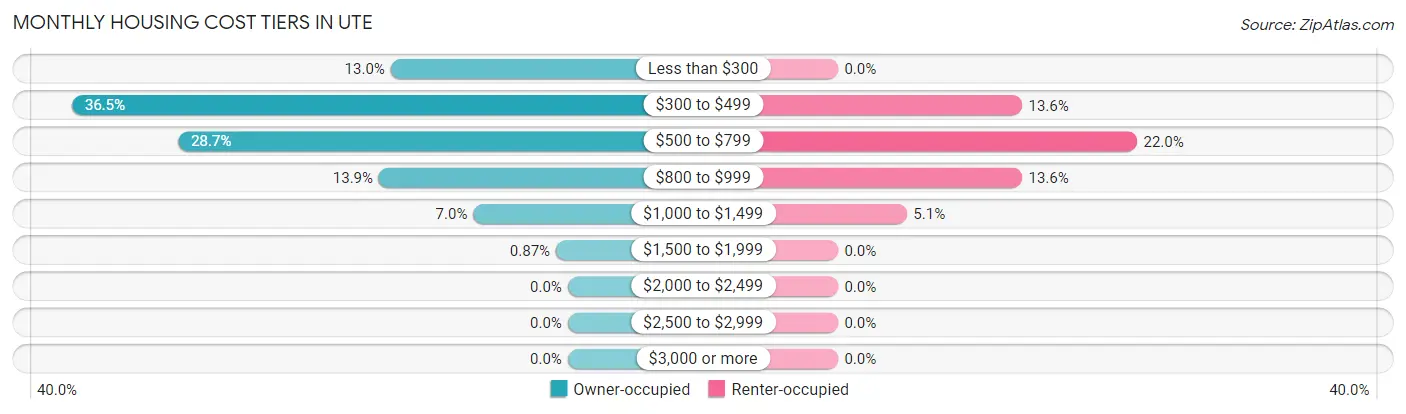
| Monthly Cost | Owner-occupied | Renter-occupied |
| Less than $300 | 15 (13.0%) | 0 (0.0%) |
| $300 to $499 | 42 (36.5%) | 8 (13.6%) |
| $500 to $799 | 33 (28.7%) | 13 (22.0%) |
| $800 to $999 | 16 (13.9%) | 8 (13.6%) |
| $1,000 to $1,499 | 8 (7.0%) | 3 (5.1%) |
| $1,500 to $1,999 | 1 (0.9%) | 0 (0.0%) |
| $2,000 to $2,499 | 0 (0.0%) | 0 (0.0%) |
| $2,500 to $2,999 | 0 (0.0%) | 0 (0.0%) |
| $3,000 or more | 0 (0.0%) | 0 (0.0%) |
| Total | 115 (100.0%) | 59 (100.0%) |
Physical Housing Characteristics in Ute
Housing Structures in Ute
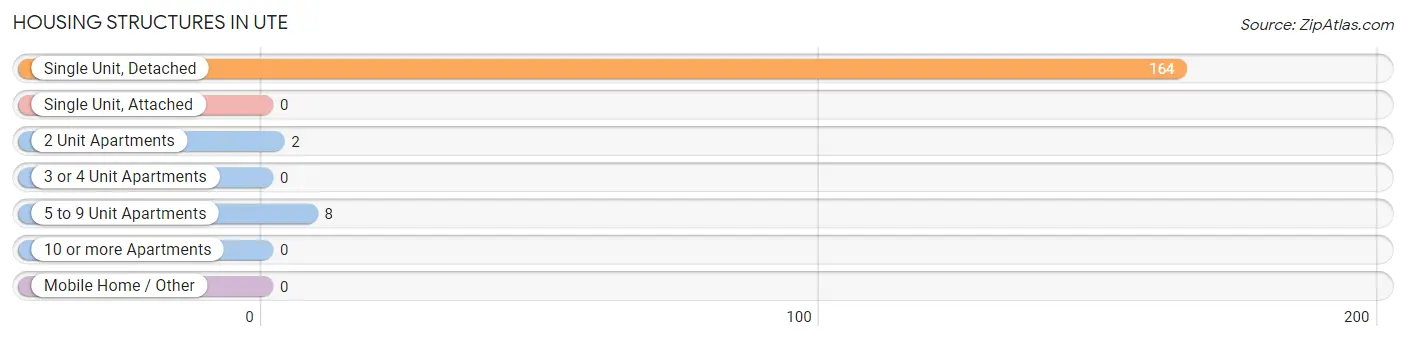
| Structure Type | # Housing Units | % Housing Units |
| Single Unit, Detached | 164 | 94.3% |
| Single Unit, Attached | 0 | 0.0% |
| 2 Unit Apartments | 2 | 1.1% |
| 3 or 4 Unit Apartments | 0 | 0.0% |
| 5 to 9 Unit Apartments | 8 | 4.6% |
| 10 or more Apartments | 0 | 0.0% |
| Mobile Home / Other | 0 | 0.0% |
| Total | 174 | 100.0% |
Housing Structures by Occupancy in Ute
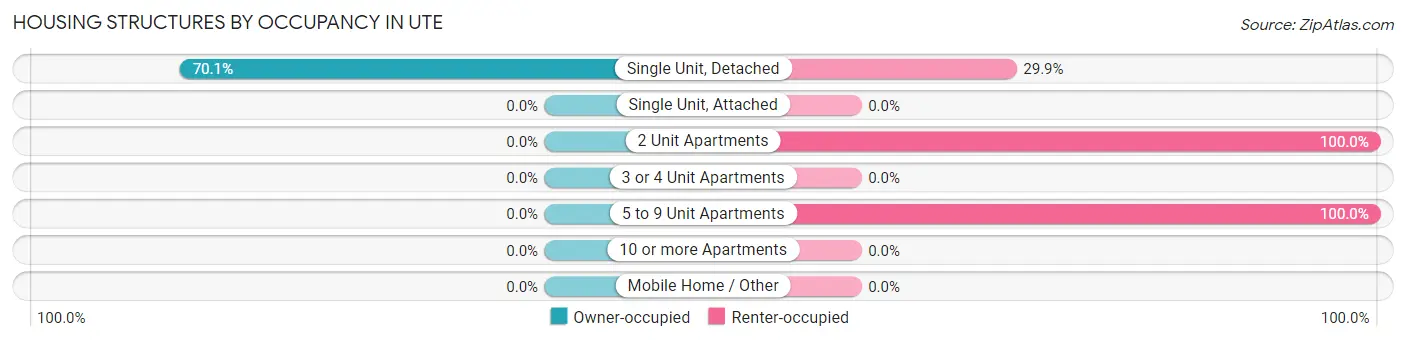
| Structure Type | Owner-occupied | Renter-occupied |
| Single Unit, Detached | 115 (70.1%) | 49 (29.9%) |
| Single Unit, Attached | 0 (0.0%) | 0 (0.0%) |
| 2 Unit Apartments | 0 (0.0%) | 2 (100.0%) |
| 3 or 4 Unit Apartments | 0 (0.0%) | 0 (0.0%) |
| 5 to 9 Unit Apartments | 0 (0.0%) | 8 (100.0%) |
| 10 or more Apartments | 0 (0.0%) | 0 (0.0%) |
| Mobile Home / Other | 0 (0.0%) | 0 (0.0%) |
| Total | 115 (66.1%) | 59 (33.9%) |
Housing Structures by Number of Rooms in Ute
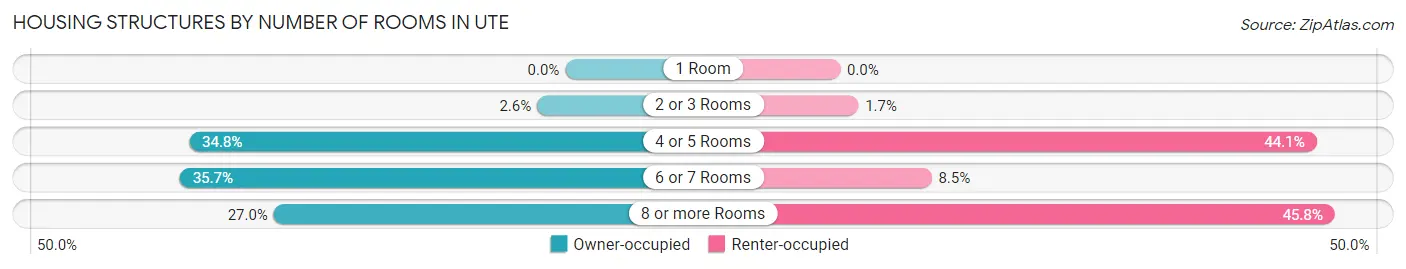
| Number of Rooms | Owner-occupied | Renter-occupied |
| 1 Room | 0 (0.0%) | 0 (0.0%) |
| 2 or 3 Rooms | 3 (2.6%) | 1 (1.7%) |
| 4 or 5 Rooms | 40 (34.8%) | 26 (44.1%) |
| 6 or 7 Rooms | 41 (35.6%) | 5 (8.5%) |
| 8 or more Rooms | 31 (27.0%) | 27 (45.8%) |
| Total | 115 (100.0%) | 59 (100.0%) |
Housing Structure by Heating Type in Ute
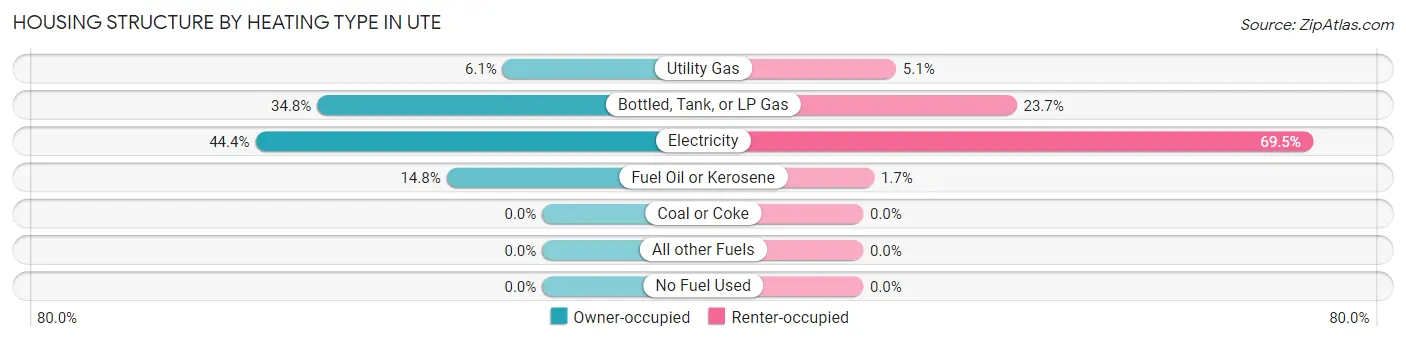
| Heating Type | Owner-occupied | Renter-occupied |
| Utility Gas | 7 (6.1%) | 3 (5.1%) |
| Bottled, Tank, or LP Gas | 40 (34.8%) | 14 (23.7%) |
| Electricity | 51 (44.4%) | 41 (69.5%) |
| Fuel Oil or Kerosene | 17 (14.8%) | 1 (1.7%) |
| Coal or Coke | 0 (0.0%) | 0 (0.0%) |
| All other Fuels | 0 (0.0%) | 0 (0.0%) |
| No Fuel Used | 0 (0.0%) | 0 (0.0%) |
| Total | 115 (100.0%) | 59 (100.0%) |
Household Vehicle Usage in Ute
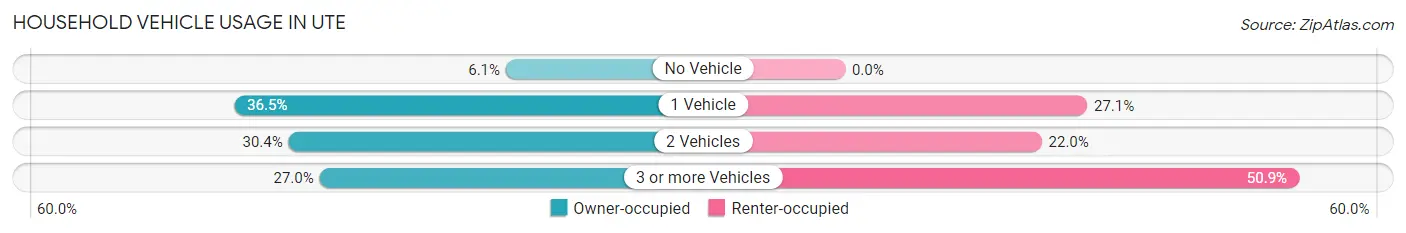
| Vehicles per Household | Owner-occupied | Renter-occupied |
| No Vehicle | 7 (6.1%) | 0 (0.0%) |
| 1 Vehicle | 42 (36.5%) | 16 (27.1%) |
| 2 Vehicles | 35 (30.4%) | 13 (22.0%) |
| 3 or more Vehicles | 31 (27.0%) | 30 (50.8%) |
| Total | 115 (100.0%) | 59 (100.0%) |
Real Estate & Mortgages in Ute
Real Estate and Mortgage Overview in Ute
| Characteristic | Without Mortgage | With Mortgage |
| Housing Units | 67 | 48 |
| Median Property Value | $71,900 | $65,000 |
| Median Household Income | $36,250 | $0 |
| Monthly Housing Costs | $387 | $0 |
| Real Estate Taxes | $938 | $1 |
Property Value by Mortgage Status in Ute
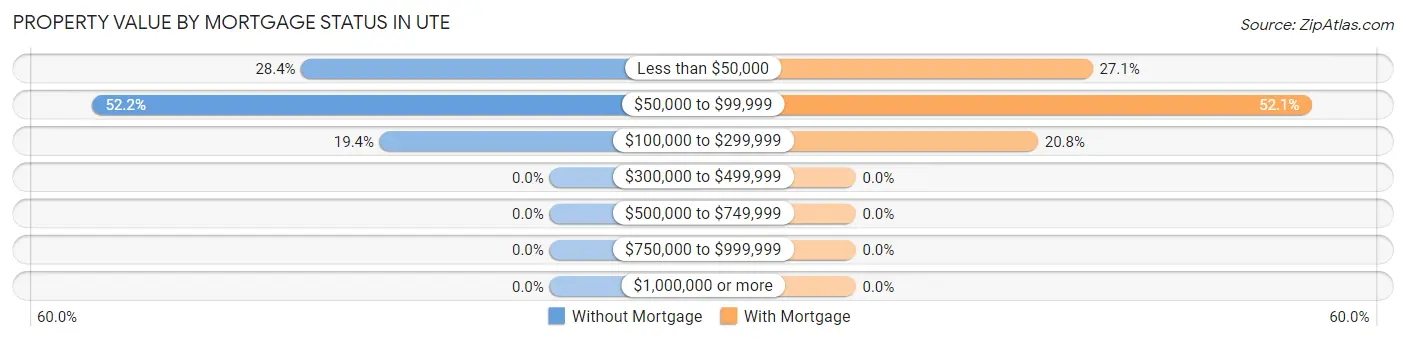
| Property Value | Without Mortgage | With Mortgage |
| Less than $50,000 | 19 (28.4%) | 13 (27.1%) |
| $50,000 to $99,999 | 35 (52.2%) | 25 (52.1%) |
| $100,000 to $299,999 | 13 (19.4%) | 10 (20.8%) |
| $300,000 to $499,999 | 0 (0.0%) | 0 (0.0%) |
| $500,000 to $749,999 | 0 (0.0%) | 0 (0.0%) |
| $750,000 to $999,999 | 0 (0.0%) | 0 (0.0%) |
| $1,000,000 or more | 0 (0.0%) | 0 (0.0%) |
| Total | 67 (100.0%) | 48 (100.0%) |
Household Income by Mortgage Status in Ute
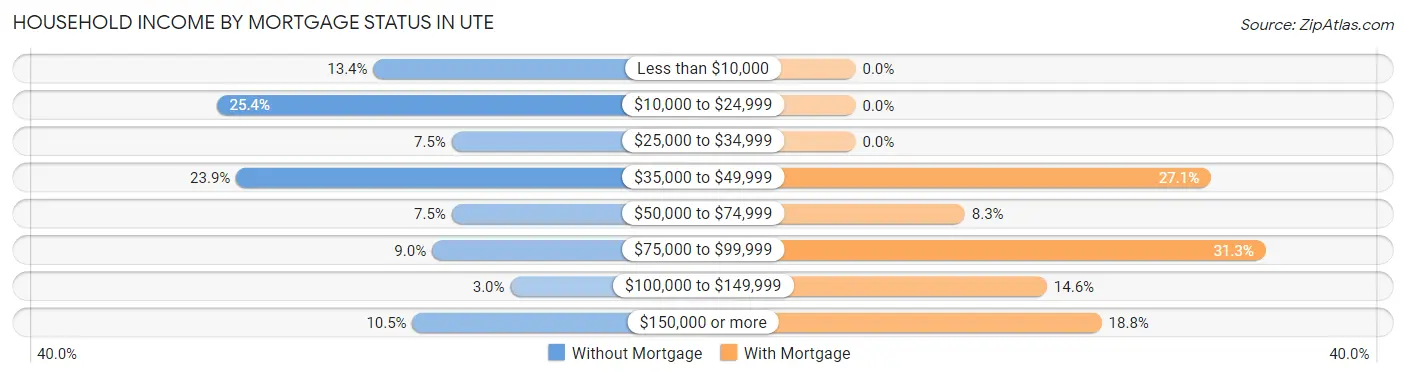
| Household Income | Without Mortgage | With Mortgage |
| Less than $10,000 | 9 (13.4%) | 0 (0.0%) |
| $10,000 to $24,999 | 17 (25.4%) | 0 (0.0%) |
| $25,000 to $34,999 | 5 (7.5%) | 0 (0.0%) |
| $35,000 to $49,999 | 16 (23.9%) | 13 (27.1%) |
| $50,000 to $74,999 | 5 (7.5%) | 4 (8.3%) |
| $75,000 to $99,999 | 6 (9.0%) | 15 (31.2%) |
| $100,000 to $149,999 | 2 (3.0%) | 7 (14.6%) |
| $150,000 or more | 7 (10.4%) | 9 (18.8%) |
| Total | 67 (100.0%) | 48 (100.0%) |
Property Value to Household Income Ratio in Ute
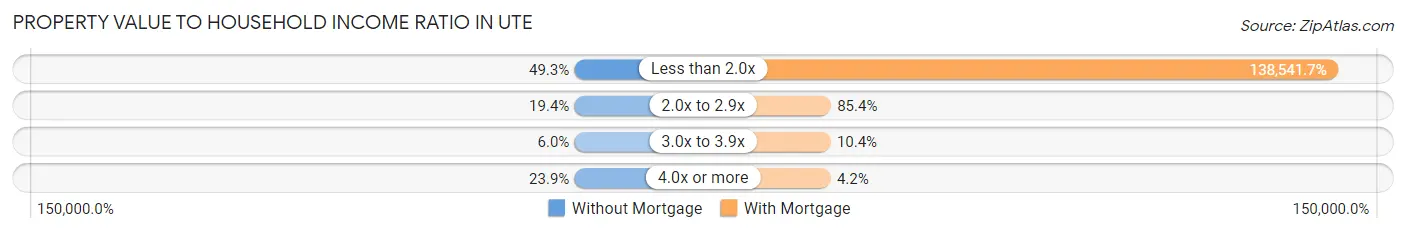
| Value-to-Income Ratio | Without Mortgage | With Mortgage |
| Less than 2.0x | 33 (49.2%) | 66,500 (138,541.7%) |
| 2.0x to 2.9x | 13 (19.4%) | 41 (85.4%) |
| 3.0x to 3.9x | 4 (6.0%) | 5 (10.4%) |
| 4.0x or more | 16 (23.9%) | 2 (4.2%) |
| Total | 67 (100.0%) | 48 (100.0%) |
Real Estate Taxes by Mortgage Status in Ute
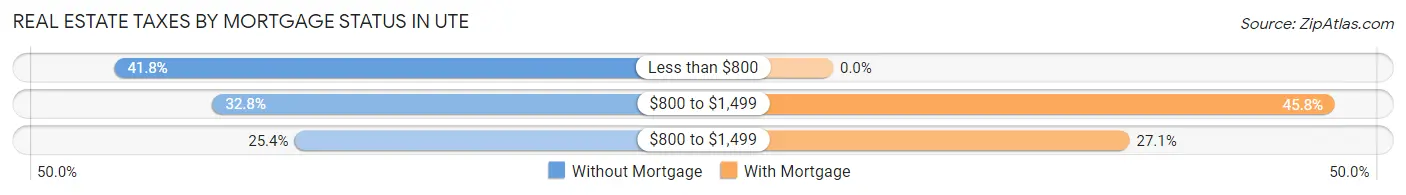
| Property Taxes | Without Mortgage | With Mortgage |
| Less than $800 | 28 (41.8%) | 0 (0.0%) |
| $800 to $1,499 | 22 (32.8%) | 22 (45.8%) |
| $800 to $1,499 | 17 (25.4%) | 13 (27.1%) |
| Total | 67 (100.0%) | 48 (100.0%) |
Health & Disability in Ute
Health Insurance Coverage by Age in Ute
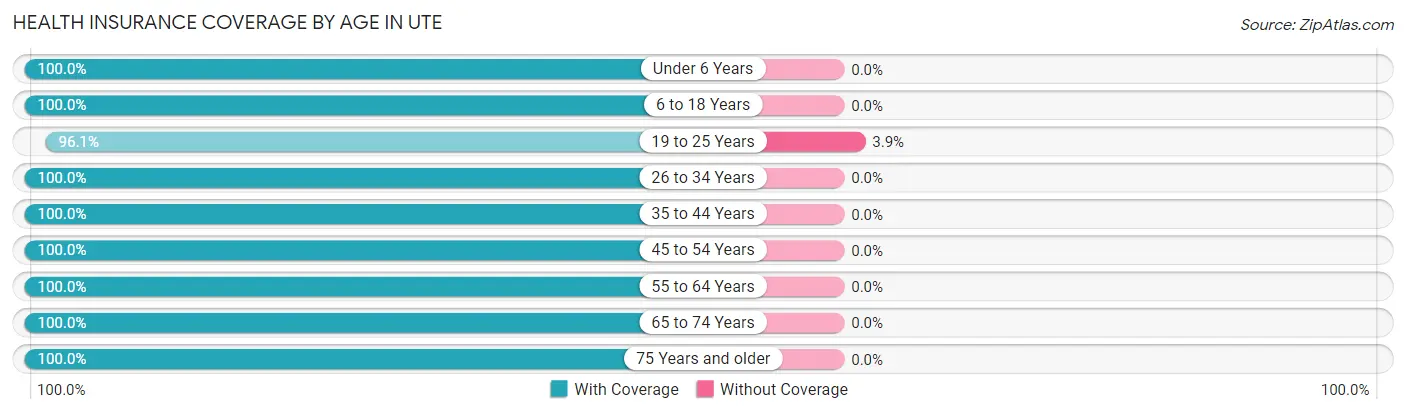
| Age Bracket | With Coverage | Without Coverage |
| Under 6 Years | 17 (100.0%) | 0 (0.0%) |
| 6 to 18 Years | 40 (100.0%) | 0 (0.0%) |
| 19 to 25 Years | 49 (96.1%) | 2 (3.9%) |
| 26 to 34 Years | 49 (100.0%) | 0 (0.0%) |
| 35 to 44 Years | 13 (100.0%) | 0 (0.0%) |
| 45 to 54 Years | 49 (100.0%) | 0 (0.0%) |
| 55 to 64 Years | 38 (100.0%) | 0 (0.0%) |
| 65 to 74 Years | 39 (100.0%) | 0 (0.0%) |
| 75 Years and older | 35 (100.0%) | 0 (0.0%) |
| Total | 329 (99.4%) | 2 (0.6%) |
Health Insurance Coverage by Citizenship Status in Ute
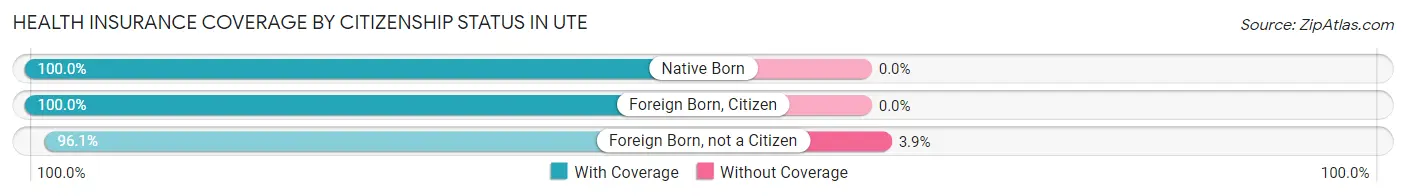
| Citizenship Status | With Coverage | Without Coverage |
| Native Born | 17 (100.0%) | 0 (0.0%) |
| Foreign Born, Citizen | 40 (100.0%) | 0 (0.0%) |
| Foreign Born, not a Citizen | 49 (96.1%) | 2 (3.9%) |
Health Insurance Coverage by Household Income in Ute
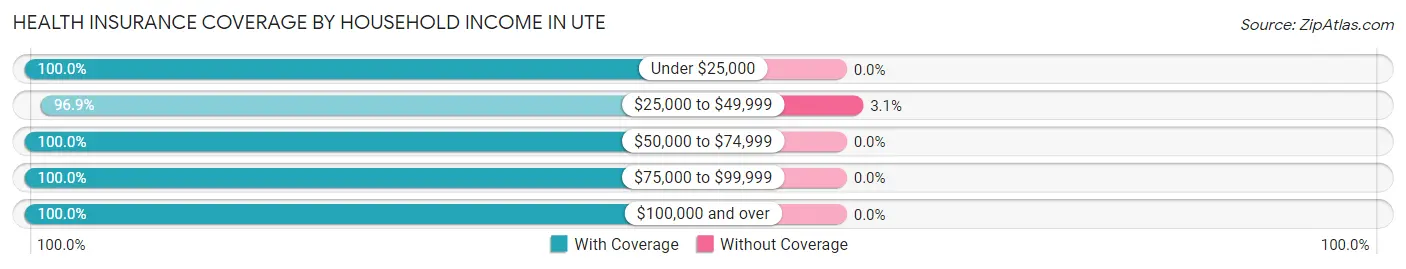
| Household Income | With Coverage | Without Coverage |
| Under $25,000 | 43 (100.0%) | 0 (0.0%) |
| $25,000 to $49,999 | 63 (96.9%) | 2 (3.1%) |
| $50,000 to $74,999 | 139 (100.0%) | 0 (0.0%) |
| $75,000 to $99,999 | 35 (100.0%) | 0 (0.0%) |
| $100,000 and over | 49 (100.0%) | 0 (0.0%) |
Public vs Private Health Insurance Coverage by Age in Ute
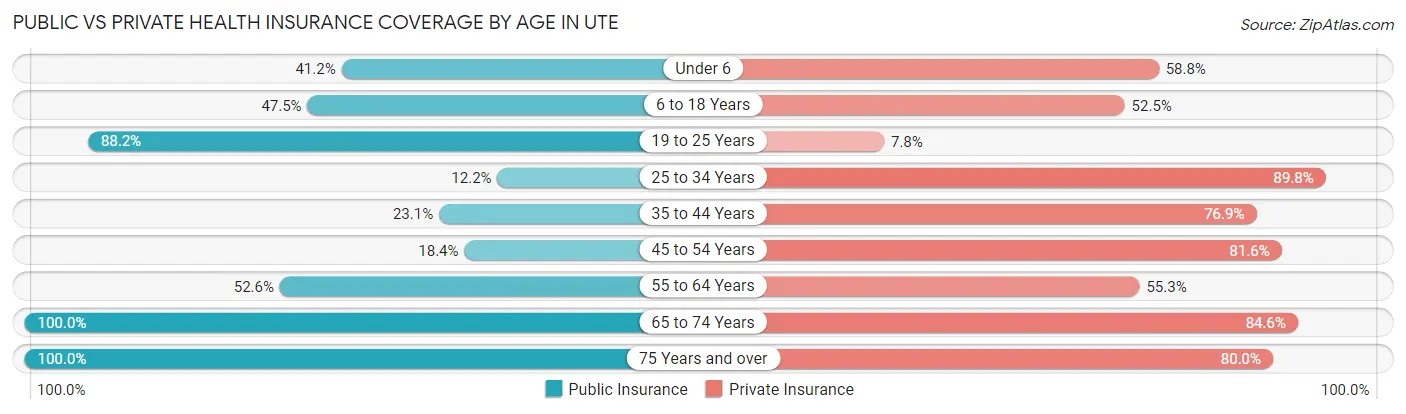
| Age Bracket | Public Insurance | Private Insurance |
| Under 6 | 7 (41.2%) | 10 (58.8%) |
| 6 to 18 Years | 19 (47.5%) | 21 (52.5%) |
| 19 to 25 Years | 45 (88.2%) | 4 (7.8%) |
| 25 to 34 Years | 6 (12.2%) | 44 (89.8%) |
| 35 to 44 Years | 3 (23.1%) | 10 (76.9%) |
| 45 to 54 Years | 9 (18.4%) | 40 (81.6%) |
| 55 to 64 Years | 20 (52.6%) | 21 (55.3%) |
| 65 to 74 Years | 39 (100.0%) | 33 (84.6%) |
| 75 Years and over | 35 (100.0%) | 28 (80.0%) |
| Total | 183 (55.3%) | 211 (63.7%) |
Disability Status by Sex by Age in Ute
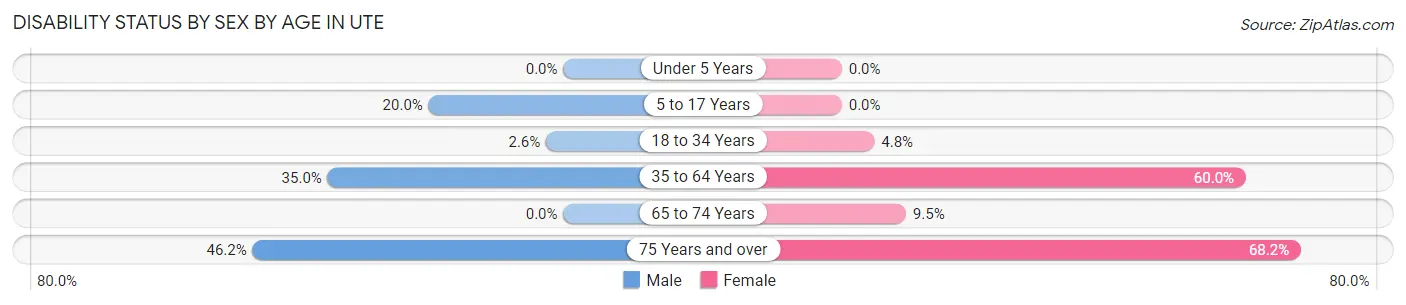
| Age Bracket | Male | Female |
| Under 5 Years | 0 (0.0%) | 0 (0.0%) |
| 5 to 17 Years | 5 (20.0%) | 0 (0.0%) |
| 18 to 34 Years | 1 (2.6%) | 3 (4.8%) |
| 35 to 64 Years | 14 (35.0%) | 36 (60.0%) |
| 65 to 74 Years | 0 (0.0%) | 2 (9.5%) |
| 75 Years and over | 6 (46.2%) | 15 (68.2%) |
Disability Class by Sex by Age in Ute
Disability Class: Hearing Difficulty
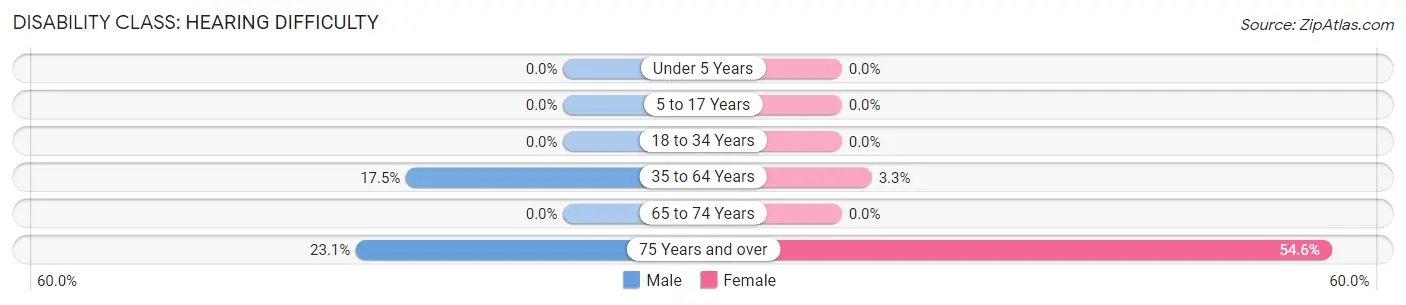
| Age Bracket | Male | Female |
| Under 5 Years | 0 (0.0%) | 0 (0.0%) |
| 5 to 17 Years | 0 (0.0%) | 0 (0.0%) |
| 18 to 34 Years | 0 (0.0%) | 0 (0.0%) |
| 35 to 64 Years | 7 (17.5%) | 2 (3.3%) |
| 65 to 74 Years | 0 (0.0%) | 0 (0.0%) |
| 75 Years and over | 3 (23.1%) | 12 (54.5%) |
Disability Class: Vision Difficulty
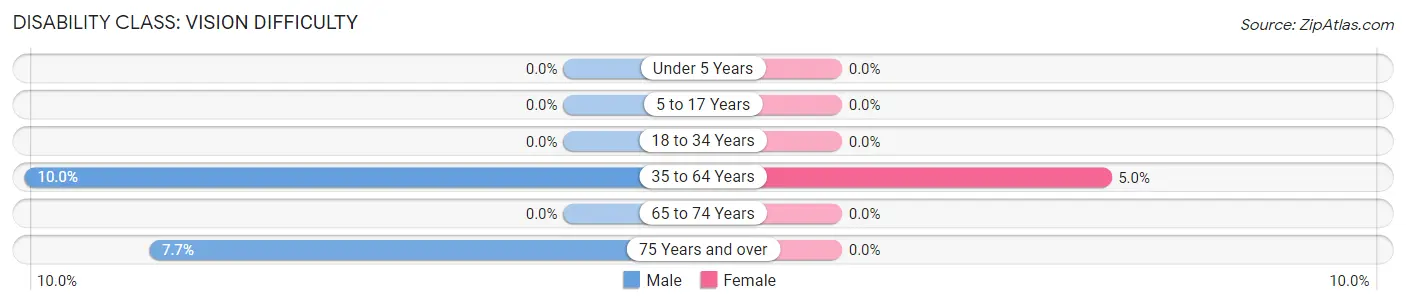
| Age Bracket | Male | Female |
| Under 5 Years | 0 (0.0%) | 0 (0.0%) |
| 5 to 17 Years | 0 (0.0%) | 0 (0.0%) |
| 18 to 34 Years | 0 (0.0%) | 0 (0.0%) |
| 35 to 64 Years | 4 (10.0%) | 3 (5.0%) |
| 65 to 74 Years | 0 (0.0%) | 0 (0.0%) |
| 75 Years and over | 1 (7.7%) | 0 (0.0%) |
Disability Class: Cognitive Difficulty
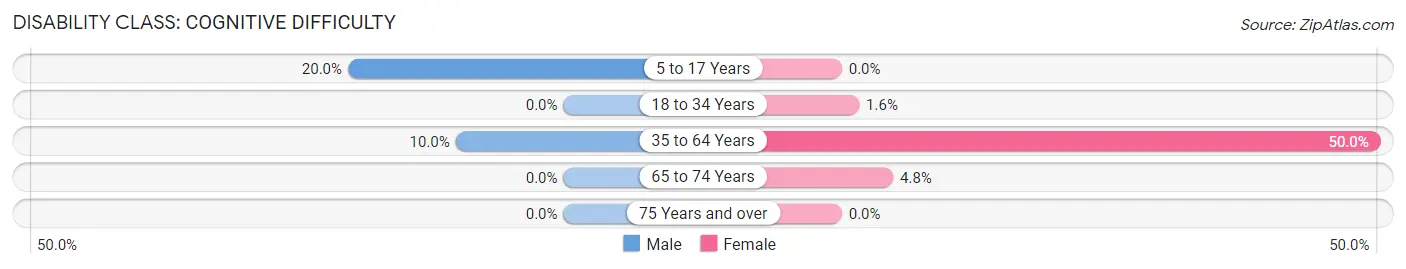
| Age Bracket | Male | Female |
| 5 to 17 Years | 5 (20.0%) | 0 (0.0%) |
| 18 to 34 Years | 0 (0.0%) | 1 (1.6%) |
| 35 to 64 Years | 4 (10.0%) | 30 (50.0%) |
| 65 to 74 Years | 0 (0.0%) | 1 (4.8%) |
| 75 Years and over | 0 (0.0%) | 0 (0.0%) |
Disability Class: Ambulatory Difficulty
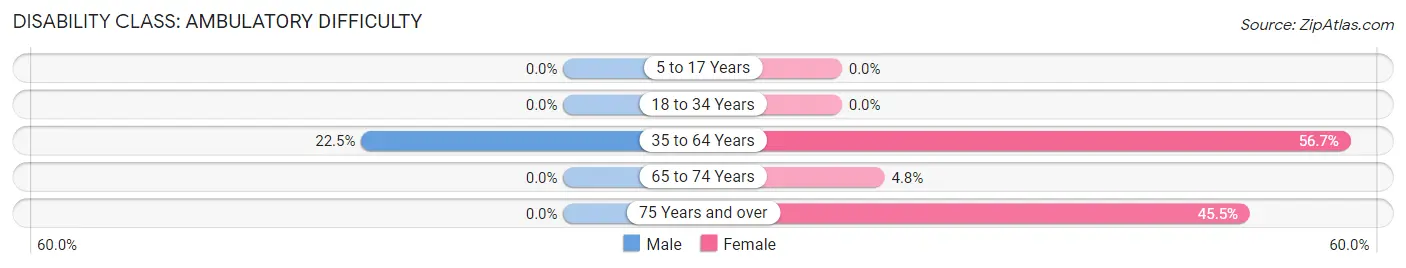
| Age Bracket | Male | Female |
| 5 to 17 Years | 0 (0.0%) | 0 (0.0%) |
| 18 to 34 Years | 0 (0.0%) | 0 (0.0%) |
| 35 to 64 Years | 9 (22.5%) | 34 (56.7%) |
| 65 to 74 Years | 0 (0.0%) | 1 (4.8%) |
| 75 Years and over | 0 (0.0%) | 10 (45.5%) |
Disability Class: Self-Care Difficulty
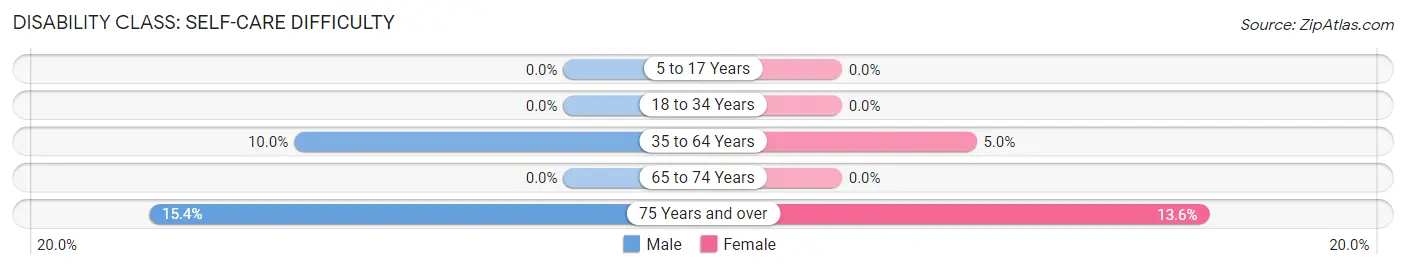
| Age Bracket | Male | Female |
| 5 to 17 Years | 0 (0.0%) | 0 (0.0%) |
| 18 to 34 Years | 0 (0.0%) | 0 (0.0%) |
| 35 to 64 Years | 4 (10.0%) | 3 (5.0%) |
| 65 to 74 Years | 0 (0.0%) | 0 (0.0%) |
| 75 Years and over | 2 (15.4%) | 3 (13.6%) |
Technology Access in Ute
Computing Device Access in Ute
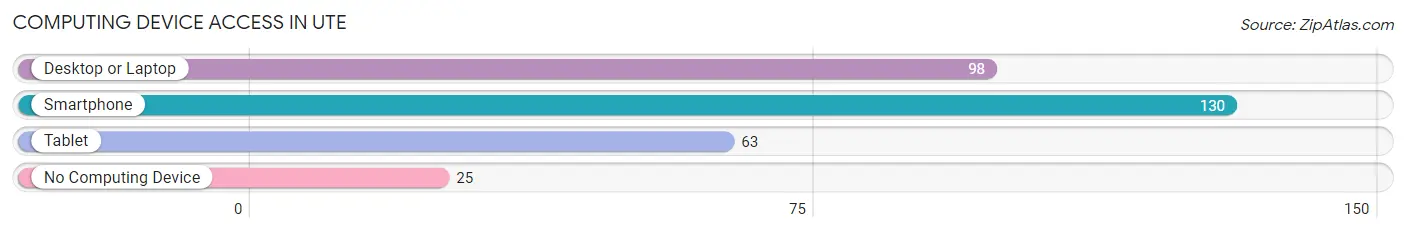
| Device Type | # Households | % Households |
| Desktop or Laptop | 98 | 56.3% |
| Smartphone | 130 | 74.7% |
| Tablet | 63 | 36.2% |
| No Computing Device | 25 | 14.4% |
| Total | 174 | 100.0% |
Internet Access in Ute
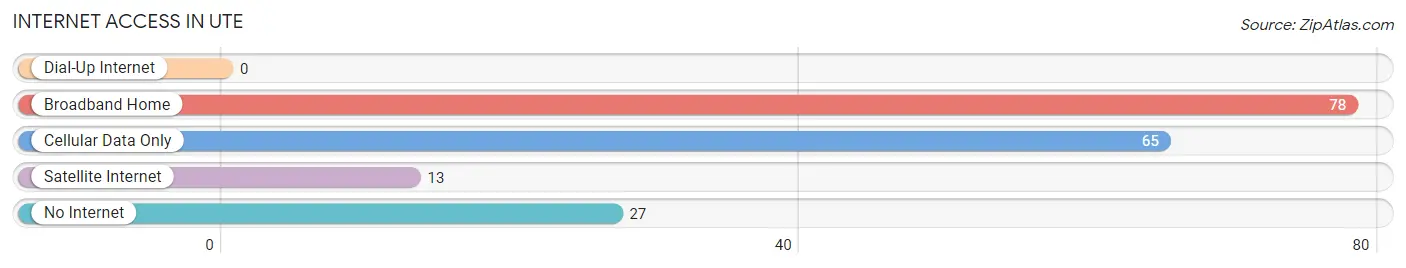
| Internet Type | # Households | % Households |
| Dial-Up Internet | 0 | 0.0% |
| Broadband Home | 78 | 44.8% |
| Cellular Data Only | 65 | 37.4% |
| Satellite Internet | 13 | 7.5% |
| No Internet | 27 | 15.5% |
| Total | 174 | 100.0% |
Ute Summary
Ute is a small town located in the state of Iowa, in the United States of America. It is situated in the southwestern part of the state, in the county of Monona. The town has a population of around 1,000 people, and is located on the banks of the Little Sioux River.
Geography
Ute is located in the Loess Hills region of Iowa, which is characterized by rolling hills and deep ravines. The town is situated on the banks of the Little Sioux River, which flows through the town and provides a source of recreation for the locals. The town is surrounded by farmland, and is located near the border of Nebraska. The nearest major city is Sioux City, which is located about 40 miles away.
Economy
Ute’s economy is largely based on agriculture. The town is home to several farms, which produce a variety of crops, including corn, soybeans, and wheat. The town also has a few small businesses, such as a grocery store, a hardware store, and a few restaurants.
Demographics
As of the 2010 census, Ute had a population of 1,000 people. The racial makeup of the town was 97.2% White, 0.7% African American, 0.3% Native American, 0.2% Asian, 0.1% Pacific Islander, and 1.5% from other races. The median household income was $41,250, and the median family income was $50,000.
History
Ute was founded in 1856 by a group of settlers from Ohio. The town was named after the Ute tribe, which had previously inhabited the area. The town grew slowly, and by the early 1900s, it had a population of around 500 people. The town was largely agricultural, and the main crops were corn and wheat.
In the 1950s, the town began to experience a population decline, as many of the younger residents moved away in search of better job opportunities. The population continued to decline until the 1990s, when the town began to experience a resurgence. The town has since seen a steady population growth, and is now home to around 1,000 people.
Ute is a small town with a rich history and a bright future. The town is surrounded by beautiful scenery, and is home to a diverse population. The town’s economy is largely based on agriculture, and the town is home to several small businesses. Ute is a great place to live, work, and raise a family.
Common Questions
What is Per Capita Income in Ute?
Per Capita income in Ute is $30,502.
What is the Median Family Income in Ute?
Median Family Income in Ute is $52,050.
What is the Median Household income in Ute?
Median Household Income in Ute is $51,250.
What is Income or Wage Gap in Ute?
Income or Wage Gap in Ute is 1.7%.
Women in Ute earn 98.3 cents for every dollar earned by a man.
What is Inequality or Gini Index in Ute?
Inequality or Gini Index in Ute is 0.44.
What is the Total Population of Ute?
Total Population of Ute is 331.
What is the Total Male Population of Ute?
Total Male Population of Ute is 141.
What is the Total Female Population of Ute?
Total Female Population of Ute is 190.
What is the Ratio of Males per 100 Females in Ute?
There are 74.21 Males per 100 Females in Ute.
What is the Ratio of Females per 100 Males in Ute?
There are 134.75 Females per 100 Males in Ute.
What is the Median Population Age in Ute?
Median Population Age in Ute is 39.5 Years.
What is the Average Family Size in Ute
Average Family Size in Ute is 2.5 People.
What is the Average Household Size in Ute
Average Household Size in Ute is 1.9 People.
How Large is the Labor Force in Ute?
There are 170 People in the Labor Forcein in Ute.
What is the Percentage of People in the Labor Force in Ute?
60.7% of People are in the Labor Force in Ute.
What is the Unemployment Rate in Ute?
Unemployment Rate in Ute is 1.2%.