Superior, IA Map & Demographics
Superior Map
Superior Overview
$24,219
PER CAPITA INCOME
$57,125
AVG FAMILY INCOME
$56,125
AVG HOUSEHOLD INCOME
31.1%
WAGE / INCOME GAP [ % ]
68.9¢/ $1
WAGE / INCOME GAP [ $ ]
0.34
INEQUALITY / GINI INDEX
143
TOTAL POPULATION
62
MALE POPULATION
81
FEMALE POPULATION
76.54
MALES / 100 FEMALES
130.65
FEMALES / 100 MALES
48.4
MEDIAN AGE
2.7
AVG FAMILY SIZE
2.3
AVG HOUSEHOLD SIZE
61
LABOR FORCE [ PEOPLE ]
53.0%
PERCENT IN LABOR FORCE
6.6%
UNEMPLOYMENT RATE
Superior Zip Codes
Superior Area Codes
Income in Superior
Income Overview in Superior
Per Capita Income in Superior is $24,219, while median incomes of families and households are $57,125 and $56,125 respectively.
| Characteristic | Number | Measure |
| Per Capita Income | 143 | $24,219 |
| Median Family Income | 43 | $57,125 |
| Mean Family Income | 43 | $68,281 |
| Median Household Income | 63 | $56,125 |
| Mean Household Income | 63 | $62,065 |
| Income Deficit | 43 | $0 |
| Wage / Income Gap (%) | 143 | 31.09% |
| Wage / Income Gap ($) | 143 | 68.91¢ per $1 |
| Gini / Inequality Index | 143 | 0.34 |
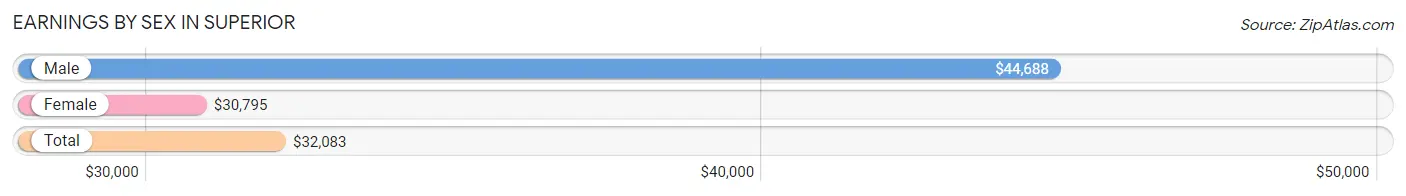
Earnings by Sex in Superior
Average Earnings in Superior are $32,083, $44,688 for men and $30,795 for women, a difference of 31.1%.
| Sex | Number | Average Earnings |
| Male | 27 (42.2%) | $44,688 |
| Female | 37 (57.8%) | $30,795 |
| Total | 64 (100.0%) | $32,083 |
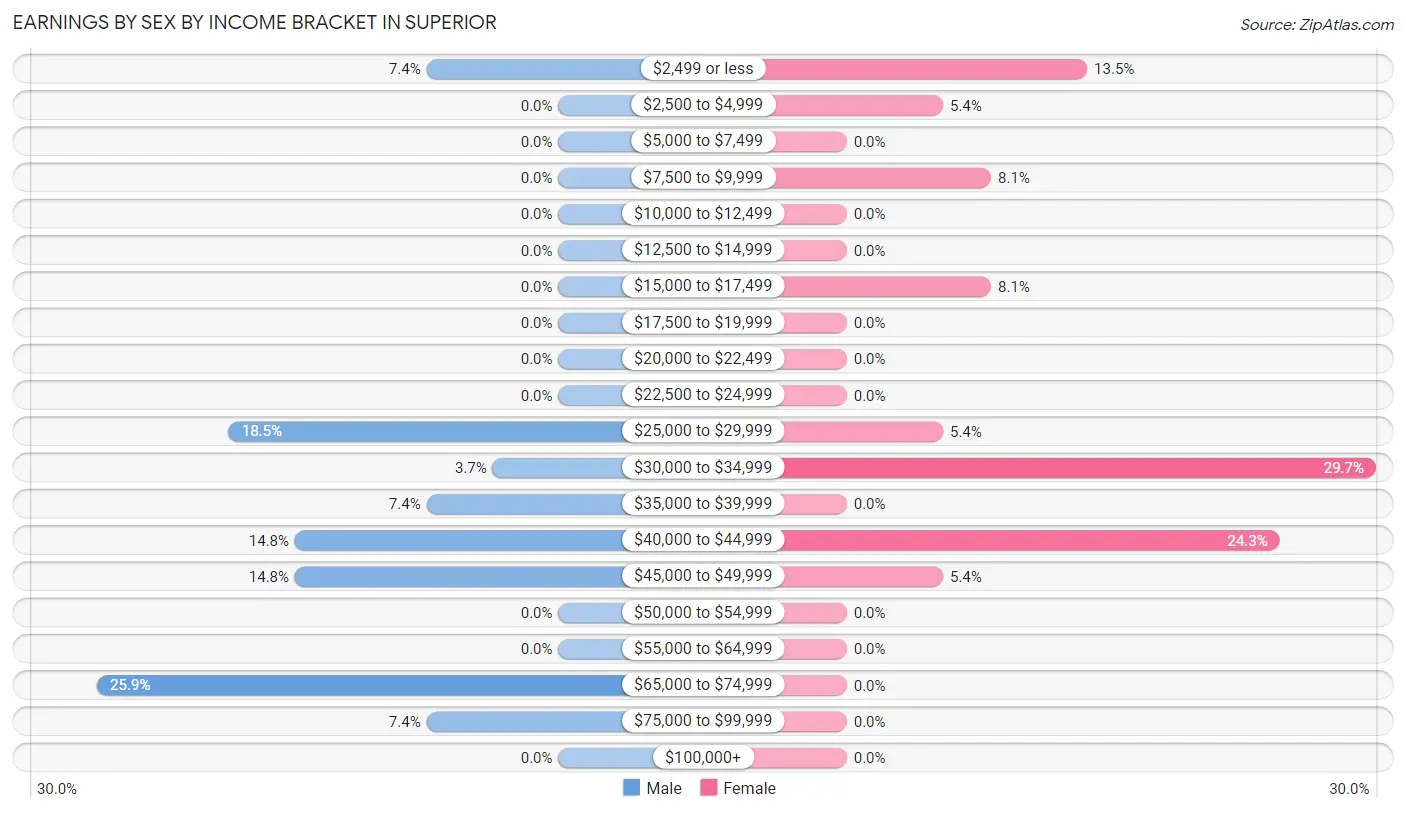
Earnings by Sex by Income Bracket in Superior
The most common earnings brackets in Superior are $65,000 to $74,999 for men (7 | 25.9%) and $30,000 to $34,999 for women (11 | 29.7%).
| Income | Male | Female |
| $2,499 or less | 2 (7.4%) | 5 (13.5%) |
| $2,500 to $4,999 | 0 (0.0%) | 2 (5.4%) |
| $5,000 to $7,499 | 0 (0.0%) | 0 (0.0%) |
| $7,500 to $9,999 | 0 (0.0%) | 3 (8.1%) |
| $10,000 to $12,499 | 0 (0.0%) | 0 (0.0%) |
| $12,500 to $14,999 | 0 (0.0%) | 0 (0.0%) |
| $15,000 to $17,499 | 0 (0.0%) | 3 (8.1%) |
| $17,500 to $19,999 | 0 (0.0%) | 0 (0.0%) |
| $20,000 to $22,499 | 0 (0.0%) | 0 (0.0%) |
| $22,500 to $24,999 | 0 (0.0%) | 0 (0.0%) |
| $25,000 to $29,999 | 5 (18.5%) | 2 (5.4%) |
| $30,000 to $34,999 | 1 (3.7%) | 11 (29.7%) |
| $35,000 to $39,999 | 2 (7.4%) | 0 (0.0%) |
| $40,000 to $44,999 | 4 (14.8%) | 9 (24.3%) |
| $45,000 to $49,999 | 4 (14.8%) | 2 (5.4%) |
| $50,000 to $54,999 | 0 (0.0%) | 0 (0.0%) |
| $55,000 to $64,999 | 0 (0.0%) | 0 (0.0%) |
| $65,000 to $74,999 | 7 (25.9%) | 0 (0.0%) |
| $75,000 to $99,999 | 2 (7.4%) | 0 (0.0%) |
| $100,000+ | 0 (0.0%) | 0 (0.0%) |
| Total | 27 (100.0%) | 37 (100.0%) |
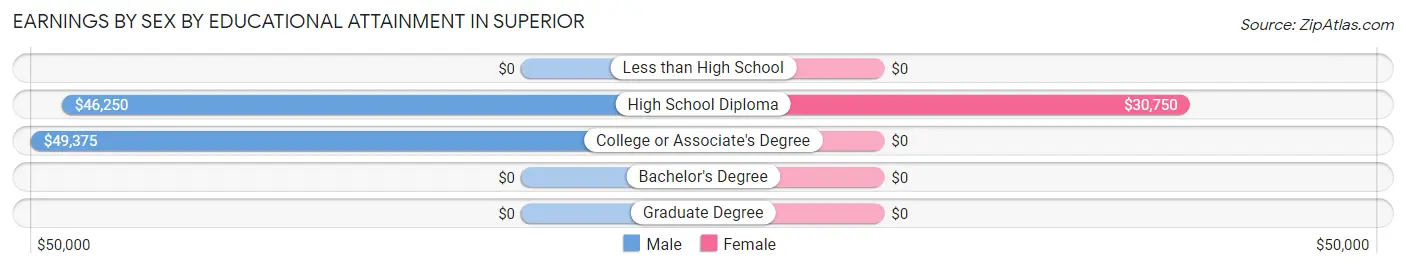
Earnings by Sex by Educational Attainment in Superior
Average earnings in Superior are $47,813 for men and $31,364 for women, a difference of 34.4%. Men with an educational attainment of college or associate's degree enjoy the highest average annual earnings of $49,375, while those with high school diploma education earn the least with $46,250. Women with an educational attainment of high school diploma earn the most with the average annual earnings of $30,750, while those with high school diploma education have the smallest earnings of $30,750.
| Educational Attainment | Male Income | Female Income |
| Less than High School | - | - |
| High School Diploma | $46,250 | $30,750 |
| College or Associate's Degree | $49,375 | $0 |
| Bachelor's Degree | - | - |
| Graduate Degree | - | - |
| Total | $47,813 | $31,364 |
Family Income in Superior
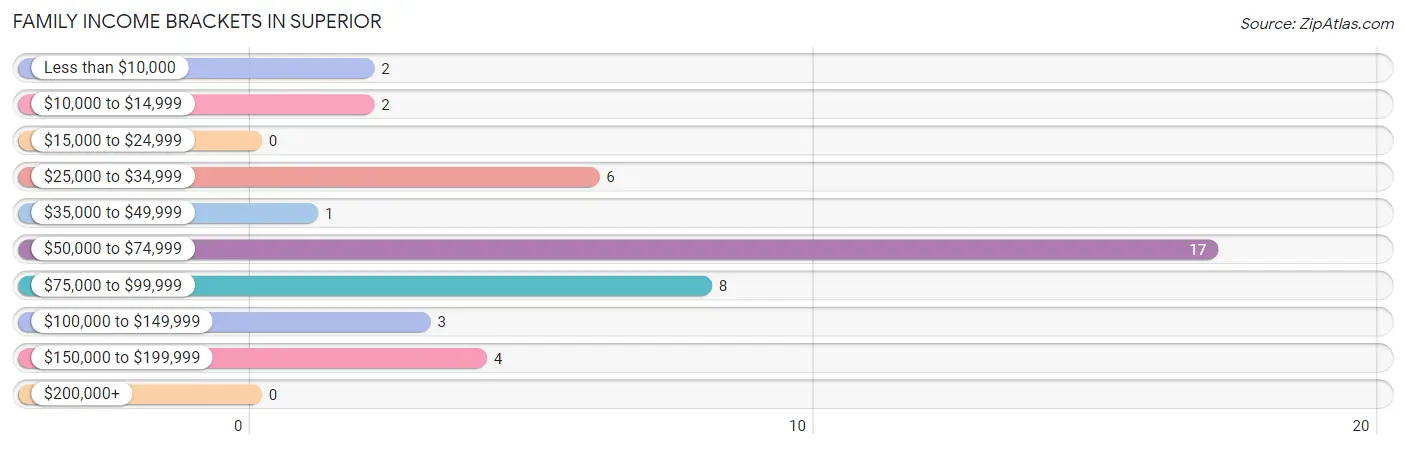
Family Income Brackets in Superior
According to the Superior family income data, there are 17 families falling into the $50,000 to $74,999 income range, which is the most common income bracket and makes up 39.5% of all families.
| Income Bracket | # Families | % Families |
| Less than $10,000 | 2 | 4.7% |
| $10,000 to $14,999 | 2 | 4.7% |
| $15,000 to $24,999 | 0 | 0.0% |
| $25,000 to $34,999 | 6 | 14.0% |
| $35,000 to $49,999 | 1 | 2.3% |
| $50,000 to $74,999 | 17 | 39.5% |
| $75,000 to $99,999 | 8 | 18.6% |
| $100,000 to $149,999 | 3 | 7.0% |
| $150,000 to $199,999 | 4 | 9.3% |
| $200,000+ | 0 | 0.0% |
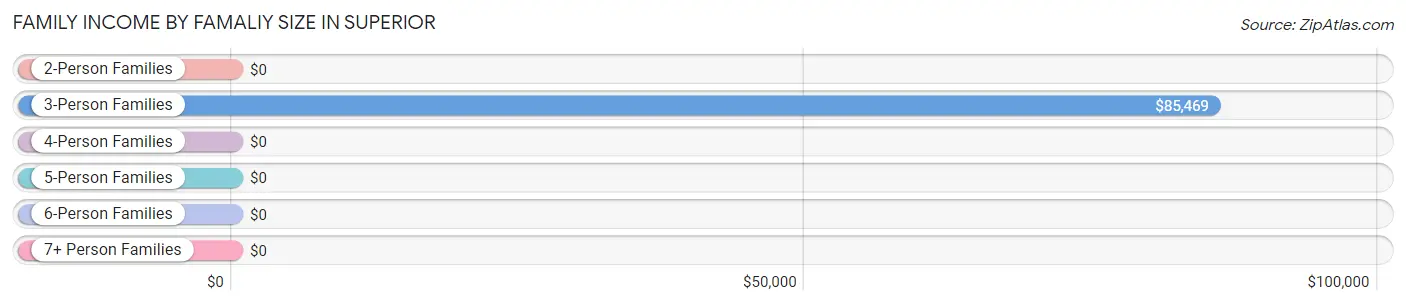
Family Income by Famaliy Size in Superior
3-person families (19 | 44.2%) account for the highest median family income in Superior with $85,469 per family, while 3-person families (19 | 44.2%) have the highest median income of $28,490 per family member.
| Income Bracket | # Families | Median Income |
| 2-Person Families | 17 (39.5%) | $0 |
| 3-Person Families | 19 (44.2%) | $85,469 |
| 4-Person Families | 2 (4.6%) | $0 |
| 5-Person Families | 3 (7.0%) | $0 |
| 6-Person Families | 0 (0.0%) | $0 |
| 7+ Person Families | 2 (4.6%) | $0 |
| Total | 43 (100.0%) | $57,125 |
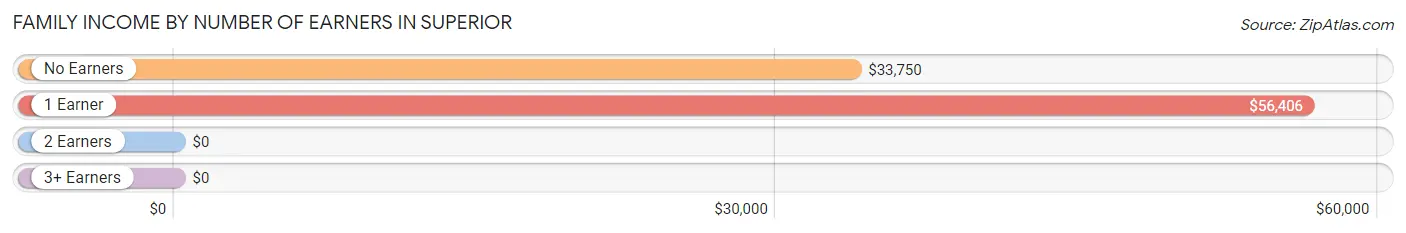
Family Income by Number of Earners in Superior
| Number of Earners | # Families | Median Income |
| No Earners | 10 (23.3%) | $33,750 |
| 1 Earner | 17 (39.5%) | $56,406 |
| 2 Earners | 10 (23.3%) | $0 |
| 3+ Earners | 6 (14.0%) | $0 |
| Total | 43 (100.0%) | $57,125 |
Household Income in Superior
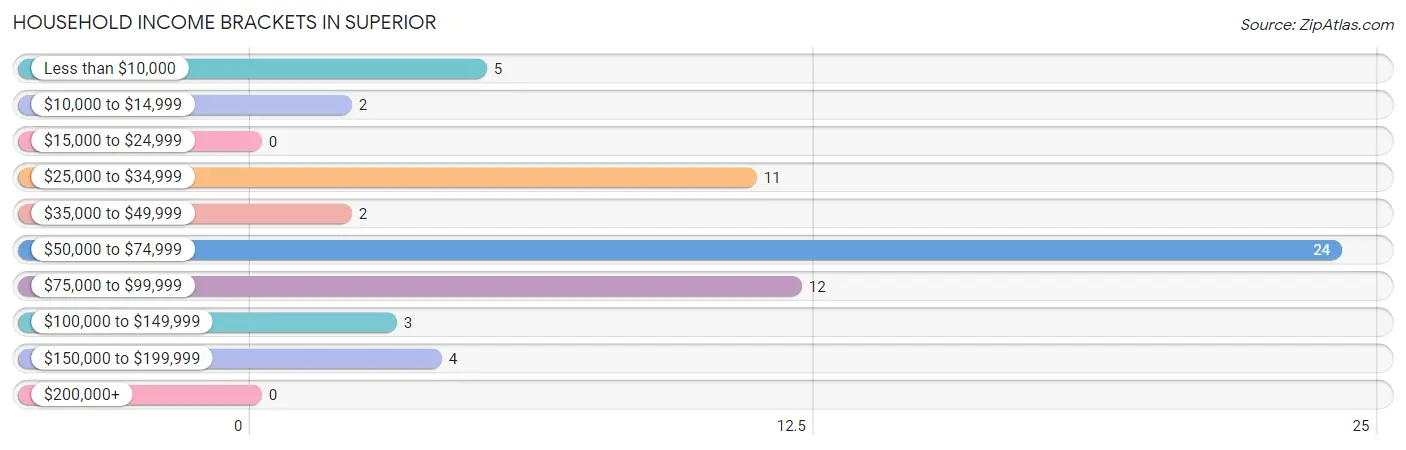
Household Income Brackets in Superior
With 24 households falling in the category, the $50,000 to $74,999 income range is the most frequent in Superior, accounting for 38.1% of all households.
| Income Bracket | # Households | % Households |
| Less than $10,000 | 5 | 7.9% |
| $10,000 to $14,999 | 2 | 3.2% |
| $15,000 to $24,999 | 0 | 0.0% |
| $25,000 to $34,999 | 11 | 17.5% |
| $35,000 to $49,999 | 2 | 3.2% |
| $50,000 to $74,999 | 24 | 38.1% |
| $75,000 to $99,999 | 12 | 19.0% |
| $100,000 to $149,999 | 3 | 4.8% |
| $150,000 to $199,999 | 4 | 6.3% |
| $200,000+ | 0 | 0.0% |
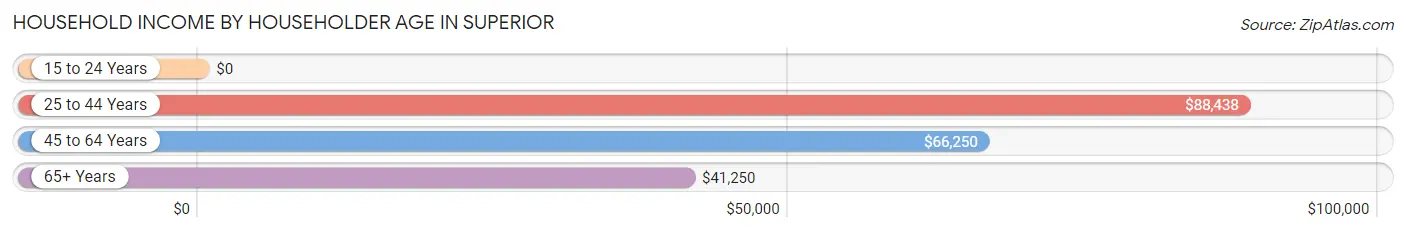
Household Income by Householder Age in Superior
The median household income in Superior is $56,125, with the highest median household income of $88,438 found in the 25 to 44 years age bracket for the primary householder. A total of 11 households (17.5%) fall into this category. Meanwhile, the 15 to 24 years age bracket for the primary householder has the lowest median household income of $0, with 3 households (4.8%) in this group.
| Income Bracket | # Households | Median Income |
| 15 to 24 Years | 3 (4.8%) | $0 |
| 25 to 44 Years | 11 (17.5%) | $88,438 |
| 45 to 64 Years | 27 (42.9%) | $66,250 |
| 65+ Years | 22 (34.9%) | $41,250 |
| Total | 63 (100.0%) | $56,125 |
Poverty in Superior
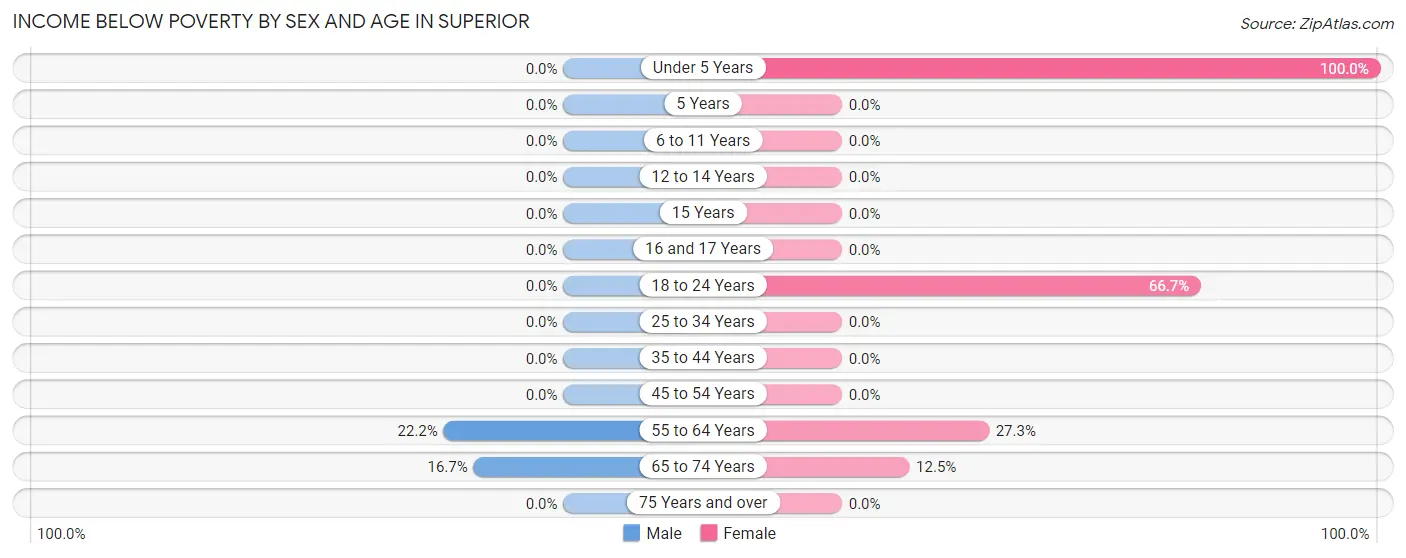
Income Below Poverty by Sex and Age in Superior
With 6.8% poverty level for males and 12.3% for females among the residents of Superior, 55 to 64 year old males and under 5 year old females are the most vulnerable to poverty, with 2 males (22.2%) and 3 females (100.0%) in their respective age groups living below the poverty level.
| Age Bracket | Male | Female |
| Under 5 Years | 0 (0.0%) | 3 (100.0%) |
| 5 Years | 0 (0.0%) | 0 (0.0%) |
| 6 to 11 Years | 0 (0.0%) | 0 (0.0%) |
| 12 to 14 Years | 0 (0.0%) | 0 (0.0%) |
| 15 Years | 0 (0.0%) | 0 (0.0%) |
| 16 and 17 Years | 0 (0.0%) | 0 (0.0%) |
| 18 to 24 Years | 0 (0.0%) | 2 (66.7%) |
| 25 to 34 Years | 0 (0.0%) | 0 (0.0%) |
| 35 to 44 Years | 0 (0.0%) | 0 (0.0%) |
| 45 to 54 Years | 0 (0.0%) | 0 (0.0%) |
| 55 to 64 Years | 2 (22.2%) | 3 (27.3%) |
| 65 to 74 Years | 2 (16.7%) | 2 (12.5%) |
| 75 Years and over | 0 (0.0%) | 0 (0.0%) |
| Total | 4 (6.8%) | 10 (12.3%) |
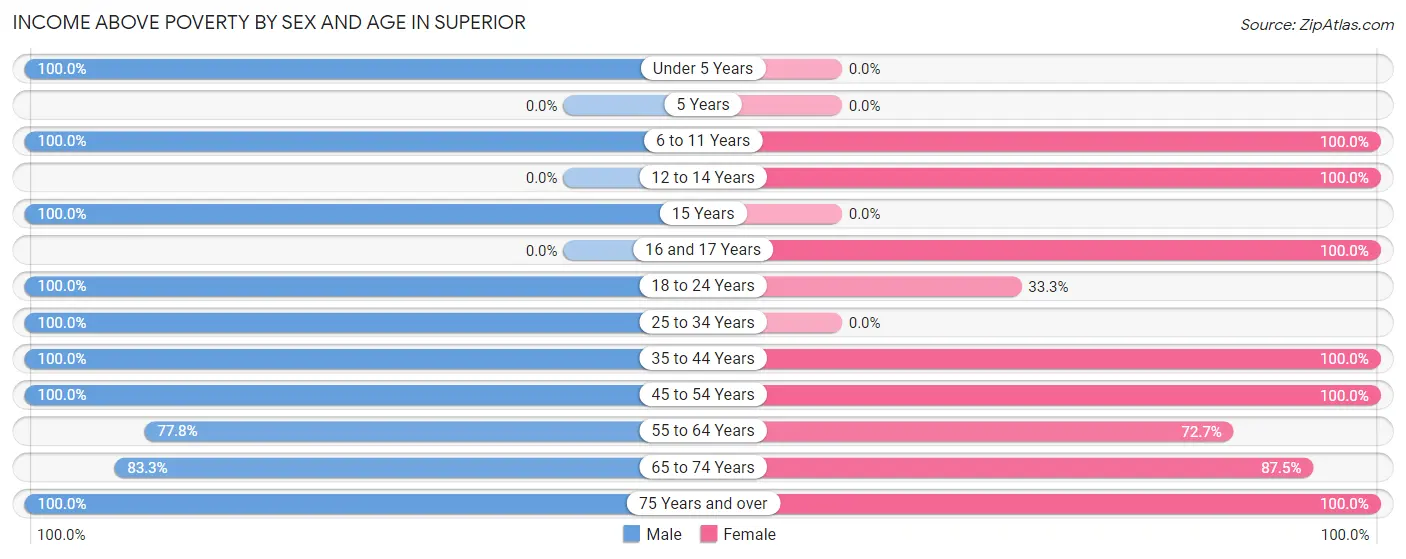
Income Above Poverty by Sex and Age in Superior
According to the poverty statistics in Superior, males aged under 5 years and females aged 6 to 11 years are the age groups that are most secure financially, with 100.0% of males and 100.0% of females in these age groups living above the poverty line.
| Age Bracket | Male | Female |
| Under 5 Years | 3 (100.0%) | 0 (0.0%) |
| 5 Years | 0 (0.0%) | 0 (0.0%) |
| 6 to 11 Years | 6 (100.0%) | 4 (100.0%) |
| 12 to 14 Years | 0 (0.0%) | 3 (100.0%) |
| 15 Years | 6 (100.0%) | 0 (0.0%) |
| 16 and 17 Years | 0 (0.0%) | 9 (100.0%) |
| 18 to 24 Years | 2 (100.0%) | 1 (33.3%) |
| 25 to 34 Years | 4 (100.0%) | 0 (0.0%) |
| 35 to 44 Years | 3 (100.0%) | 10 (100.0%) |
| 45 to 54 Years | 10 (100.0%) | 14 (100.0%) |
| 55 to 64 Years | 7 (77.8%) | 8 (72.7%) |
| 65 to 74 Years | 10 (83.3%) | 14 (87.5%) |
| 75 Years and over | 4 (100.0%) | 8 (100.0%) |
| Total | 55 (93.2%) | 71 (87.6%) |
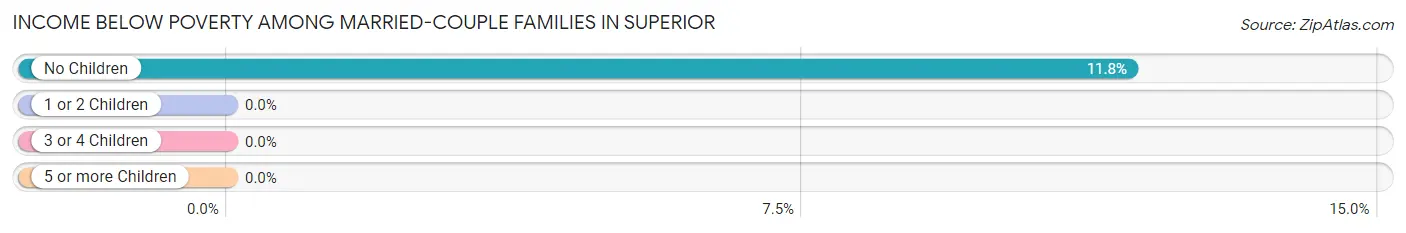
Income Below Poverty Among Married-Couple Families in Superior
The poverty statistics for married-couple families in Superior show that 5.7% or 2 of the total 35 families live below the poverty line. Families with no children have the highest poverty rate of 11.8%, comprising of 2 families. On the other hand, families with 1 or 2 children have the lowest poverty rate of 0.0%, which includes 0 families.
| Children | Above Poverty | Below Poverty |
| No Children | 15 (88.2%) | 2 (11.8%) |
| 1 or 2 Children | 16 (100.0%) | 0 (0.0%) |
| 3 or 4 Children | 2 (100.0%) | 0 (0.0%) |
| 5 or more Children | 0 (0.0%) | 0 (0.0%) |
| Total | 33 (94.3%) | 2 (5.7%) |
Income Below Poverty Among Single-Parent Households in Superior
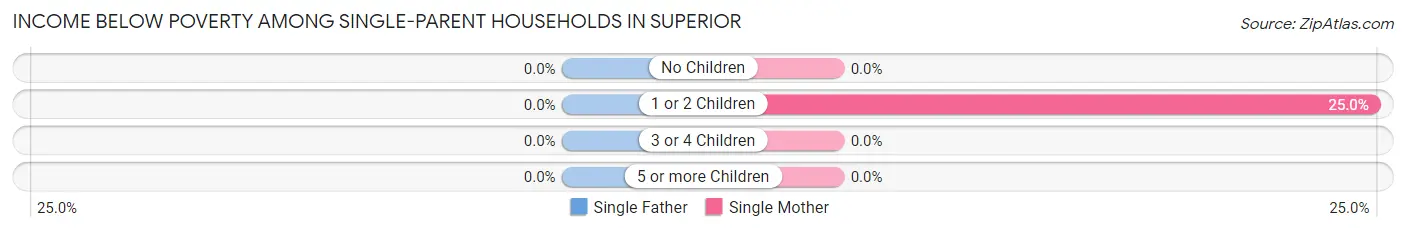
| Children | Single Father | Single Mother |
| No Children | 0 (0.0%) | 0 (0.0%) |
| 1 or 2 Children | 0 (0.0%) | 2 (25.0%) |
| 3 or 4 Children | 0 (0.0%) | 0 (0.0%) |
| 5 or more Children | 0 (0.0%) | 0 (0.0%) |
| Total | 0 (0.0%) | 2 (25.0%) |
Income Below Poverty Among Married-Couple vs Single-Parent Households in Superior
The poverty data for Superior shows that 2 of the married-couple family households (5.7%) and 2 of the single-parent households (25.0%) are living below the poverty level. Within the married-couple family households, those with no children have the highest poverty rate, with 2 households (11.8%) falling below the poverty line. Among the single-parent households, those with 1 or 2 children have the highest poverty rate, with 2 household (25.0%) living below poverty.
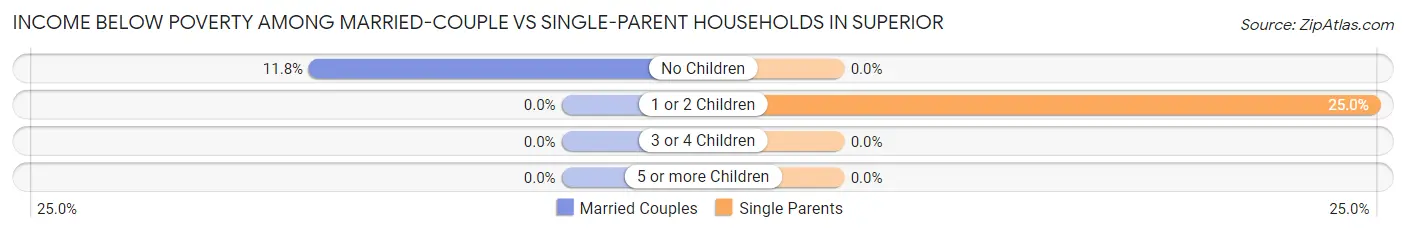
| Children | Married-Couple Families | Single-Parent Households |
| No Children | 2 (11.8%) | 0 (0.0%) |
| 1 or 2 Children | 0 (0.0%) | 2 (25.0%) |
| 3 or 4 Children | 0 (0.0%) | 0 (0.0%) |
| 5 or more Children | 0 (0.0%) | 0 (0.0%) |
| Total | 2 (5.7%) | 2 (25.0%) |
Race in Superior
The most populous races in Superior are , and White / Caucasian (143 | 100.0%).
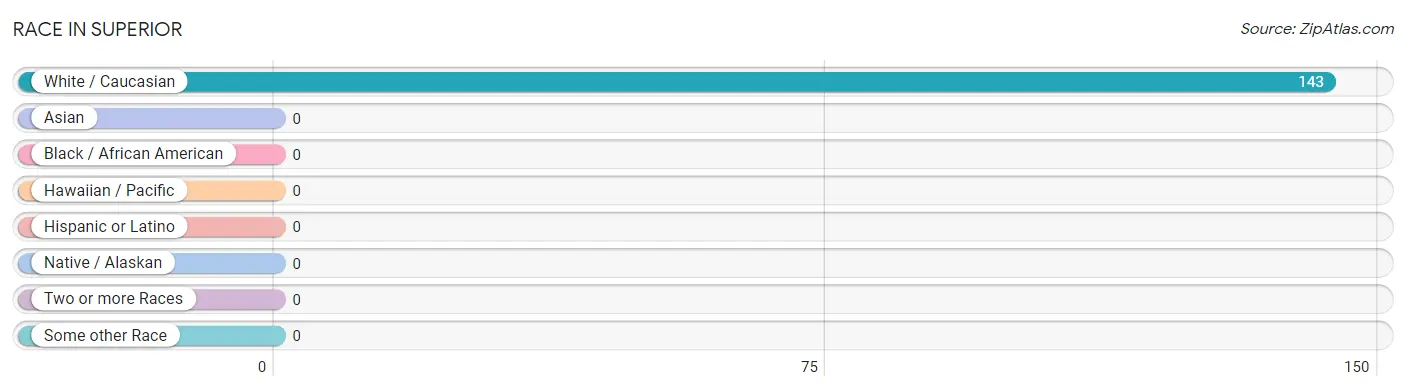
| Race | # Population | % Population |
| Asian | 0 | 0.0% |
| Black / African American | 0 | 0.0% |
| Hawaiian / Pacific | 0 | 0.0% |
| Hispanic or Latino | 0 | 0.0% |
| Native / Alaskan | 0 | 0.0% |
| White / Caucasian | 143 | 100.0% |
| Two or more Races | 0 | 0.0% |
| Some other Race | 0 | 0.0% |
| Total | 143 | 100.0% |
Ancestry in Superior
The most populous ancestries reported in Superior are German (69 | 48.2%), Irish (38 | 26.6%), Norwegian (19 | 13.3%), American (11 | 7.7%), and Northern European (8 | 5.6%), together accounting for 101.4% of all Superior residents.
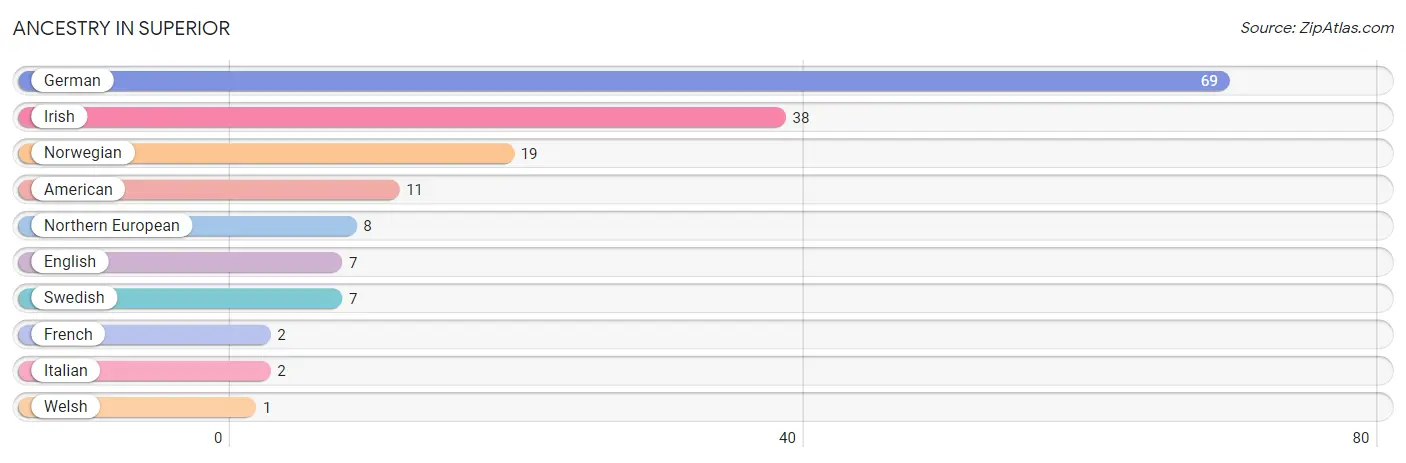
| Ancestry | # Population | % Population |
| American | 11 | 7.7% |
| English | 7 | 4.9% |
| French | 2 | 1.4% |
| German | 69 | 48.2% |
| Irish | 38 | 26.6% |
| Italian | 2 | 1.4% |
| Northern European | 8 | 5.6% |
| Norwegian | 19 | 13.3% |
| Swedish | 7 | 4.9% |
| Welsh | 1 | 0.7% | View All 10 Rows |
Immigrants in Superior

| Immigration Origin | # Population | % Population | View All 0 Rows |
Sex and Age in Superior
Sex and Age in Superior
The most populous age groups in Superior are 45 to 49 Years (8 | 12.9%) for men and 65 to 69 Years (12 | 14.8%) for women.
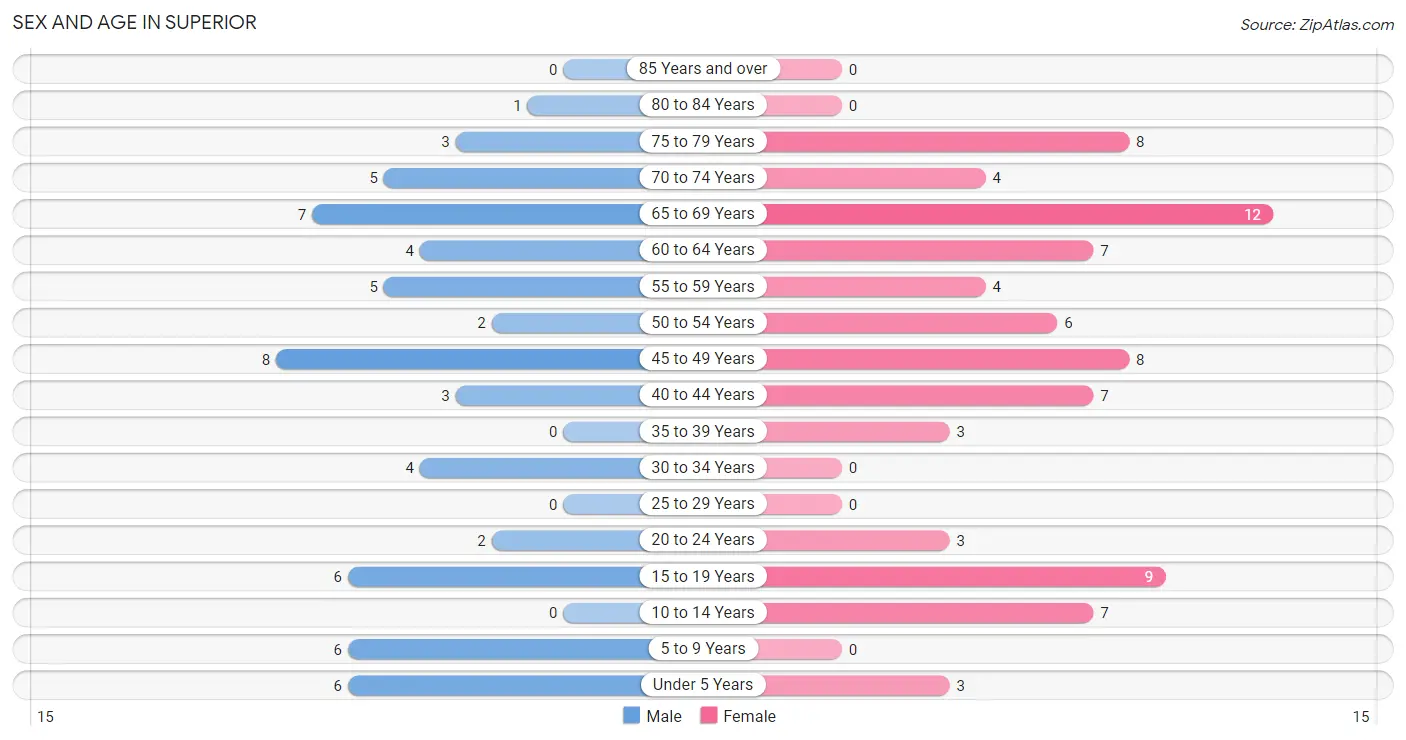
| Age Bracket | Male | Female |
| Under 5 Years | 6 (9.7%) | 3 (3.7%) |
| 5 to 9 Years | 6 (9.7%) | 0 (0.0%) |
| 10 to 14 Years | 0 (0.0%) | 7 (8.6%) |
| 15 to 19 Years | 6 (9.7%) | 9 (11.1%) |
| 20 to 24 Years | 2 (3.2%) | 3 (3.7%) |
| 25 to 29 Years | 0 (0.0%) | 0 (0.0%) |
| 30 to 34 Years | 4 (6.5%) | 0 (0.0%) |
| 35 to 39 Years | 0 (0.0%) | 3 (3.7%) |
| 40 to 44 Years | 3 (4.8%) | 7 (8.6%) |
| 45 to 49 Years | 8 (12.9%) | 8 (9.9%) |
| 50 to 54 Years | 2 (3.2%) | 6 (7.4%) |
| 55 to 59 Years | 5 (8.1%) | 4 (4.9%) |
| 60 to 64 Years | 4 (6.5%) | 7 (8.6%) |
| 65 to 69 Years | 7 (11.3%) | 12 (14.8%) |
| 70 to 74 Years | 5 (8.1%) | 4 (4.9%) |
| 75 to 79 Years | 3 (4.8%) | 8 (9.9%) |
| 80 to 84 Years | 1 (1.6%) | 0 (0.0%) |
| 85 Years and over | 0 (0.0%) | 0 (0.0%) |
| Total | 62 (100.0%) | 81 (100.0%) |
Families and Households in Superior
Median Family Size in Superior
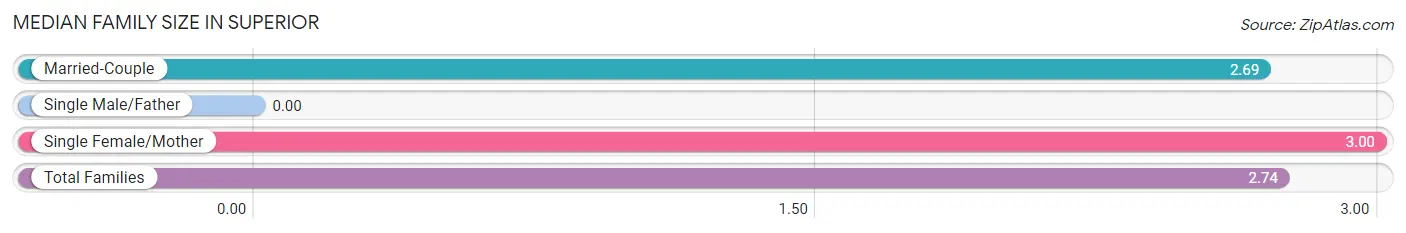
| Family Type | # Families | Family Size |
| Married-Couple | 35 (81.4%) | 2.69 |
| Single Male/Father | 0 (0.0%) | - |
| Single Female/Mother | 8 (18.6%) | 3.00 |
| Total Families | 43 (100.0%) | 2.74 |
Median Household Size in Superior
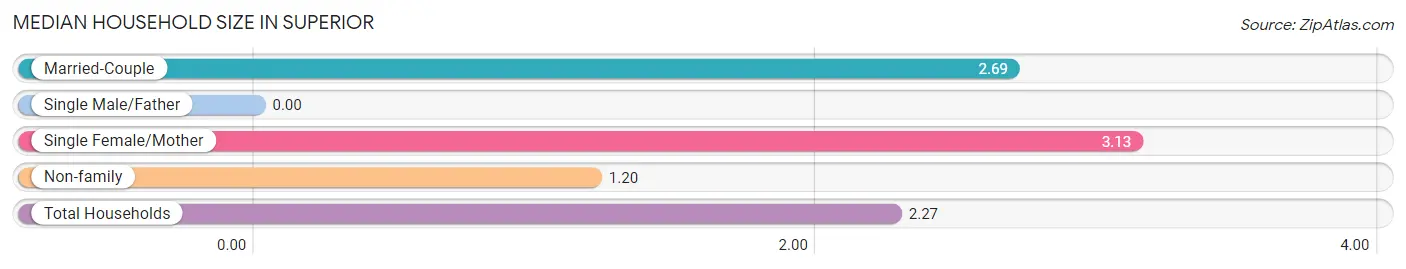
| Household Type | # Households | Household Size |
| Married-Couple | 35 (55.6%) | 2.69 |
| Single Male/Father | 0 (0.0%) | - |
| Single Female/Mother | 8 (12.7%) | 3.13 |
| Non-family | 20 (31.8%) | 1.20 |
| Total Households | 63 (100.0%) | 2.27 |
Household Size by Marriage Status in Superior
Out of a total of 63 households in Superior, 43 (68.2%) are family households, while 20 (31.8%) are nonfamily households. The most numerous type of family households are 3-person households, comprising 21, and the most common type of nonfamily households are 1-person households, comprising 16.
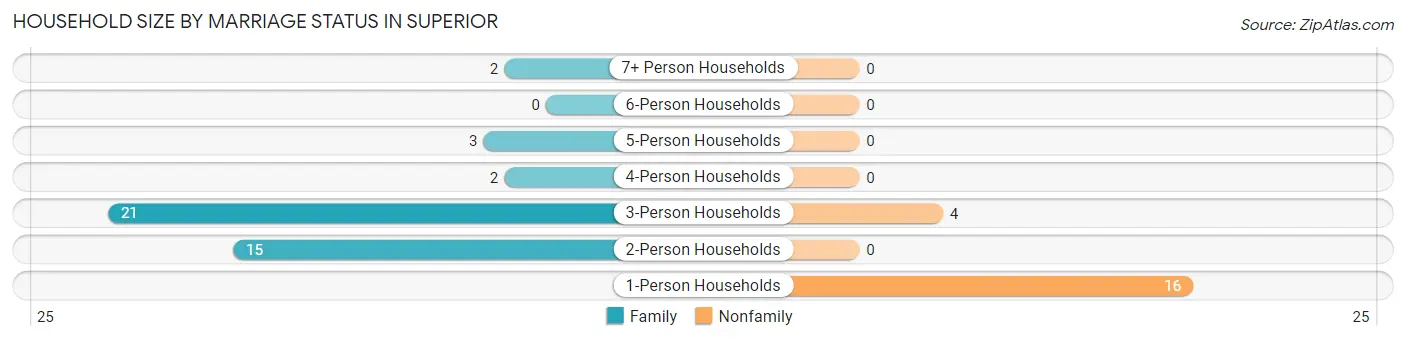
| Household Size | Family Households | Nonfamily Households |
| 1-Person Households | - | 16 (25.4%) |
| 2-Person Households | 15 (23.8%) | 0 (0.0%) |
| 3-Person Households | 21 (33.3%) | 4 (6.4%) |
| 4-Person Households | 2 (3.2%) | 0 (0.0%) |
| 5-Person Households | 3 (4.8%) | 0 (0.0%) |
| 6-Person Households | 0 (0.0%) | 0 (0.0%) |
| 7+ Person Households | 2 (3.2%) | 0 (0.0%) |
| Total | 43 (68.2%) | 20 (31.8%) |
Female Fertility in Superior
Fertility by Age in Superior
| Age Bracket | Women with Births | Births / 1,000 Women |
| 15 to 19 years | 0 (0.0%) | 0.0 |
| 20 to 34 years | 0 (0.0%) | 0.0 |
| 35 to 50 years | 0 (0.0%) | 0.0 |
| Total | 0 (0.0%) | 0.0 |
Fertility by Age by Marriage Status in Superior
| Age Bracket | Married | Unmarried |
| 15 to 19 years | 0 (0.0%) | 0 (0.0%) |
| 20 to 34 years | 0 (0.0%) | 0 (0.0%) |
| 35 to 50 years | 0 (0.0%) | 0 (0.0%) |
| Total | 0 (0.0%) | 0 (0.0%) |
Fertility by Education in Superior
| Educational Attainment | Women with Births | Births / 1,000 Women |
| Less than High School | 0 (0.0%) | 0.0 |
| High School Diploma | 0 (0.0%) | 0.0 |
| College or Associate's Degree | 0 (0.0%) | 0.0 |
| Bachelor's Degree | 0 (0.0%) | 0.0 |
| Graduate Degree | 0 (0.0%) | 0.0 |
| Total | 0 (0.0%) | 0.0 |
Fertility by Education by Marriage Status in Superior
| Educational Attainment | Married | Unmarried |
| Less than High School | 0 (0.0%) | 0 (0.0%) |
| High School Diploma | 0 (0.0%) | 0 (0.0%) |
| College or Associate's Degree | 0 (0.0%) | 0 (0.0%) |
| Bachelor's Degree | 0 (0.0%) | 0 (0.0%) |
| Graduate Degree | 0 (0.0%) | 0 (0.0%) |
| Total | 0 (0.0%) | 0 (0.0%) |
Employment Characteristics in Superior
Employment by Class of Employer in Superior
Among the 57 employed individuals in Superior, private company employees (47 | 82.5%), not-for-profit organizations (3 | 5.3%), and local government employees (3 | 5.3%) make up the most common classes of employment.
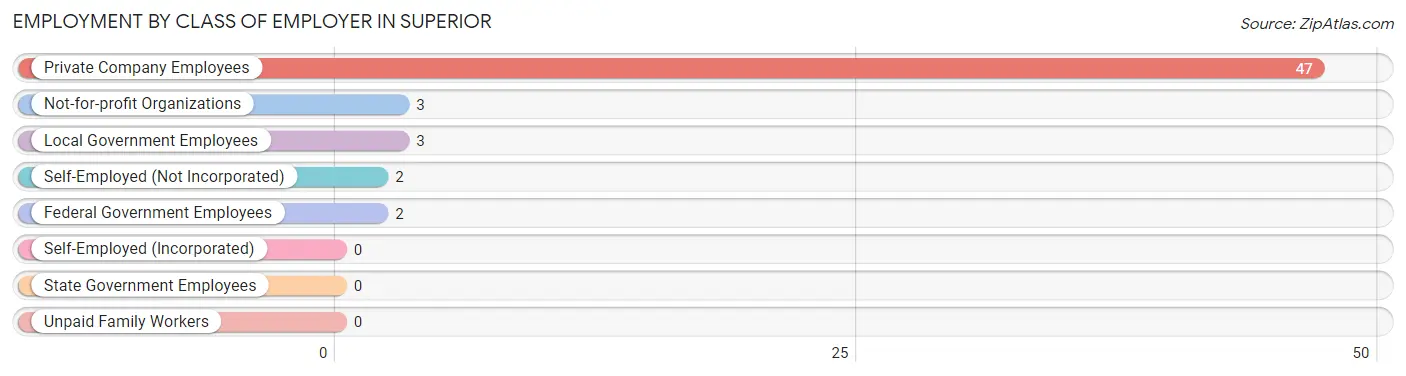
| Employer Class | # Employees | % Employees |
| Private Company Employees | 47 | 82.5% |
| Self-Employed (Incorporated) | 0 | 0.0% |
| Self-Employed (Not Incorporated) | 2 | 3.5% |
| Not-for-profit Organizations | 3 | 5.3% |
| Local Government Employees | 3 | 5.3% |
| State Government Employees | 0 | 0.0% |
| Federal Government Employees | 2 | 3.5% |
| Unpaid Family Workers | 0 | 0.0% |
| Total | 57 | 100.0% |
Employment Status by Age in Superior
According to the labor force statistics for Superior, out of the total population over 16 years of age (115), 53.0% or 61 individuals are in the labor force, with 6.6% or 4 of them unemployed. The age group with the highest labor force participation rate is 30 to 34 years, with 100.0% or 4 individuals in the labor force. Within the labor force, the 16 to 19 years age range has the highest percentage of unemployed individuals, with 100.0% or 2 of them being unemployed.
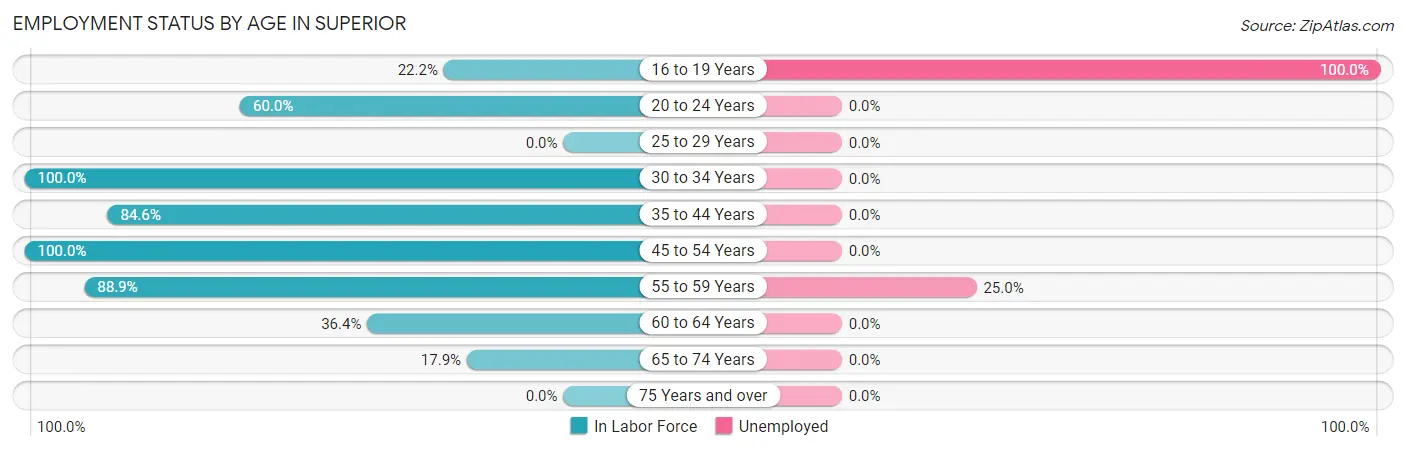
| Age Bracket | In Labor Force | Unemployed |
| 16 to 19 Years | 2 (22.2%) | 2 (100.0%) |
| 20 to 24 Years | 3 (60.0%) | 0 (0.0%) |
| 25 to 29 Years | 0 (0.0%) | 0 (0.0%) |
| 30 to 34 Years | 4 (100.0%) | 0 (0.0%) |
| 35 to 44 Years | 11 (84.6%) | 0 (0.0%) |
| 45 to 54 Years | 24 (100.0%) | 0 (0.0%) |
| 55 to 59 Years | 8 (88.9%) | 2 (25.0%) |
| 60 to 64 Years | 4 (36.4%) | 0 (0.0%) |
| 65 to 74 Years | 5 (17.9%) | 0 (0.0%) |
| 75 Years and over | 0 (0.0%) | 0 (0.0%) |
| Total | 61 (53.0%) | 4 (6.6%) |
Employment Status by Educational Attainment in Superior
According to labor force statistics for Superior, 83.6% of individuals (51) out of the total population between 25 and 64 years of age (61) are in the labor force, with 3.9% or 2 of them being unemployed. The group with the highest labor force participation rate are those with the educational attainment of less than high school, with 100.0% or 2 individuals in the labor force. Within the labor force, individuals with less than high school education have the highest percentage of unemployment, with 100.0% or 2 of them being unemployed.
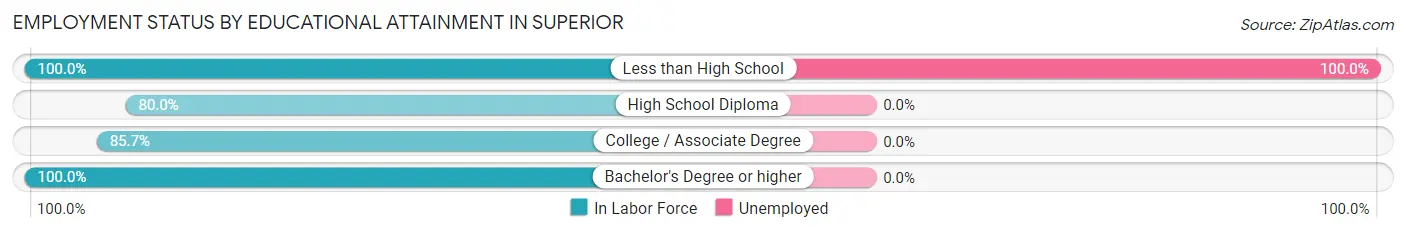
| Educational Attainment | In Labor Force | Unemployed |
| Less than High School | 2 (100.0%) | 2 (100.0%) |
| High School Diploma | 28 (80.0%) | 0 (0.0%) |
| College / Associate Degree | 18 (85.7%) | 0 (0.0%) |
| Bachelor's Degree or higher | 3 (100.0%) | 0 (0.0%) |
| Total | 51 (83.6%) | 2 (3.9%) |
Employment Occupations by Sex in Superior
Management, Business, Science and Arts Occupations
The most common Management, Business, Science and Arts occupations in Superior are , and Business & Financial (8 | 14.0%).
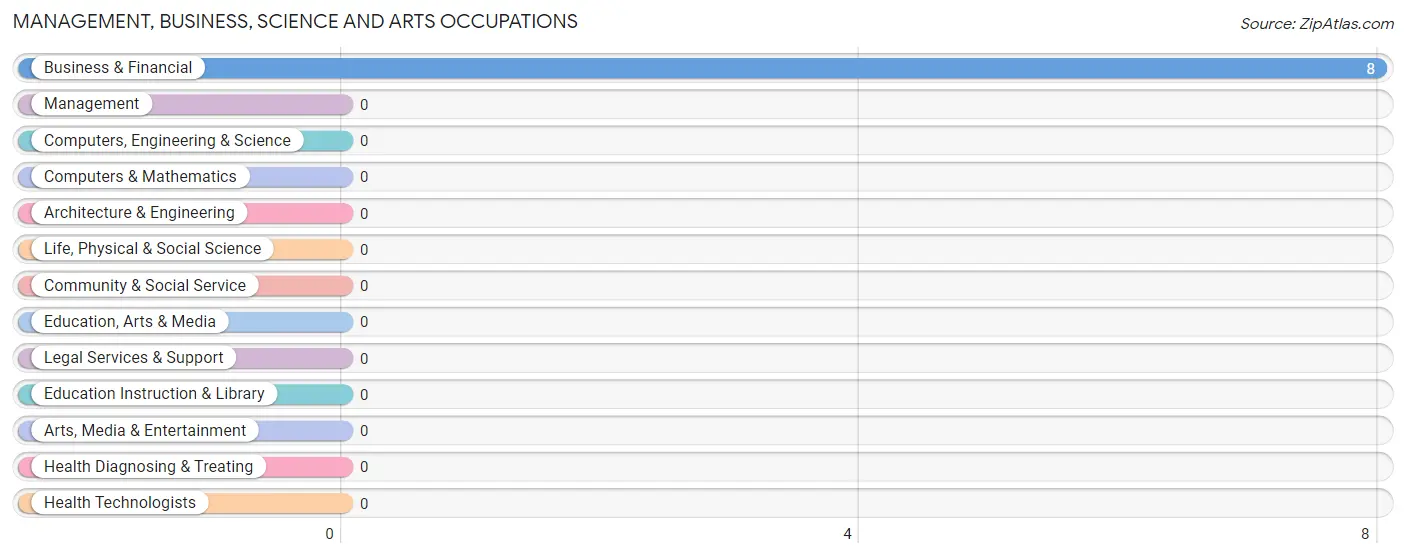
Management, Business, Science and Arts Occupations by Sex
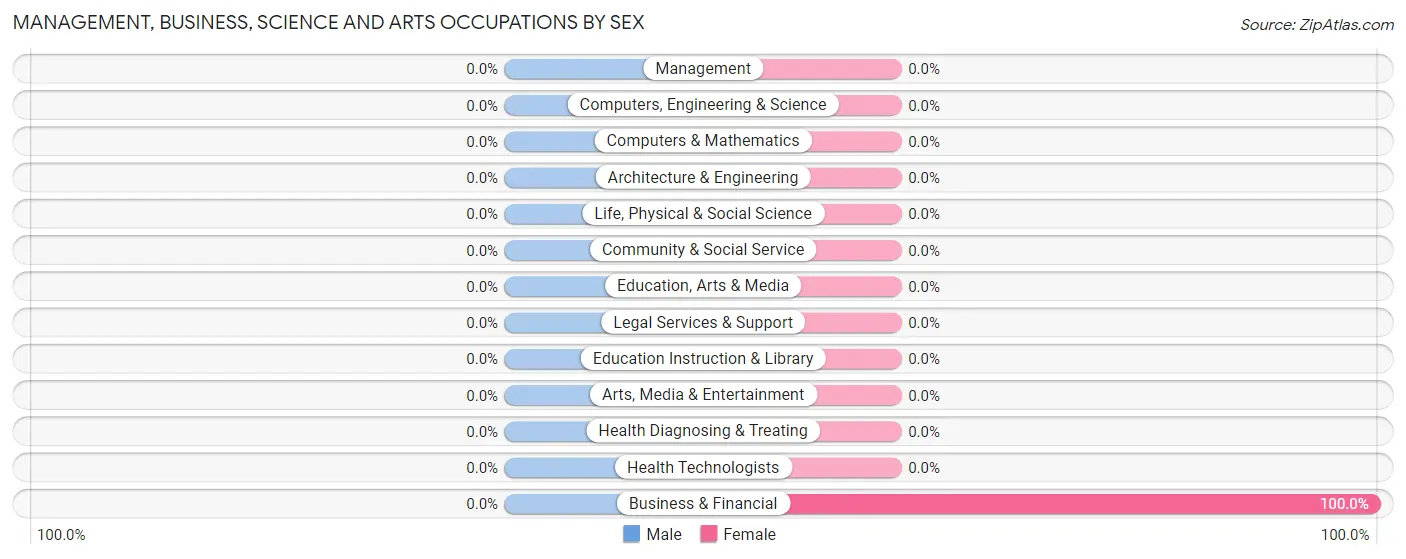
| Occupation | Male | Female |
| Management | 0 (0.0%) | 0 (0.0%) |
| Business & Financial | 0 (0.0%) | 8 (100.0%) |
| Computers, Engineering & Science | 0 (0.0%) | 0 (0.0%) |
| Computers & Mathematics | 0 (0.0%) | 0 (0.0%) |
| Architecture & Engineering | 0 (0.0%) | 0 (0.0%) |
| Life, Physical & Social Science | 0 (0.0%) | 0 (0.0%) |
| Community & Social Service | 0 (0.0%) | 0 (0.0%) |
| Education, Arts & Media | 0 (0.0%) | 0 (0.0%) |
| Legal Services & Support | 0 (0.0%) | 0 (0.0%) |
| Education Instruction & Library | 0 (0.0%) | 0 (0.0%) |
| Arts, Media & Entertainment | 0 (0.0%) | 0 (0.0%) |
| Health Diagnosing & Treating | 0 (0.0%) | 0 (0.0%) |
| Health Technologists | 0 (0.0%) | 0 (0.0%) |
| Total (Category) | 0 (0.0%) | 8 (100.0%) |
| Total (Overall) | 27 (47.4%) | 30 (52.6%) |
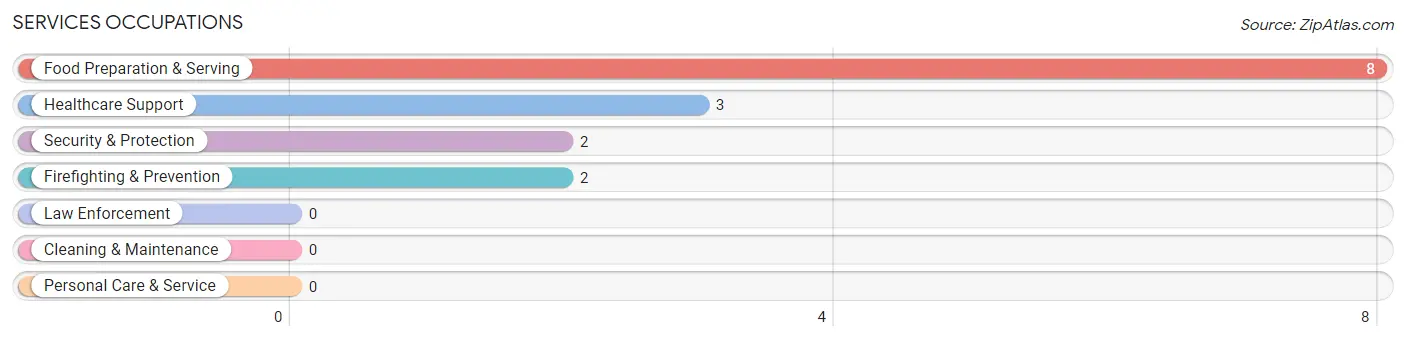
Services Occupations
The most common Services occupations in Superior are Food Preparation & Serving (8 | 14.0%), Healthcare Support (3 | 5.3%), Security & Protection (2 | 3.5%), and Firefighting & Prevention (2 | 3.5%).
Services Occupations by Sex
Within the Services occupations in Superior, the most male-oriented occupations are Security & Protection (100.0%), and Firefighting & Prevention (100.0%), while the most female-oriented occupations are Healthcare Support (100.0%), and Food Preparation & Serving (100.0%).
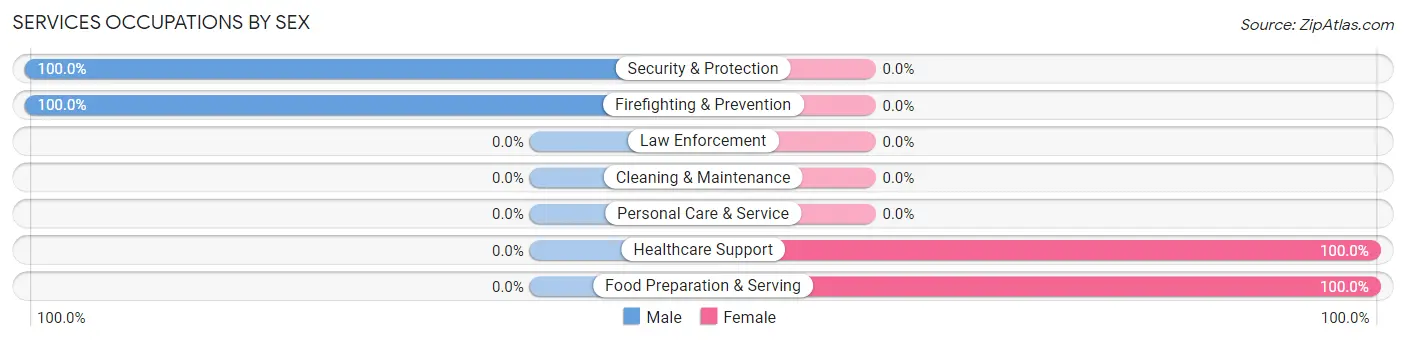
| Occupation | Male | Female |
| Healthcare Support | 0 (0.0%) | 3 (100.0%) |
| Security & Protection | 2 (100.0%) | 0 (0.0%) |
| Firefighting & Prevention | 2 (100.0%) | 0 (0.0%) |
| Law Enforcement | 0 (0.0%) | 0 (0.0%) |
| Food Preparation & Serving | 0 (0.0%) | 8 (100.0%) |
| Cleaning & Maintenance | 0 (0.0%) | 0 (0.0%) |
| Personal Care & Service | 0 (0.0%) | 0 (0.0%) |
| Total (Category) | 2 (15.4%) | 11 (84.6%) |
| Total (Overall) | 27 (47.4%) | 30 (52.6%) |
Sales and Office Occupations
The most common Sales and Office occupations in Superior are Office & Administration (5 | 8.8%), and Sales & Related (4 | 7.0%).
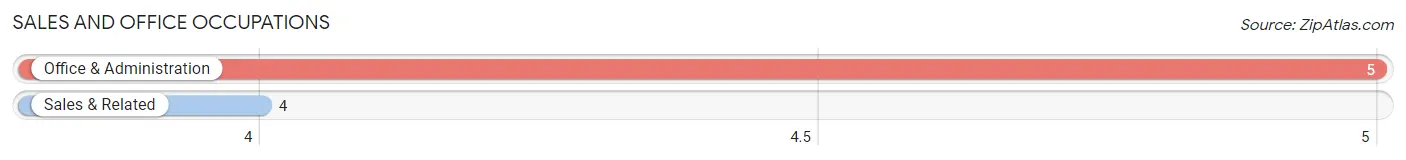
Sales and Office Occupations by Sex
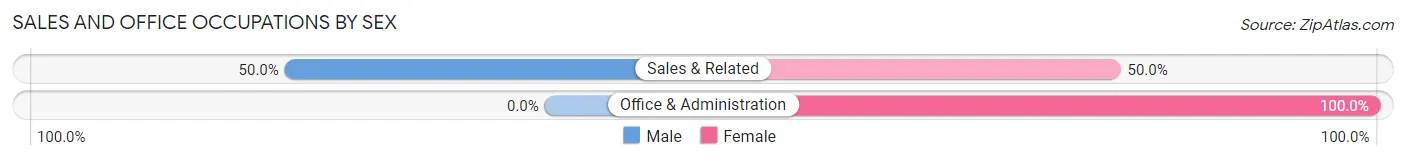
| Occupation | Male | Female |
| Sales & Related | 2 (50.0%) | 2 (50.0%) |
| Office & Administration | 0 (0.0%) | 5 (100.0%) |
| Total (Category) | 2 (22.2%) | 7 (77.8%) |
| Total (Overall) | 27 (47.4%) | 30 (52.6%) |
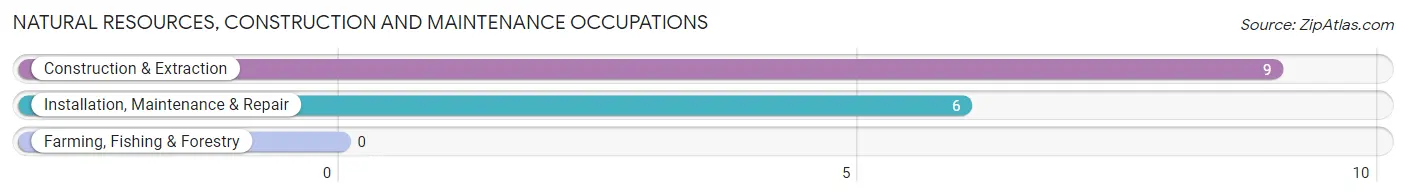
Natural Resources, Construction and Maintenance Occupations
The most common Natural Resources, Construction and Maintenance occupations in Superior are Construction & Extraction (9 | 15.8%), and Installation, Maintenance & Repair (6 | 10.5%).
Natural Resources, Construction and Maintenance Occupations by Sex
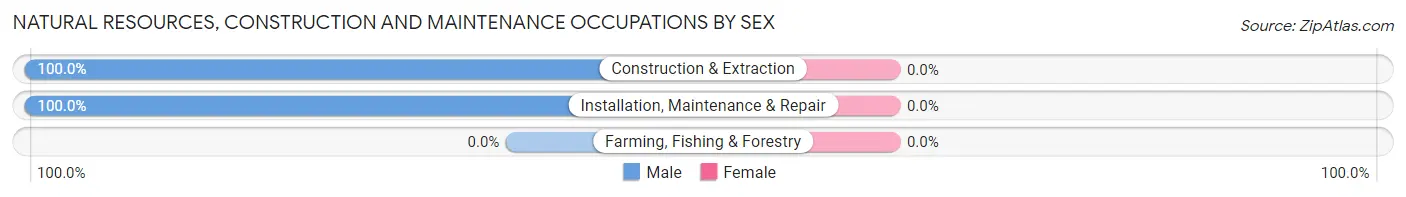
| Occupation | Male | Female |
| Farming, Fishing & Forestry | 0 (0.0%) | 0 (0.0%) |
| Construction & Extraction | 9 (100.0%) | 0 (0.0%) |
| Installation, Maintenance & Repair | 6 (100.0%) | 0 (0.0%) |
| Total (Category) | 15 (100.0%) | 0 (0.0%) |
| Total (Overall) | 27 (47.4%) | 30 (52.6%) |
Production, Transportation and Moving Occupations
The most common Production, Transportation and Moving occupations in Superior are Production (8 | 14.0%), Transportation (2 | 3.5%), and Material Moving (2 | 3.5%).
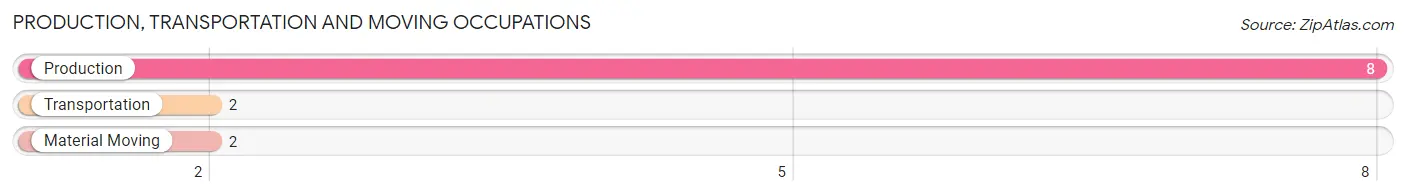
Production, Transportation and Moving Occupations by Sex
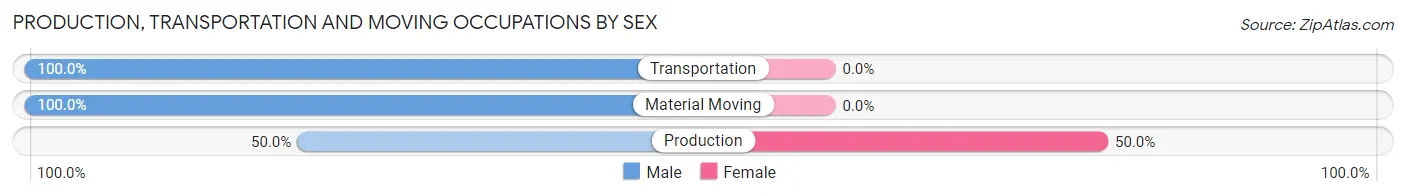
| Occupation | Male | Female |
| Production | 4 (50.0%) | 4 (50.0%) |
| Transportation | 2 (100.0%) | 0 (0.0%) |
| Material Moving | 2 (100.0%) | 0 (0.0%) |
| Total (Category) | 8 (66.7%) | 4 (33.3%) |
| Total (Overall) | 27 (47.4%) | 30 (52.6%) |
Employment Industries by Sex in Superior
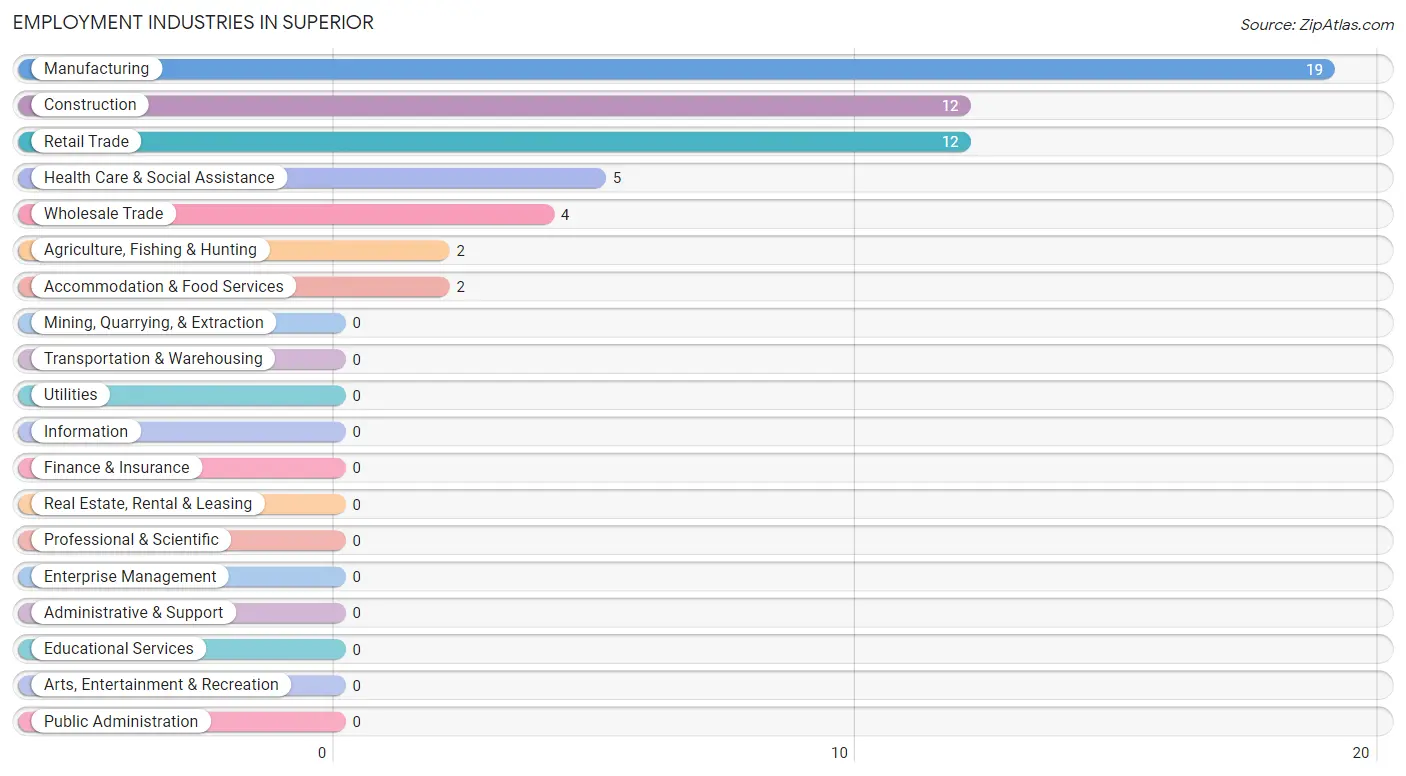
Employment Industries in Superior
The major employment industries in Superior include Manufacturing (19 | 33.3%), Construction (12 | 21.0%), Retail Trade (12 | 21.0%), Health Care & Social Assistance (5 | 8.8%), and Wholesale Trade (4 | 7.0%).
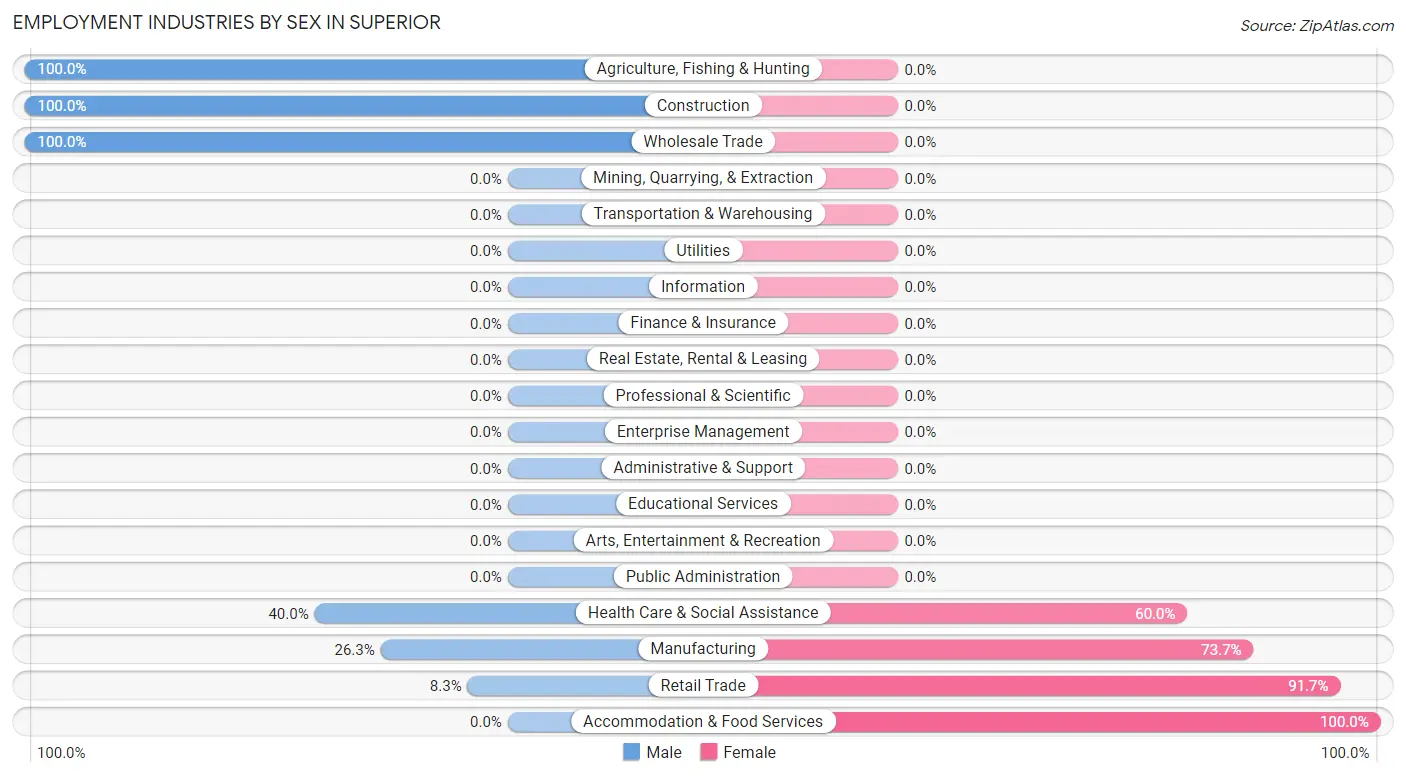
Employment Industries by Sex in Superior
The Superior industries that see more men than women are Agriculture, Fishing & Hunting (100.0%), Construction (100.0%), and Wholesale Trade (100.0%), whereas the industries that tend to have a higher number of women are Accommodation & Food Services (100.0%), Retail Trade (91.7%), and Manufacturing (73.7%).
| Industry | Male | Female |
| Agriculture, Fishing & Hunting | 2 (100.0%) | 0 (0.0%) |
| Mining, Quarrying, & Extraction | 0 (0.0%) | 0 (0.0%) |
| Construction | 12 (100.0%) | 0 (0.0%) |
| Manufacturing | 5 (26.3%) | 14 (73.7%) |
| Wholesale Trade | 4 (100.0%) | 0 (0.0%) |
| Retail Trade | 1 (8.3%) | 11 (91.7%) |
| Transportation & Warehousing | 0 (0.0%) | 0 (0.0%) |
| Utilities | 0 (0.0%) | 0 (0.0%) |
| Information | 0 (0.0%) | 0 (0.0%) |
| Finance & Insurance | 0 (0.0%) | 0 (0.0%) |
| Real Estate, Rental & Leasing | 0 (0.0%) | 0 (0.0%) |
| Professional & Scientific | 0 (0.0%) | 0 (0.0%) |
| Enterprise Management | 0 (0.0%) | 0 (0.0%) |
| Administrative & Support | 0 (0.0%) | 0 (0.0%) |
| Educational Services | 0 (0.0%) | 0 (0.0%) |
| Health Care & Social Assistance | 2 (40.0%) | 3 (60.0%) |
| Arts, Entertainment & Recreation | 0 (0.0%) | 0 (0.0%) |
| Accommodation & Food Services | 0 (0.0%) | 2 (100.0%) |
| Public Administration | 0 (0.0%) | 0 (0.0%) |
| Total | 27 (47.4%) | 30 (52.6%) |
Education in Superior
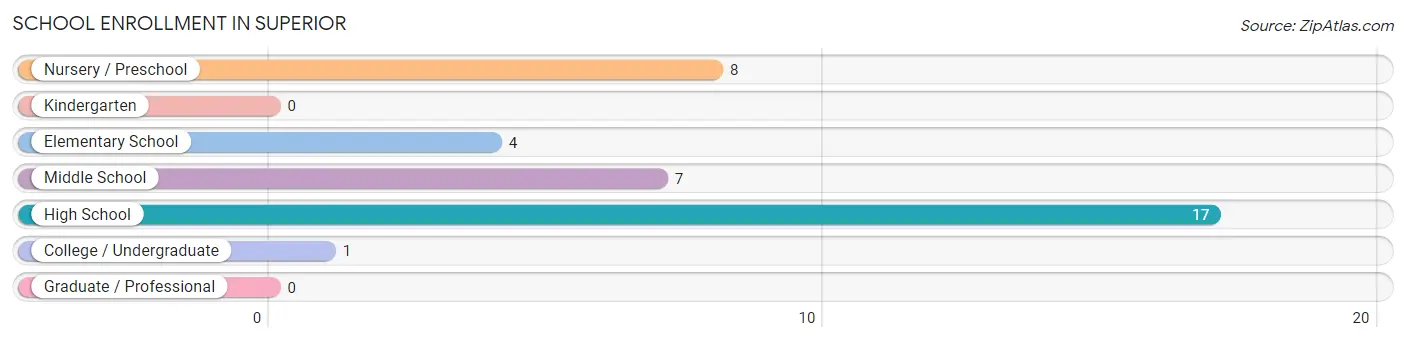
School Enrollment in Superior
The most common levels of schooling among the 37 students in Superior are high school (17 | 46.0%), nursery / preschool (8 | 21.6%), and middle school (7 | 18.9%).
| School Level | # Students | % Students |
| Nursery / Preschool | 8 | 21.6% |
| Kindergarten | 0 | 0.0% |
| Elementary School | 4 | 10.8% |
| Middle School | 7 | 18.9% |
| High School | 17 | 46.0% |
| College / Undergraduate | 1 | 2.7% |
| Graduate / Professional | 0 | 0.0% |
| Total | 37 | 100.0% |
School Enrollment by Age by Funding Source in Superior
Out of a total of 37 students who are enrolled in schools in Superior, 9 (24.3%) attend a private institution, while the remaining 28 (75.7%) are enrolled in public schools. The age group of 5 to 9 year old has the highest likelihood of being enrolled in private schools, with 4 (66.7% in the age bracket) enrolled. Conversely, the age group of 15 to 17 year olds has the lowest likelihood of being enrolled in a private school, with 15 (100.0% in the age bracket) attending a public institution.
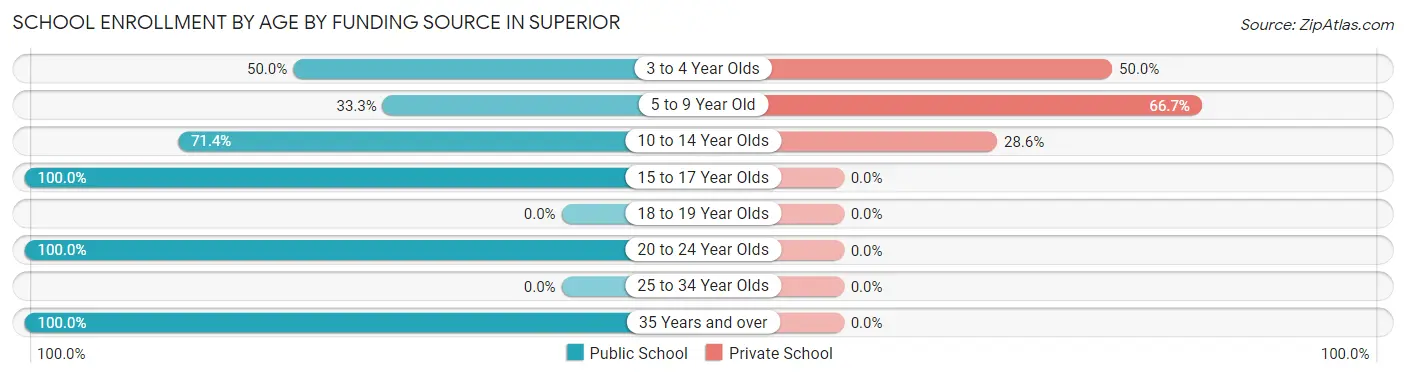
| Age Bracket | Public School | Private School |
| 3 to 4 Year Olds | 3 (50.0%) | 3 (50.0%) |
| 5 to 9 Year Old | 2 (33.3%) | 4 (66.7%) |
| 10 to 14 Year Olds | 5 (71.4%) | 2 (28.6%) |
| 15 to 17 Year Olds | 15 (100.0%) | 0 (0.0%) |
| 18 to 19 Year Olds | 0 (0.0%) | 0 (0.0%) |
| 20 to 24 Year Olds | 1 (100.0%) | 0 (0.0%) |
| 25 to 34 Year Olds | 0 (0.0%) | 0 (0.0%) |
| 35 Years and over | 2 (100.0%) | 0 (0.0%) |
| Total | 28 (75.7%) | 9 (24.3%) |
Educational Attainment by Field of Study in Superior
, and education (6 | 100.0%) are the most common fields of study among 6 individuals in Superior who have obtained a bachelor's degree or higher.
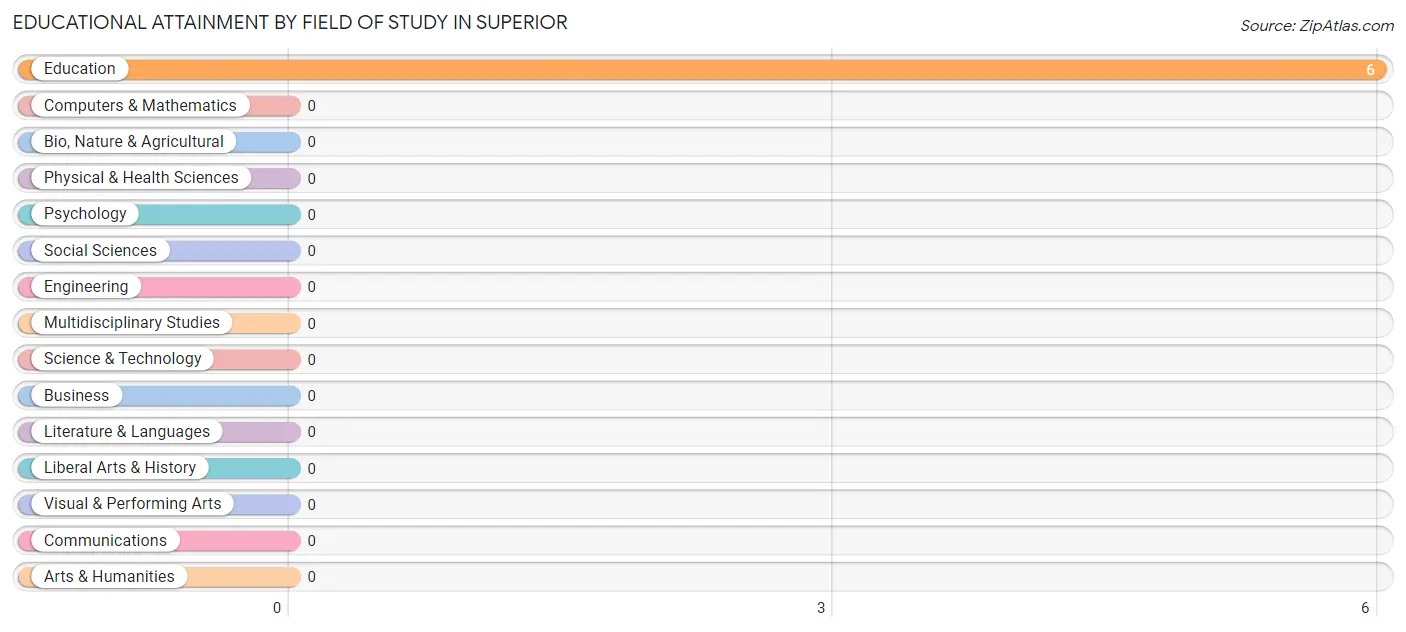
| Field of Study | # Graduates | % Graduates |
| Computers & Mathematics | 0 | 0.0% |
| Bio, Nature & Agricultural | 0 | 0.0% |
| Physical & Health Sciences | 0 | 0.0% |
| Psychology | 0 | 0.0% |
| Social Sciences | 0 | 0.0% |
| Engineering | 0 | 0.0% |
| Multidisciplinary Studies | 0 | 0.0% |
| Science & Technology | 0 | 0.0% |
| Business | 0 | 0.0% |
| Education | 6 | 100.0% |
| Literature & Languages | 0 | 0.0% |
| Liberal Arts & History | 0 | 0.0% |
| Visual & Performing Arts | 0 | 0.0% |
| Communications | 0 | 0.0% |
| Arts & Humanities | 0 | 0.0% |
| Total | 6 | 100.0% |
Transportation & Commute in Superior
Vehicle Availability by Sex in Superior
The most prevalent vehicle ownership categories in Superior are males with 4 vehicles (13, accounting for 48.1%) and females with 4 vehicles (11, making up 43.3%).
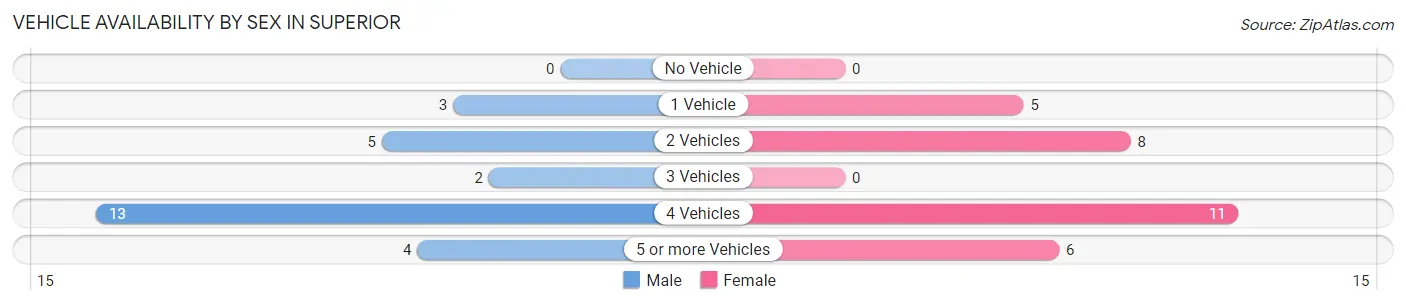
| Vehicles Available | Male | Female |
| No Vehicle | 0 (0.0%) | 0 (0.0%) |
| 1 Vehicle | 3 (11.1%) | 5 (16.7%) |
| 2 Vehicles | 5 (18.5%) | 8 (26.7%) |
| 3 Vehicles | 2 (7.4%) | 0 (0.0%) |
| 4 Vehicles | 13 (48.1%) | 11 (36.7%) |
| 5 or more Vehicles | 4 (14.8%) | 6 (20.0%) |
| Total | 27 (100.0%) | 30 (100.0%) |
Commute Time in Superior
The most frequently occuring commute durations in Superior are 15 to 19 minutes (23 commuters, 40.4%), 10 to 14 minutes (11 commuters, 19.3%), and 45 to 59 minutes (9 commuters, 15.8%).
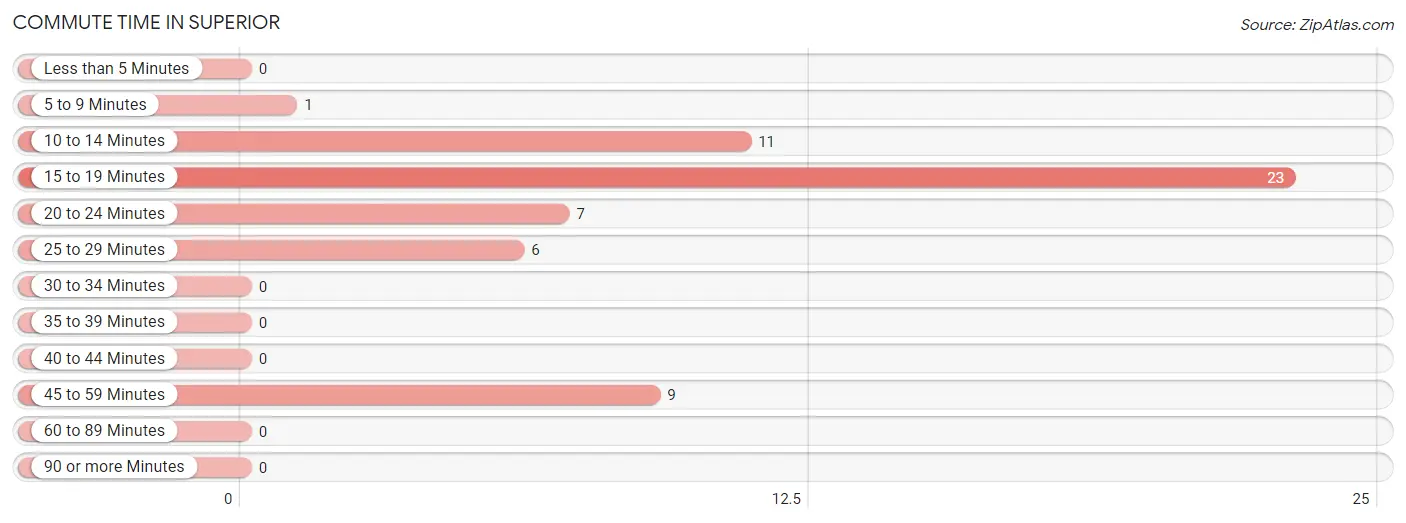
| Commute Time | # Commuters | % Commuters |
| Less than 5 Minutes | 0 | 0.0% |
| 5 to 9 Minutes | 1 | 1.8% |
| 10 to 14 Minutes | 11 | 19.3% |
| 15 to 19 Minutes | 23 | 40.4% |
| 20 to 24 Minutes | 7 | 12.3% |
| 25 to 29 Minutes | 6 | 10.5% |
| 30 to 34 Minutes | 0 | 0.0% |
| 35 to 39 Minutes | 0 | 0.0% |
| 40 to 44 Minutes | 0 | 0.0% |
| 45 to 59 Minutes | 9 | 15.8% |
| 60 to 89 Minutes | 0 | 0.0% |
| 90 or more Minutes | 0 | 0.0% |
Commute Time by Sex in Superior
The most common commute times in Superior are 25 to 29 minutes (6 commuters, 22.2%) for males and 15 to 19 minutes (19 commuters, 63.3%) for females.
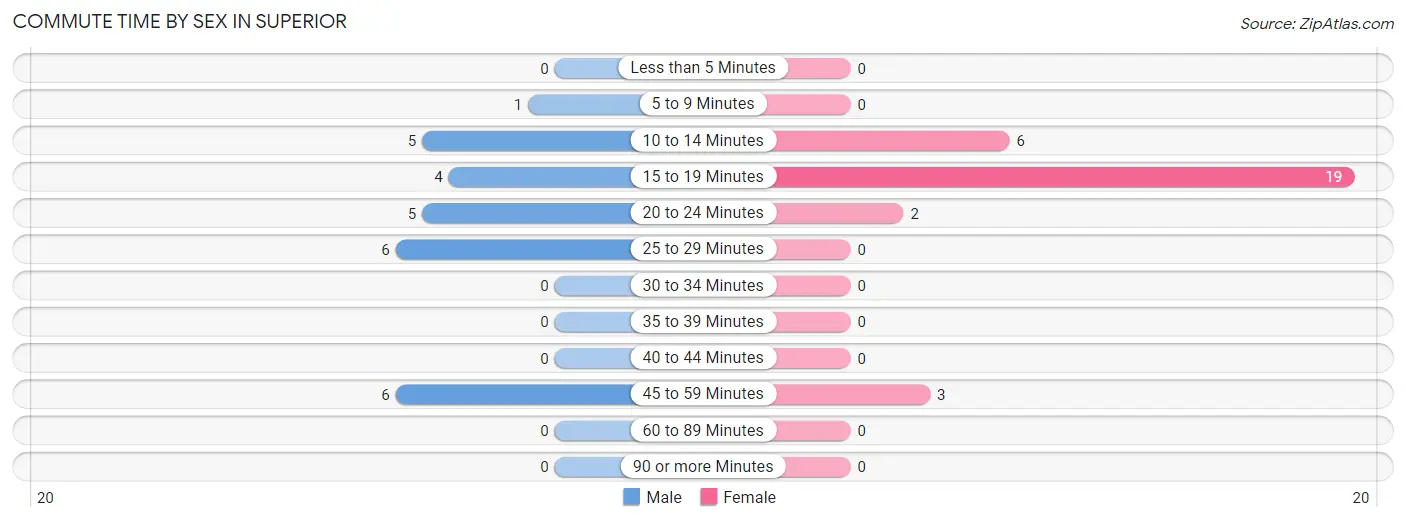
| Commute Time | Male | Female |
| Less than 5 Minutes | 0 (0.0%) | 0 (0.0%) |
| 5 to 9 Minutes | 1 (3.7%) | 0 (0.0%) |
| 10 to 14 Minutes | 5 (18.5%) | 6 (20.0%) |
| 15 to 19 Minutes | 4 (14.8%) | 19 (63.3%) |
| 20 to 24 Minutes | 5 (18.5%) | 2 (6.7%) |
| 25 to 29 Minutes | 6 (22.2%) | 0 (0.0%) |
| 30 to 34 Minutes | 0 (0.0%) | 0 (0.0%) |
| 35 to 39 Minutes | 0 (0.0%) | 0 (0.0%) |
| 40 to 44 Minutes | 0 (0.0%) | 0 (0.0%) |
| 45 to 59 Minutes | 6 (22.2%) | 3 (10.0%) |
| 60 to 89 Minutes | 0 (0.0%) | 0 (0.0%) |
| 90 or more Minutes | 0 (0.0%) | 0 (0.0%) |
Time of Departure to Work by Sex in Superior
The most frequent times of departure to work in Superior are 6:00 AM to 6:29 AM (15, 55.6%) for males and 12:00 AM to 4:59 AM (13, 43.3%) for females.
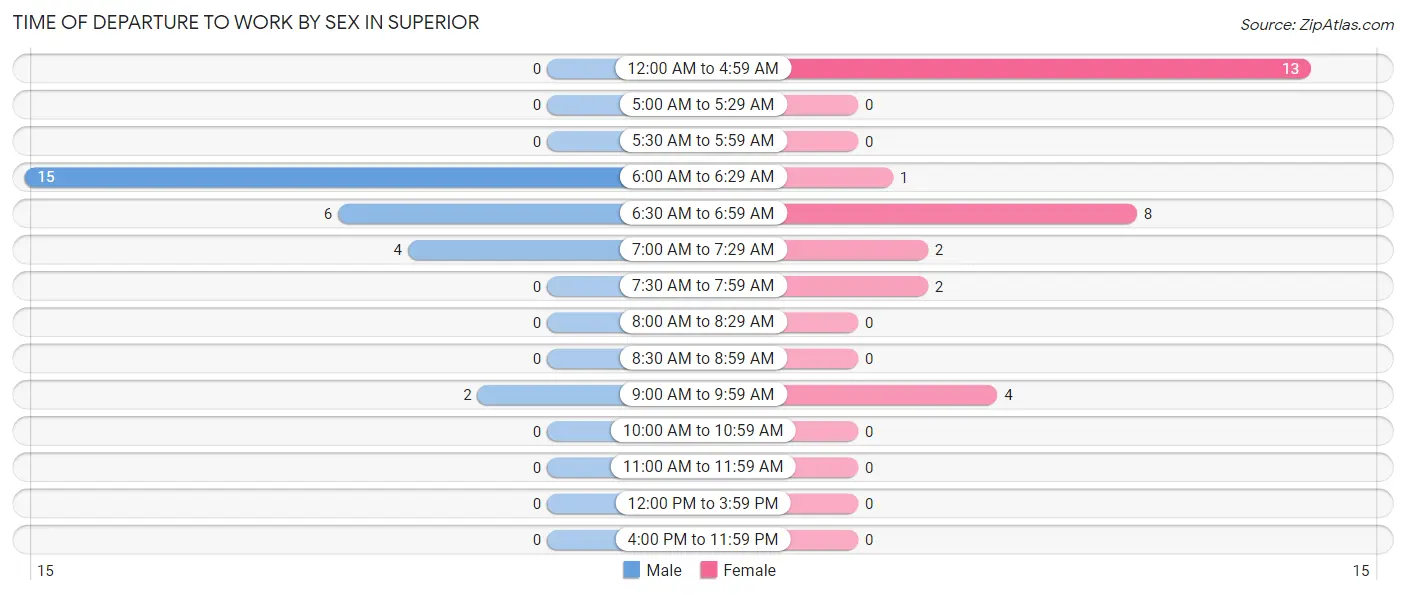
| Time of Departure | Male | Female |
| 12:00 AM to 4:59 AM | 0 (0.0%) | 13 (43.3%) |
| 5:00 AM to 5:29 AM | 0 (0.0%) | 0 (0.0%) |
| 5:30 AM to 5:59 AM | 0 (0.0%) | 0 (0.0%) |
| 6:00 AM to 6:29 AM | 15 (55.6%) | 1 (3.3%) |
| 6:30 AM to 6:59 AM | 6 (22.2%) | 8 (26.7%) |
| 7:00 AM to 7:29 AM | 4 (14.8%) | 2 (6.7%) |
| 7:30 AM to 7:59 AM | 0 (0.0%) | 2 (6.7%) |
| 8:00 AM to 8:29 AM | 0 (0.0%) | 0 (0.0%) |
| 8:30 AM to 8:59 AM | 0 (0.0%) | 0 (0.0%) |
| 9:00 AM to 9:59 AM | 2 (7.4%) | 4 (13.3%) |
| 10:00 AM to 10:59 AM | 0 (0.0%) | 0 (0.0%) |
| 11:00 AM to 11:59 AM | 0 (0.0%) | 0 (0.0%) |
| 12:00 PM to 3:59 PM | 0 (0.0%) | 0 (0.0%) |
| 4:00 PM to 11:59 PM | 0 (0.0%) | 0 (0.0%) |
| Total | 27 (100.0%) | 30 (100.0%) |
Housing Occupancy in Superior
Occupancy by Ownership in Superior
Of the total 63 dwellings in Superior, owner-occupied units account for 62 (98.4%), while renter-occupied units make up 1 (1.6%).
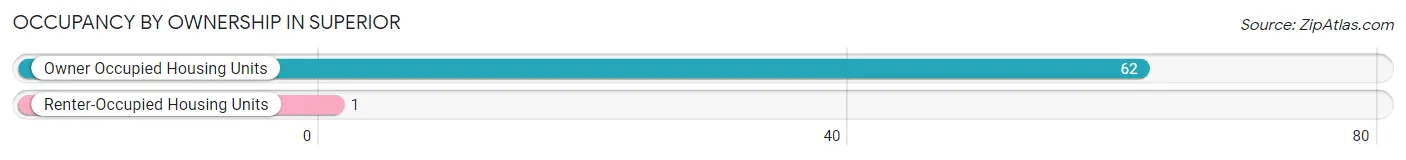
| Occupancy | # Housing Units | % Housing Units |
| Owner Occupied Housing Units | 62 | 98.4% |
| Renter-Occupied Housing Units | 1 | 1.6% |
| Total Occupied Housing Units | 63 | 100.0% |
Occupancy by Household Size in Superior
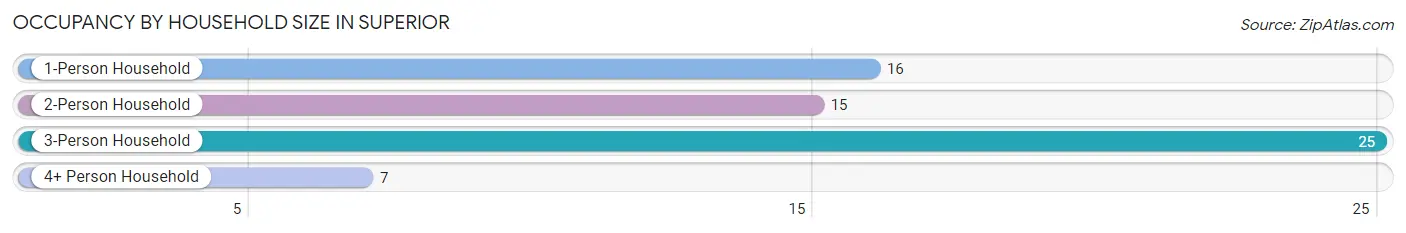
| Household Size | # Housing Units | % Housing Units |
| 1-Person Household | 16 | 25.4% |
| 2-Person Household | 15 | 23.8% |
| 3-Person Household | 25 | 39.7% |
| 4+ Person Household | 7 | 11.1% |
| Total Housing Units | 63 | 100.0% |
Occupancy by Ownership by Household Size in Superior
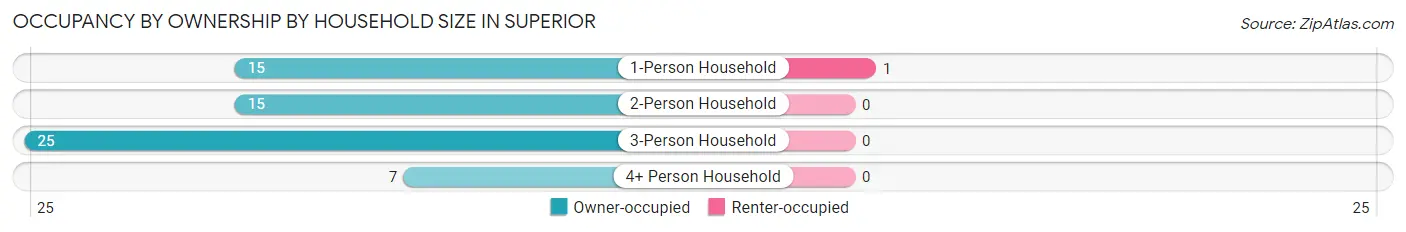
| Household Size | Owner-occupied | Renter-occupied |
| 1-Person Household | 15 (93.8%) | 1 (6.2%) |
| 2-Person Household | 15 (100.0%) | 0 (0.0%) |
| 3-Person Household | 25 (100.0%) | 0 (0.0%) |
| 4+ Person Household | 7 (100.0%) | 0 (0.0%) |
| Total Housing Units | 62 (98.4%) | 1 (1.6%) |
Occupancy by Educational Attainment in Superior
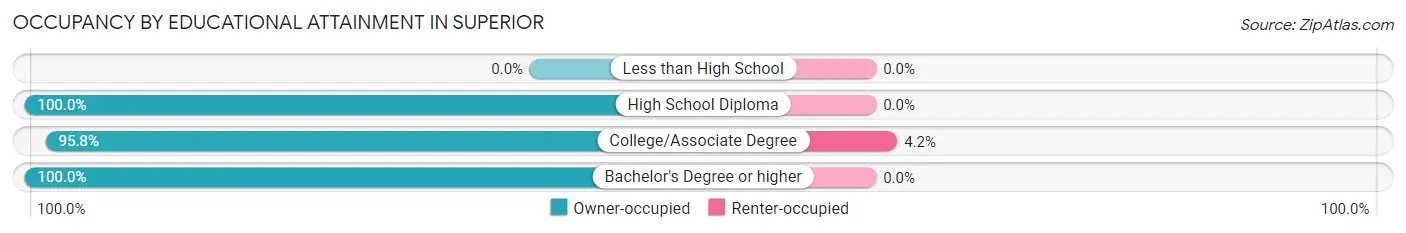
| Household Size | Owner-occupied | Renter-occupied |
| Less than High School | 0 (0.0%) | 0 (0.0%) |
| High School Diploma | 38 (100.0%) | 0 (0.0%) |
| College/Associate Degree | 23 (95.8%) | 1 (4.2%) |
| Bachelor's Degree or higher | 1 (100.0%) | 0 (0.0%) |
Occupancy by Age of Householder in Superior
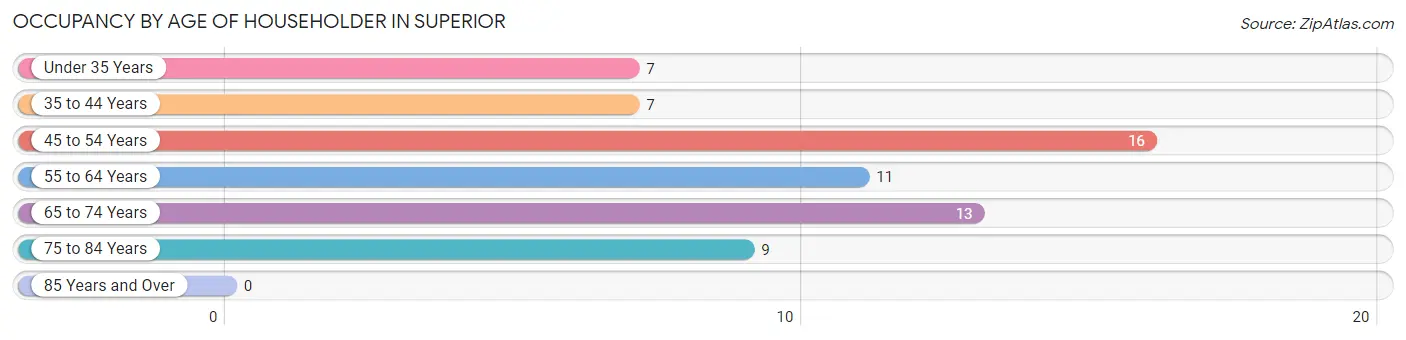
| Age Bracket | # Households | % Households |
| Under 35 Years | 7 | 11.1% |
| 35 to 44 Years | 7 | 11.1% |
| 45 to 54 Years | 16 | 25.4% |
| 55 to 64 Years | 11 | 17.5% |
| 65 to 74 Years | 13 | 20.6% |
| 75 to 84 Years | 9 | 14.3% |
| 85 Years and Over | 0 | 0.0% |
| Total | 63 | 100.0% |
Housing Finances in Superior
Median Income by Occupancy in Superior
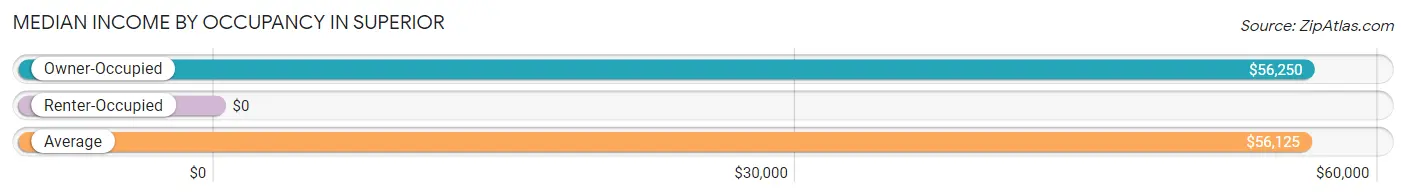
| Occupancy Type | # Households | Median Income |
| Owner-Occupied | 62 (98.4%) | $56,250 |
| Renter-Occupied | 1 (1.6%) | $0 |
| Average | 63 (100.0%) | $56,125 |
Occupancy by Householder Income Bracket in Superior
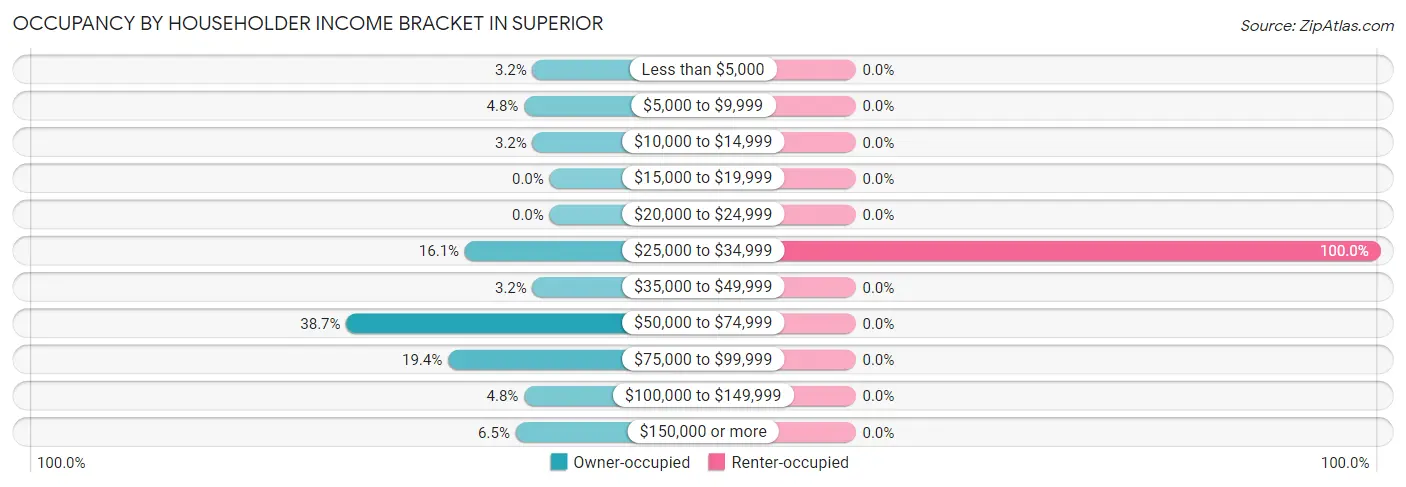
| Income Bracket | Owner-occupied | Renter-occupied |
| Less than $5,000 | 2 (3.2%) | 0 (0.0%) |
| $5,000 to $9,999 | 3 (4.8%) | 0 (0.0%) |
| $10,000 to $14,999 | 2 (3.2%) | 0 (0.0%) |
| $15,000 to $19,999 | 0 (0.0%) | 0 (0.0%) |
| $20,000 to $24,999 | 0 (0.0%) | 0 (0.0%) |
| $25,000 to $34,999 | 10 (16.1%) | 1 (100.0%) |
| $35,000 to $49,999 | 2 (3.2%) | 0 (0.0%) |
| $50,000 to $74,999 | 24 (38.7%) | 0 (0.0%) |
| $75,000 to $99,999 | 12 (19.4%) | 0 (0.0%) |
| $100,000 to $149,999 | 3 (4.8%) | 0 (0.0%) |
| $150,000 or more | 4 (6.5%) | 0 (0.0%) |
| Total | 62 (100.0%) | 1 (100.0%) |
Monthly Housing Cost Tiers in Superior
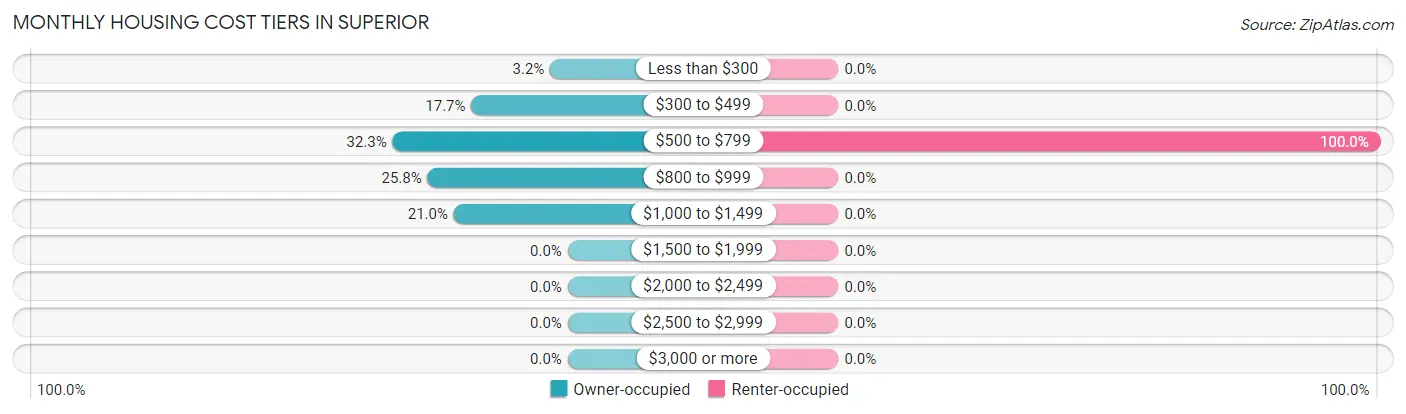
| Monthly Cost | Owner-occupied | Renter-occupied |
| Less than $300 | 2 (3.2%) | 0 (0.0%) |
| $300 to $499 | 11 (17.7%) | 0 (0.0%) |
| $500 to $799 | 20 (32.3%) | 1 (100.0%) |
| $800 to $999 | 16 (25.8%) | 0 (0.0%) |
| $1,000 to $1,499 | 13 (21.0%) | 0 (0.0%) |
| $1,500 to $1,999 | 0 (0.0%) | 0 (0.0%) |
| $2,000 to $2,499 | 0 (0.0%) | 0 (0.0%) |
| $2,500 to $2,999 | 0 (0.0%) | 0 (0.0%) |
| $3,000 or more | 0 (0.0%) | 0 (0.0%) |
| Total | 62 (100.0%) | 1 (100.0%) |
Physical Housing Characteristics in Superior
Housing Structures in Superior
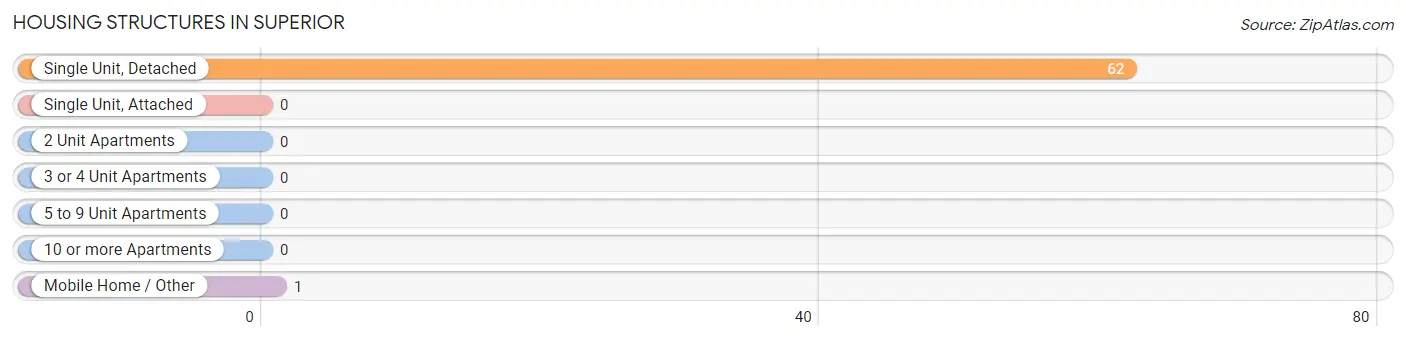
| Structure Type | # Housing Units | % Housing Units |
| Single Unit, Detached | 62 | 98.4% |
| Single Unit, Attached | 0 | 0.0% |
| 2 Unit Apartments | 0 | 0.0% |
| 3 or 4 Unit Apartments | 0 | 0.0% |
| 5 to 9 Unit Apartments | 0 | 0.0% |
| 10 or more Apartments | 0 | 0.0% |
| Mobile Home / Other | 1 | 1.6% |
| Total | 63 | 100.0% |
Housing Structures by Occupancy in Superior
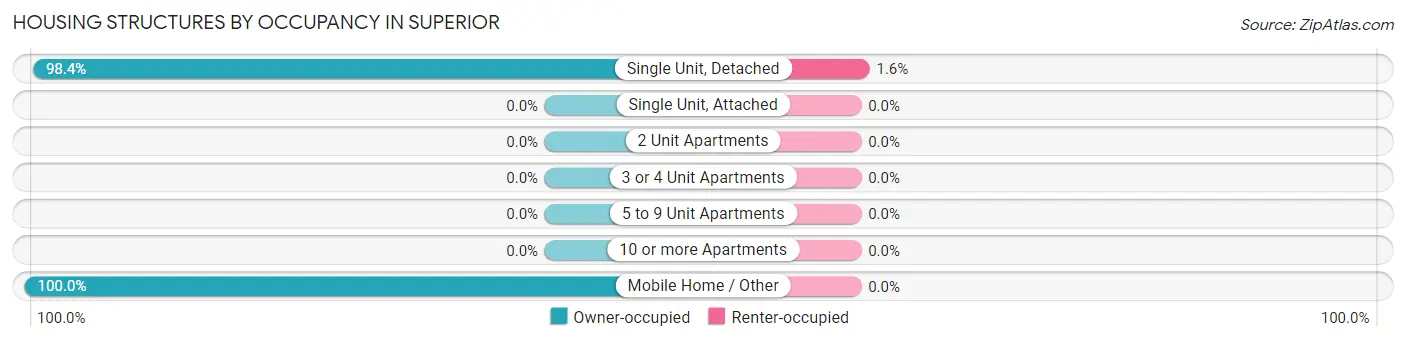
| Structure Type | Owner-occupied | Renter-occupied |
| Single Unit, Detached | 61 (98.4%) | 1 (1.6%) |
| Single Unit, Attached | 0 (0.0%) | 0 (0.0%) |
| 2 Unit Apartments | 0 (0.0%) | 0 (0.0%) |
| 3 or 4 Unit Apartments | 0 (0.0%) | 0 (0.0%) |
| 5 to 9 Unit Apartments | 0 (0.0%) | 0 (0.0%) |
| 10 or more Apartments | 0 (0.0%) | 0 (0.0%) |
| Mobile Home / Other | 1 (100.0%) | 0 (0.0%) |
| Total | 62 (98.4%) | 1 (1.6%) |
Housing Structures by Number of Rooms in Superior
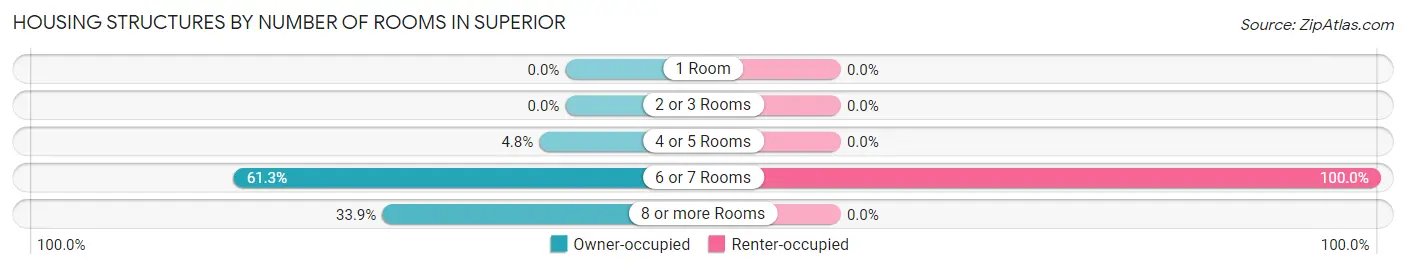
| Number of Rooms | Owner-occupied | Renter-occupied |
| 1 Room | 0 (0.0%) | 0 (0.0%) |
| 2 or 3 Rooms | 0 (0.0%) | 0 (0.0%) |
| 4 or 5 Rooms | 3 (4.8%) | 0 (0.0%) |
| 6 or 7 Rooms | 38 (61.3%) | 1 (100.0%) |
| 8 or more Rooms | 21 (33.9%) | 0 (0.0%) |
| Total | 62 (100.0%) | 1 (100.0%) |
Housing Structure by Heating Type in Superior
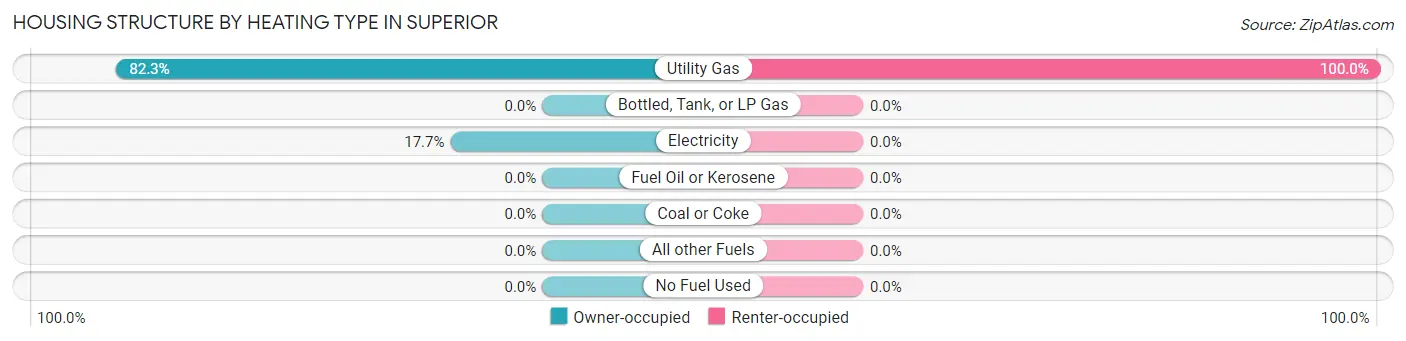
| Heating Type | Owner-occupied | Renter-occupied |
| Utility Gas | 51 (82.3%) | 1 (100.0%) |
| Bottled, Tank, or LP Gas | 0 (0.0%) | 0 (0.0%) |
| Electricity | 11 (17.7%) | 0 (0.0%) |
| Fuel Oil or Kerosene | 0 (0.0%) | 0 (0.0%) |
| Coal or Coke | 0 (0.0%) | 0 (0.0%) |
| All other Fuels | 0 (0.0%) | 0 (0.0%) |
| No Fuel Used | 0 (0.0%) | 0 (0.0%) |
| Total | 62 (100.0%) | 1 (100.0%) |
Household Vehicle Usage in Superior
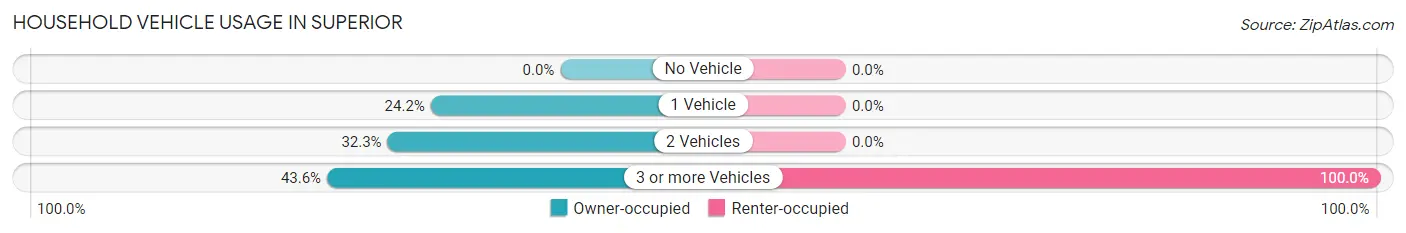
| Vehicles per Household | Owner-occupied | Renter-occupied |
| No Vehicle | 0 (0.0%) | 0 (0.0%) |
| 1 Vehicle | 15 (24.2%) | 0 (0.0%) |
| 2 Vehicles | 20 (32.3%) | 0 (0.0%) |
| 3 or more Vehicles | 27 (43.5%) | 1 (100.0%) |
| Total | 62 (100.0%) | 1 (100.0%) |
Real Estate & Mortgages in Superior
Real Estate and Mortgage Overview in Superior
| Characteristic | Without Mortgage | With Mortgage |
| Housing Units | 21 | 41 |
| Median Property Value | - | - |
| Median Household Income | $50,750 | $3 |
| Monthly Housing Costs | $493 | $0 |
| Real Estate Taxes | $967 | $2 |
Property Value by Mortgage Status in Superior
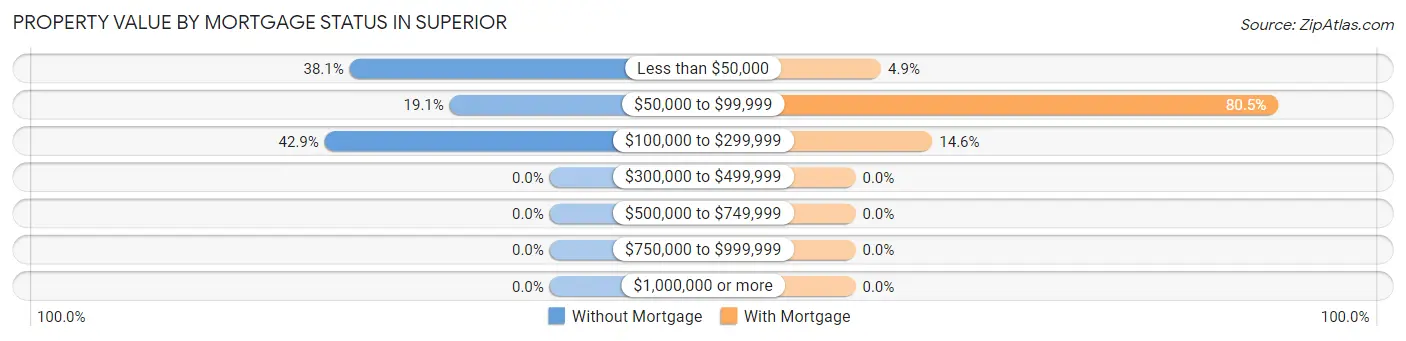
| Property Value | Without Mortgage | With Mortgage |
| Less than $50,000 | 8 (38.1%) | 2 (4.9%) |
| $50,000 to $99,999 | 4 (19.1%) | 33 (80.5%) |
| $100,000 to $299,999 | 9 (42.9%) | 6 (14.6%) |
| $300,000 to $499,999 | 0 (0.0%) | 0 (0.0%) |
| $500,000 to $749,999 | 0 (0.0%) | 0 (0.0%) |
| $750,000 to $999,999 | 0 (0.0%) | 0 (0.0%) |
| $1,000,000 or more | 0 (0.0%) | 0 (0.0%) |
| Total | 21 (100.0%) | 41 (100.0%) |
Household Income by Mortgage Status in Superior
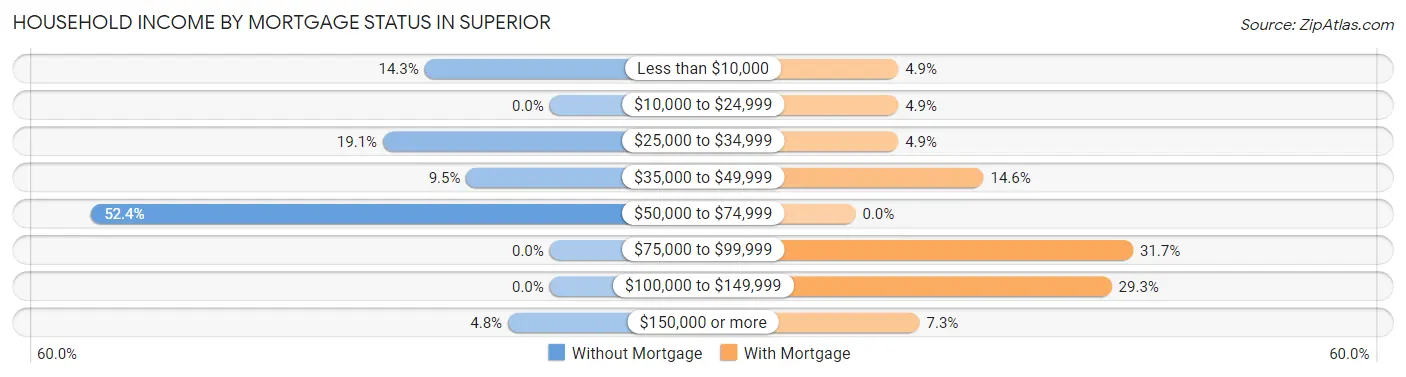
| Household Income | Without Mortgage | With Mortgage |
| Less than $10,000 | 3 (14.3%) | 2 (4.9%) |
| $10,000 to $24,999 | 0 (0.0%) | 2 (4.9%) |
| $25,000 to $34,999 | 4 (19.1%) | 2 (4.9%) |
| $35,000 to $49,999 | 2 (9.5%) | 6 (14.6%) |
| $50,000 to $74,999 | 11 (52.4%) | 0 (0.0%) |
| $75,000 to $99,999 | 0 (0.0%) | 13 (31.7%) |
| $100,000 to $149,999 | 0 (0.0%) | 12 (29.3%) |
| $150,000 or more | 1 (4.8%) | 3 (7.3%) |
| Total | 21 (100.0%) | 41 (100.0%) |
Property Value to Household Income Ratio in Superior
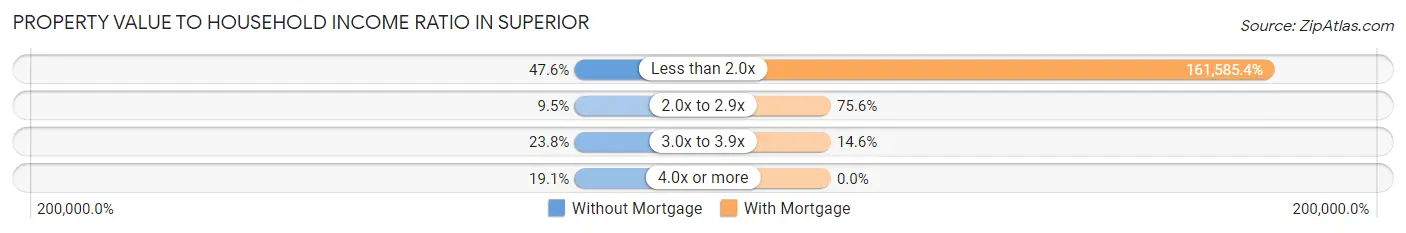
| Value-to-Income Ratio | Without Mortgage | With Mortgage |
| Less than 2.0x | 10 (47.6%) | 66,250 (161,585.4%) |
| 2.0x to 2.9x | 2 (9.5%) | 31 (75.6%) |
| 3.0x to 3.9x | 5 (23.8%) | 6 (14.6%) |
| 4.0x or more | 4 (19.1%) | 0 (0.0%) |
| Total | 21 (100.0%) | 41 (100.0%) |
Real Estate Taxes by Mortgage Status in Superior
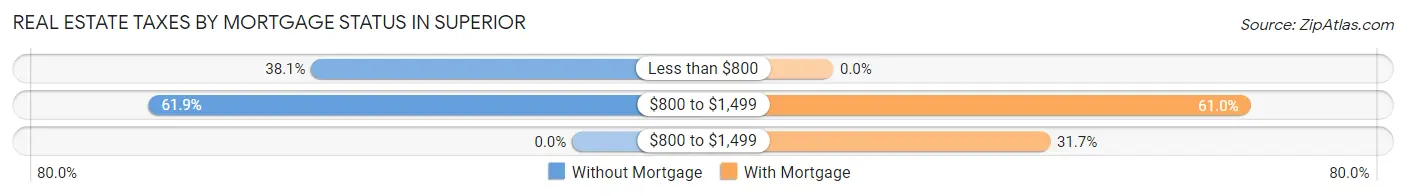
| Property Taxes | Without Mortgage | With Mortgage |
| Less than $800 | 8 (38.1%) | 0 (0.0%) |
| $800 to $1,499 | 13 (61.9%) | 25 (61.0%) |
| $800 to $1,499 | 0 (0.0%) | 13 (31.7%) |
| Total | 21 (100.0%) | 41 (100.0%) |
Health & Disability in Superior
Health Insurance Coverage by Age in Superior
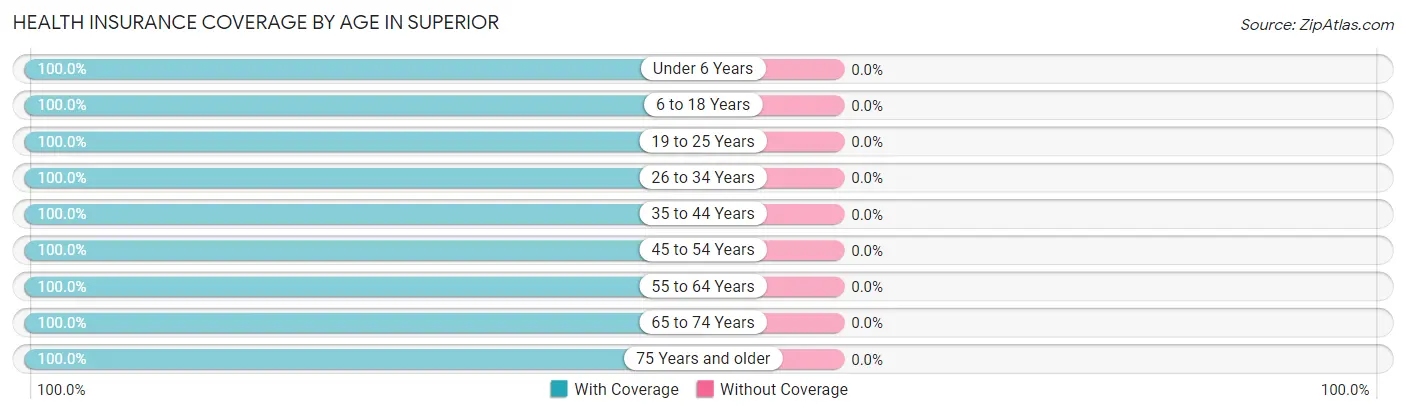
| Age Bracket | With Coverage | Without Coverage |
| Under 6 Years | 9 (100.0%) | 0 (0.0%) |
| 6 to 18 Years | 28 (100.0%) | 0 (0.0%) |
| 19 to 25 Years | 5 (100.0%) | 0 (0.0%) |
| 26 to 34 Years | 4 (100.0%) | 0 (0.0%) |
| 35 to 44 Years | 13 (100.0%) | 0 (0.0%) |
| 45 to 54 Years | 24 (100.0%) | 0 (0.0%) |
| 55 to 64 Years | 20 (100.0%) | 0 (0.0%) |
| 65 to 74 Years | 28 (100.0%) | 0 (0.0%) |
| 75 Years and older | 12 (100.0%) | 0 (0.0%) |
| Total | 143 (100.0%) | 0 (0.0%) |
Health Insurance Coverage by Citizenship Status in Superior
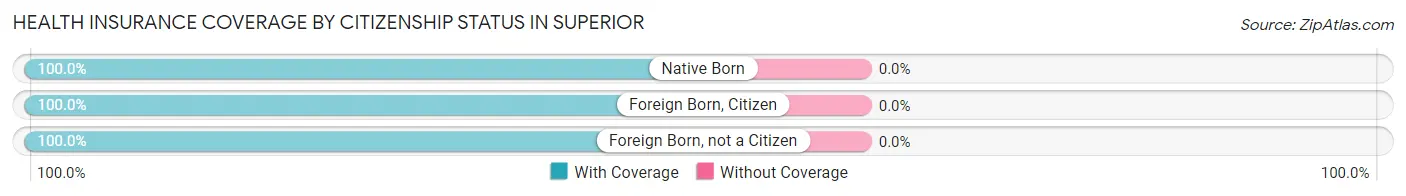
| Citizenship Status | With Coverage | Without Coverage |
| Native Born | 9 (100.0%) | 0 (0.0%) |
| Foreign Born, Citizen | 28 (100.0%) | 0 (0.0%) |
| Foreign Born, not a Citizen | 5 (100.0%) | 0 (0.0%) |
Health Insurance Coverage by Household Income in Superior
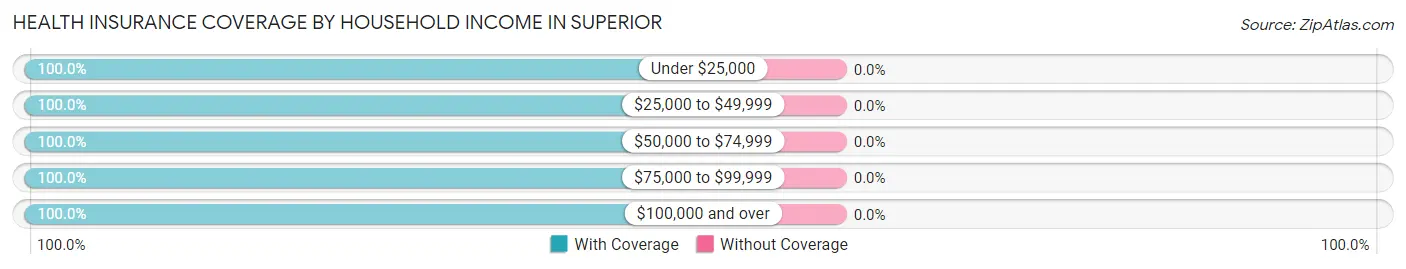
| Household Income | With Coverage | Without Coverage |
| Under $25,000 | 9 (100.0%) | 0 (0.0%) |
| $25,000 to $49,999 | 25 (100.0%) | 0 (0.0%) |
| $50,000 to $74,999 | 63 (100.0%) | 0 (0.0%) |
| $75,000 to $99,999 | 26 (100.0%) | 0 (0.0%) |
| $100,000 and over | 20 (100.0%) | 0 (0.0%) |
Public vs Private Health Insurance Coverage by Age in Superior
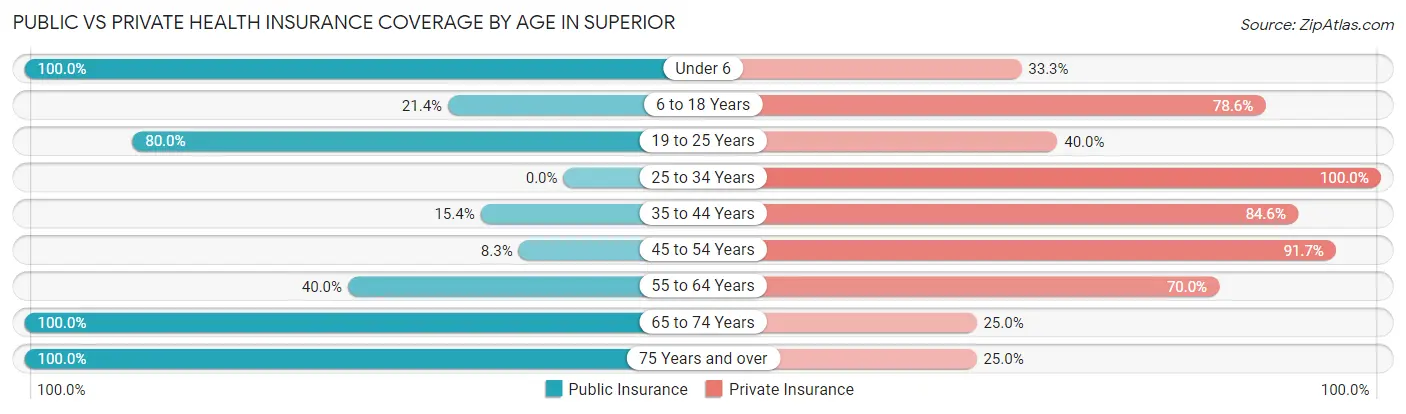
| Age Bracket | Public Insurance | Private Insurance |
| Under 6 | 9 (100.0%) | 3 (33.3%) |
| 6 to 18 Years | 6 (21.4%) | 22 (78.6%) |
| 19 to 25 Years | 4 (80.0%) | 2 (40.0%) |
| 25 to 34 Years | 0 (0.0%) | 4 (100.0%) |
| 35 to 44 Years | 2 (15.4%) | 11 (84.6%) |
| 45 to 54 Years | 2 (8.3%) | 22 (91.7%) |
| 55 to 64 Years | 8 (40.0%) | 14 (70.0%) |
| 65 to 74 Years | 28 (100.0%) | 7 (25.0%) |
| 75 Years and over | 12 (100.0%) | 3 (25.0%) |
| Total | 71 (49.6%) | 88 (61.5%) |
Disability Status by Sex by Age in Superior
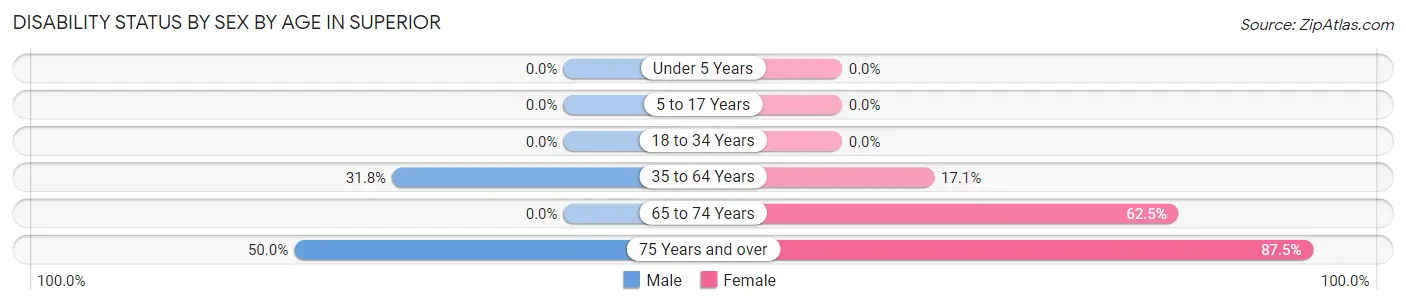
| Age Bracket | Male | Female |
| Under 5 Years | 0 (0.0%) | 0 (0.0%) |
| 5 to 17 Years | 0 (0.0%) | 0 (0.0%) |
| 18 to 34 Years | 0 (0.0%) | 0 (0.0%) |
| 35 to 64 Years | 7 (31.8%) | 6 (17.1%) |
| 65 to 74 Years | 0 (0.0%) | 10 (62.5%) |
| 75 Years and over | 2 (50.0%) | 7 (87.5%) |
Disability Class by Sex by Age in Superior
Disability Class: Hearing Difficulty
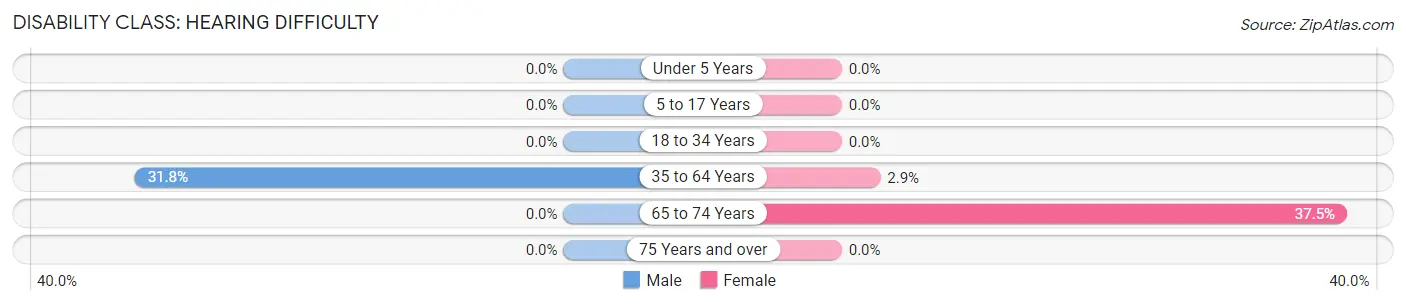
| Age Bracket | Male | Female |
| Under 5 Years | 0 (0.0%) | 0 (0.0%) |
| 5 to 17 Years | 0 (0.0%) | 0 (0.0%) |
| 18 to 34 Years | 0 (0.0%) | 0 (0.0%) |
| 35 to 64 Years | 7 (31.8%) | 1 (2.9%) |
| 65 to 74 Years | 0 (0.0%) | 6 (37.5%) |
| 75 Years and over | 0 (0.0%) | 0 (0.0%) |
Disability Class: Vision Difficulty
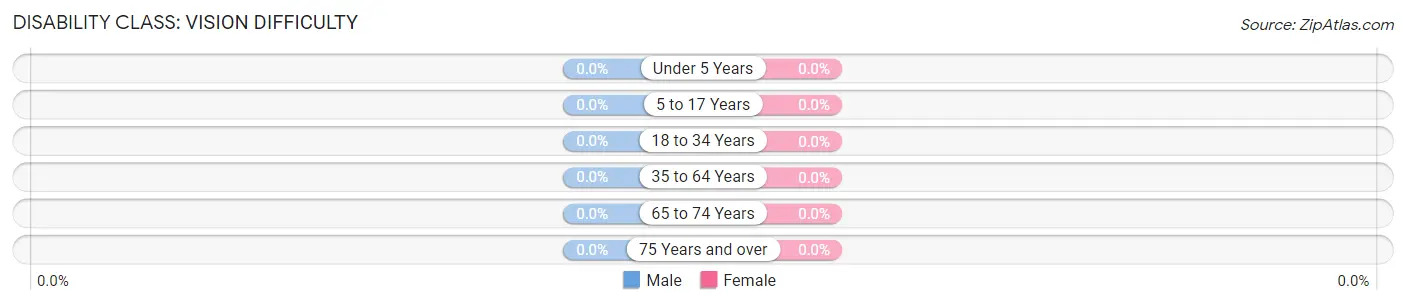
| Age Bracket | Male | Female |
| Under 5 Years | 0 (0.0%) | 0 (0.0%) |
| 5 to 17 Years | 0 (0.0%) | 0 (0.0%) |
| 18 to 34 Years | 0 (0.0%) | 0 (0.0%) |
| 35 to 64 Years | 0 (0.0%) | 0 (0.0%) |
| 65 to 74 Years | 0 (0.0%) | 0 (0.0%) |
| 75 Years and over | 0 (0.0%) | 0 (0.0%) |
Disability Class: Cognitive Difficulty
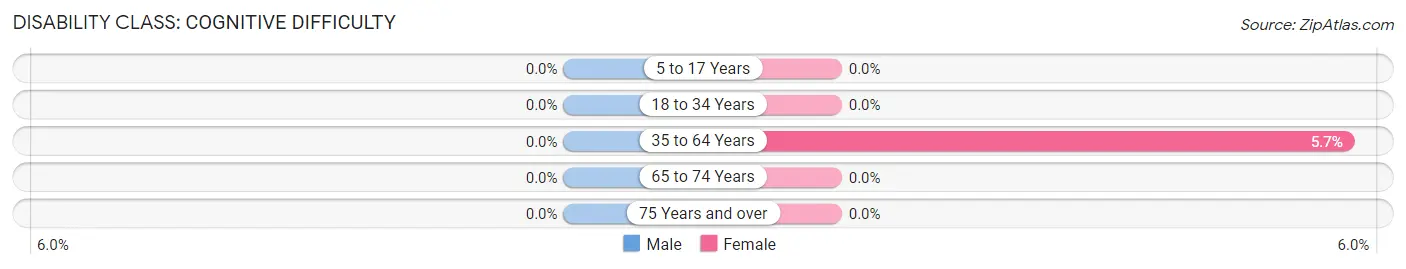
| Age Bracket | Male | Female |
| 5 to 17 Years | 0 (0.0%) | 0 (0.0%) |
| 18 to 34 Years | 0 (0.0%) | 0 (0.0%) |
| 35 to 64 Years | 0 (0.0%) | 2 (5.7%) |
| 65 to 74 Years | 0 (0.0%) | 0 (0.0%) |
| 75 Years and over | 0 (0.0%) | 0 (0.0%) |
Disability Class: Ambulatory Difficulty
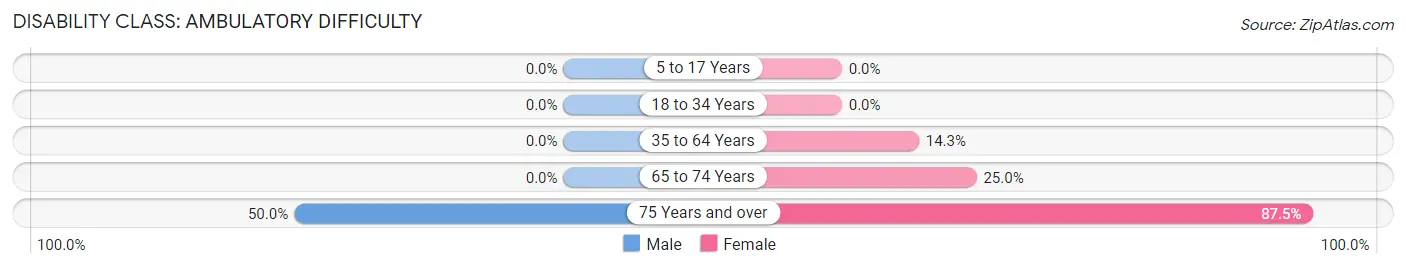
| Age Bracket | Male | Female |
| 5 to 17 Years | 0 (0.0%) | 0 (0.0%) |
| 18 to 34 Years | 0 (0.0%) | 0 (0.0%) |
| 35 to 64 Years | 0 (0.0%) | 5 (14.3%) |
| 65 to 74 Years | 0 (0.0%) | 4 (25.0%) |
| 75 Years and over | 2 (50.0%) | 7 (87.5%) |
Disability Class: Self-Care Difficulty
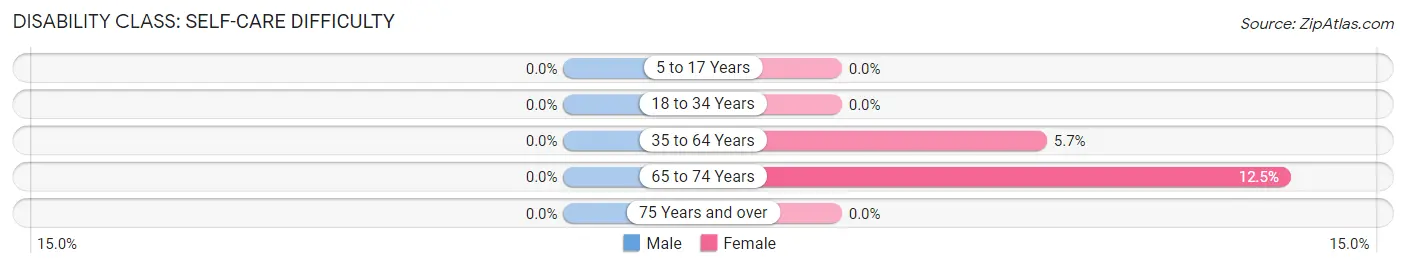
| Age Bracket | Male | Female |
| 5 to 17 Years | 0 (0.0%) | 0 (0.0%) |
| 18 to 34 Years | 0 (0.0%) | 0 (0.0%) |
| 35 to 64 Years | 0 (0.0%) | 2 (5.7%) |
| 65 to 74 Years | 0 (0.0%) | 2 (12.5%) |
| 75 Years and over | 0 (0.0%) | 0 (0.0%) |
Technology Access in Superior
Computing Device Access in Superior
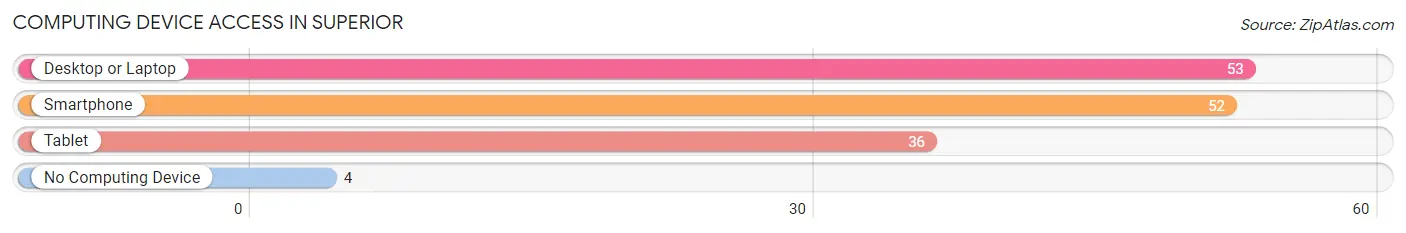
| Device Type | # Households | % Households |
| Desktop or Laptop | 53 | 84.1% |
| Smartphone | 52 | 82.5% |
| Tablet | 36 | 57.1% |
| No Computing Device | 4 | 6.4% |
| Total | 63 | 100.0% |
Internet Access in Superior
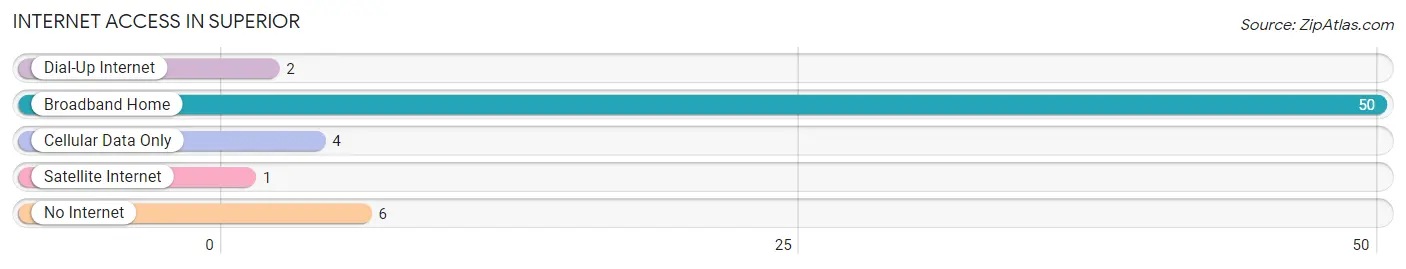
| Internet Type | # Households | % Households |
| Dial-Up Internet | 2 | 3.2% |
| Broadband Home | 50 | 79.4% |
| Cellular Data Only | 4 | 6.4% |
| Satellite Internet | 1 | 1.6% |
| No Internet | 6 | 9.5% |
| Total | 63 | 100.0% |
Superior Summary
History
Superior, Iowa is a small town located in the southwestern corner of Iowa, in the county of Taylor. It was founded in 1856 by a group of settlers from Ohio, who were looking for a place to settle and start a new life. The town was named after the nearby Superior Creek, which was named by the settlers for its superior quality of water.
The town was originally a farming community, with the main crops being corn, wheat, and oats. The town also had a few small businesses, such as a general store, a blacksmith, and a post office. In the late 1800s, the town began to grow and develop, with the addition of a school, a bank, and a newspaper.
In the early 1900s, the town began to experience a period of growth and prosperity. The railroad came to town in 1906, and the town began to attract more businesses and industries. The town also became a popular tourist destination, with the opening of the Superior Hotel in 1910.
The town continued to grow and prosper throughout the 20th century, and by the year 2000, the population had grown to over 1,000 people. The town is now home to a variety of businesses, including a grocery store, a hardware store, a bank, and a variety of restaurants.
Geography
Superior, Iowa is located in the southwestern corner of the state, in Taylor County. The town is situated on the banks of the Superior Creek, which is a tributary of the East Nishnabotna River. The town is surrounded by rolling hills and farmland, and is located about 25 miles from the Missouri border.
The town has a total area of 0.7 square miles, all of which is land. The town has a humid continental climate, with hot summers and cold winters. The average annual temperature is around 50 degrees Fahrenheit, and the average annual precipitation is around 36 inches.
Economy
The economy of Superior, Iowa is largely based on agriculture. The town is home to several farms, which produce corn, soybeans, wheat, and oats. The town also has a few small businesses, such as a grocery store, a hardware store, and a bank.
The town is also home to a few manufacturing companies, which produce a variety of products, such as furniture, clothing, and automotive parts. The town also has a few tourist attractions, such as the Superior Hotel and the Superior Museum.
Demographics
As of the 2010 census, the population of Superior, Iowa was 1,072. The racial makeup of the town was 97.3% White, 0.7% African American, 0.2% Native American, 0.2% Asian, 0.2% from other races, and 1.6% from two or more races. Hispanic or Latino of any race were 1.2% of the population.
The median income for a household in the town was $37,500, and the median income for a family was $45,000. The per capita income for the town was $18,000. About 11.2% of families and 14.2% of the population were below the poverty line, including 18.2% of those under age 18 and 8.3% of those age 65 or over.
Common Questions
What is Per Capita Income in Superior?
Per Capita income in Superior is $24,219.
What is the Median Family Income in Superior?
Median Family Income in Superior is $57,125.
What is the Median Household income in Superior?
Median Household Income in Superior is $56,125.
What is Income or Wage Gap in Superior?
Income or Wage Gap in Superior is 31.1%.
Women in Superior earn 68.9 cents for every dollar earned by a man.
What is Inequality or Gini Index in Superior?
Inequality or Gini Index in Superior is 0.34.
What is the Total Population of Superior?
Total Population of Superior is 143.
What is the Total Male Population of Superior?
Total Male Population of Superior is 62.
What is the Total Female Population of Superior?
Total Female Population of Superior is 81.
What is the Ratio of Males per 100 Females in Superior?
There are 76.54 Males per 100 Females in Superior.
What is the Ratio of Females per 100 Males in Superior?
There are 130.65 Females per 100 Males in Superior.
What is the Median Population Age in Superior?
Median Population Age in Superior is 48.4 Years.
What is the Average Family Size in Superior
Average Family Size in Superior is 2.7 People.
What is the Average Household Size in Superior
Average Household Size in Superior is 2.3 People.
How Large is the Labor Force in Superior?
There are 61 People in the Labor Forcein in Superior.
What is the Percentage of People in the Labor Force in Superior?
53.0% of People are in the Labor Force in Superior.
What is the Unemployment Rate in Superior?
Unemployment Rate in Superior is 6.6%.