Story City, IA Map & Demographics
Story City Map
Story City Overview
$36,413
PER CAPITA INCOME
$107,546
AVG FAMILY INCOME
$67,308
AVG HOUSEHOLD INCOME
57.9%
WAGE / INCOME GAP [ % ]
42.1¢/ $1
WAGE / INCOME GAP [ $ ]
0.43
INEQUALITY / GINI INDEX
3,352
TOTAL POPULATION
1,448
MALE POPULATION
1,904
FEMALE POPULATION
76.05
MALES / 100 FEMALES
131.49
FEMALES / 100 MALES
39.4
MEDIAN AGE
2.9
AVG FAMILY SIZE
2.2
AVG HOUSEHOLD SIZE
1,667
LABOR FORCE [ PEOPLE ]
64.9%
PERCENT IN LABOR FORCE
4.0%
UNEMPLOYMENT RATE
Story City Zip Codes
Story City Area Codes
Income in Story City
Income Overview in Story City
Per Capita Income in Story City is $36,413, while median incomes of families and households are $107,546 and $67,308 respectively.
| Characteristic | Number | Measure |
| Per Capita Income | 3,352 | $36,413 |
| Median Family Income | 881 | $107,546 |
| Mean Family Income | 881 | $108,925 |
| Median Household Income | 1,464 | $67,308 |
| Mean Household Income | 1,464 | $82,344 |
| Income Deficit | 881 | $0 |
| Wage / Income Gap (%) | 3,352 | 57.92% |
| Wage / Income Gap ($) | 3,352 | 42.08¢ per $1 |
| Gini / Inequality Index | 3,352 | 0.43 |
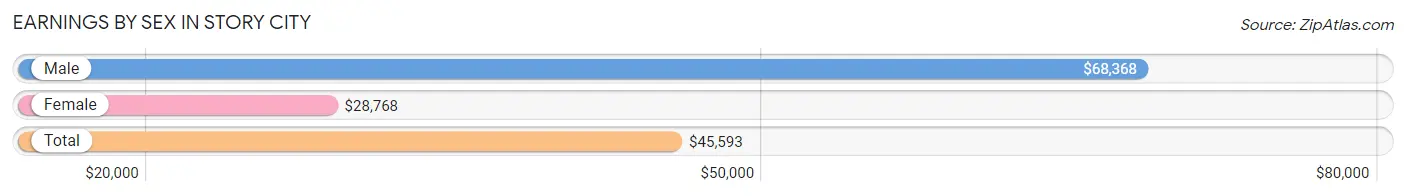
Earnings by Sex in Story City
Average Earnings in Story City are $45,593, $68,368 for men and $28,768 for women, a difference of 57.9%.
| Sex | Number | Average Earnings |
| Male | 783 (43.6%) | $68,368 |
| Female | 1,011 (56.4%) | $28,768 |
| Total | 1,794 (100.0%) | $45,593 |
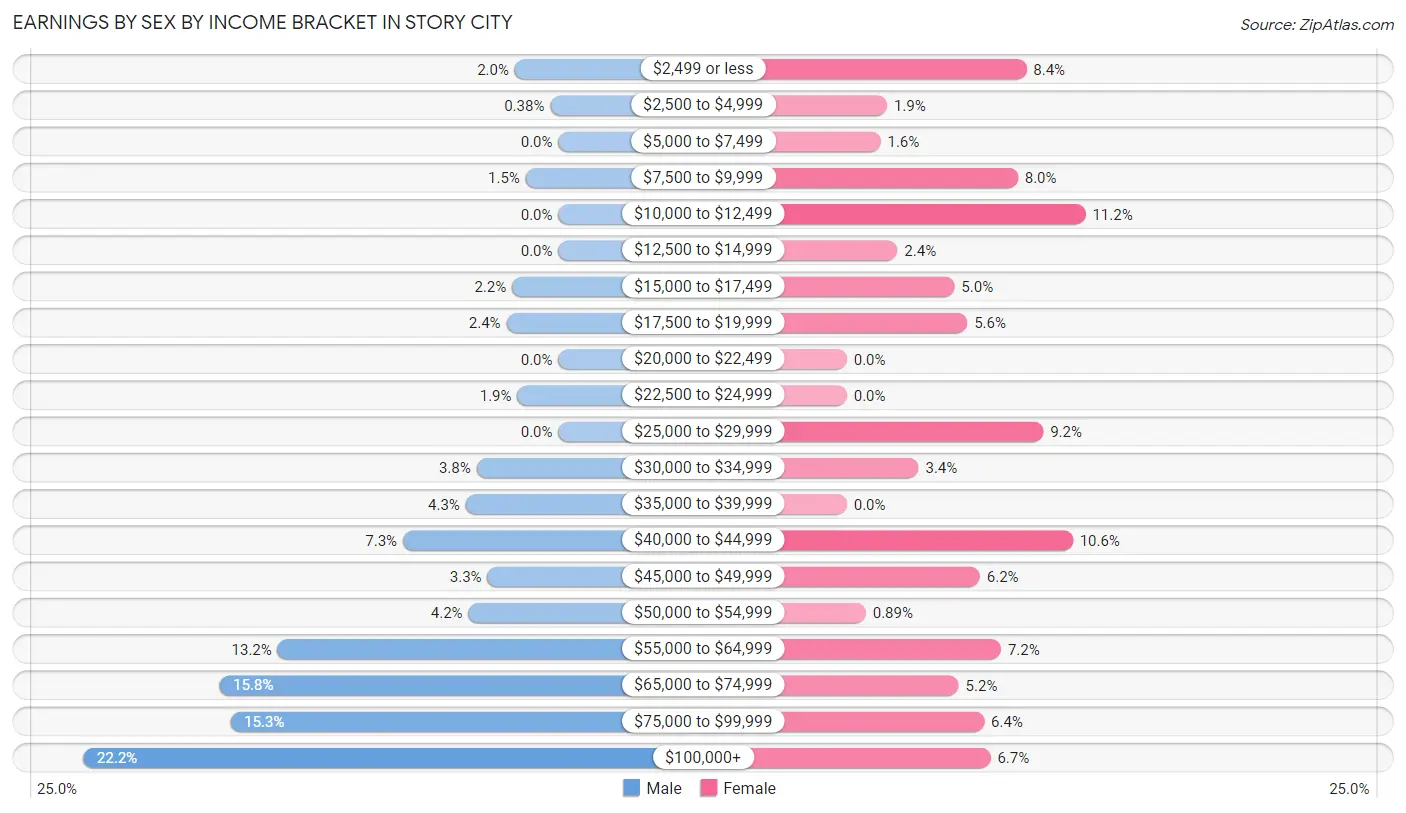
Earnings by Sex by Income Bracket in Story City
The most common earnings brackets in Story City are $100,000+ for men (174 | 22.2%) and $10,000 to $12,499 for women (113 | 11.2%).
| Income | Male | Female |
| $2,499 or less | 16 (2.0%) | 85 (8.4%) |
| $2,500 to $4,999 | 3 (0.4%) | 19 (1.9%) |
| $5,000 to $7,499 | 0 (0.0%) | 16 (1.6%) |
| $7,500 to $9,999 | 12 (1.5%) | 81 (8.0%) |
| $10,000 to $12,499 | 0 (0.0%) | 113 (11.2%) |
| $12,500 to $14,999 | 0 (0.0%) | 24 (2.4%) |
| $15,000 to $17,499 | 17 (2.2%) | 51 (5.0%) |
| $17,500 to $19,999 | 19 (2.4%) | 57 (5.6%) |
| $20,000 to $22,499 | 0 (0.0%) | 0 (0.0%) |
| $22,500 to $24,999 | 15 (1.9%) | 0 (0.0%) |
| $25,000 to $29,999 | 0 (0.0%) | 93 (9.2%) |
| $30,000 to $34,999 | 30 (3.8%) | 34 (3.4%) |
| $35,000 to $39,999 | 34 (4.3%) | 0 (0.0%) |
| $40,000 to $44,999 | 57 (7.3%) | 107 (10.6%) |
| $45,000 to $49,999 | 26 (3.3%) | 63 (6.2%) |
| $50,000 to $54,999 | 33 (4.2%) | 9 (0.9%) |
| $55,000 to $64,999 | 103 (13.2%) | 73 (7.2%) |
| $65,000 to $74,999 | 124 (15.8%) | 53 (5.2%) |
| $75,000 to $99,999 | 120 (15.3%) | 65 (6.4%) |
| $100,000+ | 174 (22.2%) | 68 (6.7%) |
| Total | 783 (100.0%) | 1,011 (100.0%) |
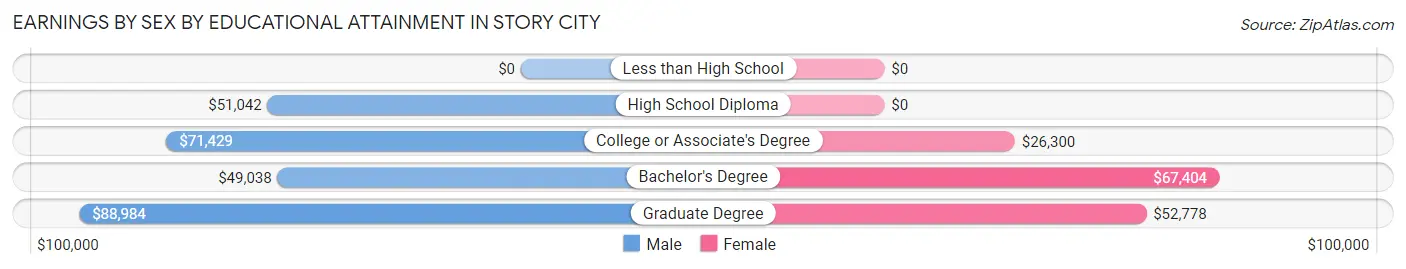
Earnings by Sex by Educational Attainment in Story City
Average earnings in Story City are $69,514 for men and $32,917 for women, a difference of 52.6%. Men with an educational attainment of graduate degree enjoy the highest average annual earnings of $88,984, while those with bachelor's degree education earn the least with $49,038. Women with an educational attainment of bachelor's degree earn the most with the average annual earnings of $67,404, while those with college or associate's degree education have the smallest earnings of $26,300.
| Educational Attainment | Male Income | Female Income |
| Less than High School | - | - |
| High School Diploma | $51,042 | $0 |
| College or Associate's Degree | $71,429 | $26,300 |
| Bachelor's Degree | $49,038 | $67,404 |
| Graduate Degree | $88,984 | $52,778 |
| Total | $69,514 | $32,917 |
Family Income in Story City
Family Income Brackets in Story City
According to the Story City family income data, there are 286 families falling into the $100,000 to $149,999 income range, which is the most common income bracket and makes up 32.5% of all families.
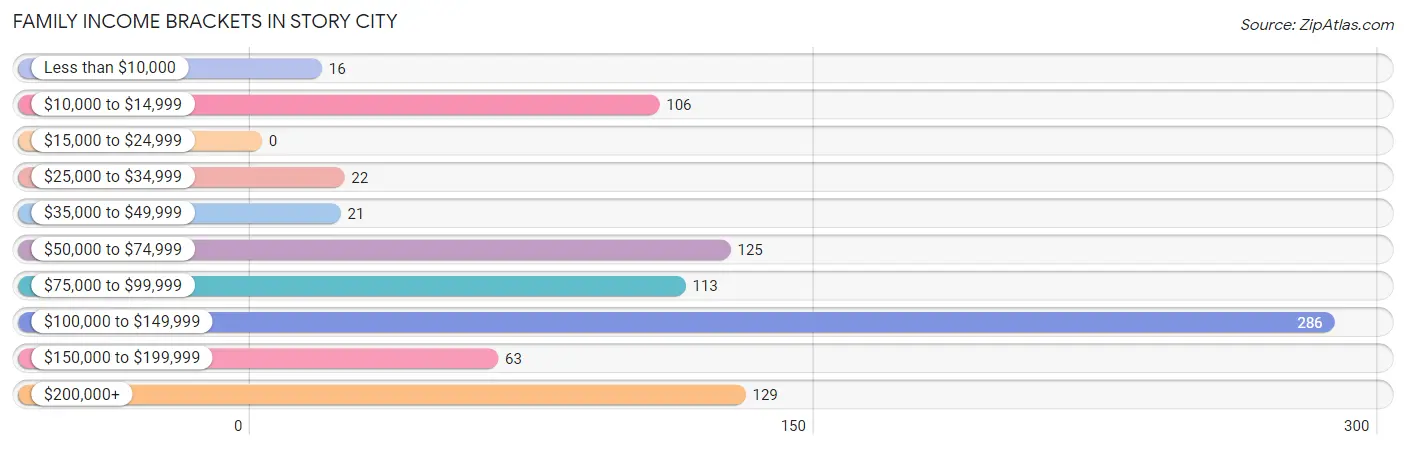
| Income Bracket | # Families | % Families |
| Less than $10,000 | 16 | 1.8% |
| $10,000 to $14,999 | 106 | 12.0% |
| $15,000 to $24,999 | 0 | 0.0% |
| $25,000 to $34,999 | 22 | 2.5% |
| $35,000 to $49,999 | 21 | 2.4% |
| $50,000 to $74,999 | 125 | 14.2% |
| $75,000 to $99,999 | 113 | 12.8% |
| $100,000 to $149,999 | 286 | 32.5% |
| $150,000 to $199,999 | 63 | 7.2% |
| $200,000+ | 129 | 14.6% |
Family Income by Famaliy Size in Story City
5-person families (124 | 14.1%) account for the highest median family income in Story City with $215,221 per family, while 2-person families (380 | 43.1%) have the highest median income of $55,132 per family member.
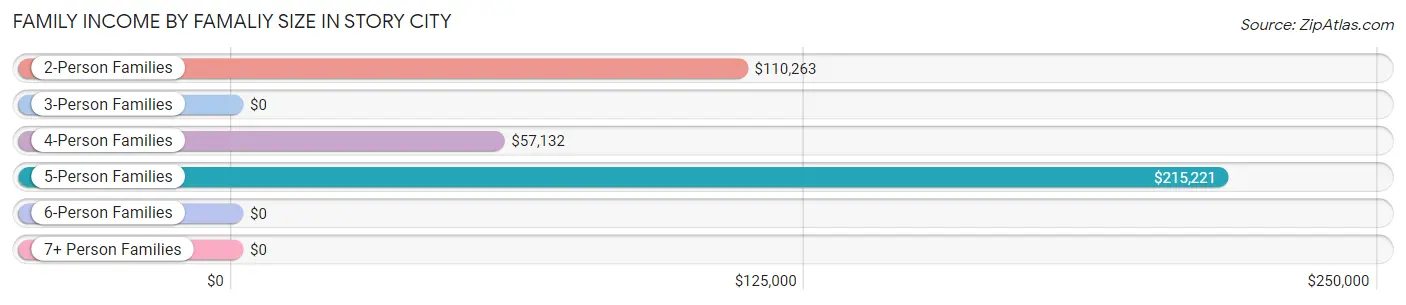
| Income Bracket | # Families | Median Income |
| 2-Person Families | 380 (43.1%) | $110,263 |
| 3-Person Families | 280 (31.8%) | $0 |
| 4-Person Families | 77 (8.7%) | $57,132 |
| 5-Person Families | 124 (14.1%) | $215,221 |
| 6-Person Families | 0 (0.0%) | $0 |
| 7+ Person Families | 20 (2.3%) | $0 |
| Total | 881 (100.0%) | $107,546 |
Family Income by Number of Earners in Story City
The median family income in Story City is $107,546, with families comprising 3+ earners (172) having the highest median family income of $173,571, while families with 1 earner (277) have the lowest median family income of $45,481, accounting for 19.5% and 31.4% of families, respectively.
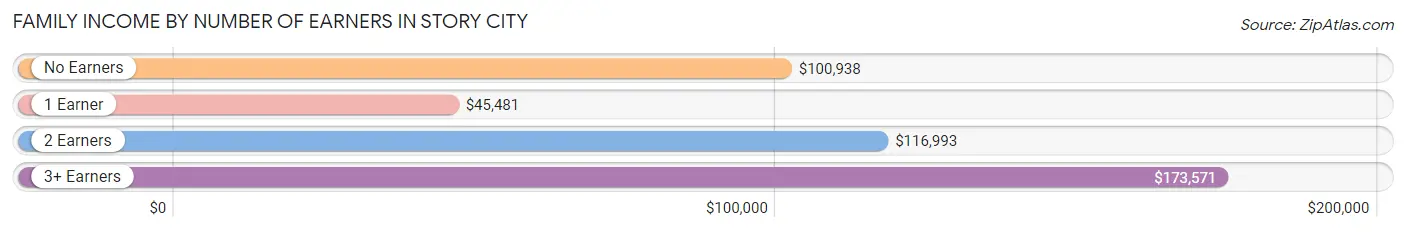
| Number of Earners | # Families | Median Income |
| No Earners | 91 (10.3%) | $100,938 |
| 1 Earner | 277 (31.4%) | $45,481 |
| 2 Earners | 341 (38.7%) | $116,993 |
| 3+ Earners | 172 (19.5%) | $173,571 |
| Total | 881 (100.0%) | $107,546 |
Household Income in Story City
Household Income Brackets in Story City
With 332 households falling in the category, the $100,000 to $149,999 income range is the most frequent in Story City, accounting for 22.7% of all households.
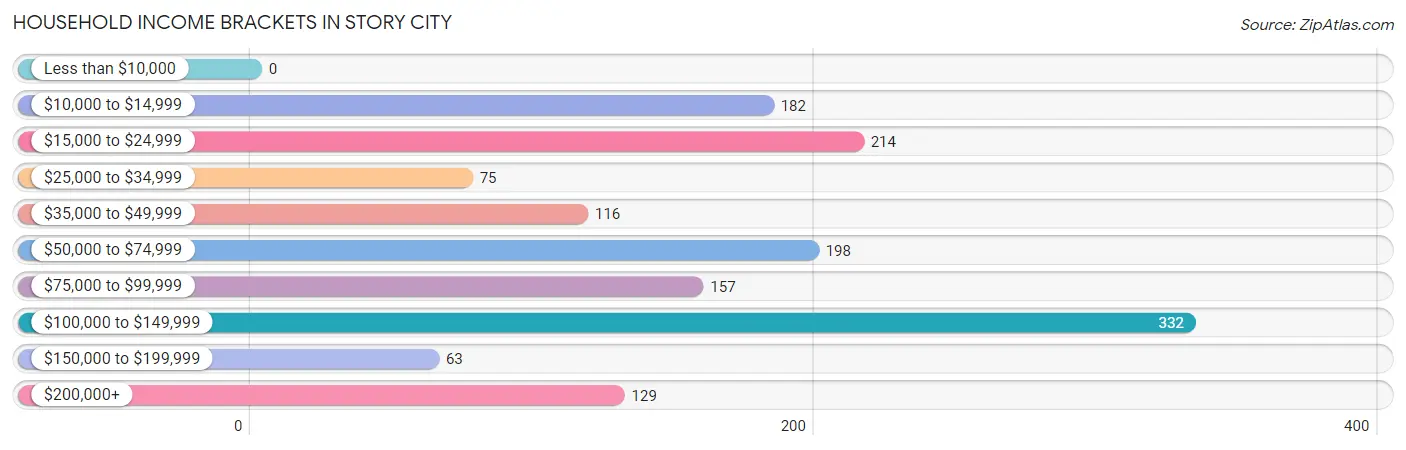
| Income Bracket | # Households | % Households |
| Less than $10,000 | 0 | 0.0% |
| $10,000 to $14,999 | 182 | 12.4% |
| $15,000 to $24,999 | 214 | 14.6% |
| $25,000 to $34,999 | 75 | 5.1% |
| $35,000 to $49,999 | 116 | 7.9% |
| $50,000 to $74,999 | 198 | 13.5% |
| $75,000 to $99,999 | 157 | 10.7% |
| $100,000 to $149,999 | 332 | 22.7% |
| $150,000 to $199,999 | 63 | 4.3% |
| $200,000+ | 129 | 8.8% |
Household Income by Householder Age in Story City
The median household income in Story City is $67,308, with the highest median household income of $110,197 found in the 45 to 64 years age bracket for the primary householder. A total of 430 households (29.4%) fall into this category. Meanwhile, the 15 to 24 years age bracket for the primary householder has the lowest median household income of $0, with 16 households (1.1%) in this group.
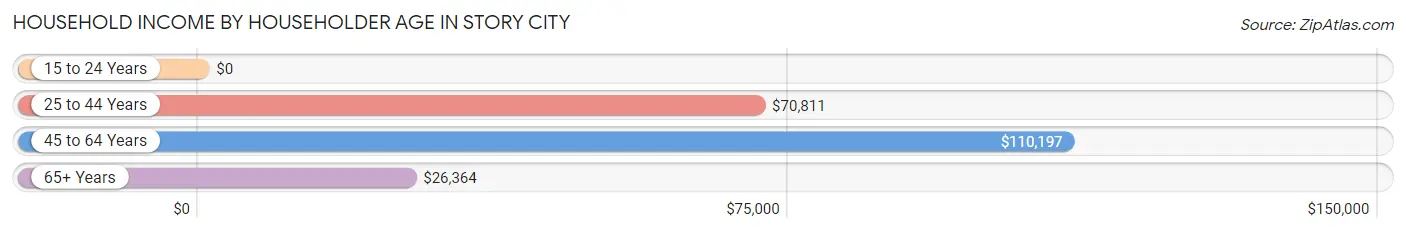
| Income Bracket | # Households | Median Income |
| 15 to 24 Years | 16 (1.1%) | $0 |
| 25 to 44 Years | 500 (34.2%) | $70,811 |
| 45 to 64 Years | 430 (29.4%) | $110,197 |
| 65+ Years | 518 (35.4%) | $26,364 |
| Total | 1,464 (100.0%) | $67,308 |
Poverty in Story City
Income Below Poverty by Sex and Age in Story City
With 17.1% poverty level for males and 11.6% for females among the residents of Story City, under 5 year old males and 18 to 24 year old females are the most vulnerable to poverty, with 120 males (69.8%) and 35 females (59.3%) in their respective age groups living below the poverty level.
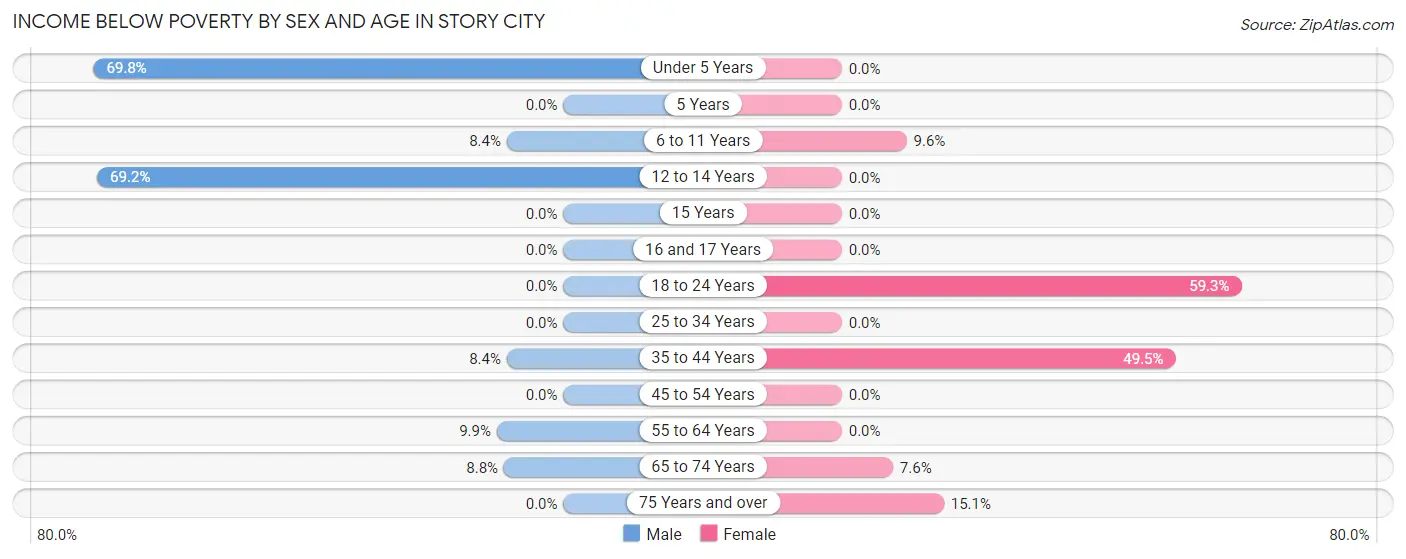
| Age Bracket | Male | Female |
| Under 5 Years | 120 (69.8%) | 0 (0.0%) |
| 5 Years | 0 (0.0%) | 0 (0.0%) |
| 6 to 11 Years | 10 (8.4%) | 23 (9.6%) |
| 12 to 14 Years | 72 (69.2%) | 0 (0.0%) |
| 15 Years | 0 (0.0%) | 0 (0.0%) |
| 16 and 17 Years | 0 (0.0%) | 0 (0.0%) |
| 18 to 24 Years | 0 (0.0%) | 35 (59.3%) |
| 25 to 34 Years | 0 (0.0%) | 0 (0.0%) |
| 35 to 44 Years | 11 (8.4%) | 106 (49.5%) |
| 45 to 54 Years | 0 (0.0%) | 0 (0.0%) |
| 55 to 64 Years | 16 (9.9%) | 0 (0.0%) |
| 65 to 74 Years | 15 (8.8%) | 18 (7.6%) |
| 75 Years and over | 0 (0.0%) | 28 (15.1%) |
| Total | 244 (17.1%) | 210 (11.6%) |
Income Above Poverty by Sex and Age in Story City
According to the poverty statistics in Story City, males aged 5 years and females aged under 5 years are the age groups that are most secure financially, with 100.0% of males and 100.0% of females in these age groups living above the poverty line.
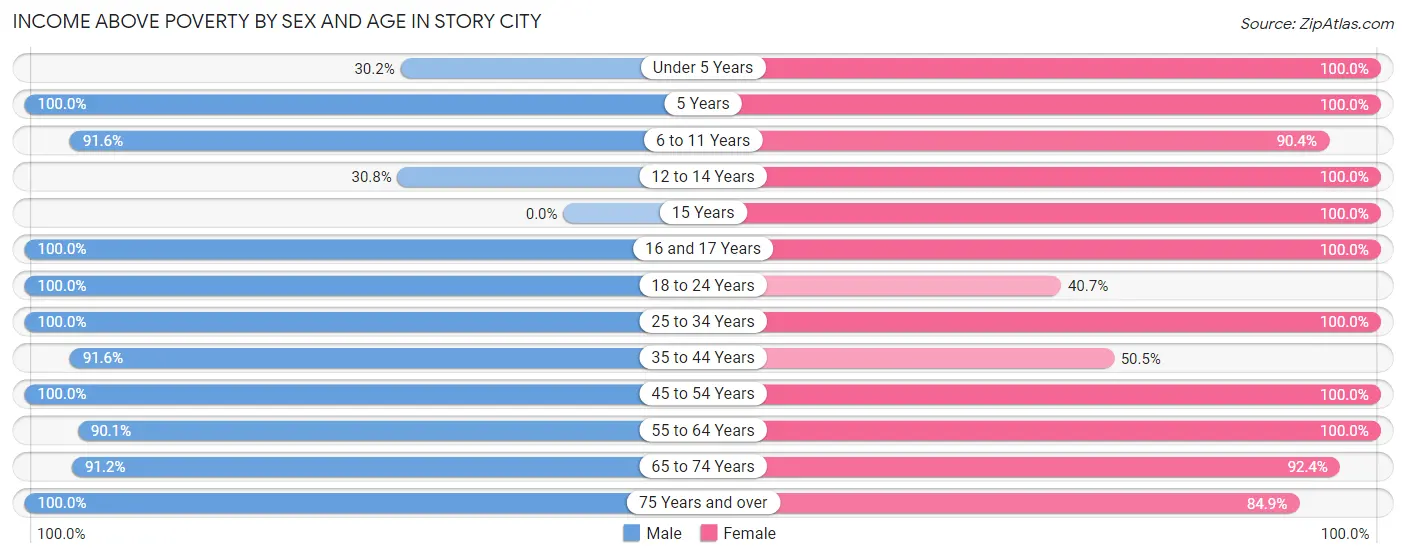
| Age Bracket | Male | Female |
| Under 5 Years | 52 (30.2%) | 71 (100.0%) |
| 5 Years | 10 (100.0%) | 10 (100.0%) |
| 6 to 11 Years | 109 (91.6%) | 216 (90.4%) |
| 12 to 14 Years | 32 (30.8%) | 35 (100.0%) |
| 15 Years | 0 (0.0%) | 24 (100.0%) |
| 16 and 17 Years | 19 (100.0%) | 77 (100.0%) |
| 18 to 24 Years | 33 (100.0%) | 24 (40.7%) |
| 25 to 34 Years | 214 (100.0%) | 253 (100.0%) |
| 35 to 44 Years | 120 (91.6%) | 108 (50.5%) |
| 45 to 54 Years | 210 (100.0%) | 208 (100.0%) |
| 55 to 64 Years | 146 (90.1%) | 194 (100.0%) |
| 65 to 74 Years | 155 (91.2%) | 219 (92.4%) |
| 75 Years and over | 81 (100.0%) | 157 (84.9%) |
| Total | 1,181 (82.9%) | 1,596 (88.4%) |
Income Below Poverty Among Married-Couple Families in Story City
The poverty statistics for married-couple families in Story City show that 1.6% or 11 of the total 706 families live below the poverty line. Families with 1 or 2 children have the highest poverty rate of 4.0%, comprising of 11 families. On the other hand, families with no children have the lowest poverty rate of 0.0%, which includes 0 families.
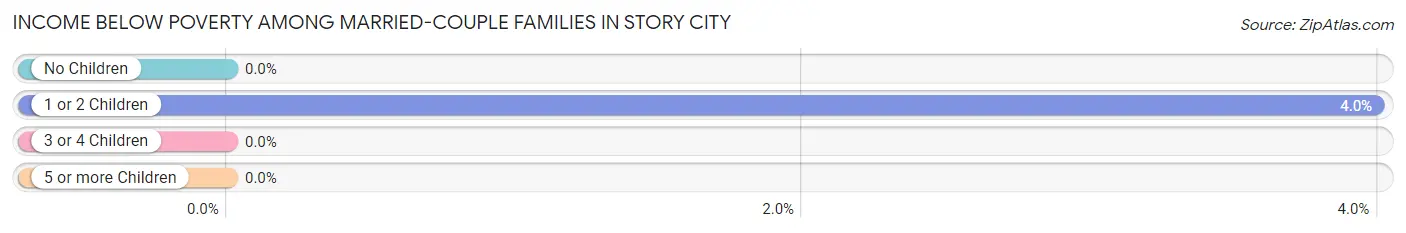
| Children | Above Poverty | Below Poverty |
| No Children | 385 (100.0%) | 0 (0.0%) |
| 1 or 2 Children | 265 (96.0%) | 11 (4.0%) |
| 3 or 4 Children | 32 (100.0%) | 0 (0.0%) |
| 5 or more Children | 13 (100.0%) | 0 (0.0%) |
| Total | 695 (98.4%) | 11 (1.6%) |
Income Below Poverty Among Single-Parent Households in Story City
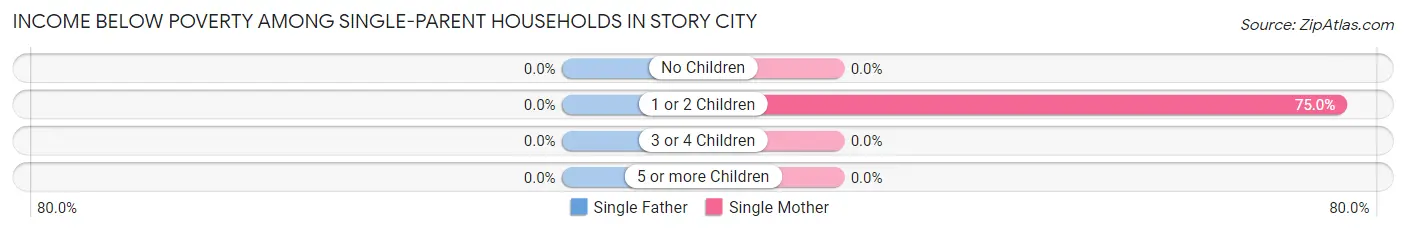
| Children | Single Father | Single Mother |
| No Children | 0 (0.0%) | 0 (0.0%) |
| 1 or 2 Children | 0 (0.0%) | 111 (75.0%) |
| 3 or 4 Children | 0 (0.0%) | 0 (0.0%) |
| 5 or more Children | 0 (0.0%) | 0 (0.0%) |
| Total | 0 (0.0%) | 111 (75.0%) |
Income Below Poverty Among Married-Couple vs Single-Parent Households in Story City
The poverty data for Story City shows that 11 of the married-couple family households (1.6%) and 111 of the single-parent households (63.4%) are living below the poverty level. Within the married-couple family households, those with 1 or 2 children have the highest poverty rate, with 11 households (4.0%) falling below the poverty line. Among the single-parent households, those with 1 or 2 children have the highest poverty rate, with 111 household (63.4%) living below poverty.
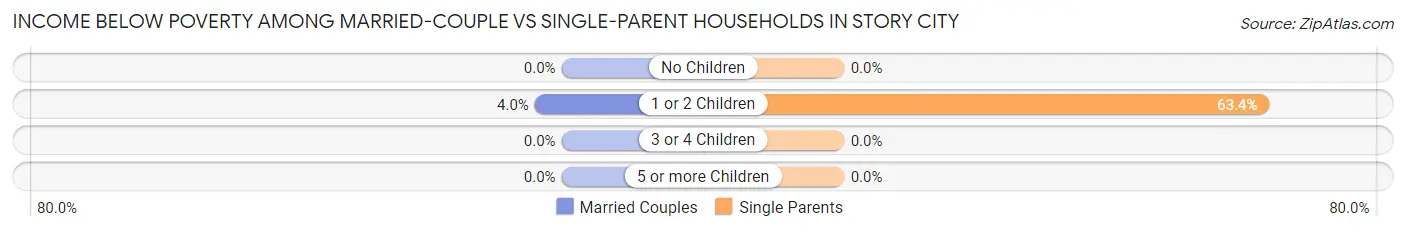
| Children | Married-Couple Families | Single-Parent Households |
| No Children | 0 (0.0%) | 0 (0.0%) |
| 1 or 2 Children | 11 (4.0%) | 111 (63.4%) |
| 3 or 4 Children | 0 (0.0%) | 0 (0.0%) |
| 5 or more Children | 0 (0.0%) | 0 (0.0%) |
| Total | 11 (1.6%) | 111 (63.4%) |
Race in Story City
The most populous races in Story City are White / Caucasian (3,253 | 97.1%), Hispanic or Latino (108 | 3.2%), and Two or more Races (68 | 2.0%).
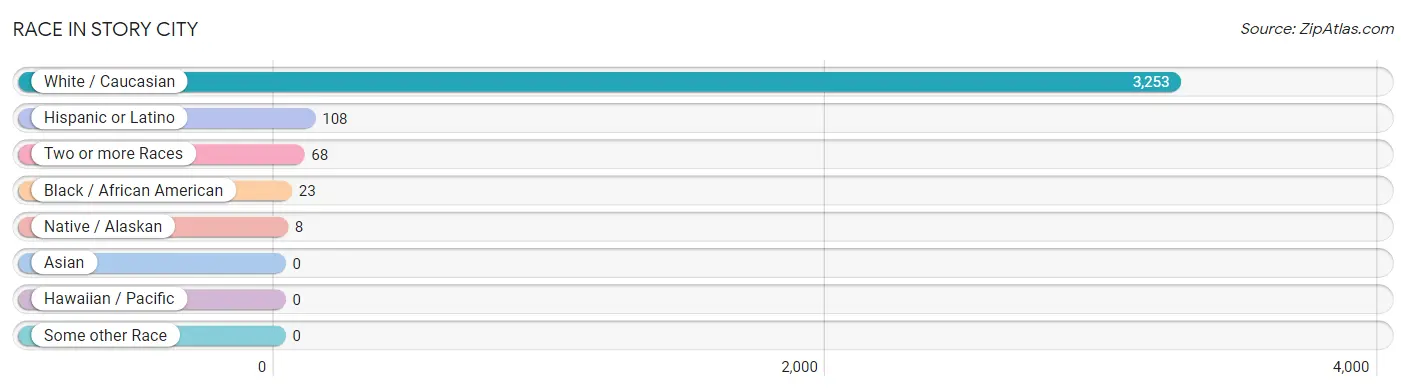
| Race | # Population | % Population |
| Asian | 0 | 0.0% |
| Black / African American | 23 | 0.7% |
| Hawaiian / Pacific | 0 | 0.0% |
| Hispanic or Latino | 108 | 3.2% |
| Native / Alaskan | 8 | 0.2% |
| White / Caucasian | 3,253 | 97.1% |
| Two or more Races | 68 | 2.0% |
| Some other Race | 0 | 0.0% |
| Total | 3,352 | 100.0% |
Ancestry in Story City
The most populous ancestries reported in Story City are German (1,098 | 32.8%), Norwegian (970 | 28.9%), English (333 | 9.9%), Irish (257 | 7.7%), and American (139 | 4.2%), together accounting for 83.4% of all Story City residents.
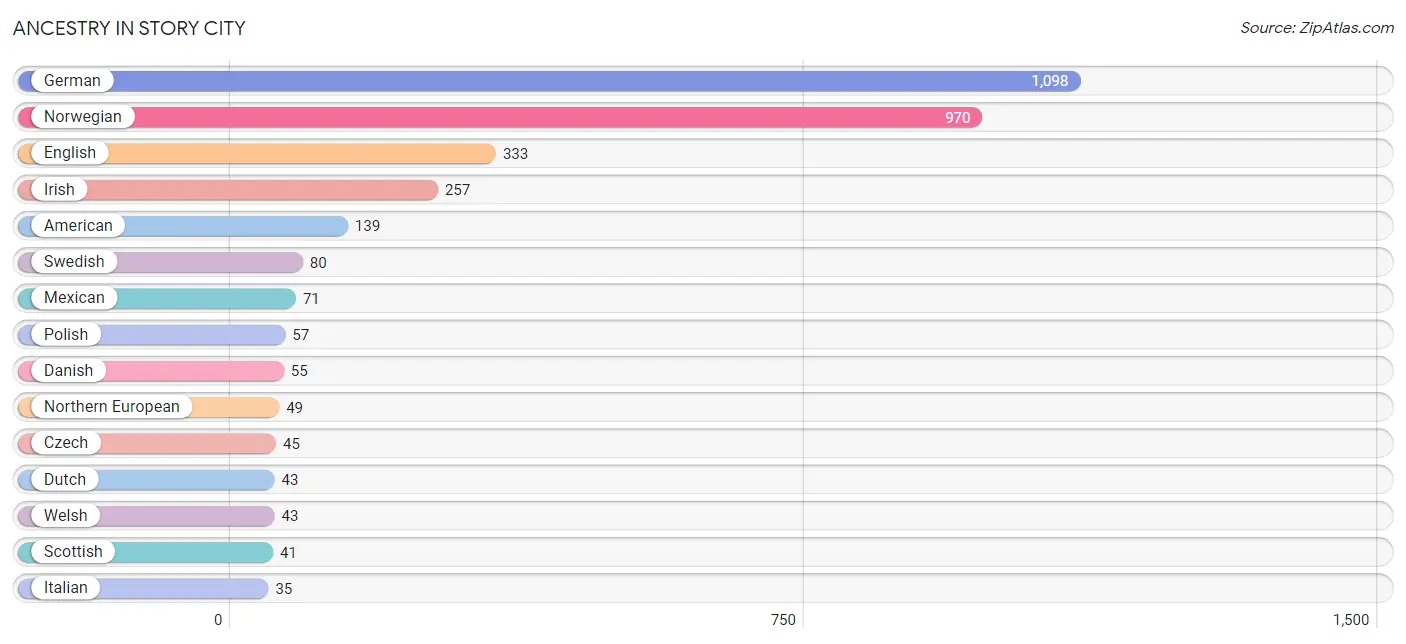
| Ancestry | # Population | % Population |
| American | 139 | 4.2% |
| British | 14 | 0.4% |
| Central American | 9 | 0.3% |
| Central American Indian | 9 | 0.3% |
| Czech | 45 | 1.3% |
| Danish | 55 | 1.6% |
| Dutch | 43 | 1.3% |
| English | 333 | 9.9% |
| European | 19 | 0.6% |
| German | 1,098 | 32.8% |
| Guatemalan | 9 | 0.3% |
| Inupiat | 8 | 0.2% |
| Irish | 257 | 7.7% |
| Italian | 35 | 1.0% |
| Luxembourger | 15 | 0.4% |
| Mexican | 71 | 2.1% |
| Northern European | 49 | 1.5% |
| Norwegian | 970 | 28.9% |
| Peruvian | 28 | 0.8% |
| Polish | 57 | 1.7% |
| Scotch-Irish | 30 | 0.9% |
| Scottish | 41 | 1.2% |
| South American | 28 | 0.8% |
| Swedish | 80 | 2.4% |
| Swiss | 13 | 0.4% |
| Welsh | 43 | 1.3% | View All 26 Rows |
Immigrants in Story City
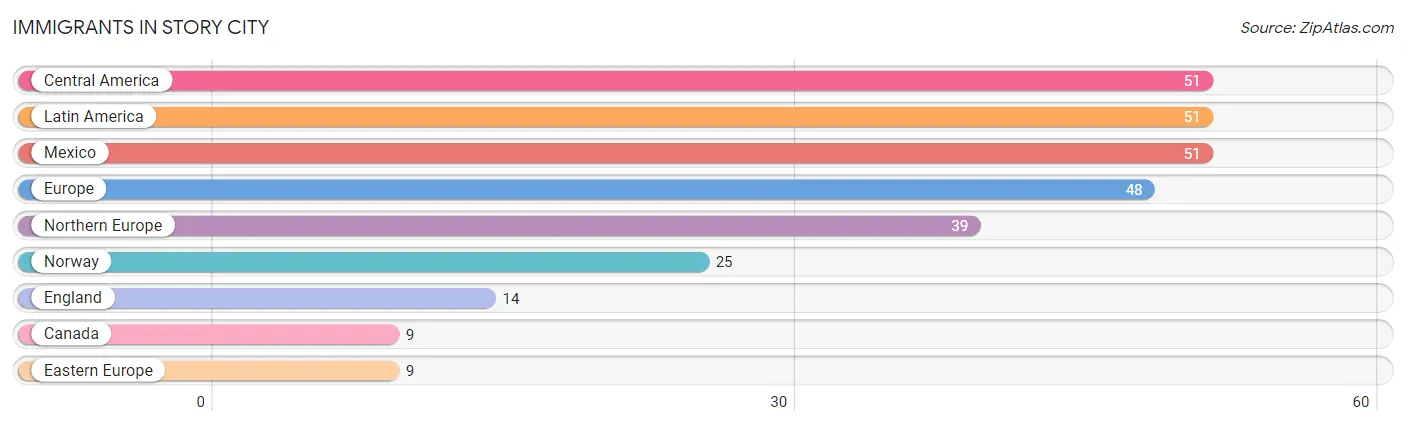
The most numerous immigrant groups reported in Story City came from Central America (51 | 1.5%), Latin America (51 | 1.5%), Mexico (51 | 1.5%), Europe (48 | 1.4%), and Northern Europe (39 | 1.2%), together accounting for 7.2% of all Story City residents.
| Immigration Origin | # Population | % Population |
| Canada | 9 | 0.3% |
| Central America | 51 | 1.5% |
| Eastern Europe | 9 | 0.3% |
| England | 14 | 0.4% |
| Europe | 48 | 1.4% |
| Latin America | 51 | 1.5% |
| Mexico | 51 | 1.5% |
| Northern Europe | 39 | 1.2% |
| Norway | 25 | 0.7% | View All 9 Rows |
Sex and Age in Story City
Sex and Age in Story City
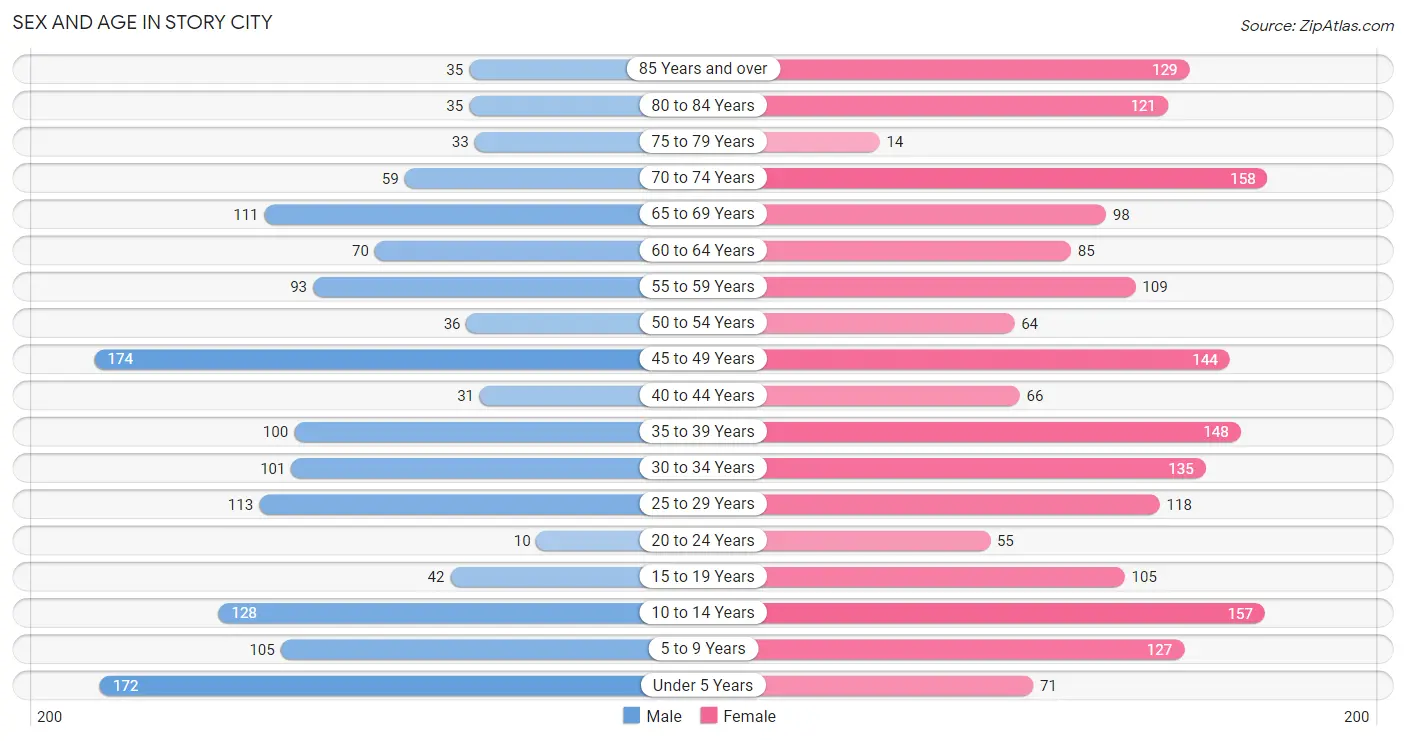
The most populous age groups in Story City are 45 to 49 Years (174 | 12.0%) for men and 70 to 74 Years (158 | 8.3%) for women.
| Age Bracket | Male | Female |
| Under 5 Years | 172 (11.9%) | 71 (3.7%) |
| 5 to 9 Years | 105 (7.2%) | 127 (6.7%) |
| 10 to 14 Years | 128 (8.8%) | 157 (8.3%) |
| 15 to 19 Years | 42 (2.9%) | 105 (5.5%) |
| 20 to 24 Years | 10 (0.7%) | 55 (2.9%) |
| 25 to 29 Years | 113 (7.8%) | 118 (6.2%) |
| 30 to 34 Years | 101 (7.0%) | 135 (7.1%) |
| 35 to 39 Years | 100 (6.9%) | 148 (7.8%) |
| 40 to 44 Years | 31 (2.1%) | 66 (3.5%) |
| 45 to 49 Years | 174 (12.0%) | 144 (7.6%) |
| 50 to 54 Years | 36 (2.5%) | 64 (3.4%) |
| 55 to 59 Years | 93 (6.4%) | 109 (5.7%) |
| 60 to 64 Years | 70 (4.8%) | 85 (4.5%) |
| 65 to 69 Years | 111 (7.7%) | 98 (5.1%) |
| 70 to 74 Years | 59 (4.1%) | 158 (8.3%) |
| 75 to 79 Years | 33 (2.3%) | 14 (0.7%) |
| 80 to 84 Years | 35 (2.4%) | 121 (6.4%) |
| 85 Years and over | 35 (2.4%) | 129 (6.8%) |
| Total | 1,448 (100.0%) | 1,904 (100.0%) |
Families and Households in Story City
Median Family Size in Story City
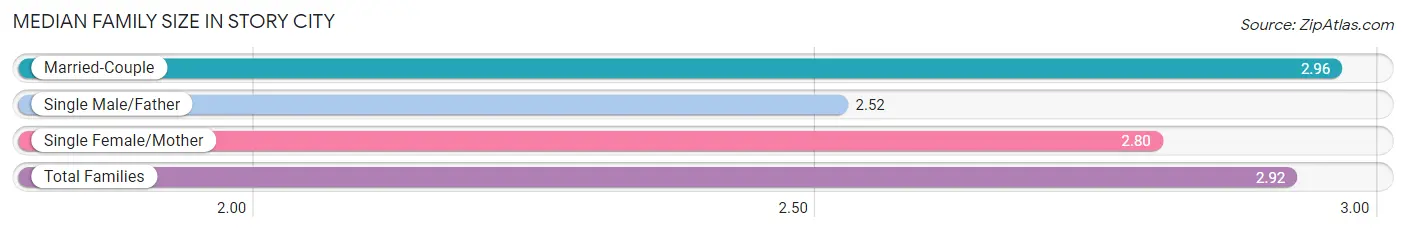
The median family size in Story City is 2.92 persons per family, with married-couple families (706 | 80.1%) accounting for the largest median family size of 2.96 persons per family. On the other hand, single male/father families (27 | 3.1%) represent the smallest median family size with 2.52 persons per family.
| Family Type | # Families | Family Size |
| Married-Couple | 706 (80.1%) | 2.96 |
| Single Male/Father | 27 (3.1%) | 2.52 |
| Single Female/Mother | 148 (16.8%) | 2.80 |
| Total Families | 881 (100.0%) | 2.92 |
Median Household Size in Story City
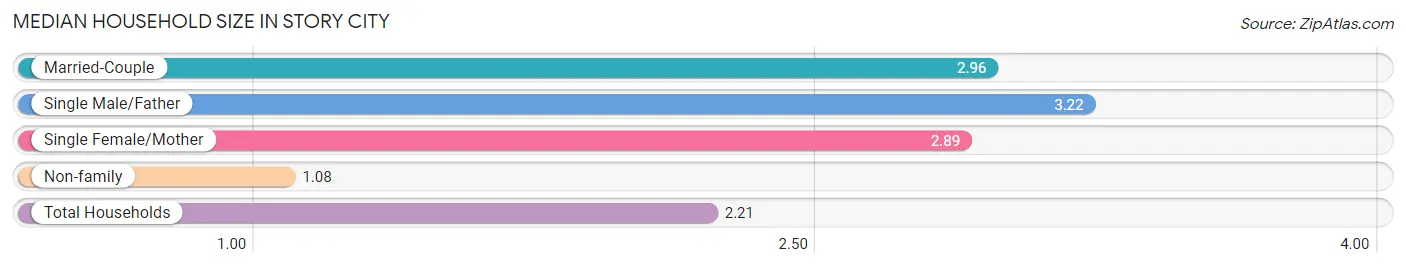
The median household size in Story City is 2.21 persons per household, with single male/father households (27 | 1.8%) accounting for the largest median household size of 3.22 persons per household. non-family households (583 | 39.8%) represent the smallest median household size with 1.08 persons per household.
| Household Type | # Households | Household Size |
| Married-Couple | 706 (48.2%) | 2.96 |
| Single Male/Father | 27 (1.8%) | 3.22 |
| Single Female/Mother | 148 (10.1%) | 2.89 |
| Non-family | 583 (39.8%) | 1.08 |
| Total Households | 1,464 (100.0%) | 2.21 |
Household Size by Marriage Status in Story City
Out of a total of 1,464 households in Story City, 881 (60.2%) are family households, while 583 (39.8%) are nonfamily households. The most numerous type of family households are 2-person households, comprising 364, and the most common type of nonfamily households are 1-person households, comprising 533.
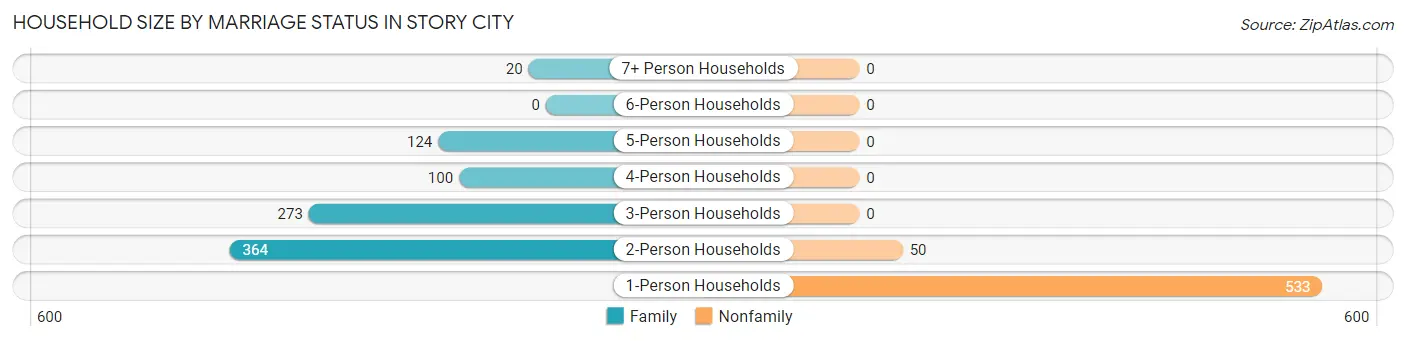
| Household Size | Family Households | Nonfamily Households |
| 1-Person Households | - | 533 (36.4%) |
| 2-Person Households | 364 (24.9%) | 50 (3.4%) |
| 3-Person Households | 273 (18.6%) | 0 (0.0%) |
| 4-Person Households | 100 (6.8%) | 0 (0.0%) |
| 5-Person Households | 124 (8.5%) | 0 (0.0%) |
| 6-Person Households | 0 (0.0%) | 0 (0.0%) |
| 7+ Person Households | 20 (1.4%) | 0 (0.0%) |
| Total | 881 (60.2%) | 583 (39.8%) |
Female Fertility in Story City
Fertility by Age in Story City
Average fertility rate in Story City is 43.0 births per 1,000 women. Women in the age bracket of 20 to 34 years have the highest fertility rate with 88.0 births per 1,000 women. Women in the age bracket of 20 to 34 years acount for 77.1% of all women with births.
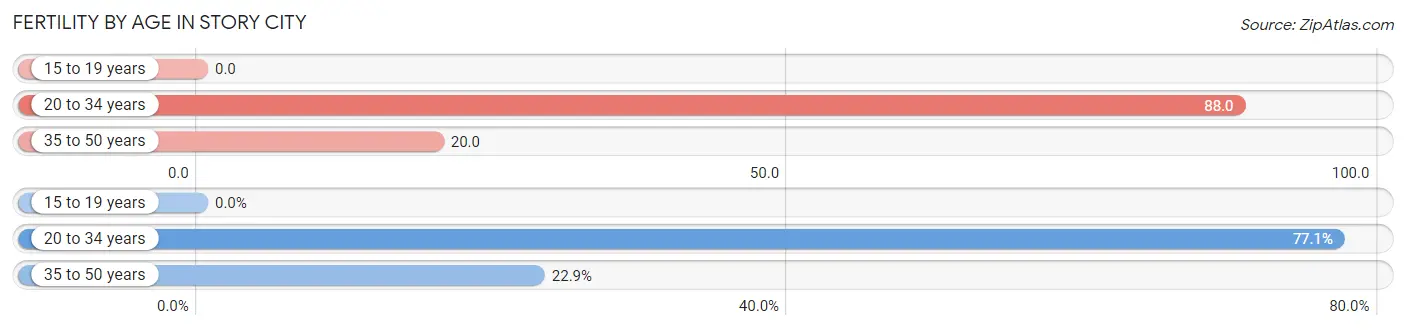
| Age Bracket | Women with Births | Births / 1,000 Women |
| 15 to 19 years | 0 (0.0%) | 0.0 |
| 20 to 34 years | 27 (77.1%) | 88.0 |
| 35 to 50 years | 8 (22.9%) | 20.0 |
| Total | 35 (100.0%) | 43.0 |
Fertility by Age by Marriage Status in Story City
77.1% of women with births (35) in Story City are married. The highest percentage of unmarried women with births falls into 35 to 50 years age bracket with 100.0% of them unmarried at the time of birth, while the lowest percentage of unmarried women with births belong to 20 to 34 years age bracket with 0.0% of them unmarried.
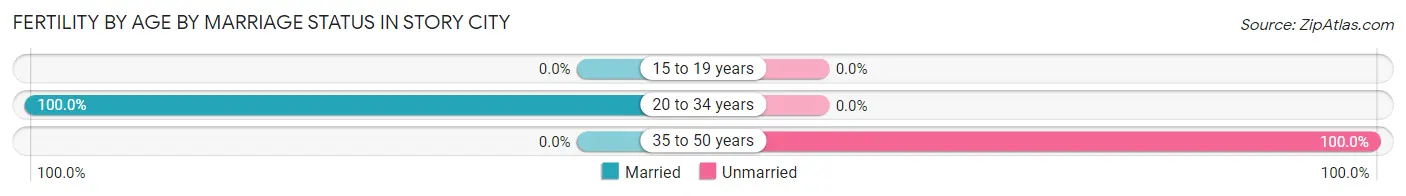
| Age Bracket | Married | Unmarried |
| 15 to 19 years | 0 (0.0%) | 0 (0.0%) |
| 20 to 34 years | 27 (100.0%) | 0 (0.0%) |
| 35 to 50 years | 0 (0.0%) | 8 (100.0%) |
| Total | 27 (77.1%) | 8 (22.9%) |
Fertility by Education in Story City
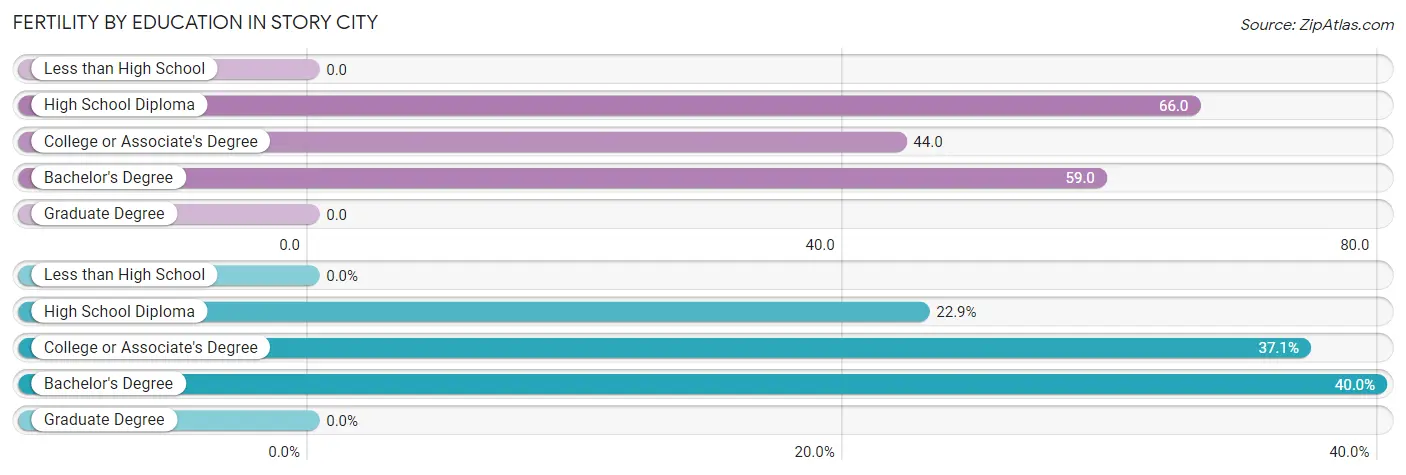
| Educational Attainment | Women with Births | Births / 1,000 Women |
| Less than High School | 0 (0.0%) | 0.0 |
| High School Diploma | 8 (22.9%) | 66.0 |
| College or Associate's Degree | 13 (37.1%) | 44.0 |
| Bachelor's Degree | 14 (40.0%) | 59.0 |
| Graduate Degree | 0 (0.0%) | 0.0 |
| Total | 35 (100.0%) | 43.0 |
Fertility by Education by Marriage Status in Story City
22.9% of women with births in Story City are unmarried. Women with the educational attainment of college or associate's degree are most likely to be married with 100.0% of them married at childbirth, while women with the educational attainment of high school diploma are least likely to be married with 100.0% of them unmarried at childbirth.
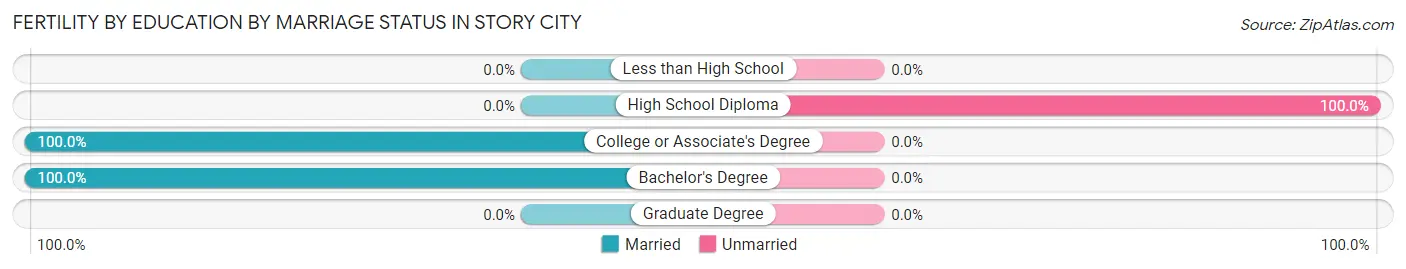
| Educational Attainment | Married | Unmarried |
| Less than High School | 0 (0.0%) | 0 (0.0%) |
| High School Diploma | 0 (0.0%) | 8 (100.0%) |
| College or Associate's Degree | 13 (100.0%) | 0 (0.0%) |
| Bachelor's Degree | 14 (100.0%) | 0 (0.0%) |
| Graduate Degree | 0 (0.0%) | 0 (0.0%) |
| Total | 27 (77.1%) | 8 (22.9%) |
Employment Characteristics in Story City
Employment by Class of Employer in Story City
Among the 1,571 employed individuals in Story City, private company employees (908 | 57.8%), local government employees (197 | 12.5%), and self-employed (incorporated) (141 | 9.0%) make up the most common classes of employment.
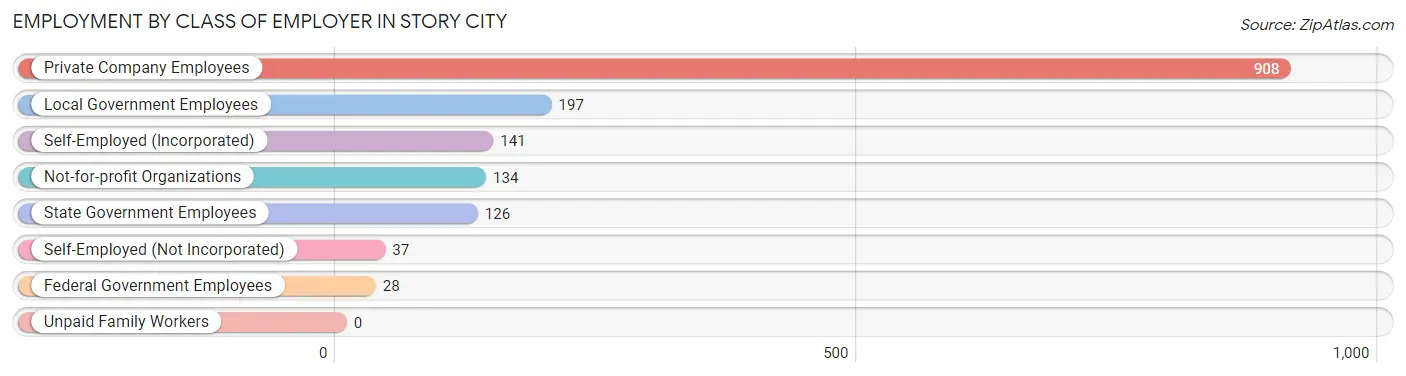
| Employer Class | # Employees | % Employees |
| Private Company Employees | 908 | 57.8% |
| Self-Employed (Incorporated) | 141 | 9.0% |
| Self-Employed (Not Incorporated) | 37 | 2.4% |
| Not-for-profit Organizations | 134 | 8.5% |
| Local Government Employees | 197 | 12.5% |
| State Government Employees | 126 | 8.0% |
| Federal Government Employees | 28 | 1.8% |
| Unpaid Family Workers | 0 | 0.0% |
| Total | 1,571 | 100.0% |
Employment Status by Age in Story City
According to the labor force statistics for Story City, out of the total population over 16 years of age (2,568), 64.9% or 1,667 individuals are in the labor force, with 4.0% or 67 of them unemployed. The age group with the highest labor force participation rate is 25 to 29 years, with 93.9% or 217 individuals in the labor force. Within the labor force, the 65 to 74 years age range has the highest percentage of unemployed individuals, with 39.9% or 67 of them being unemployed.
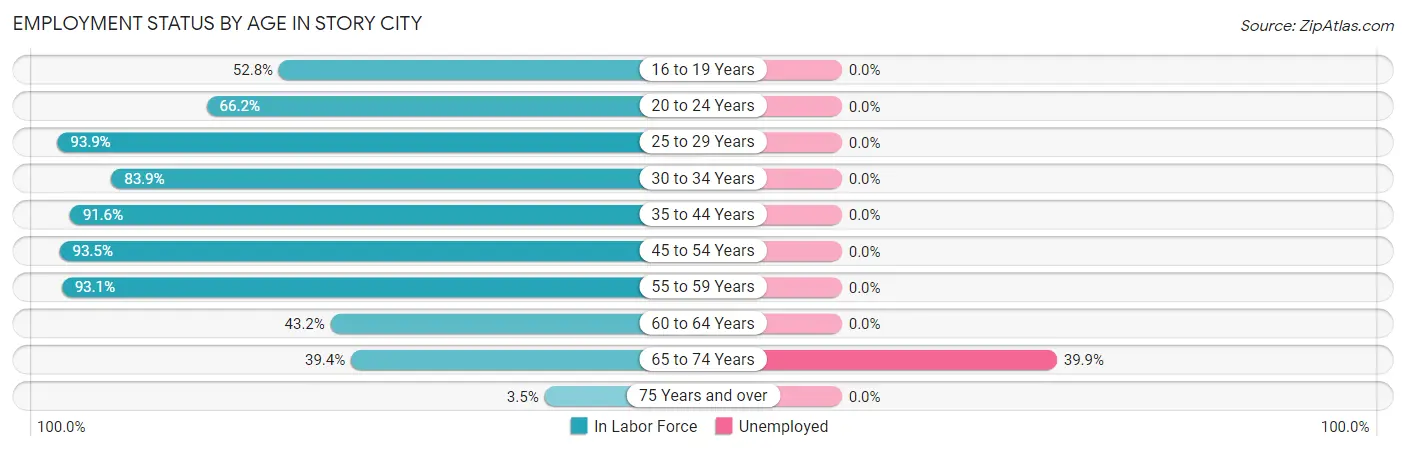
| Age Bracket | In Labor Force | Unemployed |
| 16 to 19 Years | 65 (52.8%) | 0 (0.0%) |
| 20 to 24 Years | 43 (66.2%) | 0 (0.0%) |
| 25 to 29 Years | 217 (93.9%) | 0 (0.0%) |
| 30 to 34 Years | 198 (83.9%) | 0 (0.0%) |
| 35 to 44 Years | 316 (91.6%) | 0 (0.0%) |
| 45 to 54 Years | 391 (93.5%) | 0 (0.0%) |
| 55 to 59 Years | 188 (93.1%) | 0 (0.0%) |
| 60 to 64 Years | 67 (43.2%) | 0 (0.0%) |
| 65 to 74 Years | 168 (39.4%) | 67 (39.9%) |
| 75 Years and over | 13 (3.5%) | 0 (0.0%) |
| Total | 1,667 (64.9%) | 67 (4.0%) |
Employment Status by Educational Attainment in Story City
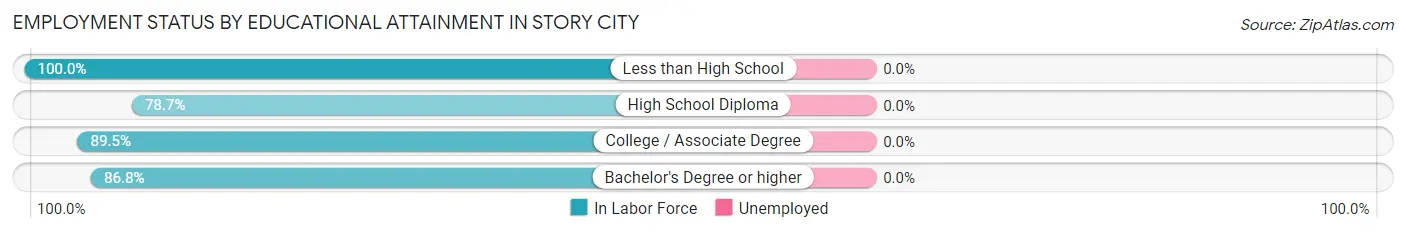
| Educational Attainment | In Labor Force | Unemployed |
| Less than High School | 9 (100.0%) | 0 (0.0%) |
| High School Diploma | 199 (78.7%) | 0 (0.0%) |
| College / Associate Degree | 624 (89.5%) | 0 (0.0%) |
| Bachelor's Degree or higher | 545 (86.8%) | 0 (0.0%) |
| Total | 1,378 (86.8%) | 0 (0.0%) |
Employment Occupations by Sex in Story City
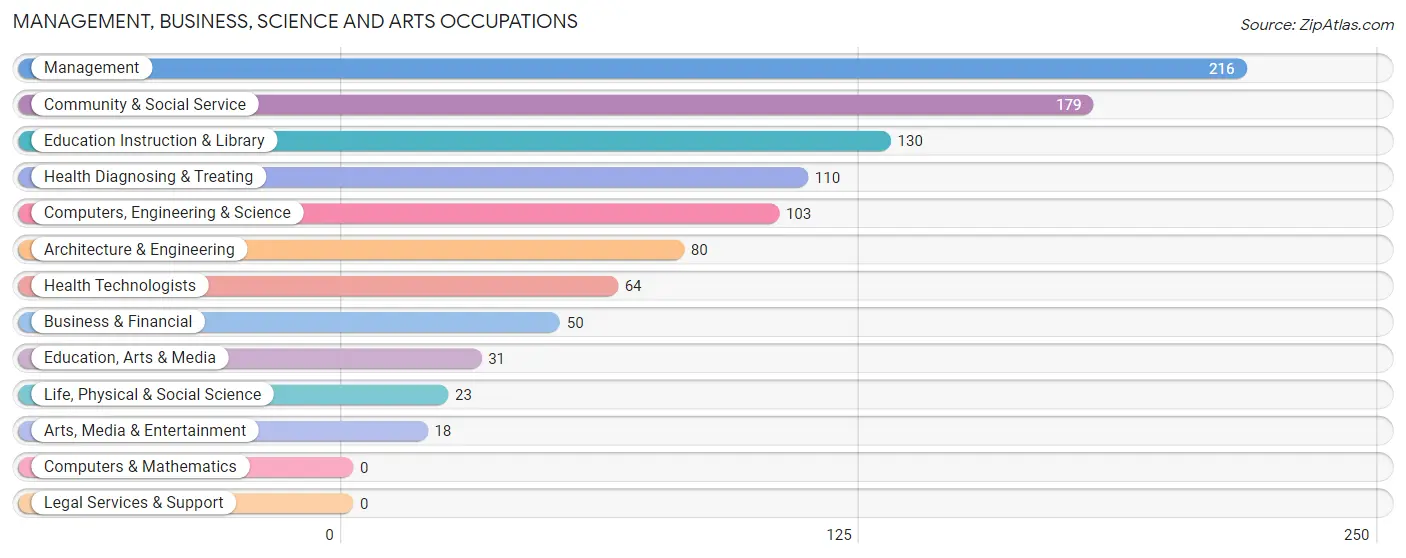
Management, Business, Science and Arts Occupations
The most common Management, Business, Science and Arts occupations in Story City are Management (216 | 13.5%), Community & Social Service (179 | 11.2%), Education Instruction & Library (130 | 8.1%), Health Diagnosing & Treating (110 | 6.9%), and Computers, Engineering & Science (103 | 6.4%).
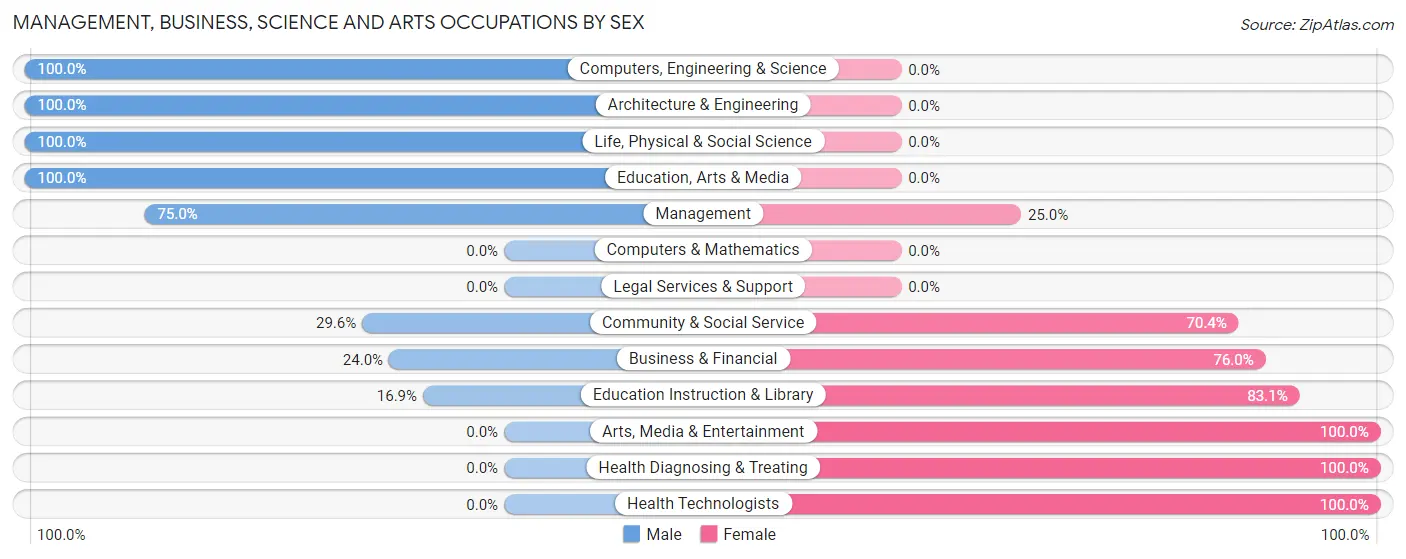
Management, Business, Science and Arts Occupations by Sex
Within the Management, Business, Science and Arts occupations in Story City, the most male-oriented occupations are Computers, Engineering & Science (100.0%), Architecture & Engineering (100.0%), and Life, Physical & Social Science (100.0%), while the most female-oriented occupations are Arts, Media & Entertainment (100.0%), Health Diagnosing & Treating (100.0%), and Health Technologists (100.0%).
| Occupation | Male | Female |
| Management | 162 (75.0%) | 54 (25.0%) |
| Business & Financial | 12 (24.0%) | 38 (76.0%) |
| Computers, Engineering & Science | 103 (100.0%) | 0 (0.0%) |
| Computers & Mathematics | 0 (0.0%) | 0 (0.0%) |
| Architecture & Engineering | 80 (100.0%) | 0 (0.0%) |
| Life, Physical & Social Science | 23 (100.0%) | 0 (0.0%) |
| Community & Social Service | 53 (29.6%) | 126 (70.4%) |
| Education, Arts & Media | 31 (100.0%) | 0 (0.0%) |
| Legal Services & Support | 0 (0.0%) | 0 (0.0%) |
| Education Instruction & Library | 22 (16.9%) | 108 (83.1%) |
| Arts, Media & Entertainment | 0 (0.0%) | 18 (100.0%) |
| Health Diagnosing & Treating | 0 (0.0%) | 110 (100.0%) |
| Health Technologists | 0 (0.0%) | 64 (100.0%) |
| Total (Category) | 330 (50.1%) | 328 (49.8%) |
| Total (Overall) | 738 (46.2%) | 861 (53.8%) |
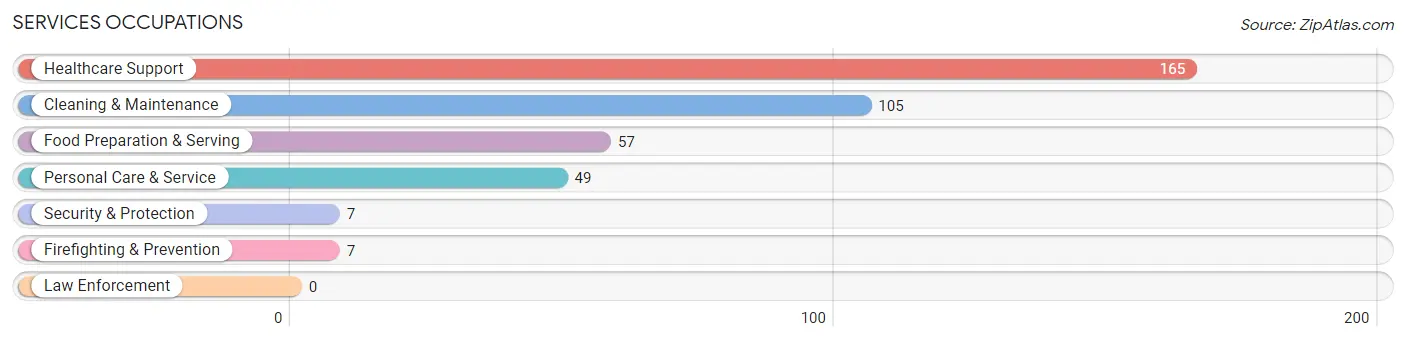
Services Occupations
The most common Services occupations in Story City are Healthcare Support (165 | 10.3%), Cleaning & Maintenance (105 | 6.6%), Food Preparation & Serving (57 | 3.6%), Personal Care & Service (49 | 3.1%), and Security & Protection (7 | 0.4%).
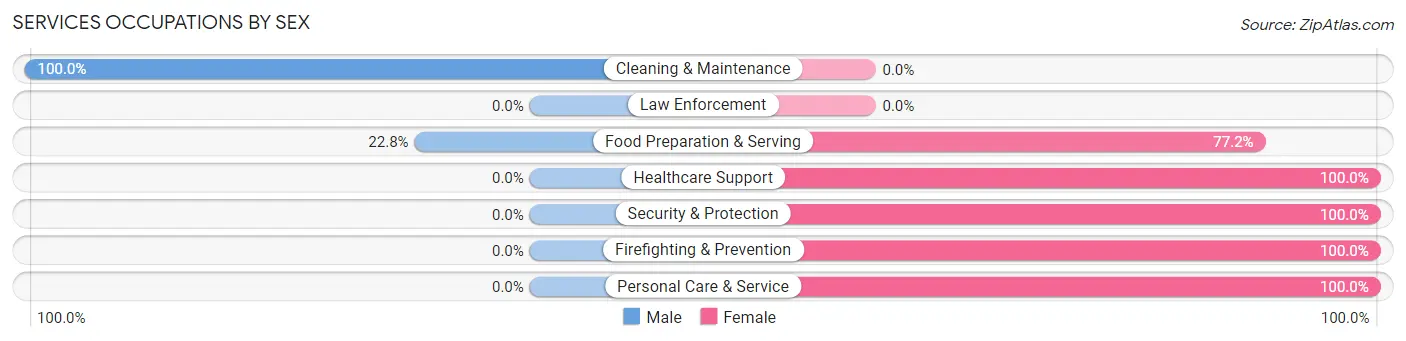
Services Occupations by Sex
Within the Services occupations in Story City, the most male-oriented occupations are Cleaning & Maintenance (100.0%), and Food Preparation & Serving (22.8%), while the most female-oriented occupations are Healthcare Support (100.0%), Security & Protection (100.0%), and Firefighting & Prevention (100.0%).
| Occupation | Male | Female |
| Healthcare Support | 0 (0.0%) | 165 (100.0%) |
| Security & Protection | 0 (0.0%) | 7 (100.0%) |
| Firefighting & Prevention | 0 (0.0%) | 7 (100.0%) |
| Law Enforcement | 0 (0.0%) | 0 (0.0%) |
| Food Preparation & Serving | 13 (22.8%) | 44 (77.2%) |
| Cleaning & Maintenance | 105 (100.0%) | 0 (0.0%) |
| Personal Care & Service | 0 (0.0%) | 49 (100.0%) |
| Total (Category) | 118 (30.8%) | 265 (69.2%) |
| Total (Overall) | 738 (46.2%) | 861 (53.8%) |
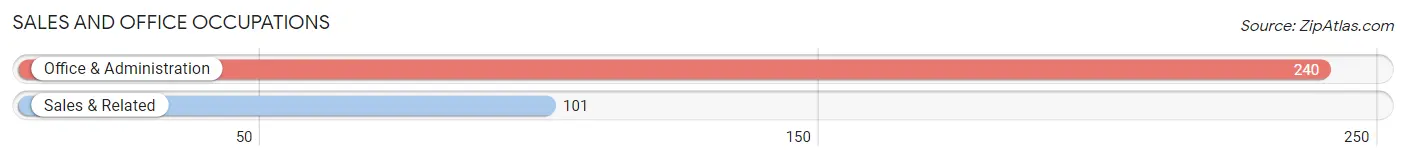
Sales and Office Occupations
The most common Sales and Office occupations in Story City are Office & Administration (240 | 15.0%), and Sales & Related (101 | 6.3%).
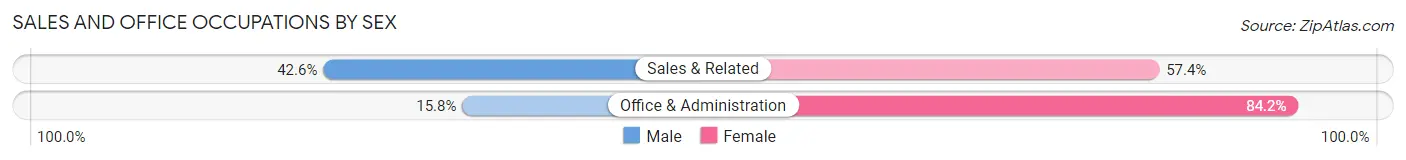
Sales and Office Occupations by Sex
| Occupation | Male | Female |
| Sales & Related | 43 (42.6%) | 58 (57.4%) |
| Office & Administration | 38 (15.8%) | 202 (84.2%) |
| Total (Category) | 81 (23.7%) | 260 (76.2%) |
| Total (Overall) | 738 (46.2%) | 861 (53.8%) |
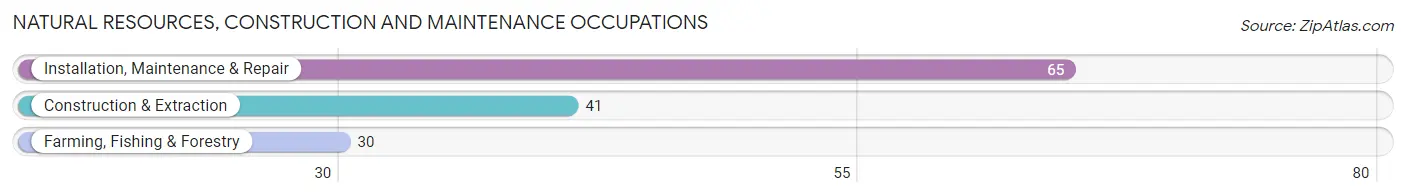
Natural Resources, Construction and Maintenance Occupations
The most common Natural Resources, Construction and Maintenance occupations in Story City are Installation, Maintenance & Repair (65 | 4.1%), Construction & Extraction (41 | 2.6%), and Farming, Fishing & Forestry (30 | 1.9%).
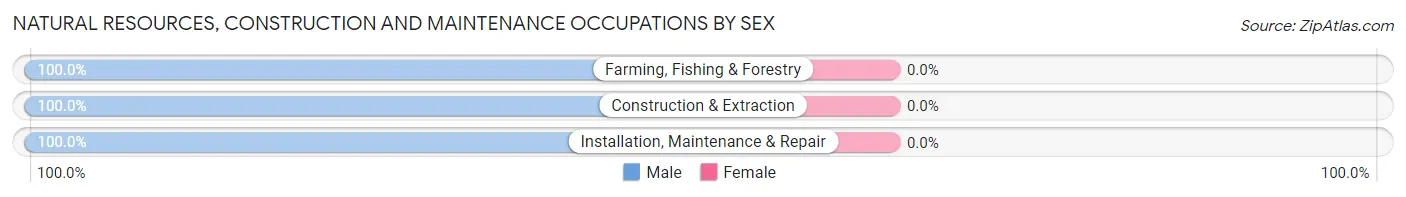
Natural Resources, Construction and Maintenance Occupations by Sex
| Occupation | Male | Female |
| Farming, Fishing & Forestry | 30 (100.0%) | 0 (0.0%) |
| Construction & Extraction | 41 (100.0%) | 0 (0.0%) |
| Installation, Maintenance & Repair | 65 (100.0%) | 0 (0.0%) |
| Total (Category) | 136 (100.0%) | 0 (0.0%) |
| Total (Overall) | 738 (46.2%) | 861 (53.8%) |
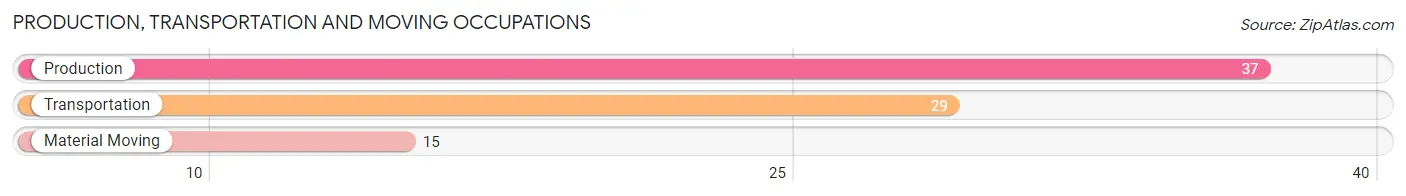
Production, Transportation and Moving Occupations
The most common Production, Transportation and Moving occupations in Story City are Production (37 | 2.3%), Transportation (29 | 1.8%), and Material Moving (15 | 0.9%).
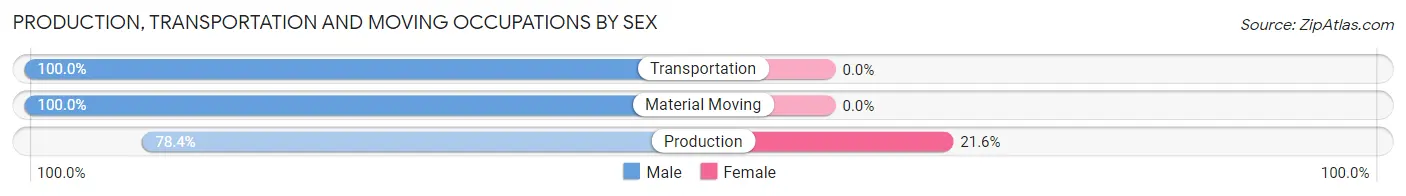
Production, Transportation and Moving Occupations by Sex
| Occupation | Male | Female |
| Production | 29 (78.4%) | 8 (21.6%) |
| Transportation | 29 (100.0%) | 0 (0.0%) |
| Material Moving | 15 (100.0%) | 0 (0.0%) |
| Total (Category) | 73 (90.1%) | 8 (9.9%) |
| Total (Overall) | 738 (46.2%) | 861 (53.8%) |
Employment Industries by Sex in Story City
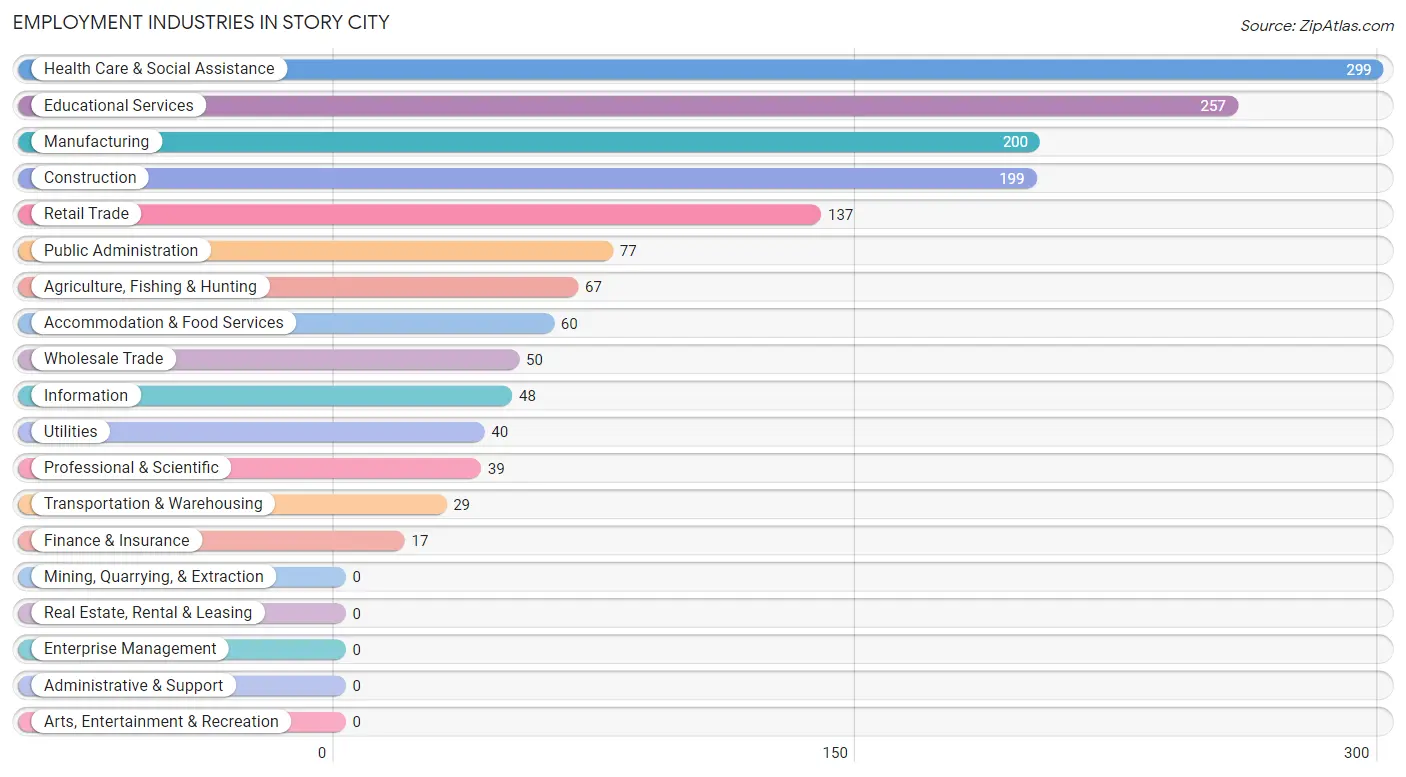
Employment Industries in Story City
The major employment industries in Story City include Health Care & Social Assistance (299 | 18.7%), Educational Services (257 | 16.1%), Manufacturing (200 | 12.5%), Construction (199 | 12.4%), and Retail Trade (137 | 8.6%).
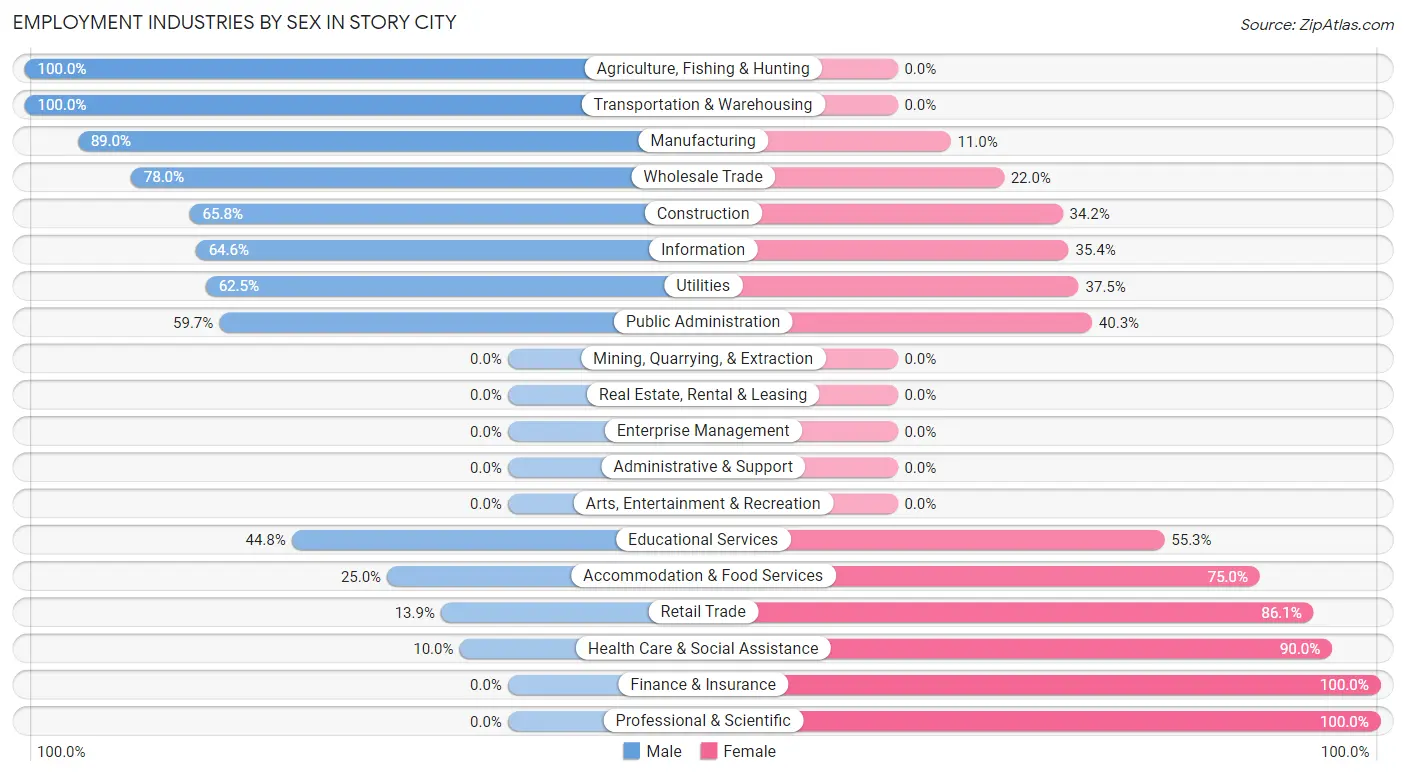
Employment Industries by Sex in Story City
The Story City industries that see more men than women are Agriculture, Fishing & Hunting (100.0%), Transportation & Warehousing (100.0%), and Manufacturing (89.0%), whereas the industries that tend to have a higher number of women are Finance & Insurance (100.0%), Professional & Scientific (100.0%), and Health Care & Social Assistance (90.0%).
| Industry | Male | Female |
| Agriculture, Fishing & Hunting | 67 (100.0%) | 0 (0.0%) |
| Mining, Quarrying, & Extraction | 0 (0.0%) | 0 (0.0%) |
| Construction | 131 (65.8%) | 68 (34.2%) |
| Manufacturing | 178 (89.0%) | 22 (11.0%) |
| Wholesale Trade | 39 (78.0%) | 11 (22.0%) |
| Retail Trade | 19 (13.9%) | 118 (86.1%) |
| Transportation & Warehousing | 29 (100.0%) | 0 (0.0%) |
| Utilities | 25 (62.5%) | 15 (37.5%) |
| Information | 31 (64.6%) | 17 (35.4%) |
| Finance & Insurance | 0 (0.0%) | 17 (100.0%) |
| Real Estate, Rental & Leasing | 0 (0.0%) | 0 (0.0%) |
| Professional & Scientific | 0 (0.0%) | 39 (100.0%) |
| Enterprise Management | 0 (0.0%) | 0 (0.0%) |
| Administrative & Support | 0 (0.0%) | 0 (0.0%) |
| Educational Services | 115 (44.8%) | 142 (55.2%) |
| Health Care & Social Assistance | 30 (10.0%) | 269 (90.0%) |
| Arts, Entertainment & Recreation | 0 (0.0%) | 0 (0.0%) |
| Accommodation & Food Services | 15 (25.0%) | 45 (75.0%) |
| Public Administration | 46 (59.7%) | 31 (40.3%) |
| Total | 738 (46.2%) | 861 (53.8%) |
Education in Story City
School Enrollment in Story City
The most common levels of schooling among the 690 students in Story City are elementary school (217 | 31.5%), high school (201 | 29.1%), and middle school (183 | 26.5%).
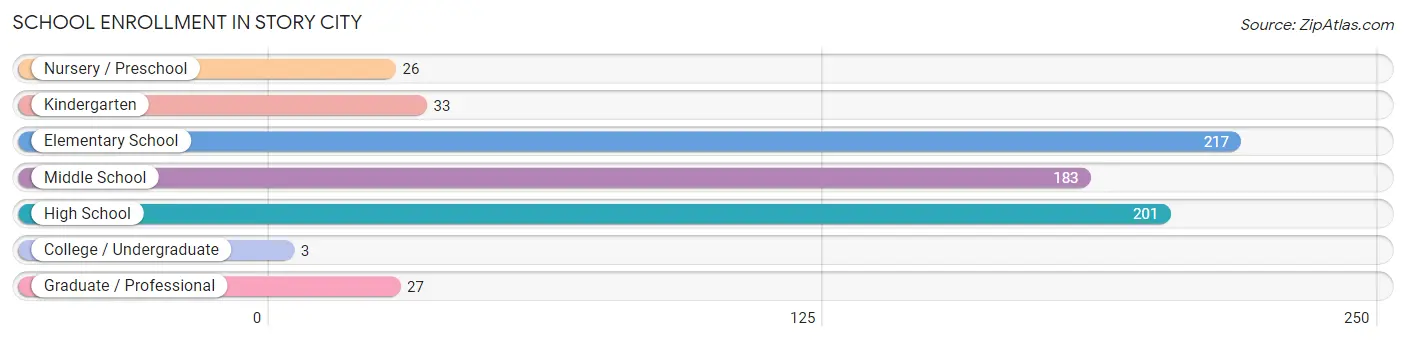
| School Level | # Students | % Students |
| Nursery / Preschool | 26 | 3.8% |
| Kindergarten | 33 | 4.8% |
| Elementary School | 217 | 31.5% |
| Middle School | 183 | 26.5% |
| High School | 201 | 29.1% |
| College / Undergraduate | 3 | 0.4% |
| Graduate / Professional | 27 | 3.9% |
| Total | 690 | 100.0% |
School Enrollment by Age by Funding Source in Story City
Out of a total of 690 students who are enrolled in schools in Story City, 202 (29.3%) attend a private institution, while the remaining 488 (70.7%) are enrolled in public schools. The age group of 3 to 4 year olds has the highest likelihood of being enrolled in private schools, with 16 (100.0% in the age bracket) enrolled. Conversely, the age group of 35 years and over has the lowest likelihood of being enrolled in a private school, with 14 (100.0% in the age bracket) attending a public institution.
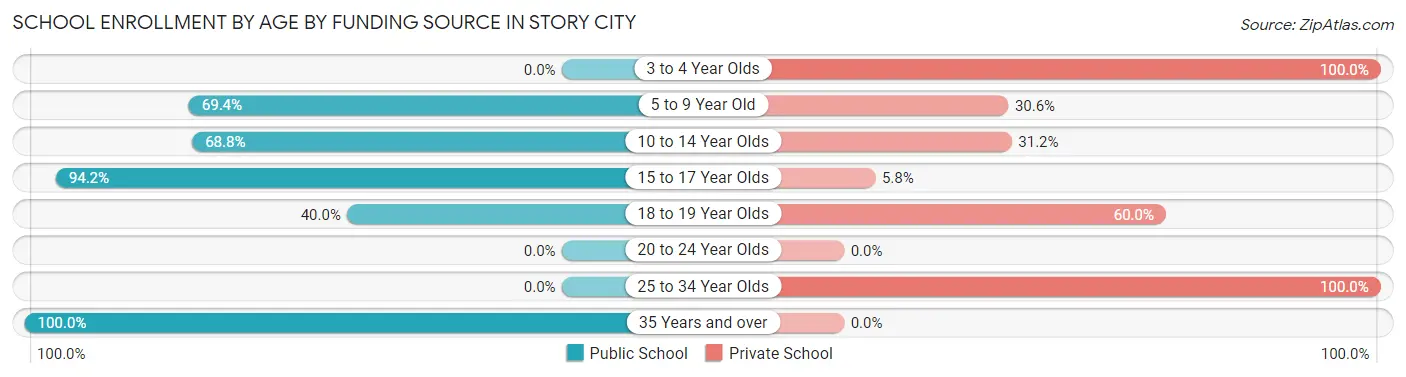
| Age Bracket | Public School | Private School |
| 3 to 4 Year Olds | 0 (0.0%) | 16 (100.0%) |
| 5 to 9 Year Old | 161 (69.4%) | 71 (30.6%) |
| 10 to 14 Year Olds | 196 (68.8%) | 89 (31.2%) |
| 15 to 17 Year Olds | 113 (94.2%) | 7 (5.8%) |
| 18 to 19 Year Olds | 4 (40.0%) | 6 (60.0%) |
| 20 to 24 Year Olds | 0 (0.0%) | 0 (0.0%) |
| 25 to 34 Year Olds | 0 (0.0%) | 13 (100.0%) |
| 35 Years and over | 14 (100.0%) | 0 (0.0%) |
| Total | 488 (70.7%) | 202 (29.3%) |
Educational Attainment by Field of Study in Story City
Education (225 | 25.3%), bio, nature & agricultural (161 | 18.1%), liberal arts & history (120 | 13.5%), science & technology (94 | 10.6%), and engineering (57 | 6.4%) are the most common fields of study among 888 individuals in Story City who have obtained a bachelor's degree or higher.
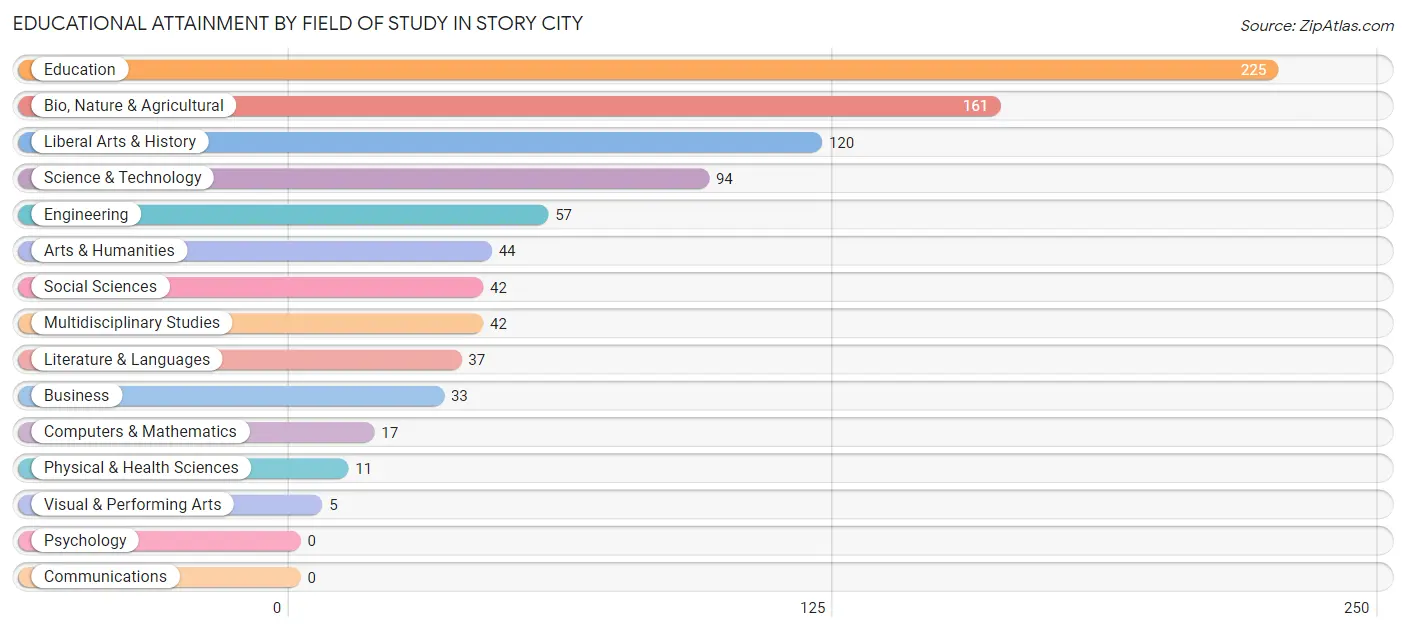
| Field of Study | # Graduates | % Graduates |
| Computers & Mathematics | 17 | 1.9% |
| Bio, Nature & Agricultural | 161 | 18.1% |
| Physical & Health Sciences | 11 | 1.2% |
| Psychology | 0 | 0.0% |
| Social Sciences | 42 | 4.7% |
| Engineering | 57 | 6.4% |
| Multidisciplinary Studies | 42 | 4.7% |
| Science & Technology | 94 | 10.6% |
| Business | 33 | 3.7% |
| Education | 225 | 25.3% |
| Literature & Languages | 37 | 4.2% |
| Liberal Arts & History | 120 | 13.5% |
| Visual & Performing Arts | 5 | 0.6% |
| Communications | 0 | 0.0% |
| Arts & Humanities | 44 | 5.0% |
| Total | 888 | 100.0% |
Transportation & Commute in Story City
Vehicle Availability by Sex in Story City
The most prevalent vehicle ownership categories in Story City are males with 2 vehicles (318, accounting for 43.1%) and females with 2 vehicles (243, making up 38.2%).
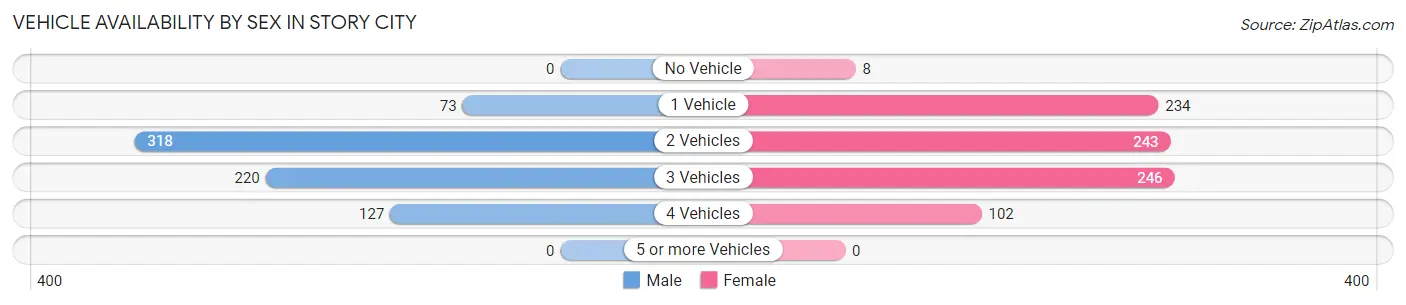
| Vehicles Available | Male | Female |
| No Vehicle | 0 (0.0%) | 8 (1.0%) |
| 1 Vehicle | 73 (9.9%) | 234 (28.1%) |
| 2 Vehicles | 318 (43.1%) | 243 (29.2%) |
| 3 Vehicles | 220 (29.8%) | 246 (29.5%) |
| 4 Vehicles | 127 (17.2%) | 102 (12.2%) |
| 5 or more Vehicles | 0 (0.0%) | 0 (0.0%) |
| Total | 738 (100.0%) | 833 (100.0%) |
Commute Time in Story City
The most frequently occuring commute durations in Story City are 20 to 24 minutes (362 commuters, 23.9%), 5 to 9 minutes (319 commuters, 21.0%), and 15 to 19 minutes (189 commuters, 12.5%).
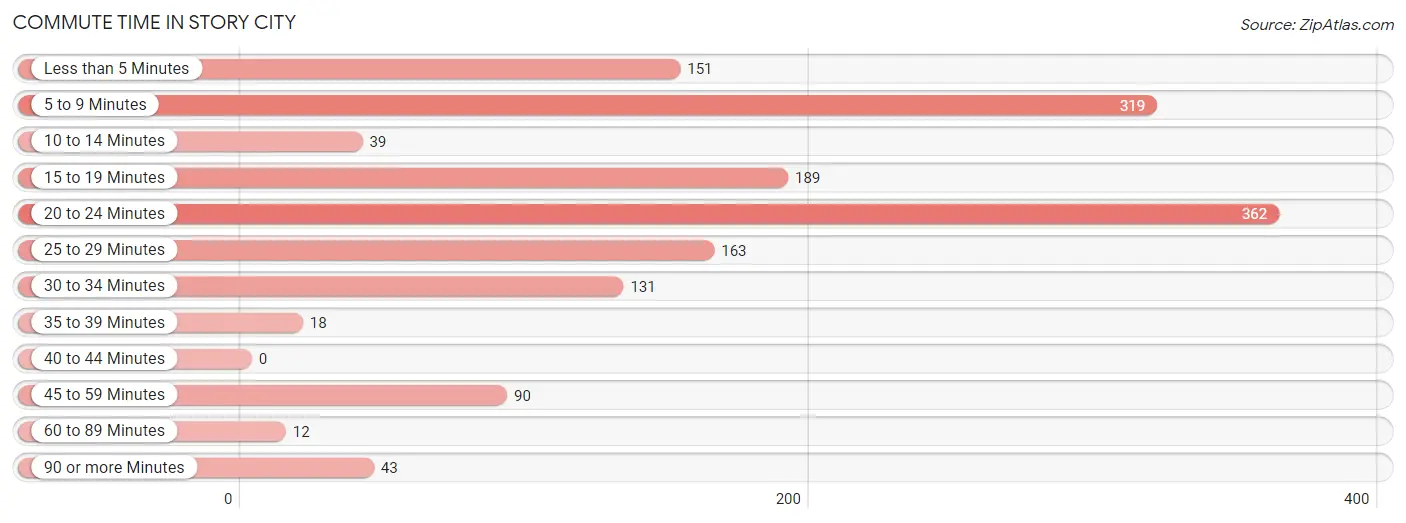
| Commute Time | # Commuters | % Commuters |
| Less than 5 Minutes | 151 | 10.0% |
| 5 to 9 Minutes | 319 | 21.0% |
| 10 to 14 Minutes | 39 | 2.6% |
| 15 to 19 Minutes | 189 | 12.5% |
| 20 to 24 Minutes | 362 | 23.9% |
| 25 to 29 Minutes | 163 | 10.7% |
| 30 to 34 Minutes | 131 | 8.6% |
| 35 to 39 Minutes | 18 | 1.2% |
| 40 to 44 Minutes | 0 | 0.0% |
| 45 to 59 Minutes | 90 | 5.9% |
| 60 to 89 Minutes | 12 | 0.8% |
| 90 or more Minutes | 43 | 2.8% |
Commute Time by Sex in Story City
The most common commute times in Story City are 5 to 9 minutes (223 commuters, 30.9%) for males and 20 to 24 minutes (270 commuters, 34.0%) for females.
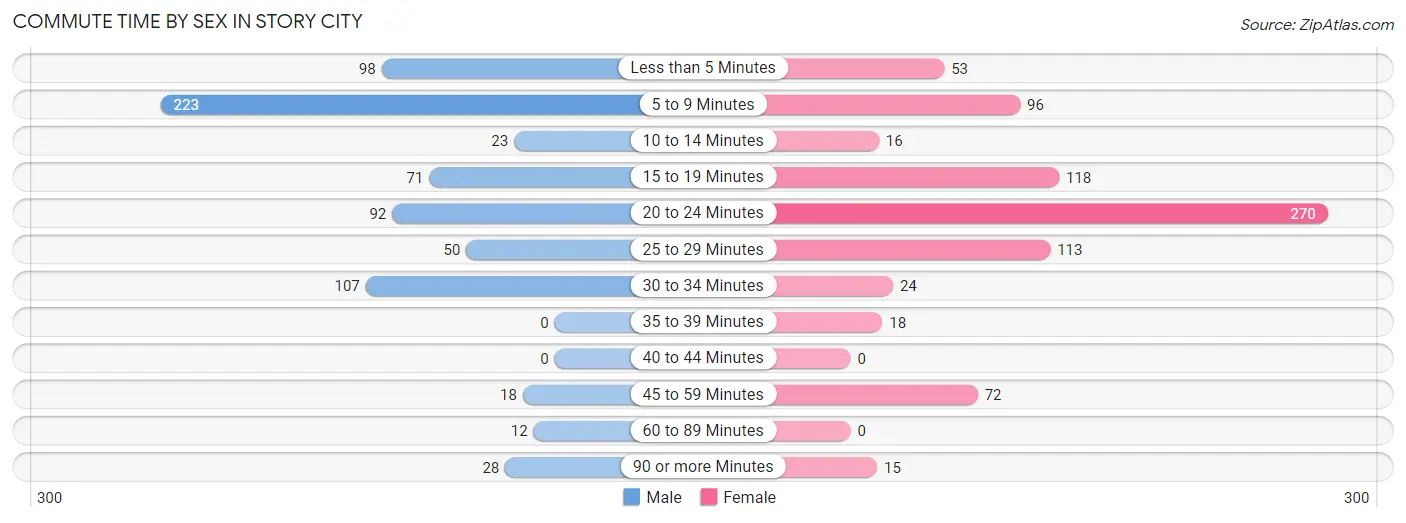
| Commute Time | Male | Female |
| Less than 5 Minutes | 98 (13.6%) | 53 (6.7%) |
| 5 to 9 Minutes | 223 (30.9%) | 96 (12.1%) |
| 10 to 14 Minutes | 23 (3.2%) | 16 (2.0%) |
| 15 to 19 Minutes | 71 (9.8%) | 118 (14.8%) |
| 20 to 24 Minutes | 92 (12.7%) | 270 (34.0%) |
| 25 to 29 Minutes | 50 (6.9%) | 113 (14.2%) |
| 30 to 34 Minutes | 107 (14.8%) | 24 (3.0%) |
| 35 to 39 Minutes | 0 (0.0%) | 18 (2.3%) |
| 40 to 44 Minutes | 0 (0.0%) | 0 (0.0%) |
| 45 to 59 Minutes | 18 (2.5%) | 72 (9.1%) |
| 60 to 89 Minutes | 12 (1.7%) | 0 (0.0%) |
| 90 or more Minutes | 28 (3.9%) | 15 (1.9%) |
Time of Departure to Work by Sex in Story City
The most frequent times of departure to work in Story City are 6:30 AM to 6:59 AM (152, 21.0%) for males and 12:00 AM to 4:59 AM (130, 16.4%) for females.
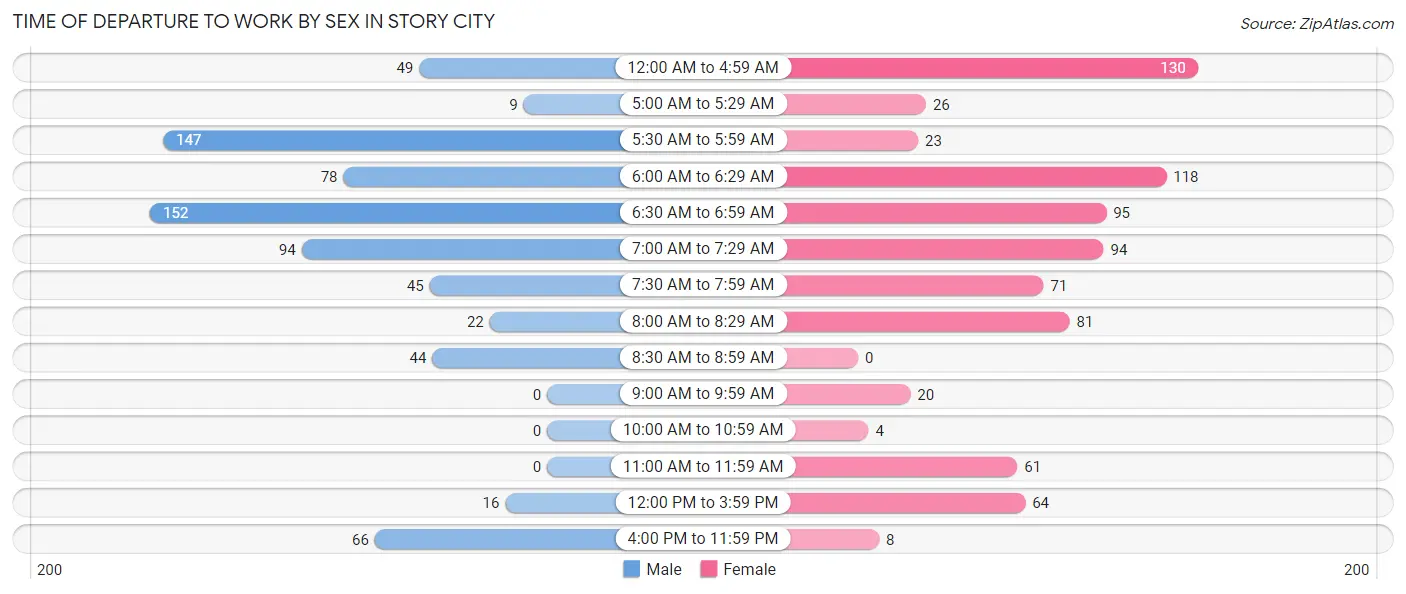
| Time of Departure | Male | Female |
| 12:00 AM to 4:59 AM | 49 (6.8%) | 130 (16.4%) |
| 5:00 AM to 5:29 AM | 9 (1.3%) | 26 (3.3%) |
| 5:30 AM to 5:59 AM | 147 (20.4%) | 23 (2.9%) |
| 6:00 AM to 6:29 AM | 78 (10.8%) | 118 (14.8%) |
| 6:30 AM to 6:59 AM | 152 (21.0%) | 95 (11.9%) |
| 7:00 AM to 7:29 AM | 94 (13.0%) | 94 (11.8%) |
| 7:30 AM to 7:59 AM | 45 (6.2%) | 71 (8.9%) |
| 8:00 AM to 8:29 AM | 22 (3.0%) | 81 (10.2%) |
| 8:30 AM to 8:59 AM | 44 (6.1%) | 0 (0.0%) |
| 9:00 AM to 9:59 AM | 0 (0.0%) | 20 (2.5%) |
| 10:00 AM to 10:59 AM | 0 (0.0%) | 4 (0.5%) |
| 11:00 AM to 11:59 AM | 0 (0.0%) | 61 (7.7%) |
| 12:00 PM to 3:59 PM | 16 (2.2%) | 64 (8.1%) |
| 4:00 PM to 11:59 PM | 66 (9.1%) | 8 (1.0%) |
| Total | 722 (100.0%) | 795 (100.0%) |
Housing Occupancy in Story City
Occupancy by Ownership in Story City
Of the total 1,464 dwellings in Story City, owner-occupied units account for 1,039 (71.0%), while renter-occupied units make up 425 (29.0%).
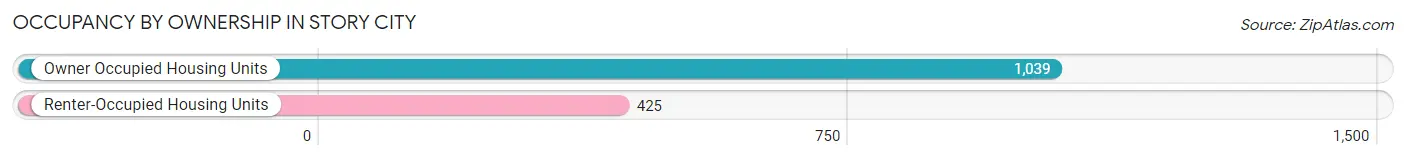
| Occupancy | # Housing Units | % Housing Units |
| Owner Occupied Housing Units | 1,039 | 71.0% |
| Renter-Occupied Housing Units | 425 | 29.0% |
| Total Occupied Housing Units | 1,464 | 100.0% |
Occupancy by Household Size in Story City
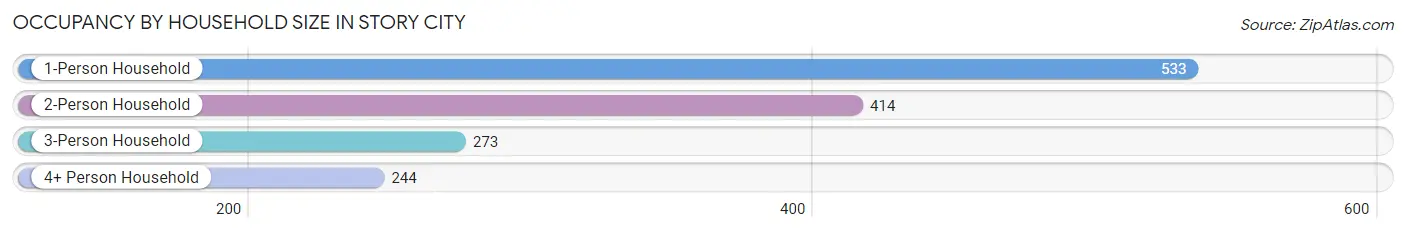
| Household Size | # Housing Units | % Housing Units |
| 1-Person Household | 533 | 36.4% |
| 2-Person Household | 414 | 28.3% |
| 3-Person Household | 273 | 18.6% |
| 4+ Person Household | 244 | 16.7% |
| Total Housing Units | 1,464 | 100.0% |
Occupancy by Ownership by Household Size in Story City
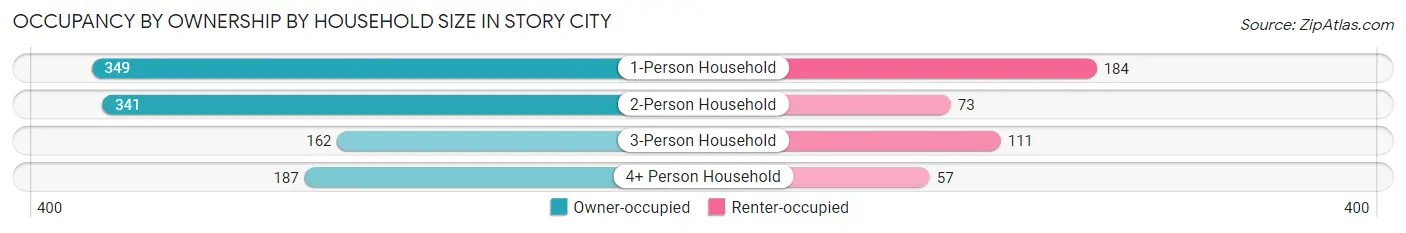
| Household Size | Owner-occupied | Renter-occupied |
| 1-Person Household | 349 (65.5%) | 184 (34.5%) |
| 2-Person Household | 341 (82.4%) | 73 (17.6%) |
| 3-Person Household | 162 (59.3%) | 111 (40.7%) |
| 4+ Person Household | 187 (76.6%) | 57 (23.4%) |
| Total Housing Units | 1,039 (71.0%) | 425 (29.0%) |
Occupancy by Educational Attainment in Story City
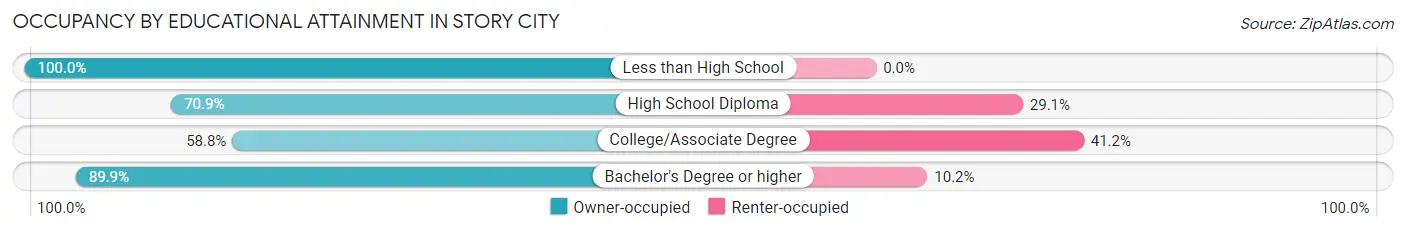
| Household Size | Owner-occupied | Renter-occupied |
| Less than High School | 12 (100.0%) | 0 (0.0%) |
| High School Diploma | 278 (70.9%) | 114 (29.1%) |
| College/Associate Degree | 386 (58.8%) | 270 (41.2%) |
| Bachelor's Degree or higher | 363 (89.8%) | 41 (10.2%) |
Occupancy by Age of Householder in Story City
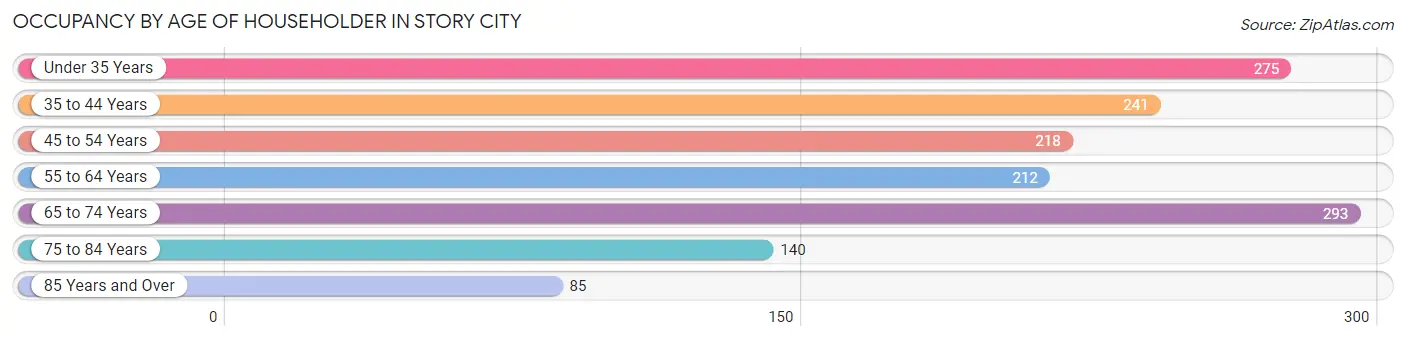
| Age Bracket | # Households | % Households |
| Under 35 Years | 275 | 18.8% |
| 35 to 44 Years | 241 | 16.5% |
| 45 to 54 Years | 218 | 14.9% |
| 55 to 64 Years | 212 | 14.5% |
| 65 to 74 Years | 293 | 20.0% |
| 75 to 84 Years | 140 | 9.6% |
| 85 Years and Over | 85 | 5.8% |
| Total | 1,464 | 100.0% |
Housing Finances in Story City
Median Income by Occupancy in Story City
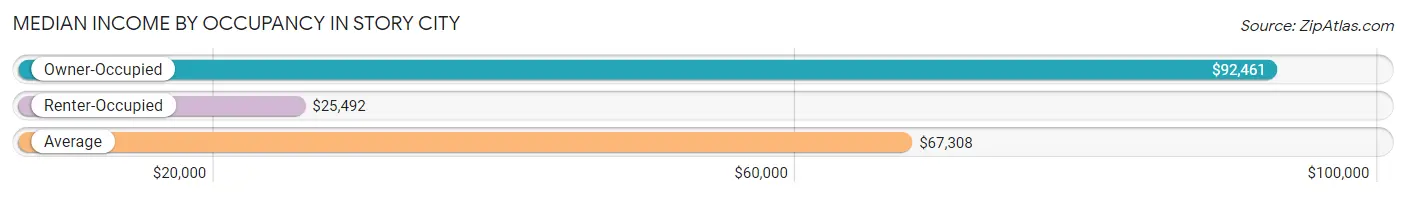
| Occupancy Type | # Households | Median Income |
| Owner-Occupied | 1,039 (71.0%) | $92,461 |
| Renter-Occupied | 425 (29.0%) | $25,492 |
| Average | 1,464 (100.0%) | $67,308 |
Occupancy by Householder Income Bracket in Story City
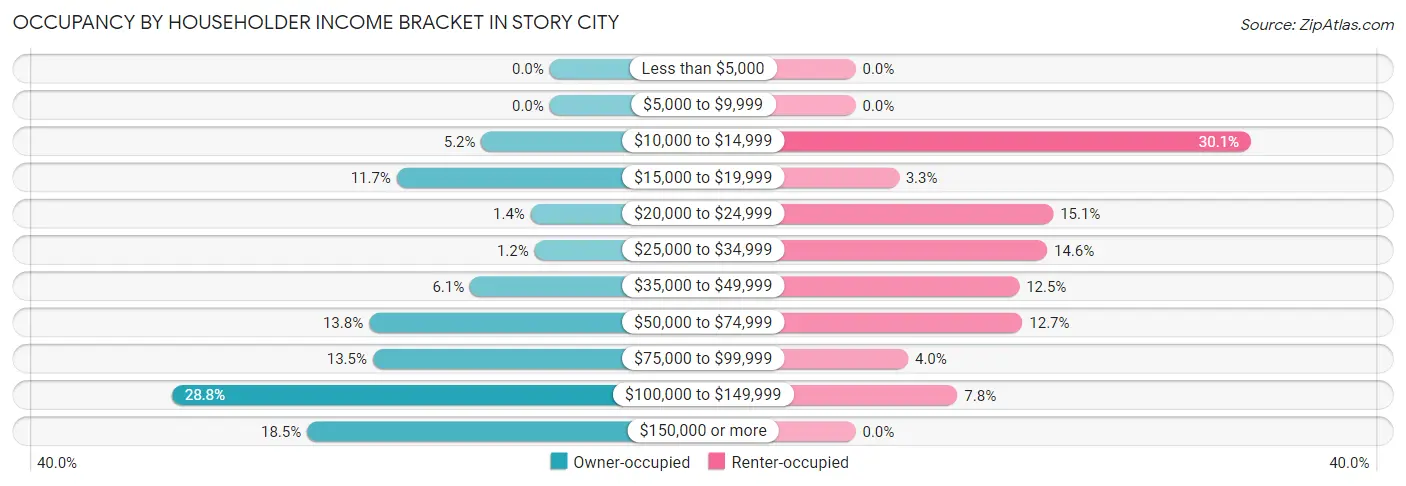
| Income Bracket | Owner-occupied | Renter-occupied |
| Less than $5,000 | 0 (0.0%) | 0 (0.0%) |
| $5,000 to $9,999 | 0 (0.0%) | 0 (0.0%) |
| $10,000 to $14,999 | 54 (5.2%) | 128 (30.1%) |
| $15,000 to $19,999 | 121 (11.7%) | 14 (3.3%) |
| $20,000 to $24,999 | 15 (1.4%) | 64 (15.1%) |
| $25,000 to $34,999 | 12 (1.1%) | 62 (14.6%) |
| $35,000 to $49,999 | 63 (6.1%) | 53 (12.5%) |
| $50,000 to $74,999 | 143 (13.8%) | 54 (12.7%) |
| $75,000 to $99,999 | 140 (13.5%) | 17 (4.0%) |
| $100,000 to $149,999 | 299 (28.8%) | 33 (7.8%) |
| $150,000 or more | 192 (18.5%) | 0 (0.0%) |
| Total | 1,039 (100.0%) | 425 (100.0%) |
Monthly Housing Cost Tiers in Story City
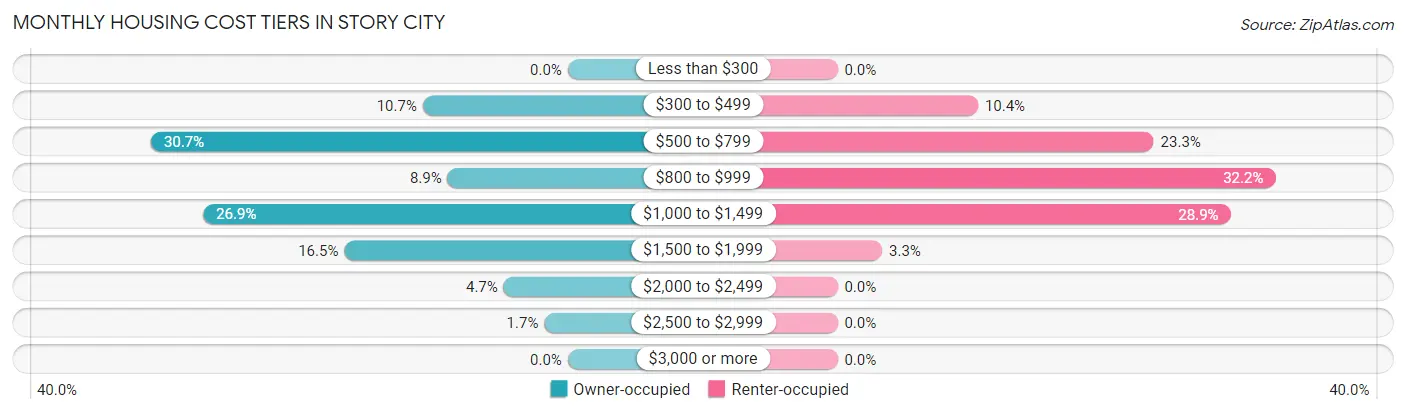
| Monthly Cost | Owner-occupied | Renter-occupied |
| Less than $300 | 0 (0.0%) | 0 (0.0%) |
| $300 to $499 | 111 (10.7%) | 44 (10.3%) |
| $500 to $799 | 319 (30.7%) | 99 (23.3%) |
| $800 to $999 | 92 (8.8%) | 137 (32.2%) |
| $1,000 to $1,499 | 279 (26.9%) | 123 (28.9%) |
| $1,500 to $1,999 | 171 (16.5%) | 14 (3.3%) |
| $2,000 to $2,499 | 49 (4.7%) | 0 (0.0%) |
| $2,500 to $2,999 | 18 (1.7%) | 0 (0.0%) |
| $3,000 or more | 0 (0.0%) | 0 (0.0%) |
| Total | 1,039 (100.0%) | 425 (100.0%) |
Physical Housing Characteristics in Story City
Housing Structures in Story City
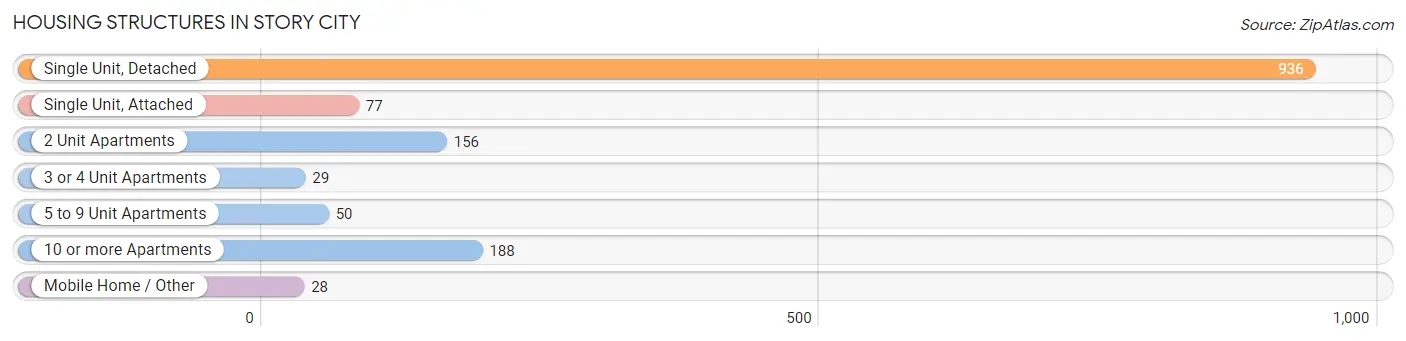
| Structure Type | # Housing Units | % Housing Units |
| Single Unit, Detached | 936 | 63.9% |
| Single Unit, Attached | 77 | 5.3% |
| 2 Unit Apartments | 156 | 10.7% |
| 3 or 4 Unit Apartments | 29 | 2.0% |
| 5 to 9 Unit Apartments | 50 | 3.4% |
| 10 or more Apartments | 188 | 12.8% |
| Mobile Home / Other | 28 | 1.9% |
| Total | 1,464 | 100.0% |
Housing Structures by Occupancy in Story City
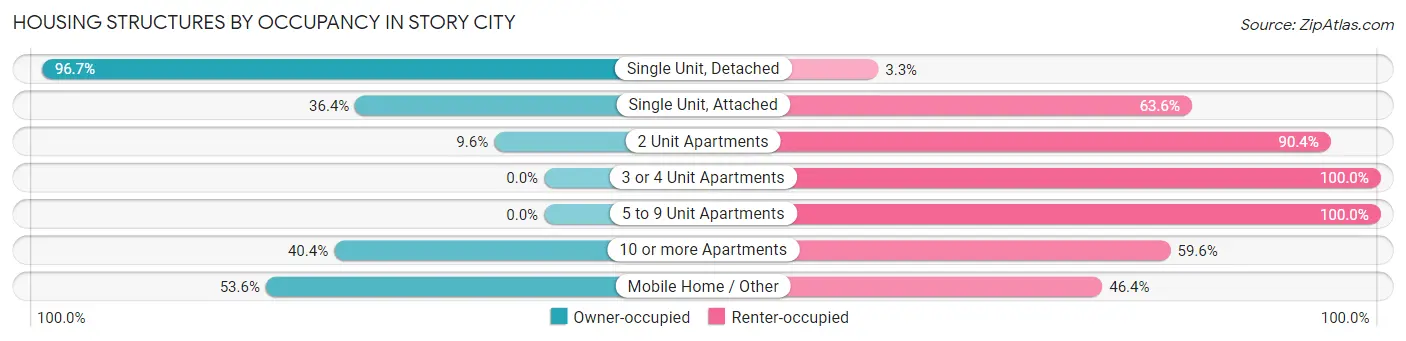
| Structure Type | Owner-occupied | Renter-occupied |
| Single Unit, Detached | 905 (96.7%) | 31 (3.3%) |
| Single Unit, Attached | 28 (36.4%) | 49 (63.6%) |
| 2 Unit Apartments | 15 (9.6%) | 141 (90.4%) |
| 3 or 4 Unit Apartments | 0 (0.0%) | 29 (100.0%) |
| 5 to 9 Unit Apartments | 0 (0.0%) | 50 (100.0%) |
| 10 or more Apartments | 76 (40.4%) | 112 (59.6%) |
| Mobile Home / Other | 15 (53.6%) | 13 (46.4%) |
| Total | 1,039 (71.0%) | 425 (29.0%) |
Housing Structures by Number of Rooms in Story City
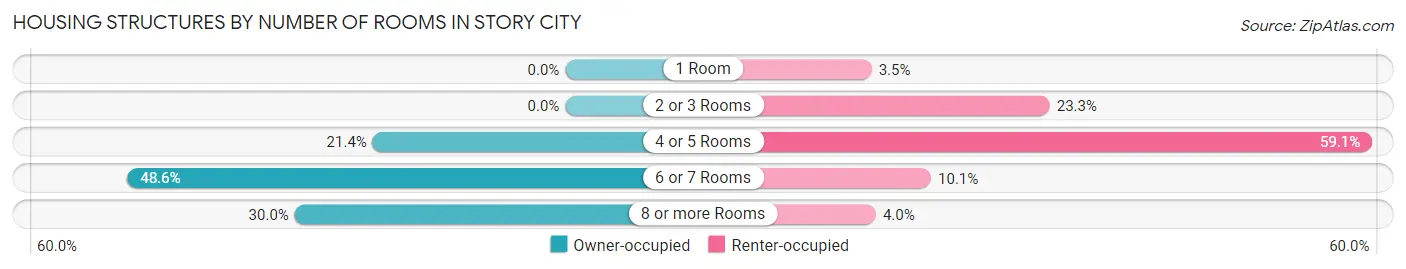
| Number of Rooms | Owner-occupied | Renter-occupied |
| 1 Room | 0 (0.0%) | 15 (3.5%) |
| 2 or 3 Rooms | 0 (0.0%) | 99 (23.3%) |
| 4 or 5 Rooms | 222 (21.4%) | 251 (59.1%) |
| 6 or 7 Rooms | 505 (48.6%) | 43 (10.1%) |
| 8 or more Rooms | 312 (30.0%) | 17 (4.0%) |
| Total | 1,039 (100.0%) | 425 (100.0%) |
Housing Structure by Heating Type in Story City
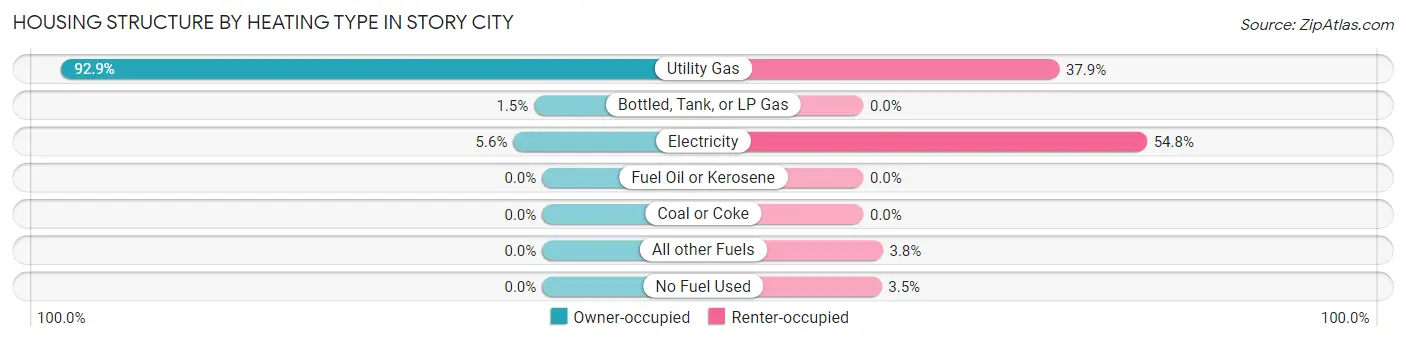
| Heating Type | Owner-occupied | Renter-occupied |
| Utility Gas | 965 (92.9%) | 161 (37.9%) |
| Bottled, Tank, or LP Gas | 16 (1.5%) | 0 (0.0%) |
| Electricity | 58 (5.6%) | 233 (54.8%) |
| Fuel Oil or Kerosene | 0 (0.0%) | 0 (0.0%) |
| Coal or Coke | 0 (0.0%) | 0 (0.0%) |
| All other Fuels | 0 (0.0%) | 16 (3.8%) |
| No Fuel Used | 0 (0.0%) | 15 (3.5%) |
| Total | 1,039 (100.0%) | 425 (100.0%) |
Household Vehicle Usage in Story City
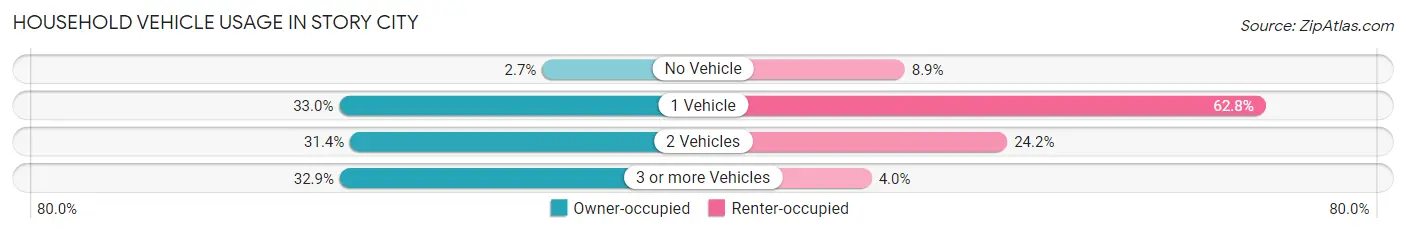
| Vehicles per Household | Owner-occupied | Renter-occupied |
| No Vehicle | 28 (2.7%) | 38 (8.9%) |
| 1 Vehicle | 343 (33.0%) | 267 (62.8%) |
| 2 Vehicles | 326 (31.4%) | 103 (24.2%) |
| 3 or more Vehicles | 342 (32.9%) | 17 (4.0%) |
| Total | 1,039 (100.0%) | 425 (100.0%) |
Real Estate & Mortgages in Story City
Real Estate and Mortgage Overview in Story City
| Characteristic | Without Mortgage | With Mortgage |
| Housing Units | 546 | 493 |
| Median Property Value | $172,600 | $172,700 |
| Median Household Income | $102,083 | $79 |
| Monthly Housing Costs | $638 | $0 |
| Real Estate Taxes | $2,793 | $0 |
Property Value by Mortgage Status in Story City
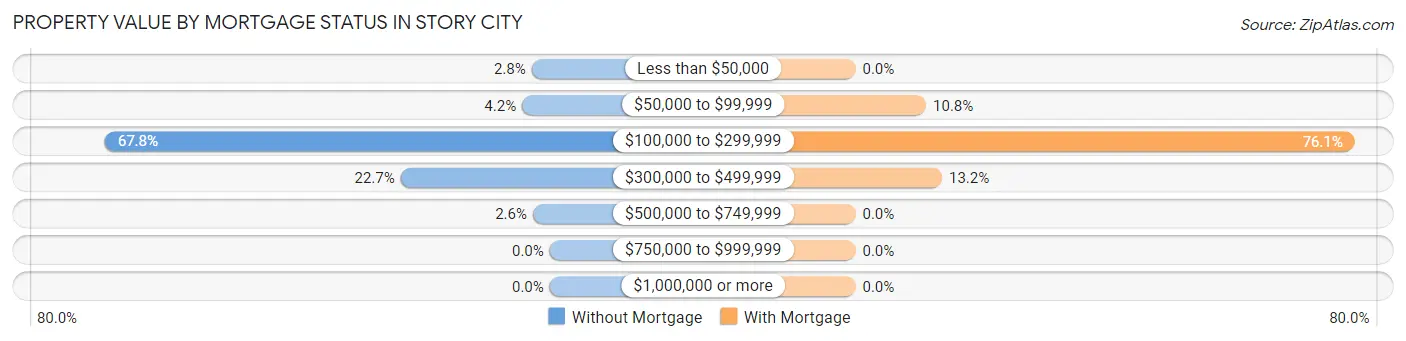
| Property Value | Without Mortgage | With Mortgage |
| Less than $50,000 | 15 (2.8%) | 0 (0.0%) |
| $50,000 to $99,999 | 23 (4.2%) | 53 (10.7%) |
| $100,000 to $299,999 | 370 (67.8%) | 375 (76.1%) |
| $300,000 to $499,999 | 124 (22.7%) | 65 (13.2%) |
| $500,000 to $749,999 | 14 (2.6%) | 0 (0.0%) |
| $750,000 to $999,999 | 0 (0.0%) | 0 (0.0%) |
| $1,000,000 or more | 0 (0.0%) | 0 (0.0%) |
| Total | 546 (100.0%) | 493 (100.0%) |
Household Income by Mortgage Status in Story City
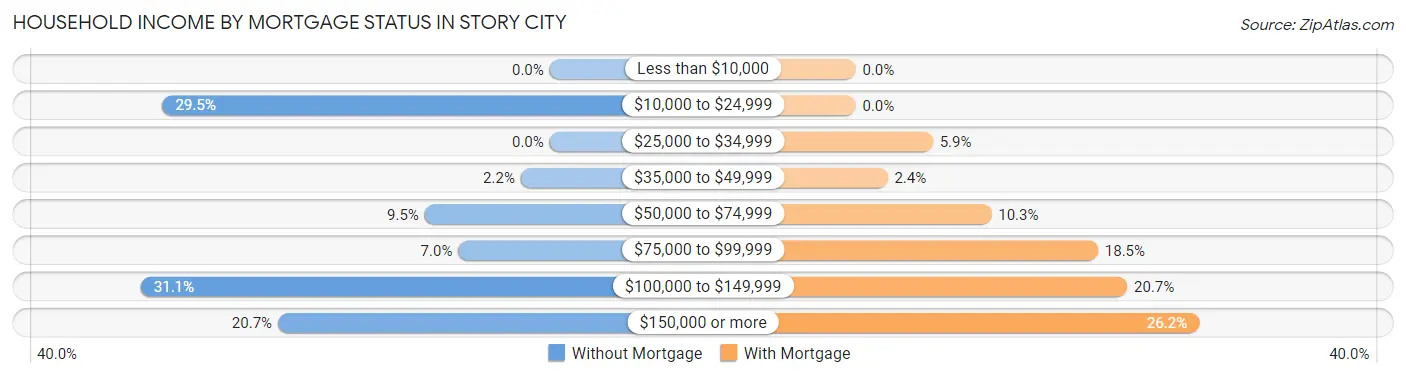
| Household Income | Without Mortgage | With Mortgage |
| Less than $10,000 | 0 (0.0%) | 0 (0.0%) |
| $10,000 to $24,999 | 161 (29.5%) | 0 (0.0%) |
| $25,000 to $34,999 | 0 (0.0%) | 29 (5.9%) |
| $35,000 to $49,999 | 12 (2.2%) | 12 (2.4%) |
| $50,000 to $74,999 | 52 (9.5%) | 51 (10.3%) |
| $75,000 to $99,999 | 38 (7.0%) | 91 (18.5%) |
| $100,000 to $149,999 | 170 (31.1%) | 102 (20.7%) |
| $150,000 or more | 113 (20.7%) | 129 (26.2%) |
| Total | 546 (100.0%) | 493 (100.0%) |
Property Value to Household Income Ratio in Story City
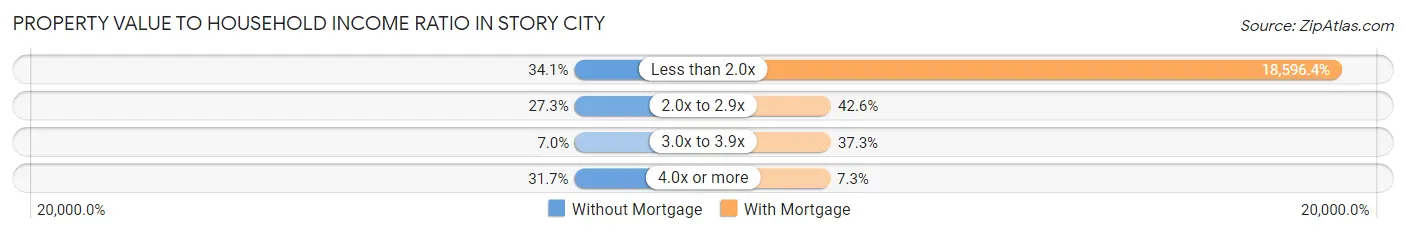
| Value-to-Income Ratio | Without Mortgage | With Mortgage |
| Less than 2.0x | 186 (34.1%) | 91,680 (18,596.4%) |
| 2.0x to 2.9x | 149 (27.3%) | 210 (42.6%) |
| 3.0x to 3.9x | 38 (7.0%) | 184 (37.3%) |
| 4.0x or more | 173 (31.7%) | 36 (7.3%) |
| Total | 546 (100.0%) | 493 (100.0%) |
Real Estate Taxes by Mortgage Status in Story City
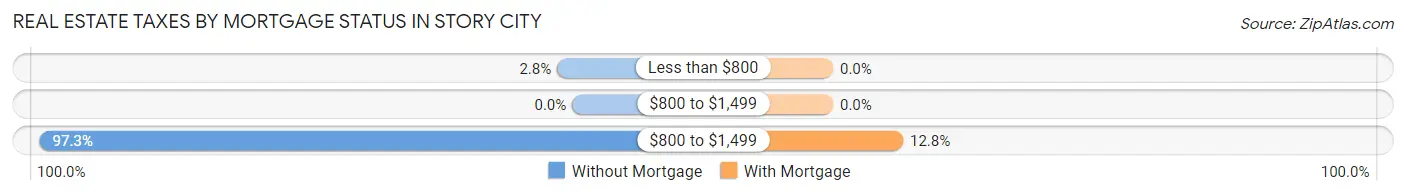
| Property Taxes | Without Mortgage | With Mortgage |
| Less than $800 | 15 (2.8%) | 0 (0.0%) |
| $800 to $1,499 | 0 (0.0%) | 0 (0.0%) |
| $800 to $1,499 | 531 (97.3%) | 63 (12.8%) |
| Total | 546 (100.0%) | 493 (100.0%) |
Health & Disability in Story City
Health Insurance Coverage by Age in Story City
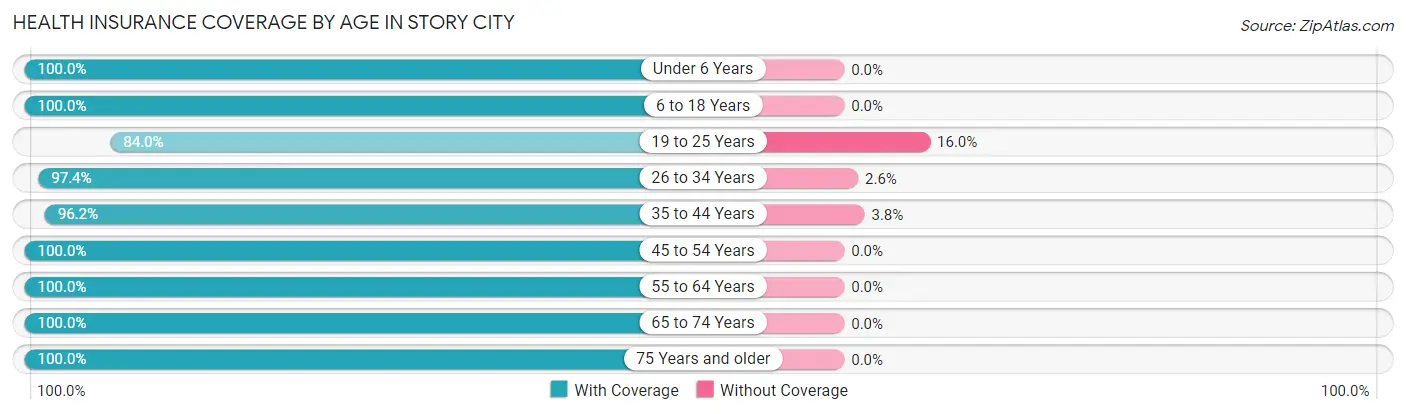
| Age Bracket | With Coverage | Without Coverage |
| Under 6 Years | 263 (100.0%) | 0 (0.0%) |
| 6 to 18 Years | 637 (100.0%) | 0 (0.0%) |
| 19 to 25 Years | 126 (84.0%) | 24 (16.0%) |
| 26 to 34 Years | 379 (97.4%) | 10 (2.6%) |
| 35 to 44 Years | 332 (96.2%) | 13 (3.8%) |
| 45 to 54 Years | 418 (100.0%) | 0 (0.0%) |
| 55 to 64 Years | 356 (100.0%) | 0 (0.0%) |
| 65 to 74 Years | 407 (100.0%) | 0 (0.0%) |
| 75 Years and older | 266 (100.0%) | 0 (0.0%) |
| Total | 3,184 (98.6%) | 47 (1.5%) |
Health Insurance Coverage by Citizenship Status in Story City
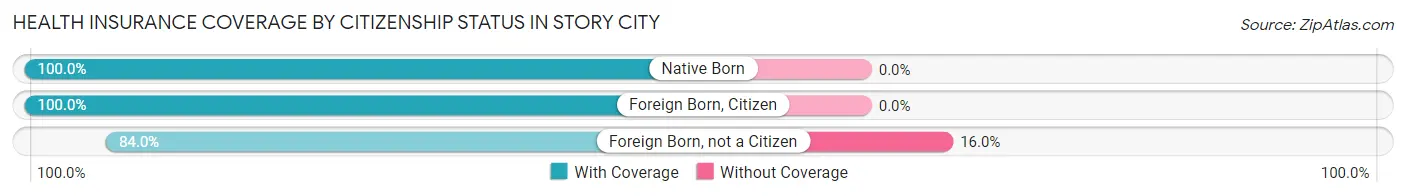
| Citizenship Status | With Coverage | Without Coverage |
| Native Born | 263 (100.0%) | 0 (0.0%) |
| Foreign Born, Citizen | 637 (100.0%) | 0 (0.0%) |
| Foreign Born, not a Citizen | 126 (84.0%) | 24 (16.0%) |
Health Insurance Coverage by Household Income in Story City
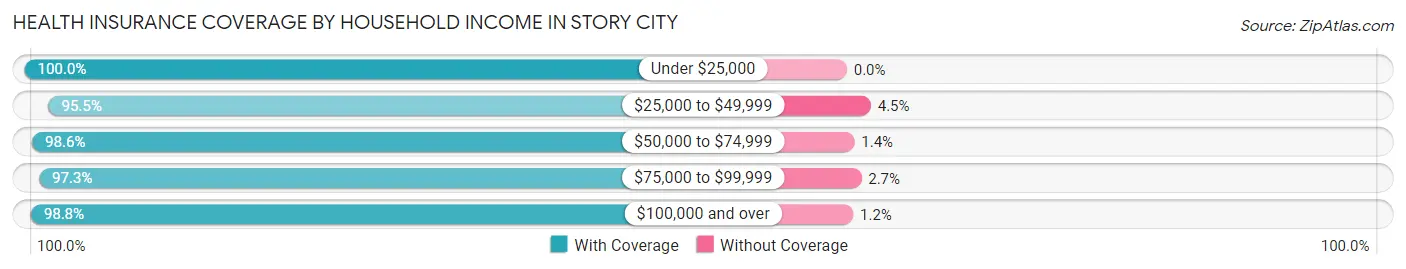
| Household Income | With Coverage | Without Coverage |
| Under $25,000 | 632 (100.0%) | 0 (0.0%) |
| $25,000 to $49,999 | 276 (95.5%) | 13 (4.5%) |
| $50,000 to $74,999 | 416 (98.6%) | 6 (1.4%) |
| $75,000 to $99,999 | 359 (97.3%) | 10 (2.7%) |
| $100,000 and over | 1,501 (98.8%) | 18 (1.2%) |
Public vs Private Health Insurance Coverage by Age in Story City
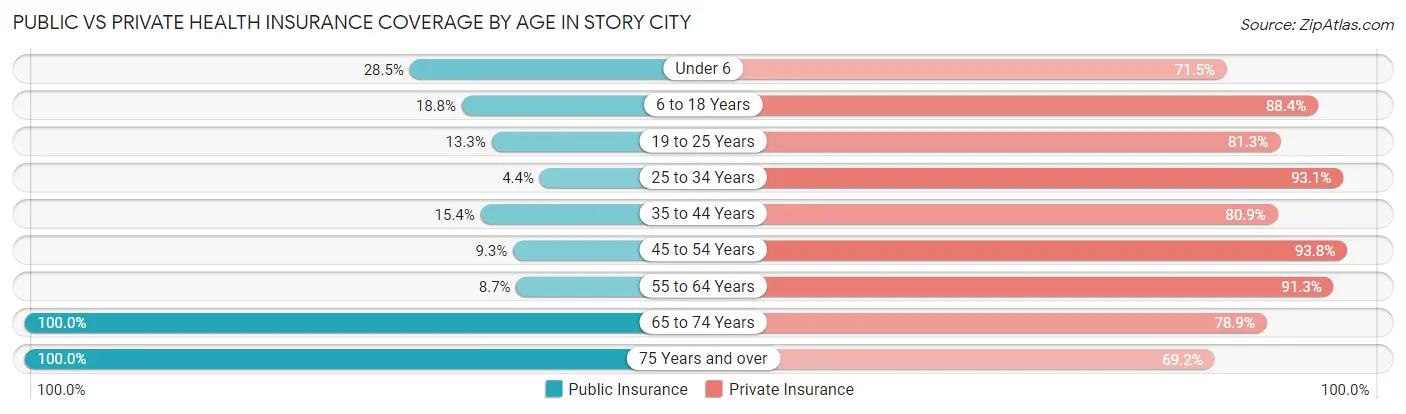
| Age Bracket | Public Insurance | Private Insurance |
| Under 6 | 75 (28.5%) | 188 (71.5%) |
| 6 to 18 Years | 120 (18.8%) | 563 (88.4%) |
| 19 to 25 Years | 20 (13.3%) | 122 (81.3%) |
| 25 to 34 Years | 17 (4.4%) | 362 (93.1%) |
| 35 to 44 Years | 53 (15.4%) | 279 (80.9%) |
| 45 to 54 Years | 39 (9.3%) | 392 (93.8%) |
| 55 to 64 Years | 31 (8.7%) | 325 (91.3%) |
| 65 to 74 Years | 407 (100.0%) | 321 (78.9%) |
| 75 Years and over | 266 (100.0%) | 184 (69.2%) |
| Total | 1,028 (31.8%) | 2,736 (84.7%) |
Disability Status by Sex by Age in Story City
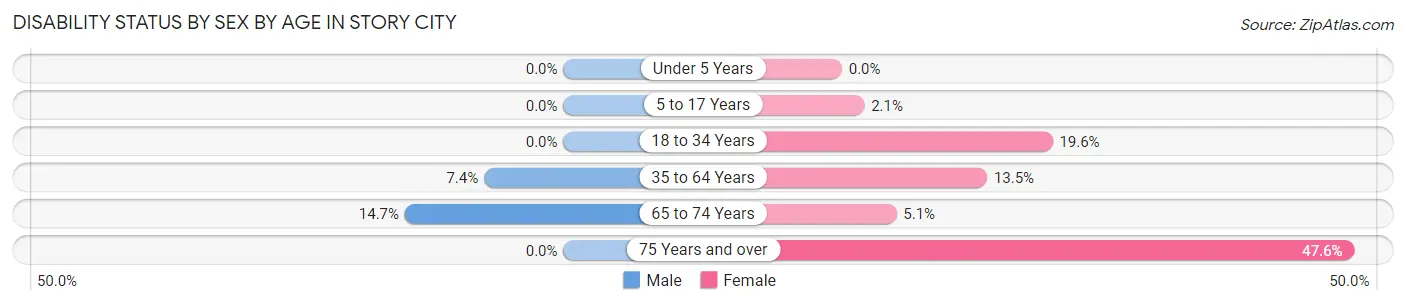
| Age Bracket | Male | Female |
| Under 5 Years | 0 (0.0%) | 0 (0.0%) |
| 5 to 17 Years | 0 (0.0%) | 8 (2.1%) |
| 18 to 34 Years | 0 (0.0%) | 61 (19.6%) |
| 35 to 64 Years | 37 (7.4%) | 83 (13.5%) |
| 65 to 74 Years | 25 (14.7%) | 12 (5.1%) |
| 75 Years and over | 0 (0.0%) | 88 (47.6%) |
Disability Class by Sex by Age in Story City
Disability Class: Hearing Difficulty
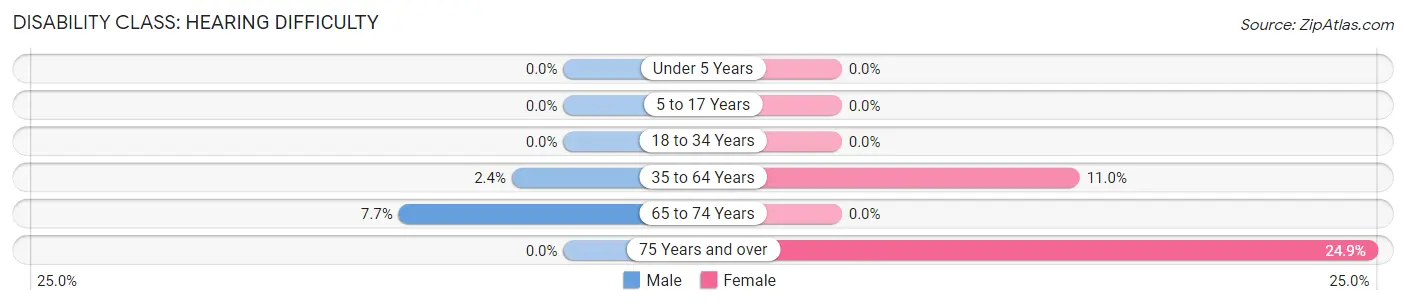
| Age Bracket | Male | Female |
| Under 5 Years | 0 (0.0%) | 0 (0.0%) |
| 5 to 17 Years | 0 (0.0%) | 0 (0.0%) |
| 18 to 34 Years | 0 (0.0%) | 0 (0.0%) |
| 35 to 64 Years | 12 (2.4%) | 68 (11.0%) |
| 65 to 74 Years | 13 (7.6%) | 0 (0.0%) |
| 75 Years and over | 0 (0.0%) | 46 (24.9%) |
Disability Class: Vision Difficulty
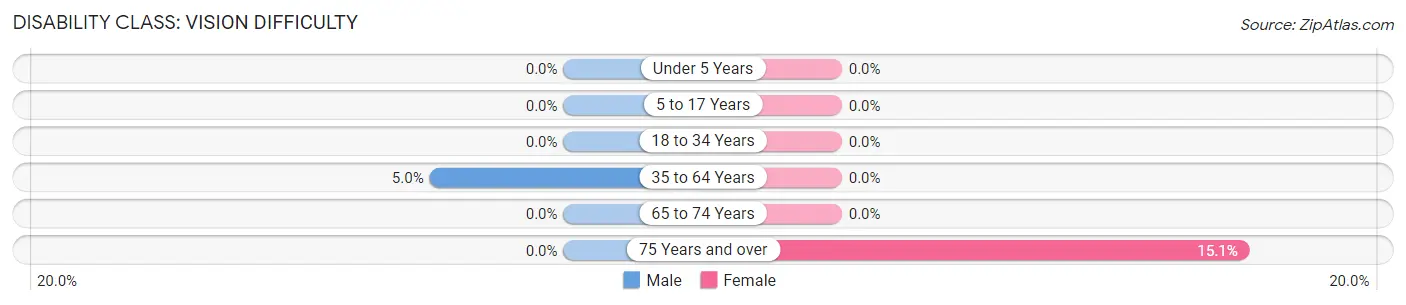
| Age Bracket | Male | Female |
| Under 5 Years | 0 (0.0%) | 0 (0.0%) |
| 5 to 17 Years | 0 (0.0%) | 0 (0.0%) |
| 18 to 34 Years | 0 (0.0%) | 0 (0.0%) |
| 35 to 64 Years | 25 (5.0%) | 0 (0.0%) |
| 65 to 74 Years | 0 (0.0%) | 0 (0.0%) |
| 75 Years and over | 0 (0.0%) | 28 (15.1%) |
Disability Class: Cognitive Difficulty
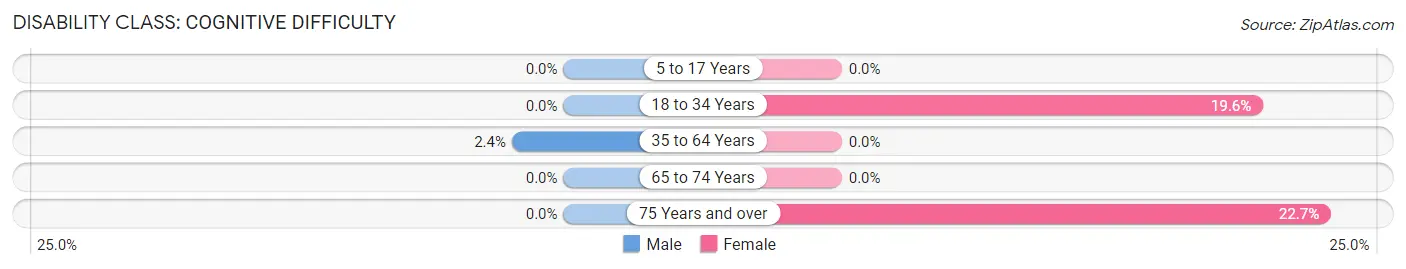
| Age Bracket | Male | Female |
| 5 to 17 Years | 0 (0.0%) | 0 (0.0%) |
| 18 to 34 Years | 0 (0.0%) | 61 (19.6%) |
| 35 to 64 Years | 12 (2.4%) | 0 (0.0%) |
| 65 to 74 Years | 0 (0.0%) | 0 (0.0%) |
| 75 Years and over | 0 (0.0%) | 42 (22.7%) |
Disability Class: Ambulatory Difficulty
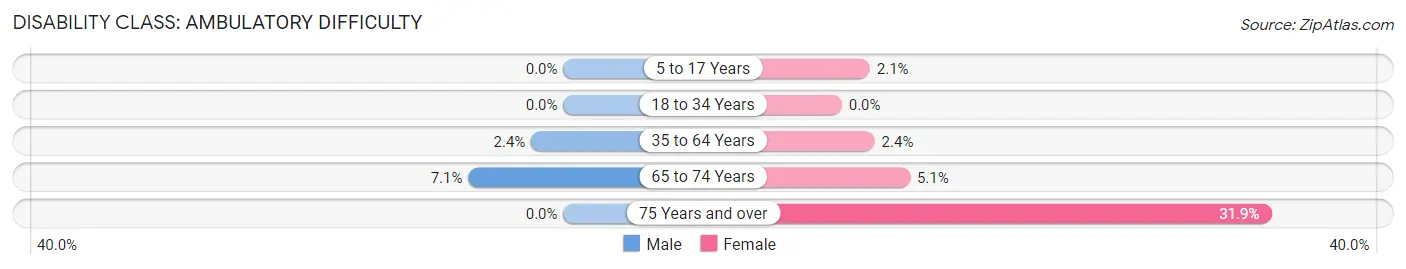
| Age Bracket | Male | Female |
| 5 to 17 Years | 0 (0.0%) | 8 (2.1%) |
| 18 to 34 Years | 0 (0.0%) | 0 (0.0%) |
| 35 to 64 Years | 12 (2.4%) | 15 (2.4%) |
| 65 to 74 Years | 12 (7.1%) | 12 (5.1%) |
| 75 Years and over | 0 (0.0%) | 59 (31.9%) |
Disability Class: Self-Care Difficulty
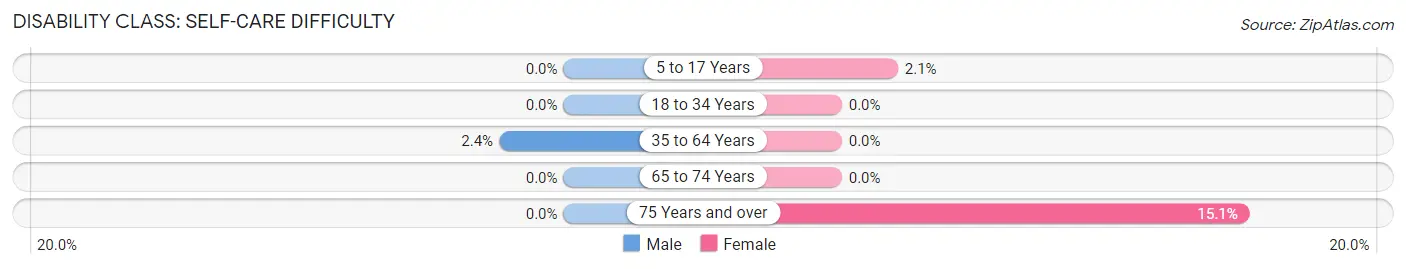
| Age Bracket | Male | Female |
| 5 to 17 Years | 0 (0.0%) | 8 (2.1%) |
| 18 to 34 Years | 0 (0.0%) | 0 (0.0%) |
| 35 to 64 Years | 12 (2.4%) | 0 (0.0%) |
| 65 to 74 Years | 0 (0.0%) | 0 (0.0%) |
| 75 Years and over | 0 (0.0%) | 28 (15.1%) |
Technology Access in Story City
Computing Device Access in Story City
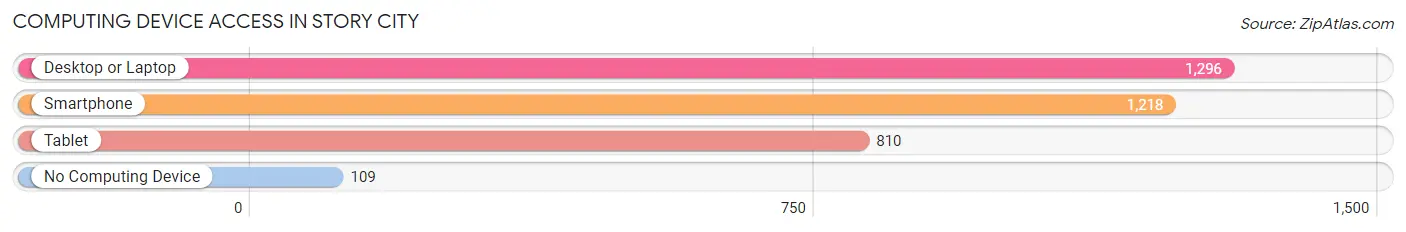
| Device Type | # Households | % Households |
| Desktop or Laptop | 1,296 | 88.5% |
| Smartphone | 1,218 | 83.2% |
| Tablet | 810 | 55.3% |
| No Computing Device | 109 | 7.4% |
| Total | 1,464 | 100.0% |
Internet Access in Story City
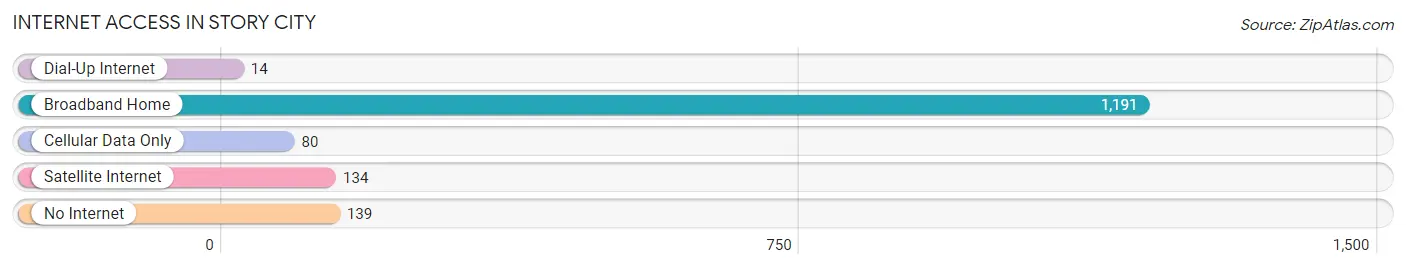
| Internet Type | # Households | % Households |
| Dial-Up Internet | 14 | 1.0% |
| Broadband Home | 1,191 | 81.4% |
| Cellular Data Only | 80 | 5.5% |
| Satellite Internet | 134 | 9.1% |
| No Internet | 139 | 9.5% |
| Total | 1,464 | 100.0% |
Story City Summary
Story City is a small city located in Story County, Iowa, United States. The population was 2,569 at the 2010 census. It is part of the Ames, Iowa Metropolitan Statistical Area, which encompasses all of Story County.
History
Story City was founded in 1856 by William Story, a settler from New York. He purchased the land from the government and began to build a town. The town was named after him and was incorporated in 1876.
The town grew slowly but steadily over the years, and by the turn of the 20th century, it had become a thriving community. The town was home to a variety of businesses, including a flour mill, a creamery, a furniture factory, a brickyard, and a canning factory.
In the early 1900s, the town was connected to the rest of the state by the Chicago Great Western Railway. This allowed for the transportation of goods and people to and from Story City.
Geography
Story City is located at 42°1′17″N 93°37′17″W (42.021445, -93.621345). According to the United States Census Bureau, the city has a total area of 1.2 square miles (3.1 km2), all of it land.
Economy
Story City’s economy is largely based on agriculture and manufacturing. The town is home to several large farms, as well as a variety of small businesses. The town is also home to a number of manufacturing companies, including a furniture factory, a canning factory, and a brickyard.
Demographics
As of the census of 2010, there were 2,569 people, 1,072 households, and 690 families residing in the city. The population density was 2,097.5 people per square mile (808.7/km2). There were 1,133 housing units at an average density of 933.3 per square mile (360.2/km2). The racial makeup of the city was 97.2% White, 0.2% African American, 0.2% Native American, 0.4% Asian, 0.2% from other races, and 1.9% from two or more races. Hispanic or Latino of any race were 1.2% of the population.
There were 1,072 households, out of which 28.7% had children under the age of 18 living with them, 51.2% were married couples living together, 9.3% had a female householder with no husband present, and 35.3% were non-families. 30.2% of all households were made up of individuals, and 14.2% had someone living alone who was 65 years of age or older. The average household size was 2.37 and the average family size was 2.93.
In the city, the population was spread out, with 24.2% under the age of 18, 6.7% from 18 to 24, 25.2% from 25 to 44, 24.3% from 45 to 64, and 19.6% who were 65 years of age or older. The median age was 40 years. For every 100 females, there were 91.2 males. For every 100 females age 18 and over, there were 87.2 males.
The median income for a household in the city was $41,964, and the median income for a family was $50,000. Males had a median income of $35,000 versus $25,000 for females. The per capita income for the city was $20,945. About 4.2% of families and 6.2% of the population were below the poverty line, including 8.2% of those under age 18 and 5.2% of those age 65 or over.
Common Questions
What is Per Capita Income in Story City?
Per Capita income in Story City is $36,413.
What is the Median Family Income in Story City?
Median Family Income in Story City is $107,546.
What is the Median Household income in Story City?
Median Household Income in Story City is $67,308.
What is Income or Wage Gap in Story City?
Income or Wage Gap in Story City is 57.9%.
Women in Story City earn 42.1 cents for every dollar earned by a man.
What is Inequality or Gini Index in Story City?
Inequality or Gini Index in Story City is 0.43.
What is the Total Population of Story City?
Total Population of Story City is 3,352.
What is the Total Male Population of Story City?
Total Male Population of Story City is 1,448.
What is the Total Female Population of Story City?
Total Female Population of Story City is 1,904.
What is the Ratio of Males per 100 Females in Story City?
There are 76.05 Males per 100 Females in Story City.
What is the Ratio of Females per 100 Males in Story City?
There are 131.49 Females per 100 Males in Story City.
What is the Median Population Age in Story City?
Median Population Age in Story City is 39.4 Years.
What is the Average Family Size in Story City
Average Family Size in Story City is 2.9 People.
What is the Average Household Size in Story City
Average Household Size in Story City is 2.2 People.
How Large is the Labor Force in Story City?
There are 1,667 People in the Labor Forcein in Story City.
What is the Percentage of People in the Labor Force in Story City?
64.9% of People are in the Labor Force in Story City.
What is the Unemployment Rate in Story City?
Unemployment Rate in Story City is 4.0%.