Spirit Lake, IA Map & Demographics
Spirit Lake Map
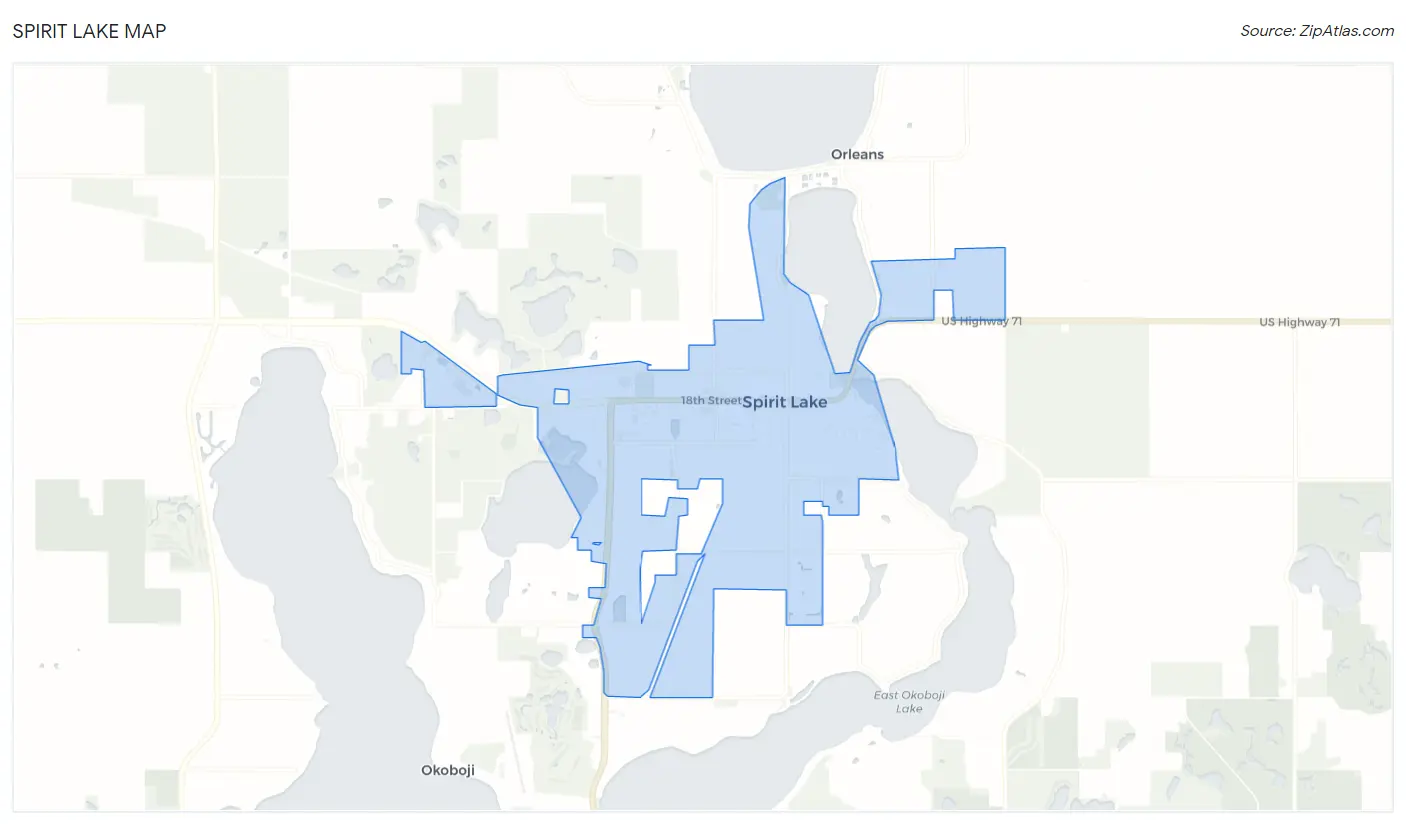
Spirit Lake Overview
$39,860
PER CAPITA INCOME
$98,346
AVG FAMILY INCOME
$70,248
AVG HOUSEHOLD INCOME
26.5%
WAGE / INCOME GAP [ % ]
73.5¢/ $1
WAGE / INCOME GAP [ $ ]
0.41
INEQUALITY / GINI INDEX
5,409
TOTAL POPULATION
2,615
MALE POPULATION
2,794
FEMALE POPULATION
93.59
MALES / 100 FEMALES
106.85
FEMALES / 100 MALES
40.1
MEDIAN AGE
3.0
AVG FAMILY SIZE
2.1
AVG HOUSEHOLD SIZE
3,006
LABOR FORCE [ PEOPLE ]
69.4%
PERCENT IN LABOR FORCE
1.2%
UNEMPLOYMENT RATE
Spirit Lake Zip Codes
Spirit Lake Area Codes
Income in Spirit Lake
Income Overview in Spirit Lake
Per Capita Income in Spirit Lake is $39,860, while median incomes of families and households are $98,346 and $70,248 respectively.
| Characteristic | Number | Measure |
| Per Capita Income | 5,409 | $39,860 |
| Median Family Income | 1,247 | $98,346 |
| Mean Family Income | 1,247 | $113,682 |
| Median Household Income | 2,537 | $70,248 |
| Mean Household Income | 2,537 | $84,143 |
| Income Deficit | 1,247 | $0 |
| Wage / Income Gap (%) | 5,409 | 26.52% |
| Wage / Income Gap ($) | 5,409 | 73.48¢ per $1 |
| Gini / Inequality Index | 5,409 | 0.41 |
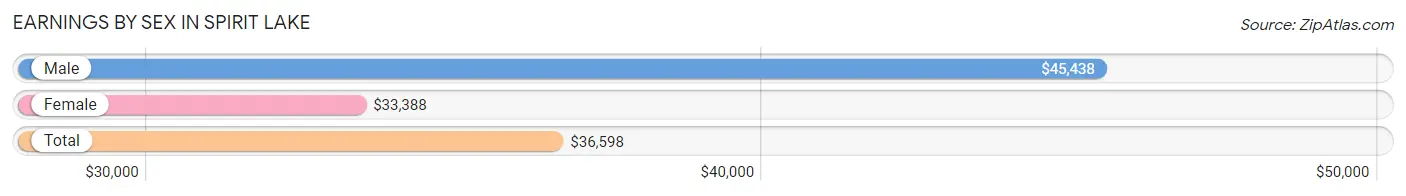
Earnings by Sex in Spirit Lake
Average Earnings in Spirit Lake are $36,598, $45,438 for men and $33,388 for women, a difference of 26.5%.
| Sex | Number | Average Earnings |
| Male | 1,680 (52.5%) | $45,438 |
| Female | 1,520 (47.5%) | $33,388 |
| Total | 3,200 (100.0%) | $36,598 |
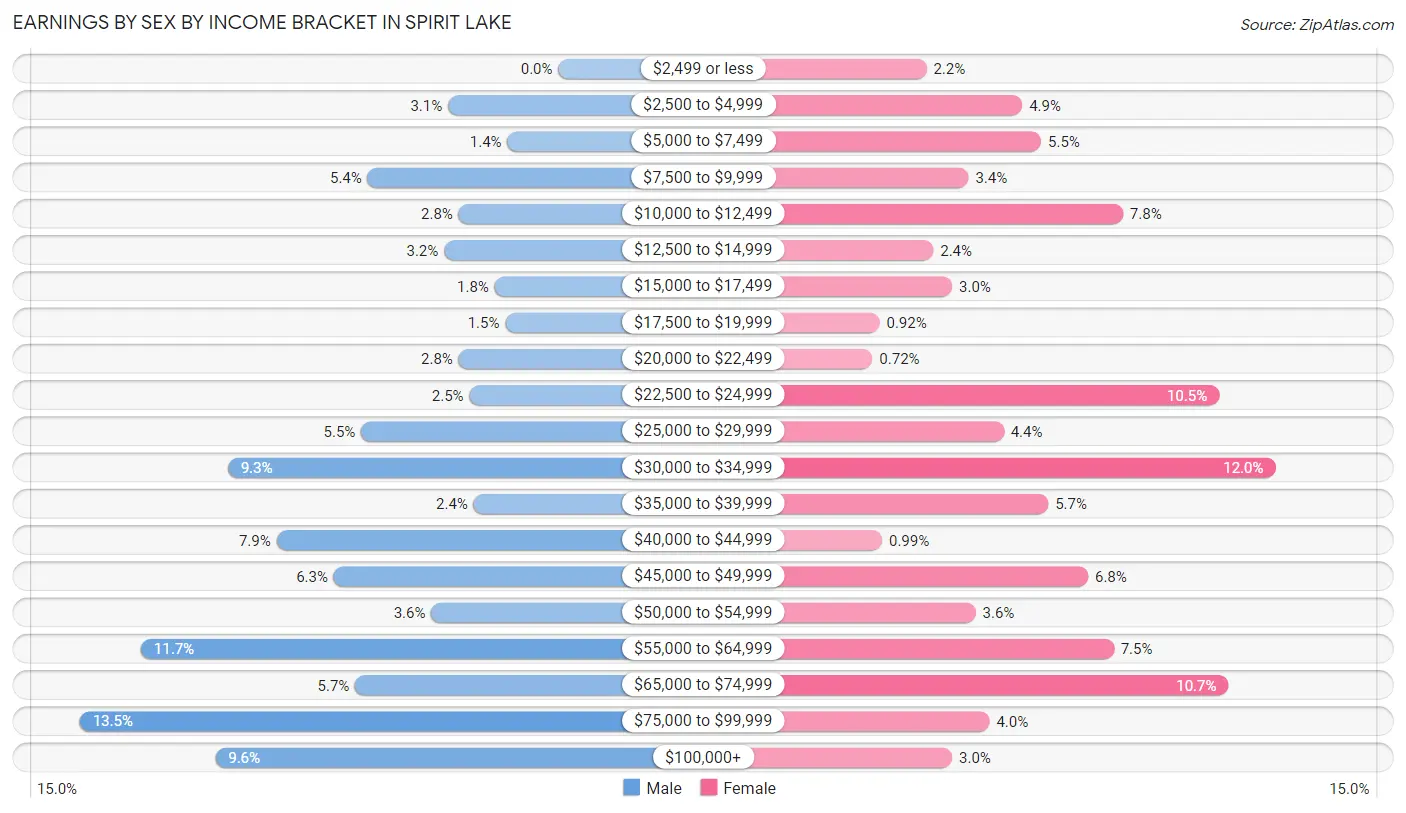
Earnings by Sex by Income Bracket in Spirit Lake
The most common earnings brackets in Spirit Lake are $75,000 to $99,999 for men (226 | 13.5%) and $30,000 to $34,999 for women (183 | 12.0%).
| Income | Male | Female |
| $2,499 or less | 0 (0.0%) | 34 (2.2%) |
| $2,500 to $4,999 | 52 (3.1%) | 75 (4.9%) |
| $5,000 to $7,499 | 24 (1.4%) | 83 (5.5%) |
| $7,500 to $9,999 | 90 (5.4%) | 52 (3.4%) |
| $10,000 to $12,499 | 47 (2.8%) | 118 (7.8%) |
| $12,500 to $14,999 | 54 (3.2%) | 37 (2.4%) |
| $15,000 to $17,499 | 30 (1.8%) | 45 (3.0%) |
| $17,500 to $19,999 | 25 (1.5%) | 14 (0.9%) |
| $20,000 to $22,499 | 47 (2.8%) | 11 (0.7%) |
| $22,500 to $24,999 | 42 (2.5%) | 159 (10.5%) |
| $25,000 to $29,999 | 93 (5.5%) | 67 (4.4%) |
| $30,000 to $34,999 | 156 (9.3%) | 183 (12.0%) |
| $35,000 to $39,999 | 40 (2.4%) | 86 (5.7%) |
| $40,000 to $44,999 | 133 (7.9%) | 15 (1.0%) |
| $45,000 to $49,999 | 106 (6.3%) | 103 (6.8%) |
| $50,000 to $54,999 | 60 (3.6%) | 55 (3.6%) |
| $55,000 to $64,999 | 197 (11.7%) | 114 (7.5%) |
| $65,000 to $74,999 | 96 (5.7%) | 163 (10.7%) |
| $75,000 to $99,999 | 226 (13.5%) | 61 (4.0%) |
| $100,000+ | 162 (9.6%) | 45 (3.0%) |
| Total | 1,680 (100.0%) | 1,520 (100.0%) |
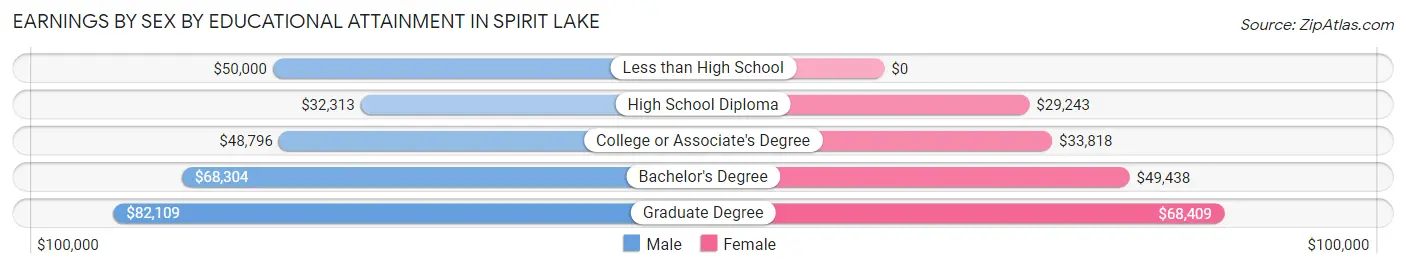
Earnings by Sex by Educational Attainment in Spirit Lake
Average earnings in Spirit Lake are $55,352 for men and $34,474 for women, a difference of 37.7%. Men with an educational attainment of graduate degree enjoy the highest average annual earnings of $82,109, while those with high school diploma education earn the least with $32,313. Women with an educational attainment of graduate degree earn the most with the average annual earnings of $68,409, while those with high school diploma education have the smallest earnings of $29,243.
| Educational Attainment | Male Income | Female Income |
| Less than High School | $50,000 | $0 |
| High School Diploma | $32,313 | $29,243 |
| College or Associate's Degree | $48,796 | $33,818 |
| Bachelor's Degree | $68,304 | $49,438 |
| Graduate Degree | $82,109 | $68,409 |
| Total | $55,352 | $34,474 |
Family Income in Spirit Lake
Family Income Brackets in Spirit Lake
According to the Spirit Lake family income data, there are 306 families falling into the $100,000 to $149,999 income range, which is the most common income bracket and makes up 24.5% of all families.
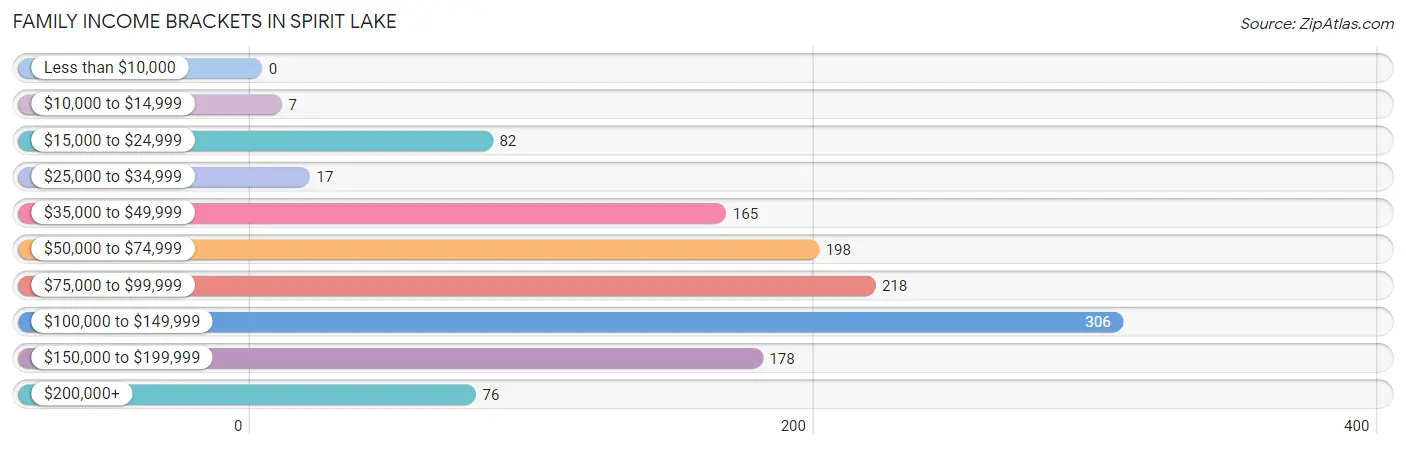
| Income Bracket | # Families | % Families |
| Less than $10,000 | 0 | 0.0% |
| $10,000 to $14,999 | 7 | 0.6% |
| $15,000 to $24,999 | 82 | 6.6% |
| $25,000 to $34,999 | 17 | 1.4% |
| $35,000 to $49,999 | 165 | 13.2% |
| $50,000 to $74,999 | 198 | 15.9% |
| $75,000 to $99,999 | 218 | 17.5% |
| $100,000 to $149,999 | 306 | 24.5% |
| $150,000 to $199,999 | 178 | 14.3% |
| $200,000+ | 76 | 6.1% |
Family Income by Famaliy Size in Spirit Lake
5-person families (124 | 9.9%) account for the highest median family income in Spirit Lake with $126,875 per family, while 3-person families (202 | 16.2%) have the highest median income of $37,167 per family member.
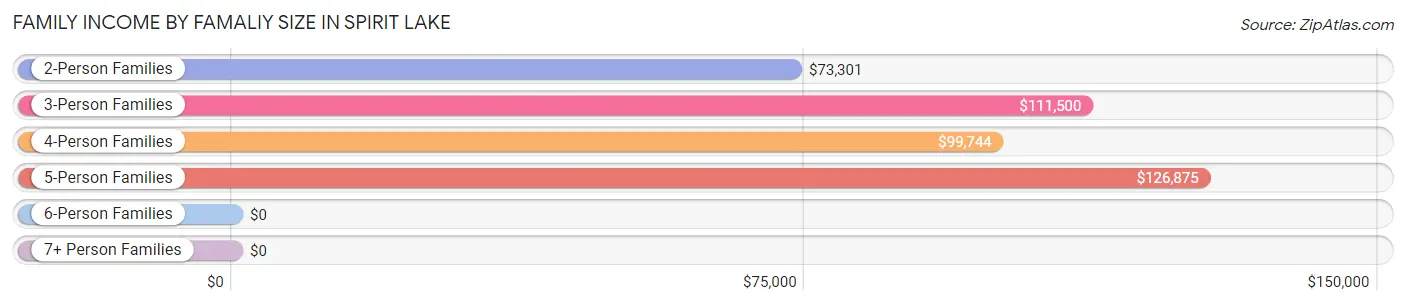
| Income Bracket | # Families | Median Income |
| 2-Person Families | 643 (51.6%) | $73,301 |
| 3-Person Families | 202 (16.2%) | $111,500 |
| 4-Person Families | 227 (18.2%) | $99,744 |
| 5-Person Families | 124 (9.9%) | $126,875 |
| 6-Person Families | 51 (4.1%) | $0 |
| 7+ Person Families | 0 (0.0%) | $0 |
| Total | 1,247 (100.0%) | $98,346 |
Family Income by Number of Earners in Spirit Lake
The median family income in Spirit Lake is $98,346, with families comprising 3+ earners (138) having the highest median family income of $123,077, while families with no earners (134) have the lowest median family income of $36,875, accounting for 11.1% and 10.7% of families, respectively.
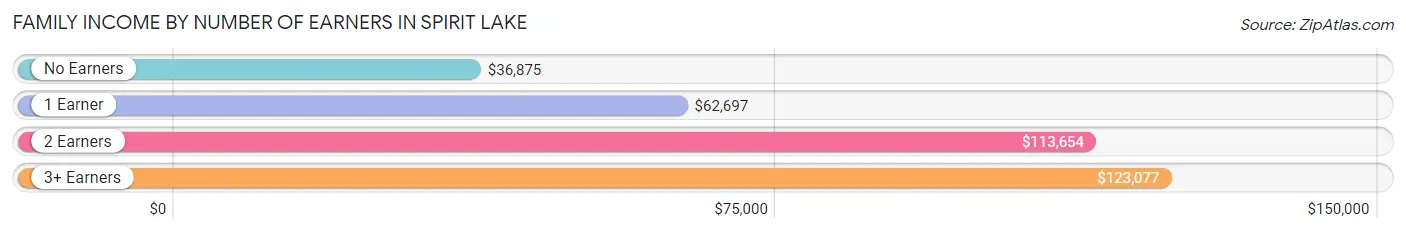
| Number of Earners | # Families | Median Income |
| No Earners | 134 (10.7%) | $36,875 |
| 1 Earner | 263 (21.1%) | $62,697 |
| 2 Earners | 712 (57.1%) | $113,654 |
| 3+ Earners | 138 (11.1%) | $123,077 |
| Total | 1,247 (100.0%) | $98,346 |
Household Income in Spirit Lake
Household Income Brackets in Spirit Lake
With 538 households falling in the category, the $50,000 to $74,999 income range is the most frequent in Spirit Lake, accounting for 21.2% of all households. In contrast, only 28 households (1.1%) fall into the less than $10,000 income bracket, making it the least populous group.
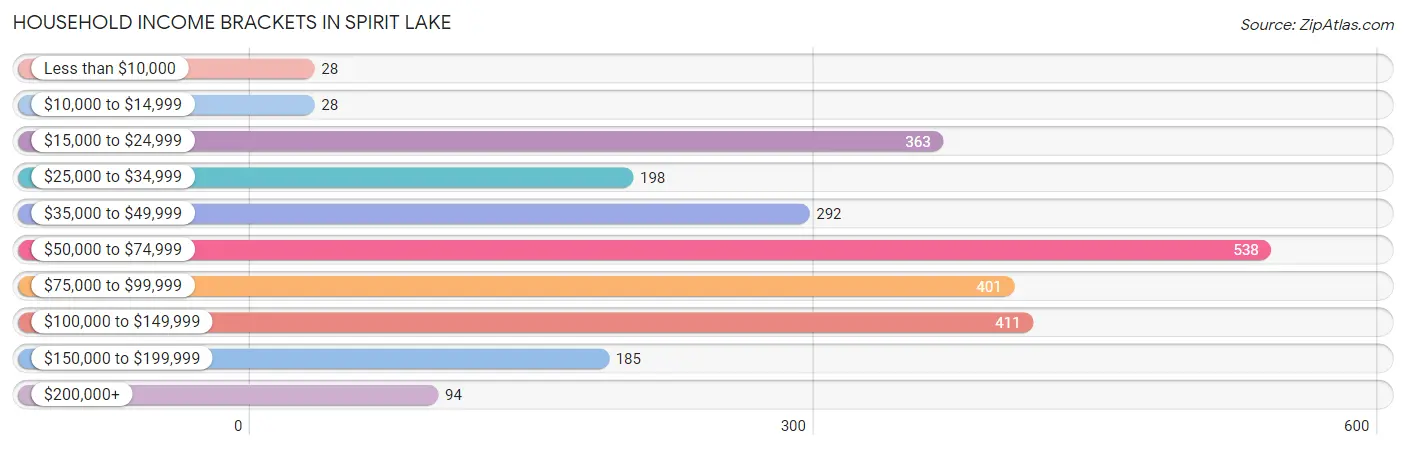
| Income Bracket | # Households | % Households |
| Less than $10,000 | 28 | 1.1% |
| $10,000 to $14,999 | 28 | 1.1% |
| $15,000 to $24,999 | 363 | 14.3% |
| $25,000 to $34,999 | 198 | 7.8% |
| $35,000 to $49,999 | 292 | 11.5% |
| $50,000 to $74,999 | 538 | 21.2% |
| $75,000 to $99,999 | 401 | 15.8% |
| $100,000 to $149,999 | 411 | 16.2% |
| $150,000 to $199,999 | 185 | 7.3% |
| $200,000+ | 94 | 3.7% |
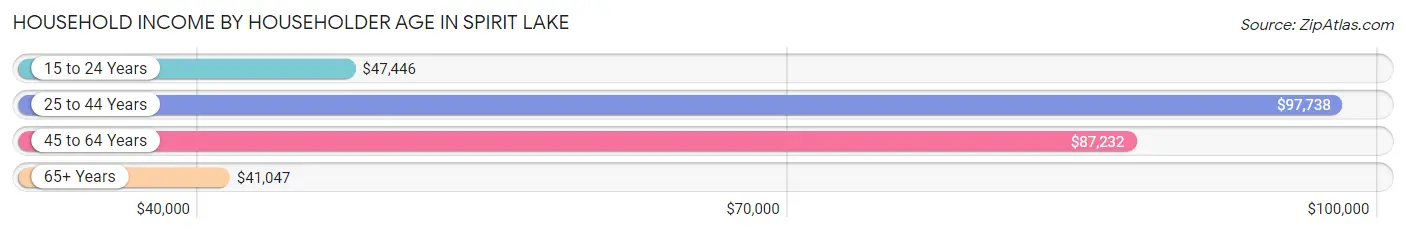
Household Income by Householder Age in Spirit Lake
The median household income in Spirit Lake is $70,248, with the highest median household income of $97,738 found in the 25 to 44 years age bracket for the primary householder. A total of 667 households (26.3%) fall into this category. Meanwhile, the 65+ years age bracket for the primary householder has the lowest median household income of $41,047, with 923 households (36.4%) in this group.
| Income Bracket | # Households | Median Income |
| 15 to 24 Years | 205 (8.1%) | $47,446 |
| 25 to 44 Years | 667 (26.3%) | $97,738 |
| 45 to 64 Years | 742 (29.2%) | $87,232 |
| 65+ Years | 923 (36.4%) | $41,047 |
| Total | 2,537 (100.0%) | $70,248 |
Poverty in Spirit Lake
Income Below Poverty by Sex and Age in Spirit Lake
With 5.7% poverty level for males and 5.6% for females among the residents of Spirit Lake, under 5 year old males and 25 to 34 year old females are the most vulnerable to poverty, with 48 males (36.6%) and 58 females (15.7%) in their respective age groups living below the poverty level.
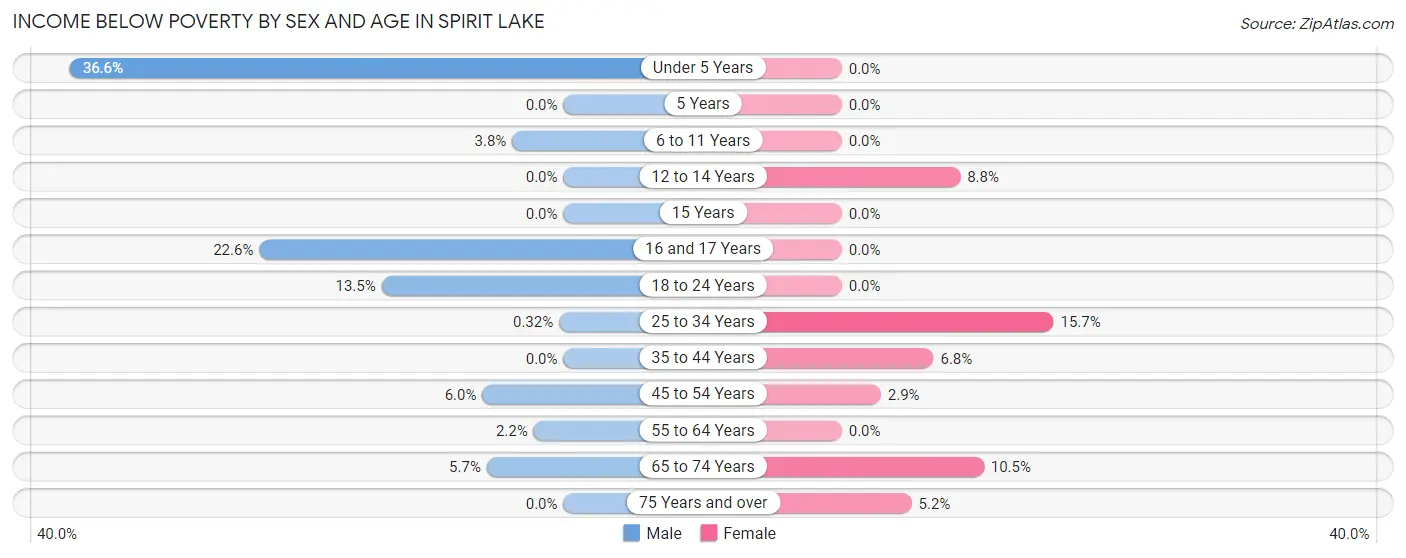
| Age Bracket | Male | Female |
| Under 5 Years | 48 (36.6%) | 0 (0.0%) |
| 5 Years | 0 (0.0%) | 0 (0.0%) |
| 6 to 11 Years | 6 (3.8%) | 0 (0.0%) |
| 12 to 14 Years | 0 (0.0%) | 8 (8.8%) |
| 15 Years | 0 (0.0%) | 0 (0.0%) |
| 16 and 17 Years | 14 (22.6%) | 0 (0.0%) |
| 18 to 24 Years | 37 (13.5%) | 0 (0.0%) |
| 25 to 34 Years | 1 (0.3%) | 58 (15.7%) |
| 35 to 44 Years | 0 (0.0%) | 22 (6.8%) |
| 45 to 54 Years | 15 (6.0%) | 7 (2.9%) |
| 55 to 64 Years | 9 (2.2%) | 0 (0.0%) |
| 65 to 74 Years | 16 (5.7%) | 39 (10.5%) |
| 75 Years and over | 0 (0.0%) | 20 (5.2%) |
| Total | 146 (5.7%) | 154 (5.6%) |
Income Above Poverty by Sex and Age in Spirit Lake
According to the poverty statistics in Spirit Lake, males aged 5 years and females aged under 5 years are the age groups that are most secure financially, with 100.0% of males and 100.0% of females in these age groups living above the poverty line.
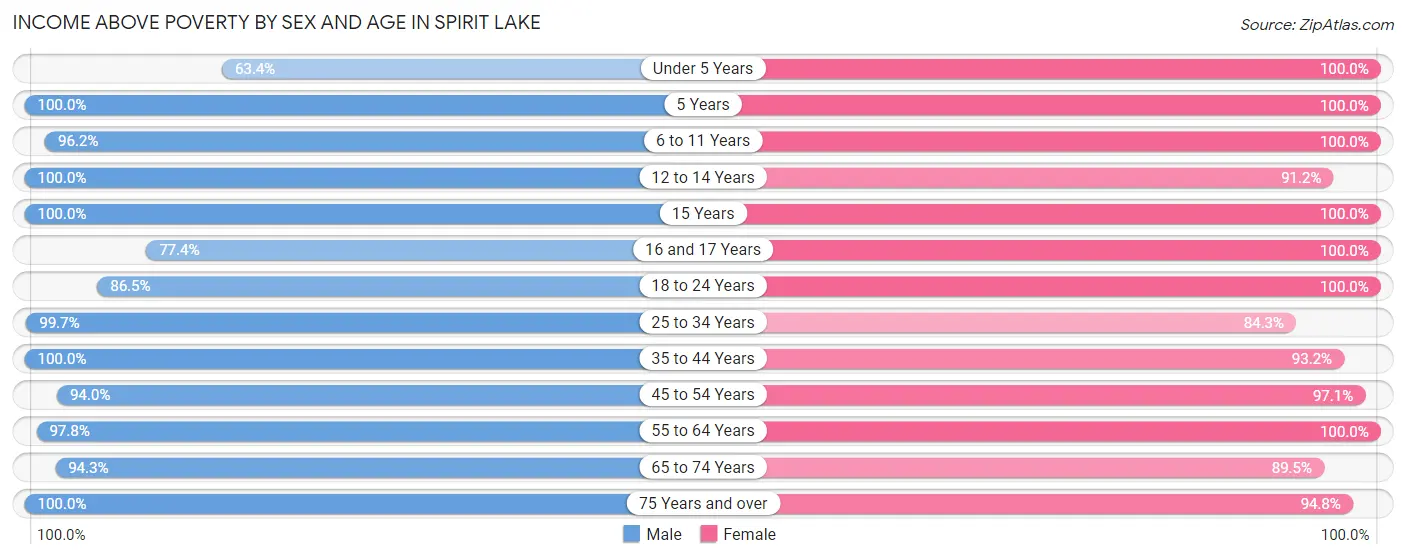
| Age Bracket | Male | Female |
| Under 5 Years | 83 (63.4%) | 157 (100.0%) |
| 5 Years | 18 (100.0%) | 64 (100.0%) |
| 6 to 11 Years | 152 (96.2%) | 208 (100.0%) |
| 12 to 14 Years | 218 (100.0%) | 83 (91.2%) |
| 15 Years | 13 (100.0%) | 17 (100.0%) |
| 16 and 17 Years | 48 (77.4%) | 37 (100.0%) |
| 18 to 24 Years | 237 (86.5%) | 276 (100.0%) |
| 25 to 34 Years | 316 (99.7%) | 311 (84.3%) |
| 35 to 44 Years | 280 (100.0%) | 301 (93.2%) |
| 45 to 54 Years | 234 (94.0%) | 234 (97.1%) |
| 55 to 64 Years | 398 (97.8%) | 202 (100.0%) |
| 65 to 74 Years | 265 (94.3%) | 331 (89.5%) |
| 75 Years and over | 147 (100.0%) | 366 (94.8%) |
| Total | 2,409 (94.3%) | 2,587 (94.4%) |
Income Below Poverty Among Married-Couple Families in Spirit Lake
The poverty statistics for married-couple families in Spirit Lake show that 1.4% or 14 of the total 970 families live below the poverty line. Families with 1 or 2 children have the highest poverty rate of 4.4%, comprising of 14 families. On the other hand, families with no children have the lowest poverty rate of 0.0%, which includes 0 families.
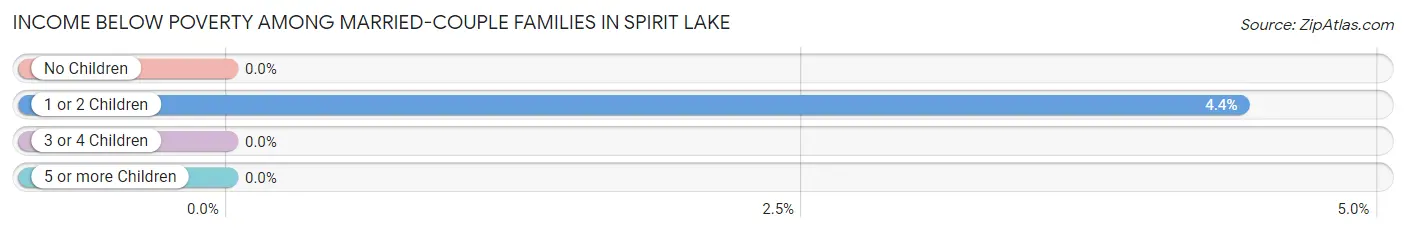
| Children | Above Poverty | Below Poverty |
| No Children | 543 (100.0%) | 0 (0.0%) |
| 1 or 2 Children | 304 (95.6%) | 14 (4.4%) |
| 3 or 4 Children | 109 (100.0%) | 0 (0.0%) |
| 5 or more Children | 0 (0.0%) | 0 (0.0%) |
| Total | 956 (98.6%) | 14 (1.4%) |
Income Below Poverty Among Single-Parent Households in Spirit Lake
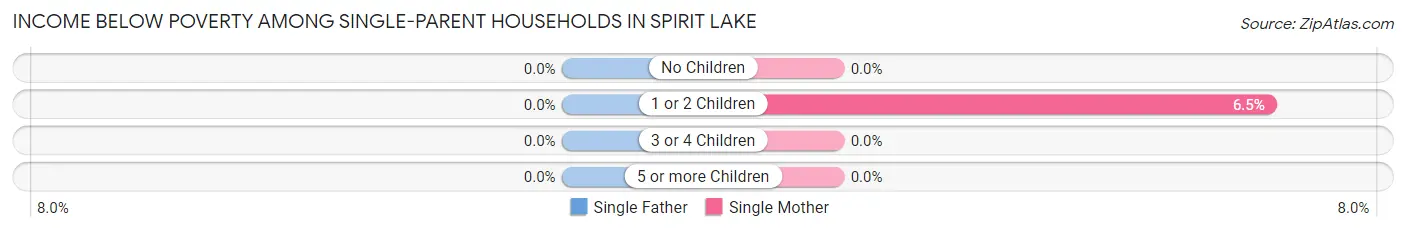
| Children | Single Father | Single Mother |
| No Children | 0 (0.0%) | 0 (0.0%) |
| 1 or 2 Children | 0 (0.0%) | 8 (6.5%) |
| 3 or 4 Children | 0 (0.0%) | 0 (0.0%) |
| 5 or more Children | 0 (0.0%) | 0 (0.0%) |
| Total | 0 (0.0%) | 8 (5.1%) |
Income Below Poverty Among Married-Couple vs Single-Parent Households in Spirit Lake
The poverty data for Spirit Lake shows that 14 of the married-couple family households (1.4%) and 8 of the single-parent households (2.9%) are living below the poverty level. Within the married-couple family households, those with 1 or 2 children have the highest poverty rate, with 14 households (4.4%) falling below the poverty line. Among the single-parent households, those with 1 or 2 children have the highest poverty rate, with 8 household (4.7%) living below poverty.
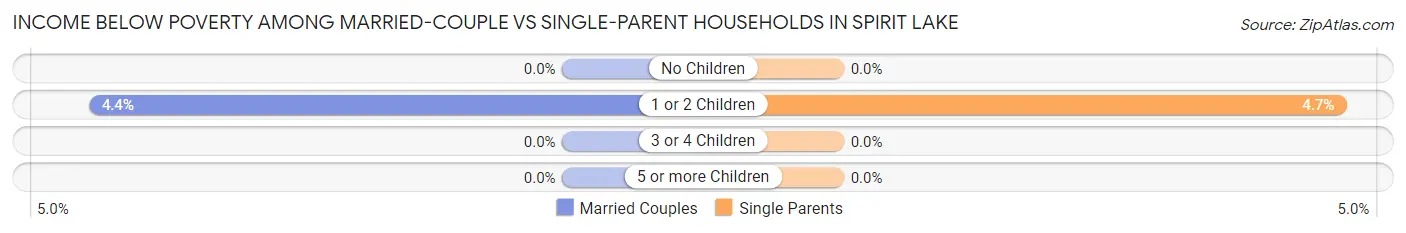
| Children | Married-Couple Families | Single-Parent Households |
| No Children | 0 (0.0%) | 0 (0.0%) |
| 1 or 2 Children | 14 (4.4%) | 8 (4.7%) |
| 3 or 4 Children | 0 (0.0%) | 0 (0.0%) |
| 5 or more Children | 0 (0.0%) | 0 (0.0%) |
| Total | 14 (1.4%) | 8 (2.9%) |
Race in Spirit Lake
The most populous races in Spirit Lake are White / Caucasian (4,961 | 91.7%), Two or more Races (403 | 7.4%), and Hispanic or Latino (129 | 2.4%).
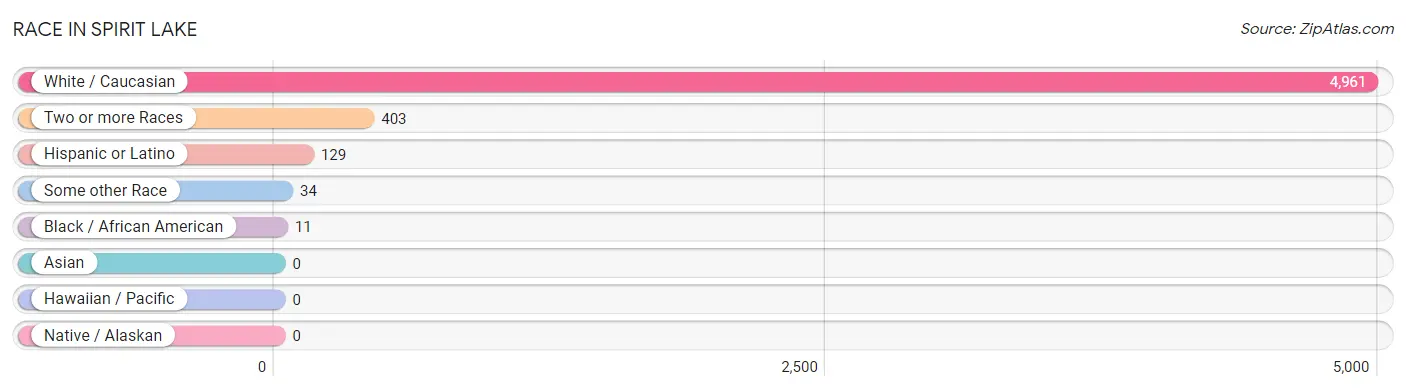
| Race | # Population | % Population |
| Asian | 0 | 0.0% |
| Black / African American | 11 | 0.2% |
| Hawaiian / Pacific | 0 | 0.0% |
| Hispanic or Latino | 129 | 2.4% |
| Native / Alaskan | 0 | 0.0% |
| White / Caucasian | 4,961 | 91.7% |
| Two or more Races | 403 | 7.4% |
| Some other Race | 34 | 0.6% |
| Total | 5,409 | 100.0% |
Ancestry in Spirit Lake
The most populous ancestries reported in Spirit Lake are German (2,666 | 49.3%), Irish (389 | 7.2%), Dutch (343 | 6.3%), Norwegian (340 | 6.3%), and Danish (336 | 6.2%), together accounting for 75.3% of all Spirit Lake residents.
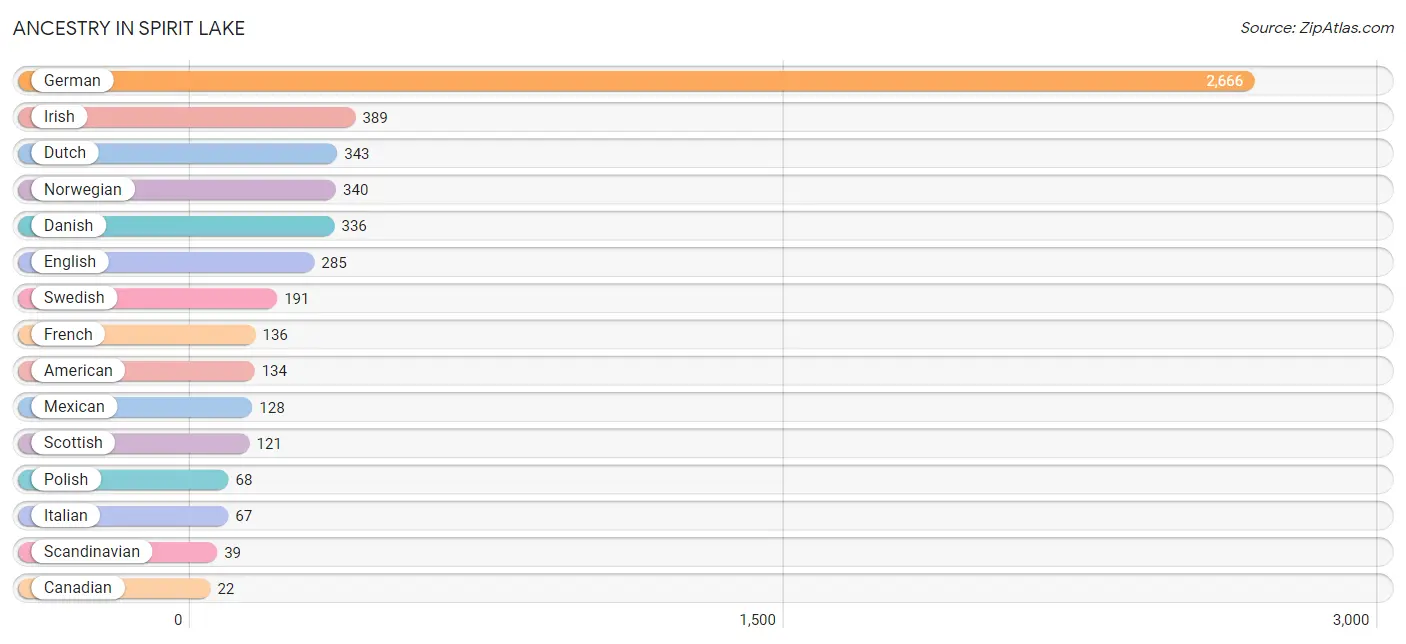
| Ancestry | # Population | % Population |
| African | 1 | 0.0% |
| American | 134 | 2.5% |
| Arab | 14 | 0.3% |
| Canadian | 22 | 0.4% |
| Czech | 15 | 0.3% |
| Danish | 336 | 6.2% |
| Dutch | 343 | 6.3% |
| English | 285 | 5.3% |
| European | 13 | 0.2% |
| French | 136 | 2.5% |
| French Canadian | 15 | 0.3% |
| German | 2,666 | 49.3% |
| German Russian | 22 | 0.4% |
| Irish | 389 | 7.2% |
| Italian | 67 | 1.2% |
| Lebanese | 14 | 0.3% |
| Mexican | 128 | 2.4% |
| Native Hawaiian | 16 | 0.3% |
| Northern European | 17 | 0.3% |
| Norwegian | 340 | 6.3% |
| Pennsylvania German | 16 | 0.3% |
| Polish | 68 | 1.3% |
| Russian | 5 | 0.1% |
| Scandinavian | 39 | 0.7% |
| Scotch-Irish | 4 | 0.1% |
| Scottish | 121 | 2.2% |
| Subsaharan African | 1 | 0.0% |
| Swedish | 191 | 3.5% |
| Welsh | 11 | 0.2% | View All 29 Rows |
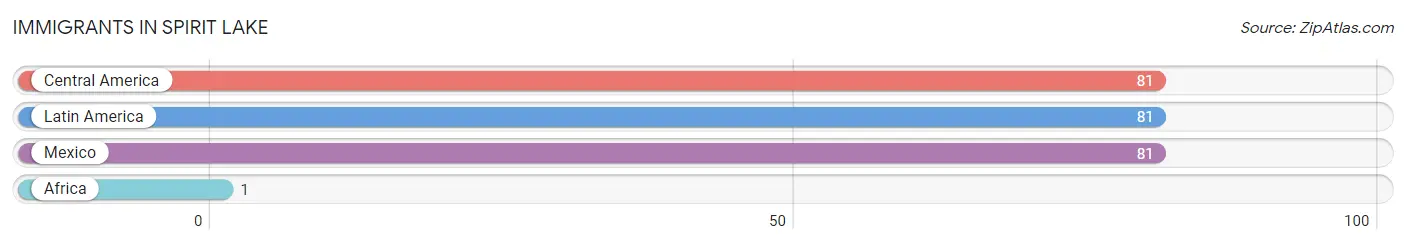
Immigrants in Spirit Lake
The most numerous immigrant groups reported in Spirit Lake came from Central America (81 | 1.5%), Latin America (81 | 1.5%), Mexico (81 | 1.5%), and Africa (1 | 0.0%), together accounting for 4.5% of all Spirit Lake residents.
| Immigration Origin | # Population | % Population |
| Africa | 1 | 0.0% |
| Central America | 81 | 1.5% |
| Latin America | 81 | 1.5% |
| Mexico | 81 | 1.5% | View All 4 Rows |
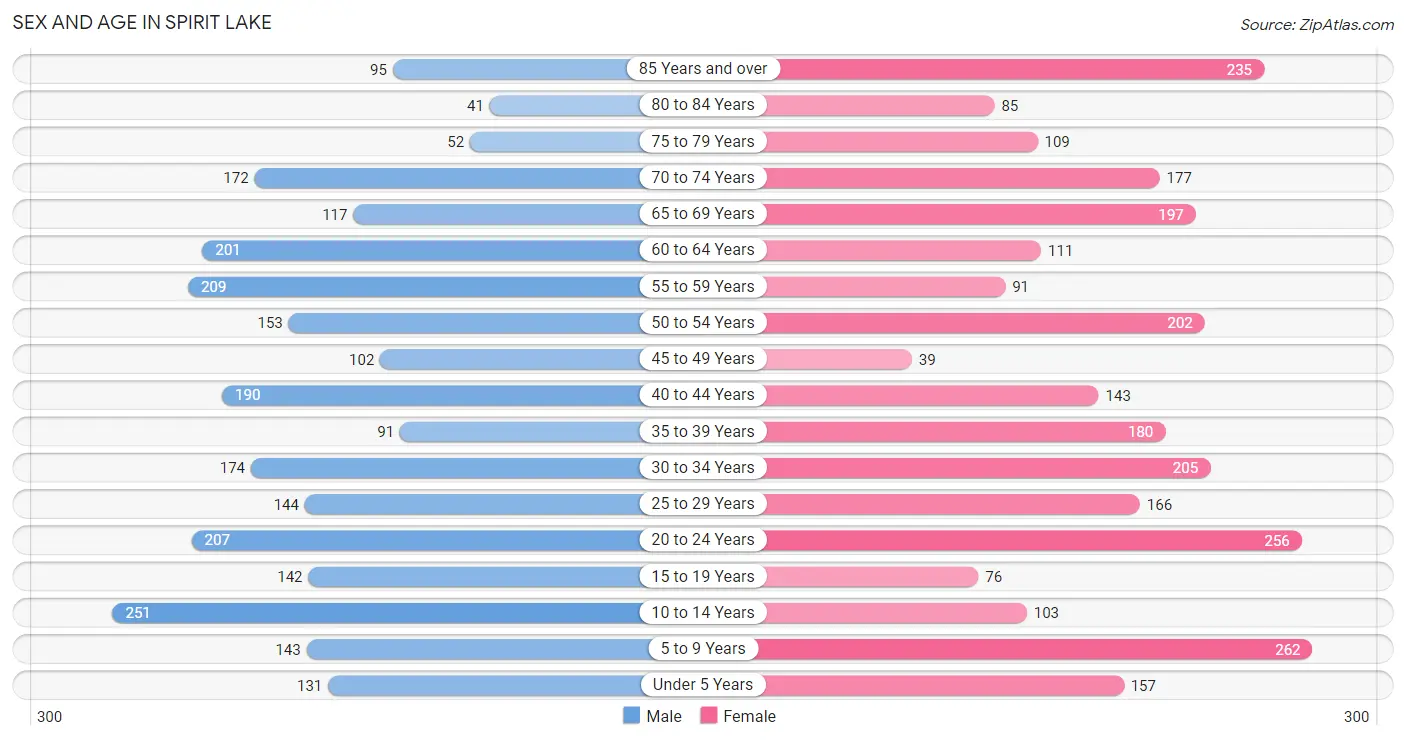
Sex and Age in Spirit Lake
Sex and Age in Spirit Lake
The most populous age groups in Spirit Lake are 10 to 14 Years (251 | 9.6%) for men and 5 to 9 Years (262 | 9.4%) for women.
| Age Bracket | Male | Female |
| Under 5 Years | 131 (5.0%) | 157 (5.6%) |
| 5 to 9 Years | 143 (5.5%) | 262 (9.4%) |
| 10 to 14 Years | 251 (9.6%) | 103 (3.7%) |
| 15 to 19 Years | 142 (5.4%) | 76 (2.7%) |
| 20 to 24 Years | 207 (7.9%) | 256 (9.2%) |
| 25 to 29 Years | 144 (5.5%) | 166 (5.9%) |
| 30 to 34 Years | 174 (6.7%) | 205 (7.3%) |
| 35 to 39 Years | 91 (3.5%) | 180 (6.4%) |
| 40 to 44 Years | 190 (7.3%) | 143 (5.1%) |
| 45 to 49 Years | 102 (3.9%) | 39 (1.4%) |
| 50 to 54 Years | 153 (5.9%) | 202 (7.2%) |
| 55 to 59 Years | 209 (8.0%) | 91 (3.3%) |
| 60 to 64 Years | 201 (7.7%) | 111 (4.0%) |
| 65 to 69 Years | 117 (4.5%) | 197 (7.0%) |
| 70 to 74 Years | 172 (6.6%) | 177 (6.3%) |
| 75 to 79 Years | 52 (2.0%) | 109 (3.9%) |
| 80 to 84 Years | 41 (1.6%) | 85 (3.0%) |
| 85 Years and over | 95 (3.6%) | 235 (8.4%) |
| Total | 2,615 (100.0%) | 2,794 (100.0%) |
Families and Households in Spirit Lake
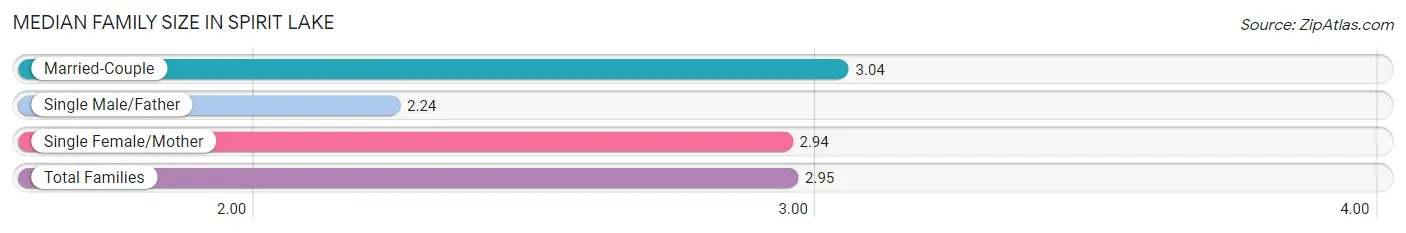
Median Family Size in Spirit Lake
The median family size in Spirit Lake is 2.95 persons per family, with married-couple families (970 | 77.8%) accounting for the largest median family size of 3.04 persons per family. On the other hand, single male/father families (119 | 9.5%) represent the smallest median family size with 2.24 persons per family.
| Family Type | # Families | Family Size |
| Married-Couple | 970 (77.8%) | 3.04 |
| Single Male/Father | 119 (9.5%) | 2.24 |
| Single Female/Mother | 158 (12.7%) | 2.94 |
| Total Families | 1,247 (100.0%) | 2.95 |
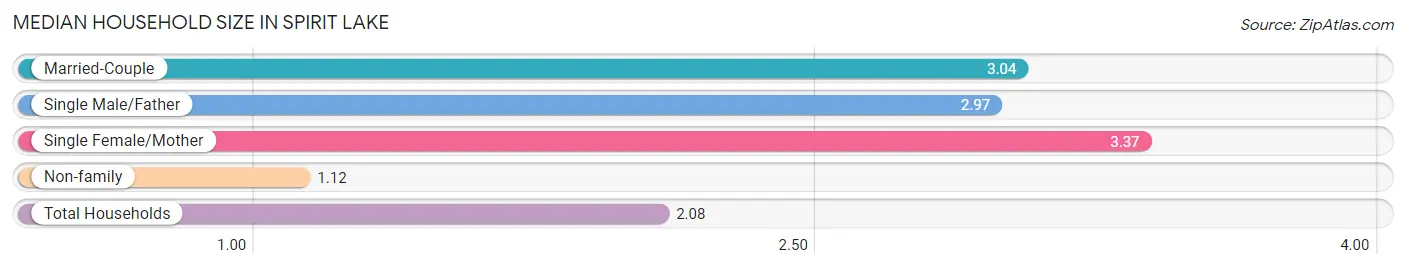
Median Household Size in Spirit Lake
The median household size in Spirit Lake is 2.08 persons per household, with single female/mother households (158 | 6.2%) accounting for the largest median household size of 3.37 persons per household. non-family households (1,290 | 50.8%) represent the smallest median household size with 1.12 persons per household.
| Household Type | # Households | Household Size |
| Married-Couple | 970 (38.2%) | 3.04 |
| Single Male/Father | 119 (4.7%) | 2.97 |
| Single Female/Mother | 158 (6.2%) | 3.37 |
| Non-family | 1,290 (50.8%) | 1.12 |
| Total Households | 2,537 (100.0%) | 2.08 |
Household Size by Marriage Status in Spirit Lake
Out of a total of 2,537 households in Spirit Lake, 1,247 (49.1%) are family households, while 1,290 (50.8%) are nonfamily households. The most numerous type of family households are 2-person households, comprising 527, and the most common type of nonfamily households are 1-person households, comprising 1,167.
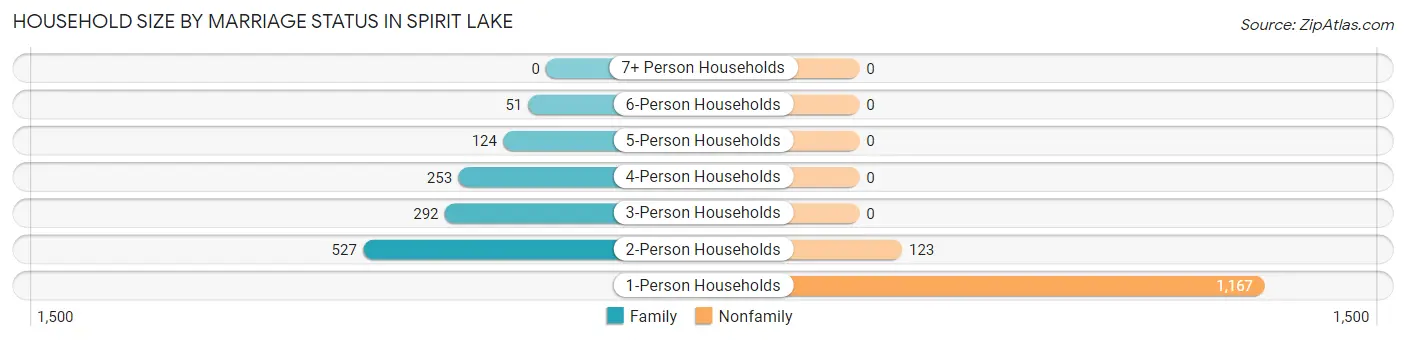
| Household Size | Family Households | Nonfamily Households |
| 1-Person Households | - | 1,167 (46.0%) |
| 2-Person Households | 527 (20.8%) | 123 (4.9%) |
| 3-Person Households | 292 (11.5%) | 0 (0.0%) |
| 4-Person Households | 253 (10.0%) | 0 (0.0%) |
| 5-Person Households | 124 (4.9%) | 0 (0.0%) |
| 6-Person Households | 51 (2.0%) | 0 (0.0%) |
| 7+ Person Households | 0 (0.0%) | 0 (0.0%) |
| Total | 1,247 (49.1%) | 1,290 (50.8%) |
Female Fertility in Spirit Lake
Fertility by Age in Spirit Lake
Average fertility rate in Spirit Lake is 63.0 births per 1,000 women. Women in the age bracket of 20 to 34 years have the highest fertility rate with 112.0 births per 1,000 women. Women in the age bracket of 20 to 34 years acount for 100.0% of all women with births.
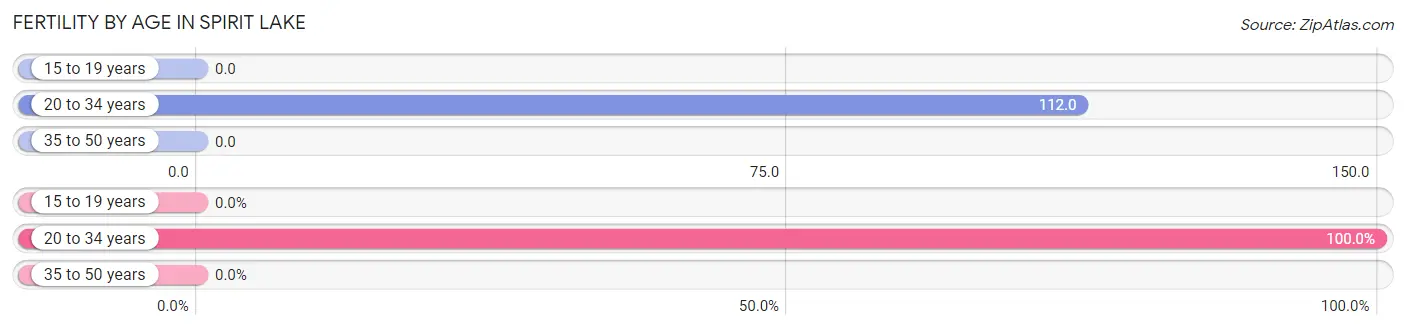
| Age Bracket | Women with Births | Births / 1,000 Women |
| 15 to 19 years | 0 (0.0%) | 0.0 |
| 20 to 34 years | 70 (100.0%) | 112.0 |
| 35 to 50 years | 0 (0.0%) | 0.0 |
| Total | 70 (100.0%) | 63.0 |
Fertility by Age by Marriage Status in Spirit Lake
37.1% of women with births (70) in Spirit Lake are married. The highest percentage of unmarried women with births falls into 20 to 34 years age bracket with 62.9% of them unmarried at the time of birth, while the lowest percentage of unmarried women with births belong to 20 to 34 years age bracket with 62.9% of them unmarried.
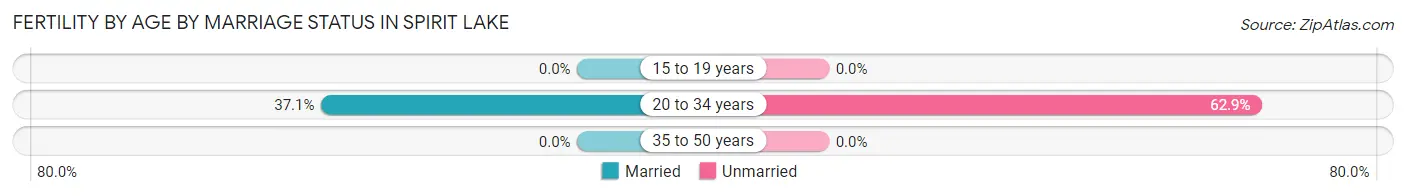
| Age Bracket | Married | Unmarried |
| 15 to 19 years | 0 (0.0%) | 0 (0.0%) |
| 20 to 34 years | 26 (37.1%) | 44 (62.9%) |
| 35 to 50 years | 0 (0.0%) | 0 (0.0%) |
| Total | 26 (37.1%) | 44 (62.9%) |
Fertility by Education in Spirit Lake
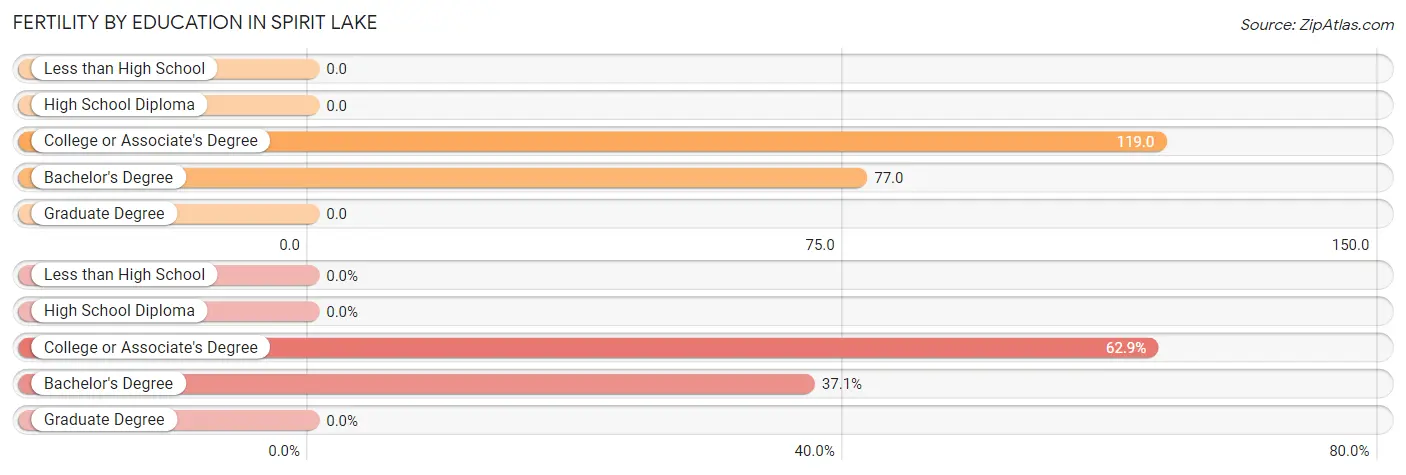
| Educational Attainment | Women with Births | Births / 1,000 Women |
| Less than High School | 0 (0.0%) | 0.0 |
| High School Diploma | 0 (0.0%) | 0.0 |
| College or Associate's Degree | 44 (62.9%) | 119.0 |
| Bachelor's Degree | 26 (37.1%) | 77.0 |
| Graduate Degree | 0 (0.0%) | 0.0 |
| Total | 70 (100.0%) | 63.0 |
Fertility by Education by Marriage Status in Spirit Lake
62.9% of women with births in Spirit Lake are unmarried. Women with the educational attainment of bachelor's degree are most likely to be married with 100.0% of them married at childbirth, while women with the educational attainment of college or associate's degree are least likely to be married with 100.0% of them unmarried at childbirth.
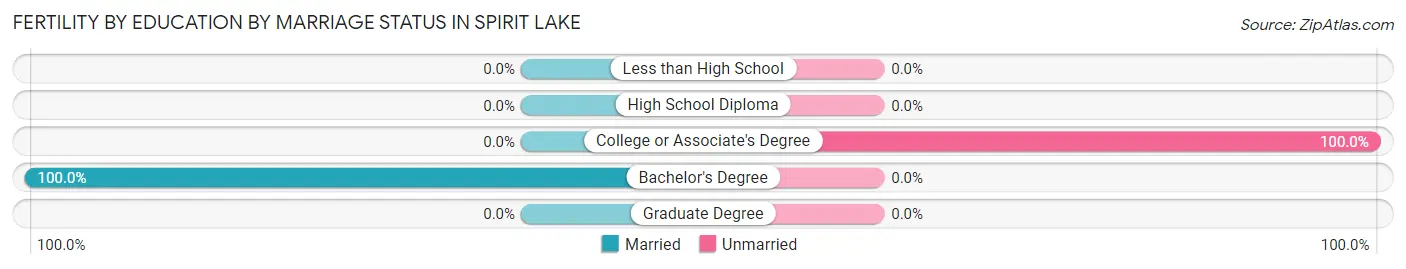
| Educational Attainment | Married | Unmarried |
| Less than High School | 0 (0.0%) | 0 (0.0%) |
| High School Diploma | 0 (0.0%) | 0 (0.0%) |
| College or Associate's Degree | 0 (0.0%) | 44 (100.0%) |
| Bachelor's Degree | 26 (100.0%) | 0 (0.0%) |
| Graduate Degree | 0 (0.0%) | 0 (0.0%) |
| Total | 26 (37.1%) | 44 (62.9%) |
Employment Characteristics in Spirit Lake
Employment by Class of Employer in Spirit Lake
Among the 2,901 employed individuals in Spirit Lake, private company employees (1,934 | 66.7%), not-for-profit organizations (296 | 10.2%), and self-employed (not incorporated) (257 | 8.9%) make up the most common classes of employment.
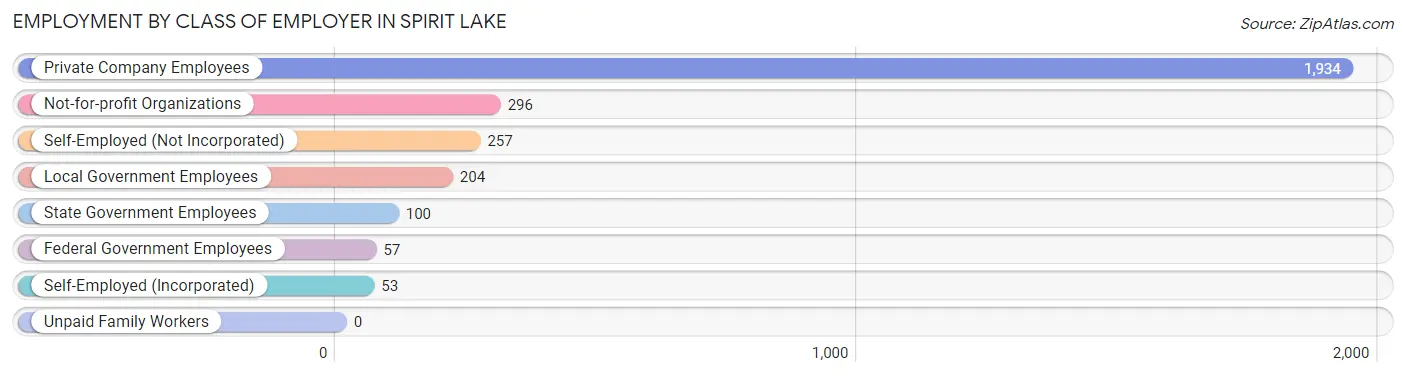
| Employer Class | # Employees | % Employees |
| Private Company Employees | 1,934 | 66.7% |
| Self-Employed (Incorporated) | 53 | 1.8% |
| Self-Employed (Not Incorporated) | 257 | 8.9% |
| Not-for-profit Organizations | 296 | 10.2% |
| Local Government Employees | 204 | 7.0% |
| State Government Employees | 100 | 3.5% |
| Federal Government Employees | 57 | 2.0% |
| Unpaid Family Workers | 0 | 0.0% |
| Total | 2,901 | 100.0% |
Employment Status by Age in Spirit Lake
According to the labor force statistics for Spirit Lake, out of the total population over 16 years of age (4,331), 69.4% or 3,006 individuals are in the labor force, with 1.2% or 36 of them unemployed. The age group with the highest labor force participation rate is 25 to 29 years, with 99.4% or 308 individuals in the labor force. Within the labor force, the 30 to 34 years age range has the highest percentage of unemployed individuals, with 6.0% or 22 of them being unemployed.
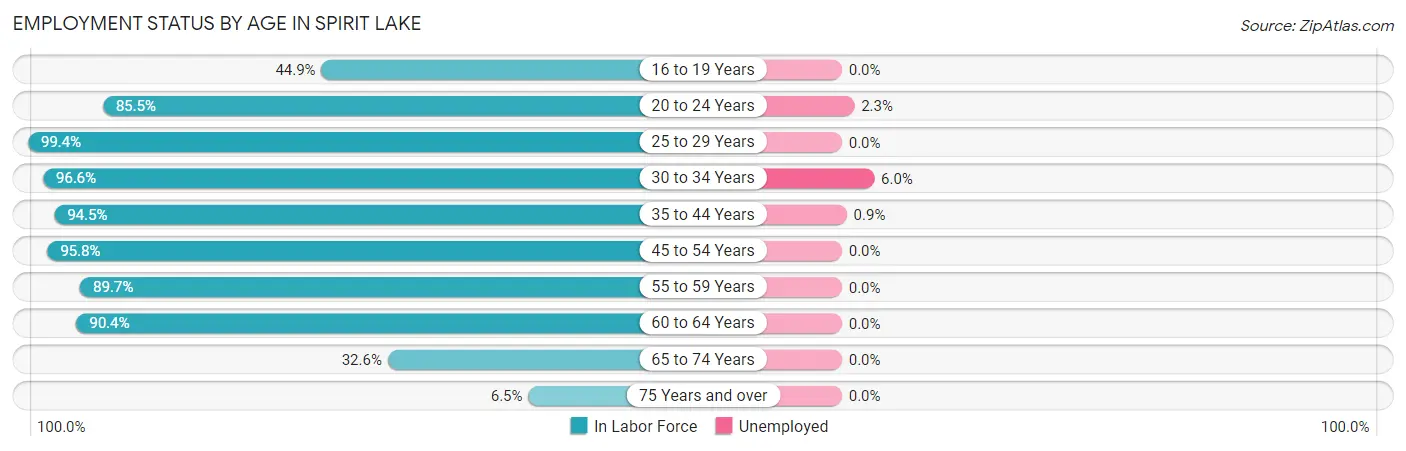
| Age Bracket | In Labor Force | Unemployed |
| 16 to 19 Years | 84 (44.9%) | 0 (0.0%) |
| 20 to 24 Years | 396 (85.5%) | 9 (2.3%) |
| 25 to 29 Years | 308 (99.4%) | 0 (0.0%) |
| 30 to 34 Years | 366 (96.6%) | 22 (6.0%) |
| 35 to 44 Years | 571 (94.5%) | 5 (0.9%) |
| 45 to 54 Years | 475 (95.8%) | 0 (0.0%) |
| 55 to 59 Years | 269 (89.7%) | 0 (0.0%) |
| 60 to 64 Years | 282 (90.4%) | 0 (0.0%) |
| 65 to 74 Years | 216 (32.6%) | 0 (0.0%) |
| 75 Years and over | 40 (6.5%) | 0 (0.0%) |
| Total | 3,006 (69.4%) | 36 (1.2%) |
Employment Status by Educational Attainment in Spirit Lake
According to labor force statistics for Spirit Lake, 94.6% of individuals (2,271) out of the total population between 25 and 64 years of age (2,401) are in the labor force, with 1.2% or 27 of them being unemployed. The group with the highest labor force participation rate are those with the educational attainment of less than high school, with 100.0% or 80 individuals in the labor force. Within the labor force, individuals with college / associate degree education have the highest percentage of unemployment, with 2.6% or 22 of them being unemployed.
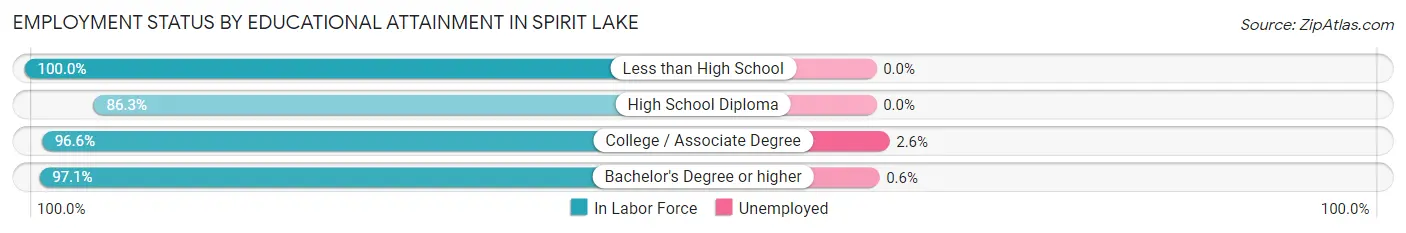
| Educational Attainment | In Labor Force | Unemployed |
| Less than High School | 80 (100.0%) | 0 (0.0%) |
| High School Diploma | 465 (86.3%) | 0 (0.0%) |
| College / Associate Degree | 844 (96.6%) | 23 (2.6%) |
| Bachelor's Degree or higher | 882 (97.1%) | 5 (0.6%) |
| Total | 2,271 (94.6%) | 29 (1.2%) |
Employment Occupations by Sex in Spirit Lake
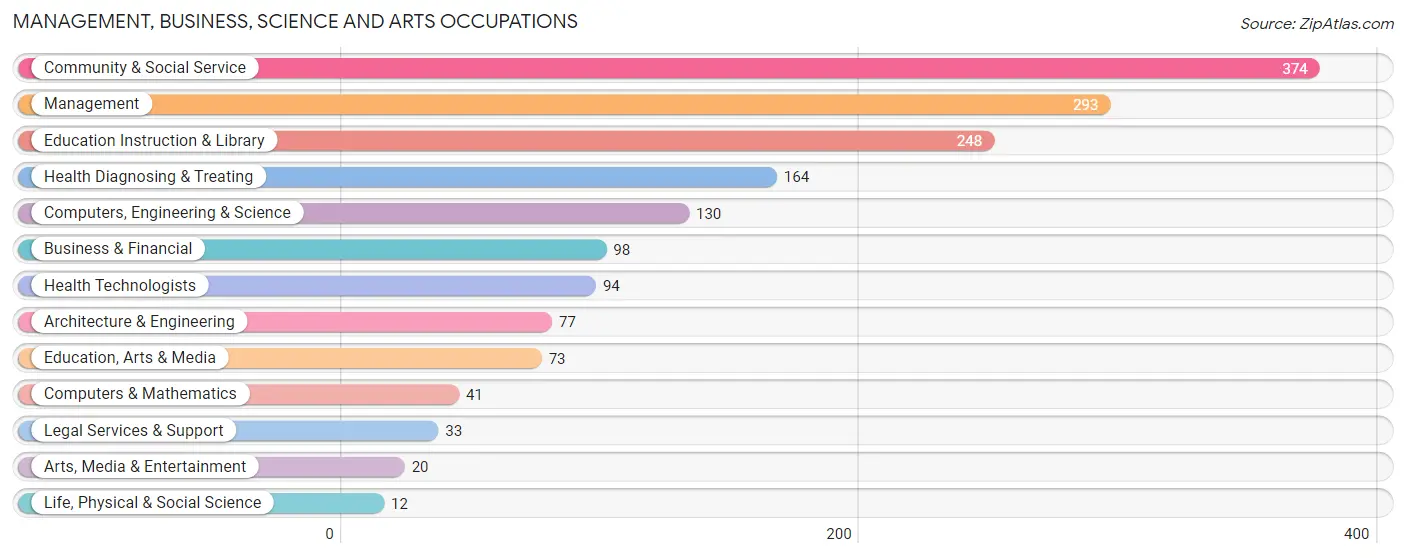
Management, Business, Science and Arts Occupations
The most common Management, Business, Science and Arts occupations in Spirit Lake are Community & Social Service (374 | 12.6%), Management (293 | 9.9%), Education Instruction & Library (248 | 8.4%), Health Diagnosing & Treating (164 | 5.5%), and Computers, Engineering & Science (130 | 4.4%).
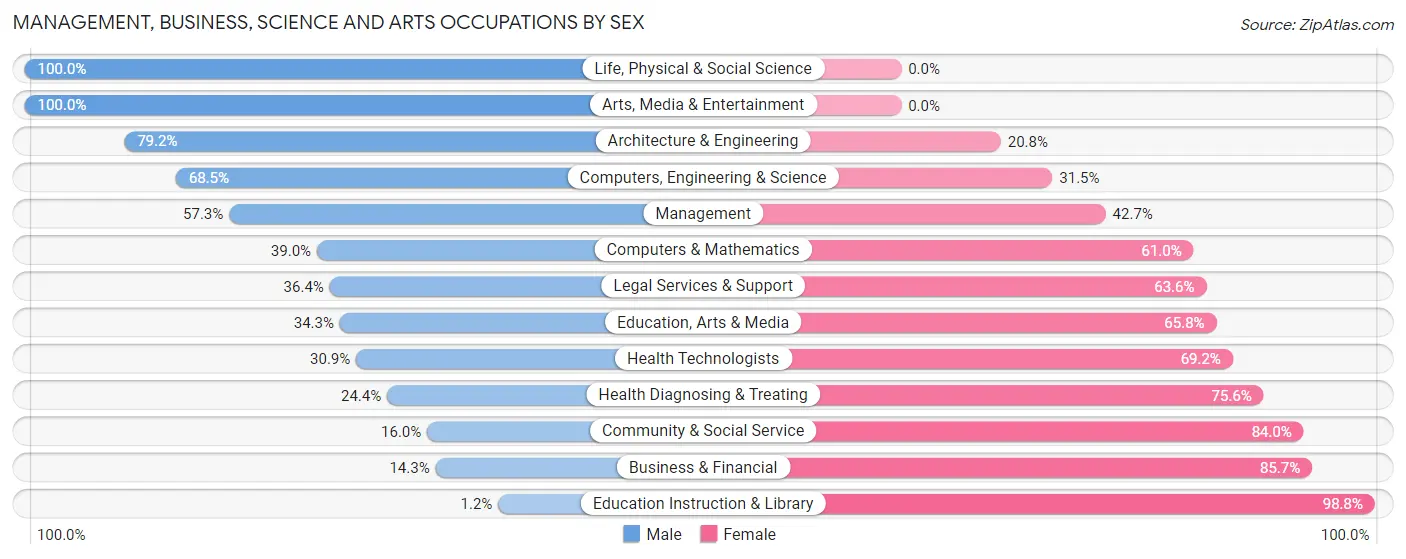
Management, Business, Science and Arts Occupations by Sex
Within the Management, Business, Science and Arts occupations in Spirit Lake, the most male-oriented occupations are Life, Physical & Social Science (100.0%), Arts, Media & Entertainment (100.0%), and Architecture & Engineering (79.2%), while the most female-oriented occupations are Education Instruction & Library (98.8%), Business & Financial (85.7%), and Community & Social Service (84.0%).
| Occupation | Male | Female |
| Management | 168 (57.3%) | 125 (42.7%) |
| Business & Financial | 14 (14.3%) | 84 (85.7%) |
| Computers, Engineering & Science | 89 (68.5%) | 41 (31.5%) |
| Computers & Mathematics | 16 (39.0%) | 25 (61.0%) |
| Architecture & Engineering | 61 (79.2%) | 16 (20.8%) |
| Life, Physical & Social Science | 12 (100.0%) | 0 (0.0%) |
| Community & Social Service | 60 (16.0%) | 314 (84.0%) |
| Education, Arts & Media | 25 (34.3%) | 48 (65.7%) |
| Legal Services & Support | 12 (36.4%) | 21 (63.6%) |
| Education Instruction & Library | 3 (1.2%) | 245 (98.8%) |
| Arts, Media & Entertainment | 20 (100.0%) | 0 (0.0%) |
| Health Diagnosing & Treating | 40 (24.4%) | 124 (75.6%) |
| Health Technologists | 29 (30.8%) | 65 (69.2%) |
| Total (Category) | 371 (35.0%) | 688 (65.0%) |
| Total (Overall) | 1,561 (52.5%) | 1,410 (47.5%) |
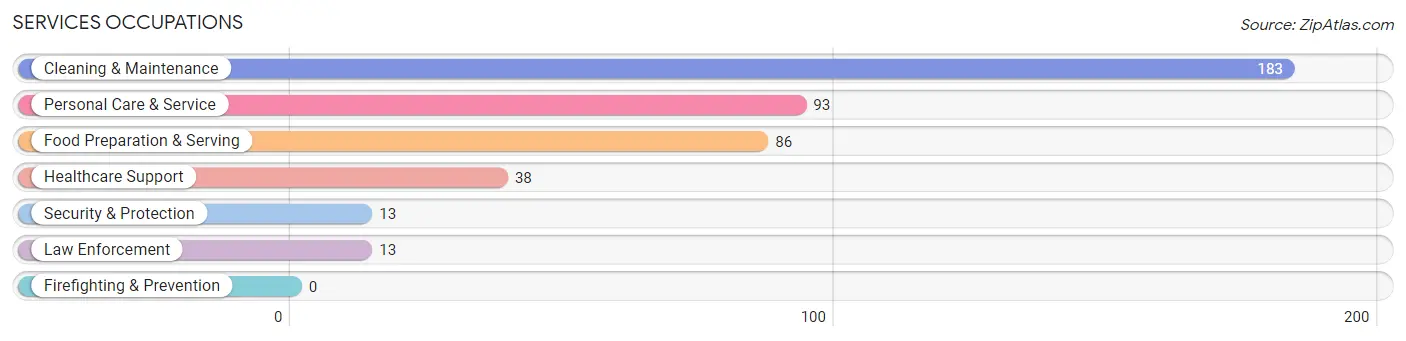
Services Occupations
The most common Services occupations in Spirit Lake are Cleaning & Maintenance (183 | 6.2%), Personal Care & Service (93 | 3.1%), Food Preparation & Serving (86 | 2.9%), Healthcare Support (38 | 1.3%), and Security & Protection (13 | 0.4%).
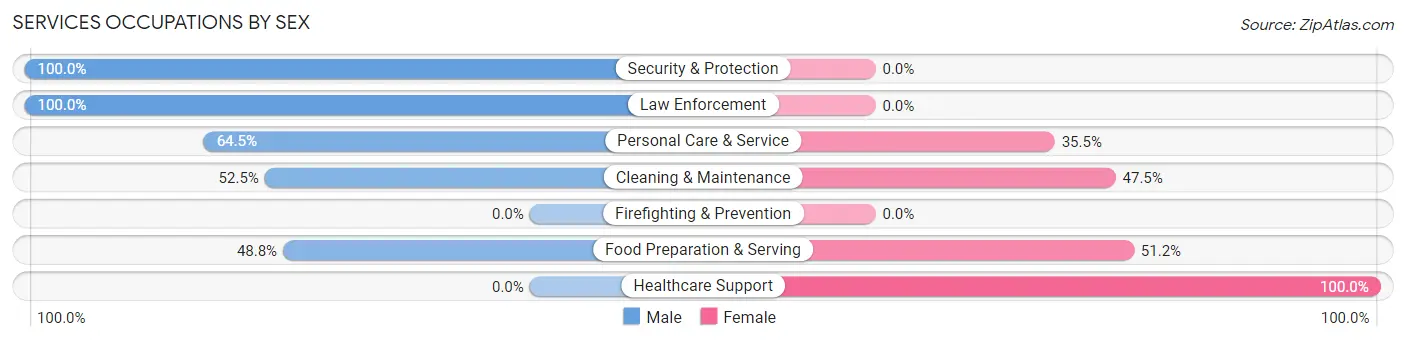
Services Occupations by Sex
Within the Services occupations in Spirit Lake, the most male-oriented occupations are Security & Protection (100.0%), Law Enforcement (100.0%), and Personal Care & Service (64.5%), while the most female-oriented occupations are Healthcare Support (100.0%), Food Preparation & Serving (51.2%), and Cleaning & Maintenance (47.5%).
| Occupation | Male | Female |
| Healthcare Support | 0 (0.0%) | 38 (100.0%) |
| Security & Protection | 13 (100.0%) | 0 (0.0%) |
| Firefighting & Prevention | 0 (0.0%) | 0 (0.0%) |
| Law Enforcement | 13 (100.0%) | 0 (0.0%) |
| Food Preparation & Serving | 42 (48.8%) | 44 (51.2%) |
| Cleaning & Maintenance | 96 (52.5%) | 87 (47.5%) |
| Personal Care & Service | 60 (64.5%) | 33 (35.5%) |
| Total (Category) | 211 (51.1%) | 202 (48.9%) |
| Total (Overall) | 1,561 (52.5%) | 1,410 (47.5%) |
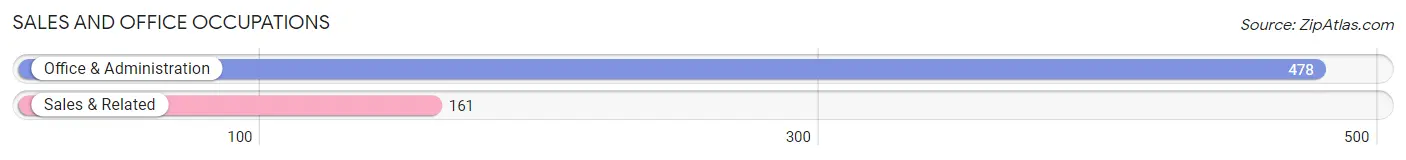
Sales and Office Occupations
The most common Sales and Office occupations in Spirit Lake are Office & Administration (478 | 16.1%), and Sales & Related (161 | 5.4%).
Sales and Office Occupations by Sex
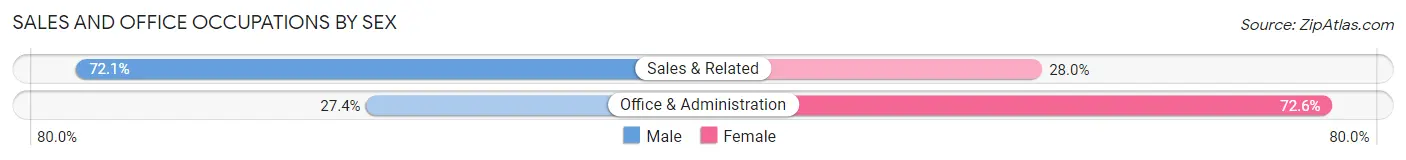
| Occupation | Male | Female |
| Sales & Related | 116 (72.1%) | 45 (28.0%) |
| Office & Administration | 131 (27.4%) | 347 (72.6%) |
| Total (Category) | 247 (38.7%) | 392 (61.4%) |
| Total (Overall) | 1,561 (52.5%) | 1,410 (47.5%) |
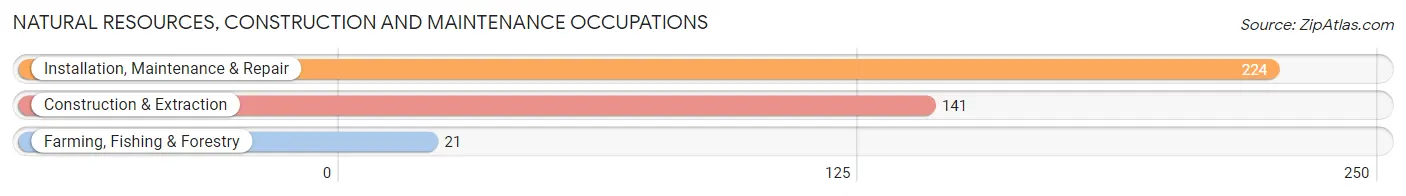
Natural Resources, Construction and Maintenance Occupations
The most common Natural Resources, Construction and Maintenance occupations in Spirit Lake are Installation, Maintenance & Repair (224 | 7.5%), Construction & Extraction (141 | 4.8%), and Farming, Fishing & Forestry (21 | 0.7%).
Natural Resources, Construction and Maintenance Occupations by Sex
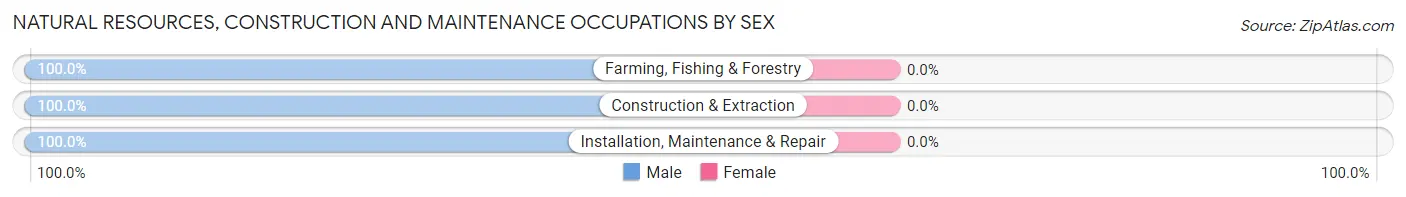
| Occupation | Male | Female |
| Farming, Fishing & Forestry | 21 (100.0%) | 0 (0.0%) |
| Construction & Extraction | 141 (100.0%) | 0 (0.0%) |
| Installation, Maintenance & Repair | 224 (100.0%) | 0 (0.0%) |
| Total (Category) | 386 (100.0%) | 0 (0.0%) |
| Total (Overall) | 1,561 (52.5%) | 1,410 (47.5%) |
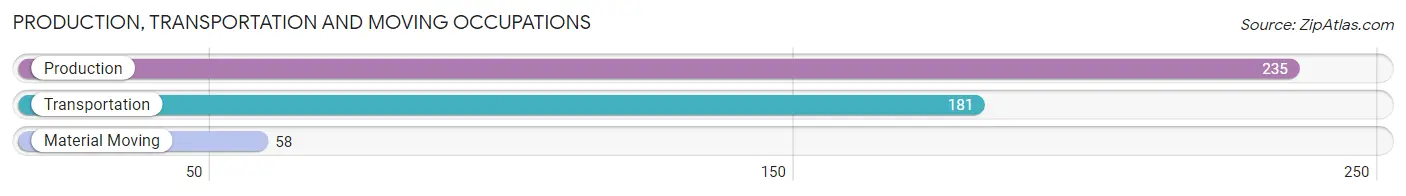
Production, Transportation and Moving Occupations
The most common Production, Transportation and Moving occupations in Spirit Lake are Production (235 | 7.9%), Transportation (181 | 6.1%), and Material Moving (58 | 1.9%).
Production, Transportation and Moving Occupations by Sex
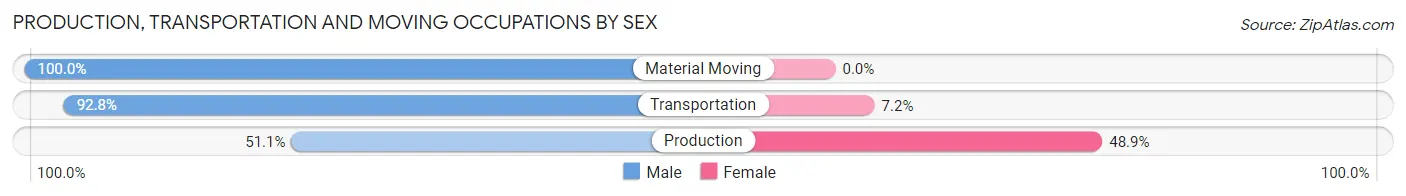
| Occupation | Male | Female |
| Production | 120 (51.1%) | 115 (48.9%) |
| Transportation | 168 (92.8%) | 13 (7.2%) |
| Material Moving | 58 (100.0%) | 0 (0.0%) |
| Total (Category) | 346 (73.0%) | 128 (27.0%) |
| Total (Overall) | 1,561 (52.5%) | 1,410 (47.5%) |
Employment Industries by Sex in Spirit Lake
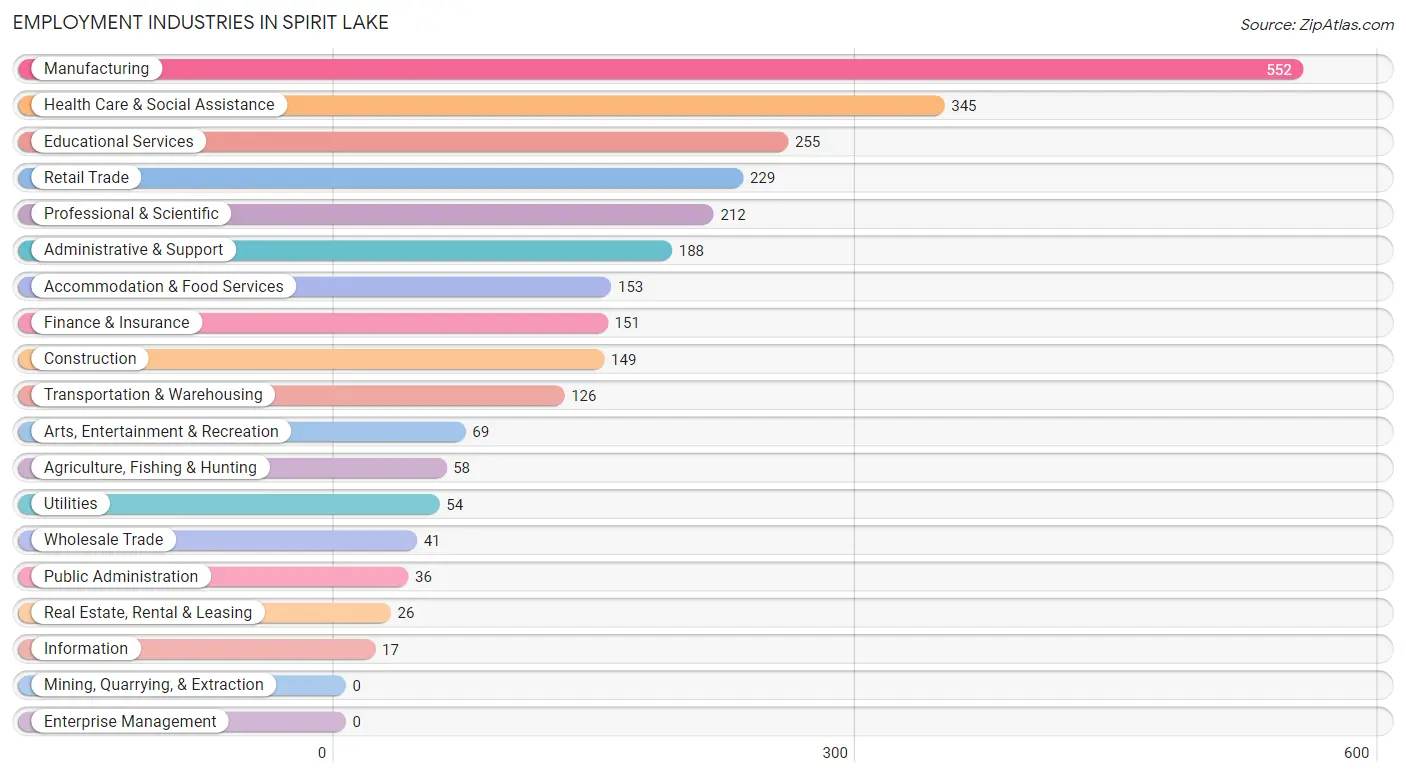
Employment Industries in Spirit Lake
The major employment industries in Spirit Lake include Manufacturing (552 | 18.6%), Health Care & Social Assistance (345 | 11.6%), Educational Services (255 | 8.6%), Retail Trade (229 | 7.7%), and Professional & Scientific (212 | 7.1%).
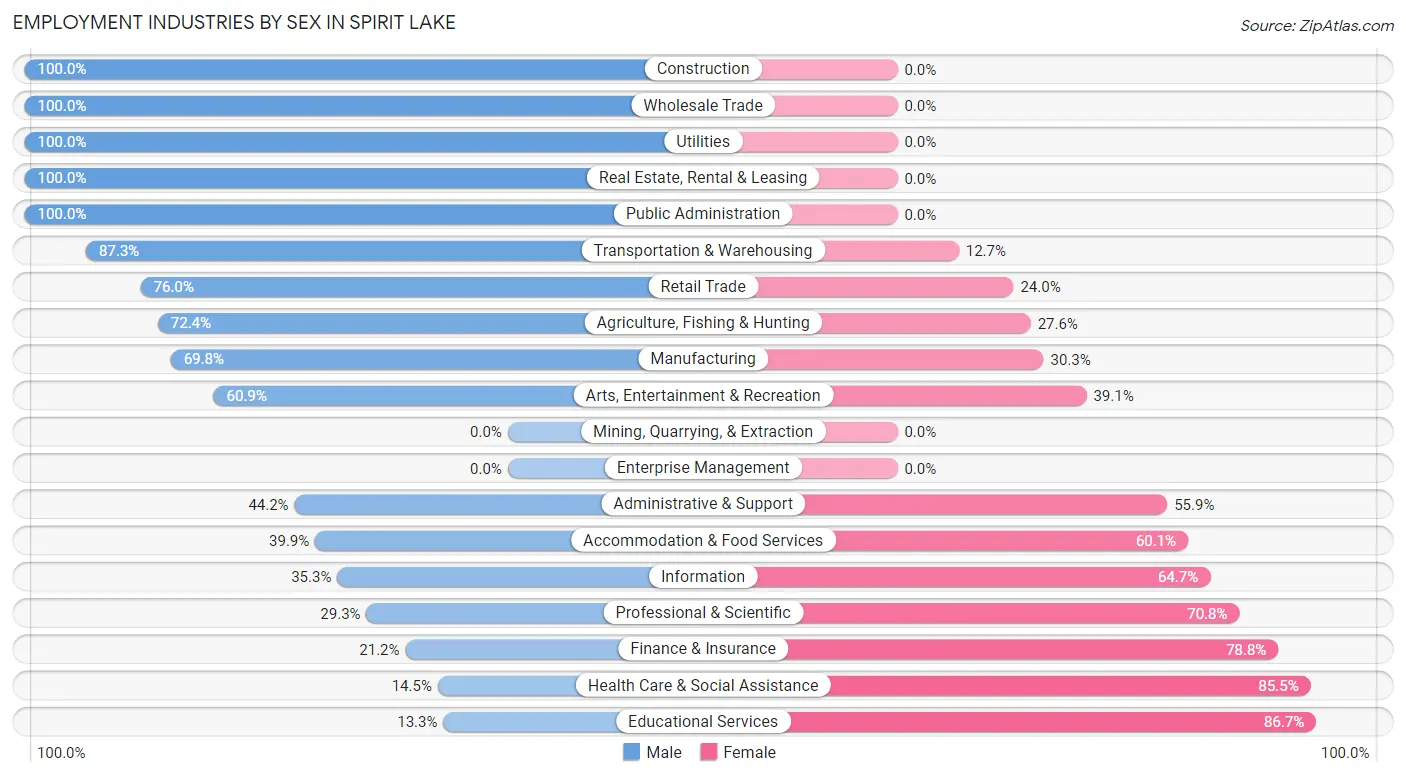
Employment Industries by Sex in Spirit Lake
The Spirit Lake industries that see more men than women are Construction (100.0%), Wholesale Trade (100.0%), and Utilities (100.0%), whereas the industries that tend to have a higher number of women are Educational Services (86.7%), Health Care & Social Assistance (85.5%), and Finance & Insurance (78.8%).
| Industry | Male | Female |
| Agriculture, Fishing & Hunting | 42 (72.4%) | 16 (27.6%) |
| Mining, Quarrying, & Extraction | 0 (0.0%) | 0 (0.0%) |
| Construction | 149 (100.0%) | 0 (0.0%) |
| Manufacturing | 385 (69.8%) | 167 (30.2%) |
| Wholesale Trade | 41 (100.0%) | 0 (0.0%) |
| Retail Trade | 174 (76.0%) | 55 (24.0%) |
| Transportation & Warehousing | 110 (87.3%) | 16 (12.7%) |
| Utilities | 54 (100.0%) | 0 (0.0%) |
| Information | 6 (35.3%) | 11 (64.7%) |
| Finance & Insurance | 32 (21.2%) | 119 (78.8%) |
| Real Estate, Rental & Leasing | 26 (100.0%) | 0 (0.0%) |
| Professional & Scientific | 62 (29.2%) | 150 (70.8%) |
| Enterprise Management | 0 (0.0%) | 0 (0.0%) |
| Administrative & Support | 83 (44.2%) | 105 (55.8%) |
| Educational Services | 34 (13.3%) | 221 (86.7%) |
| Health Care & Social Assistance | 50 (14.5%) | 295 (85.5%) |
| Arts, Entertainment & Recreation | 42 (60.9%) | 27 (39.1%) |
| Accommodation & Food Services | 61 (39.9%) | 92 (60.1%) |
| Public Administration | 36 (100.0%) | 0 (0.0%) |
| Total | 1,561 (52.5%) | 1,410 (47.5%) |
Education in Spirit Lake
School Enrollment in Spirit Lake
The most common levels of schooling among the 981 students in Spirit Lake are middle school (291 | 29.7%), elementary school (243 | 24.8%), and high school (165 | 16.8%).
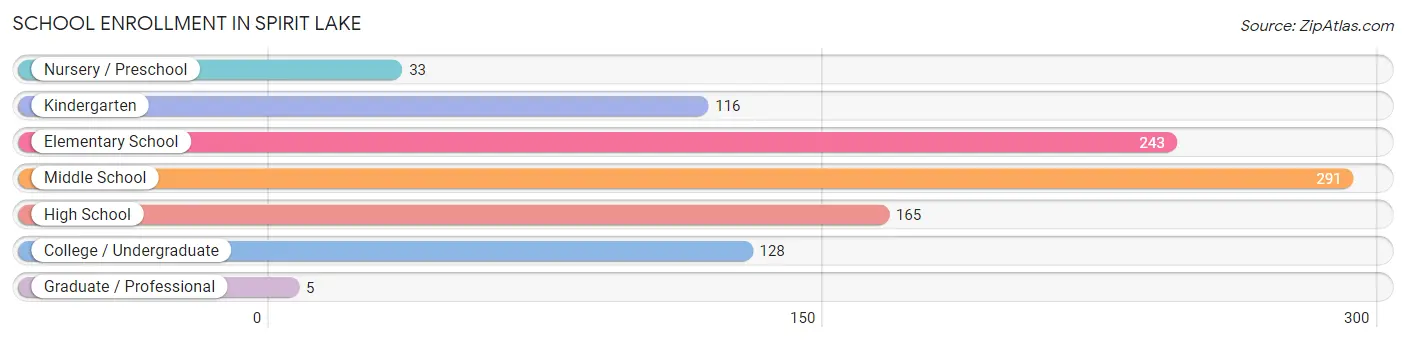
| School Level | # Students | % Students |
| Nursery / Preschool | 33 | 3.4% |
| Kindergarten | 116 | 11.8% |
| Elementary School | 243 | 24.8% |
| Middle School | 291 | 29.7% |
| High School | 165 | 16.8% |
| College / Undergraduate | 128 | 13.1% |
| Graduate / Professional | 5 | 0.5% |
| Total | 981 | 100.0% |
School Enrollment by Age by Funding Source in Spirit Lake
Out of a total of 981 students who are enrolled in schools in Spirit Lake, 170 (17.3%) attend a private institution, while the remaining 811 (82.7%) are enrolled in public schools. The age group of 35 years and over has the highest likelihood of being enrolled in private schools, with 27 (100.0% in the age bracket) enrolled. Conversely, the age group of 3 to 4 year olds has the lowest likelihood of being enrolled in a private school, with 33 (100.0% in the age bracket) attending a public institution.
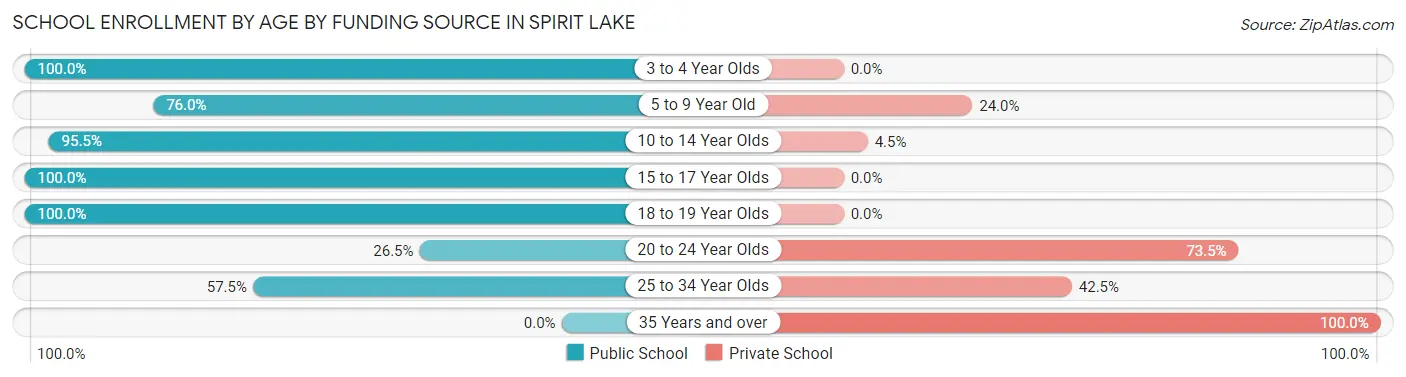
| Age Bracket | Public School | Private School |
| 3 to 4 Year Olds | 33 (100.0%) | 0 (0.0%) |
| 5 to 9 Year Old | 273 (76.0%) | 86 (24.0%) |
| 10 to 14 Year Olds | 320 (95.5%) | 15 (4.5%) |
| 15 to 17 Year Olds | 107 (100.0%) | 0 (0.0%) |
| 18 to 19 Year Olds | 46 (100.0%) | 0 (0.0%) |
| 20 to 24 Year Olds | 9 (26.5%) | 25 (73.5%) |
| 25 to 34 Year Olds | 23 (57.5%) | 17 (42.5%) |
| 35 Years and over | 0 (0.0%) | 27 (100.0%) |
| Total | 811 (82.7%) | 170 (17.3%) |
Educational Attainment by Field of Study in Spirit Lake
Education (272 | 18.3%), science & technology (214 | 14.4%), business (204 | 13.7%), bio, nature & agricultural (172 | 11.6%), and arts & humanities (142 | 9.5%) are the most common fields of study among 1,489 individuals in Spirit Lake who have obtained a bachelor's degree or higher.
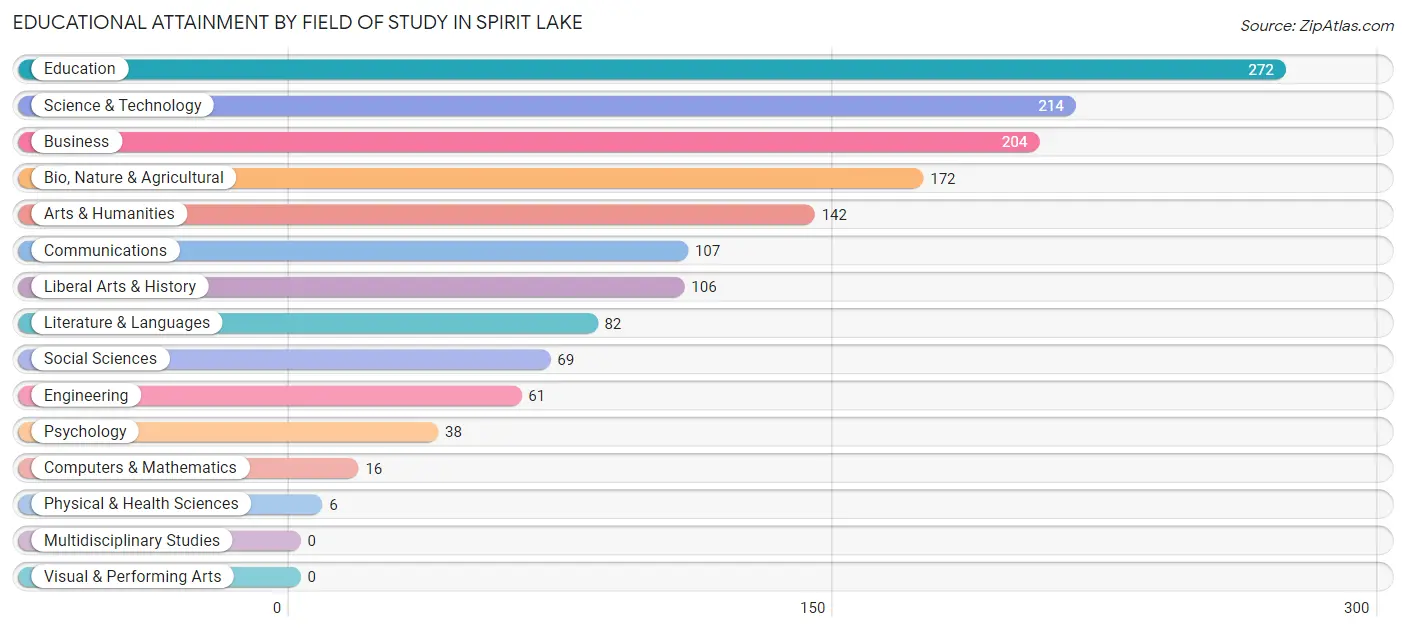
| Field of Study | # Graduates | % Graduates |
| Computers & Mathematics | 16 | 1.1% |
| Bio, Nature & Agricultural | 172 | 11.6% |
| Physical & Health Sciences | 6 | 0.4% |
| Psychology | 38 | 2.5% |
| Social Sciences | 69 | 4.6% |
| Engineering | 61 | 4.1% |
| Multidisciplinary Studies | 0 | 0.0% |
| Science & Technology | 214 | 14.4% |
| Business | 204 | 13.7% |
| Education | 272 | 18.3% |
| Literature & Languages | 82 | 5.5% |
| Liberal Arts & History | 106 | 7.1% |
| Visual & Performing Arts | 0 | 0.0% |
| Communications | 107 | 7.2% |
| Arts & Humanities | 142 | 9.5% |
| Total | 1,489 | 100.0% |
Transportation & Commute in Spirit Lake
Vehicle Availability by Sex in Spirit Lake
The most prevalent vehicle ownership categories in Spirit Lake are males with 2 vehicles (741, accounting for 48.7%) and females with 2 vehicles (692, making up 53.8%).
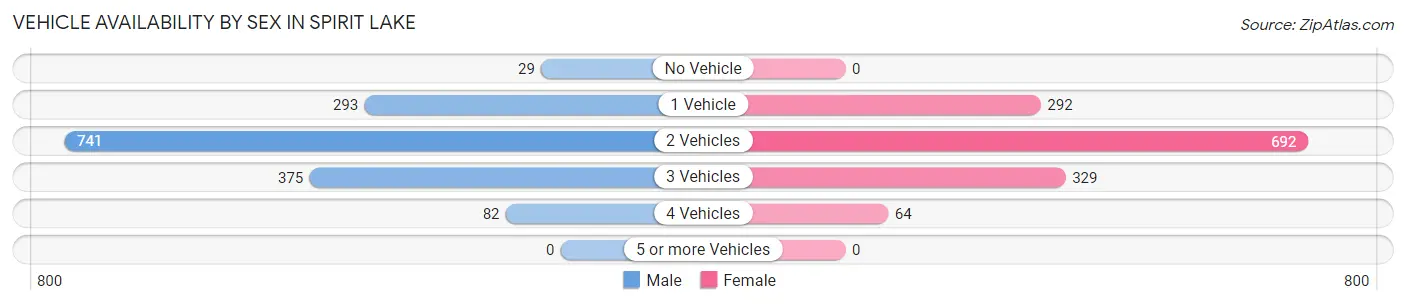
| Vehicles Available | Male | Female |
| No Vehicle | 29 (1.9%) | 0 (0.0%) |
| 1 Vehicle | 293 (19.3%) | 292 (21.2%) |
| 2 Vehicles | 741 (48.7%) | 692 (50.2%) |
| 3 Vehicles | 375 (24.7%) | 329 (23.9%) |
| 4 Vehicles | 82 (5.4%) | 64 (4.6%) |
| 5 or more Vehicles | 0 (0.0%) | 0 (0.0%) |
| Total | 1,520 (100.0%) | 1,377 (100.0%) |
Commute Time in Spirit Lake
The most frequently occuring commute durations in Spirit Lake are 5 to 9 minutes (1,118 commuters, 43.0%), 10 to 14 minutes (305 commuters, 11.7%), and less than 5 minutes (268 commuters, 10.3%).
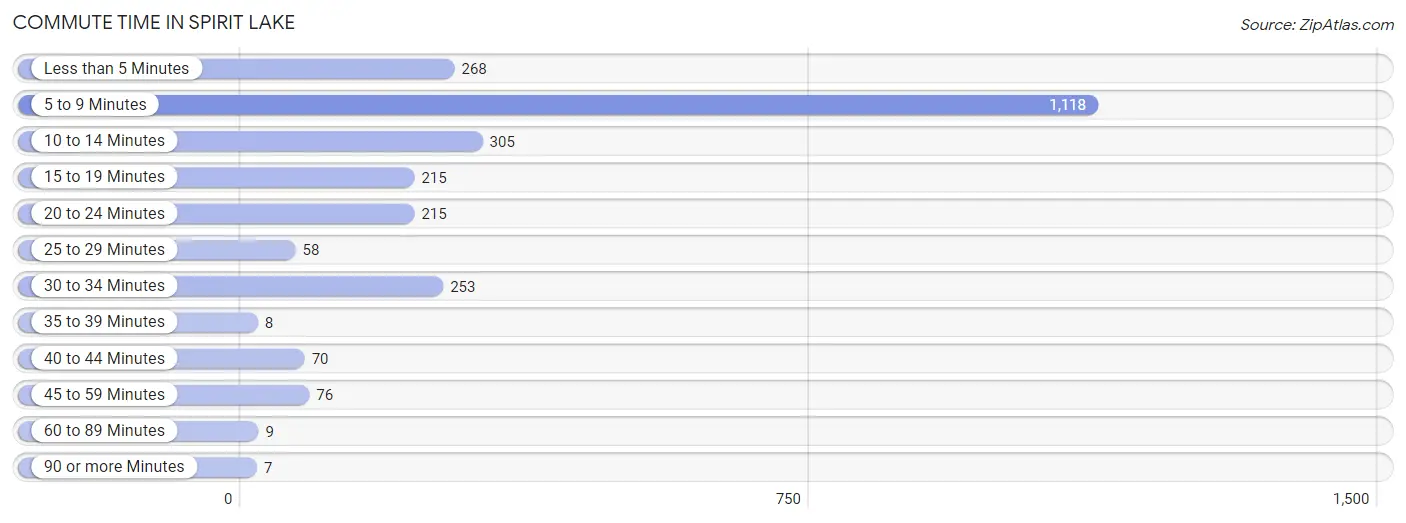
| Commute Time | # Commuters | % Commuters |
| Less than 5 Minutes | 268 | 10.3% |
| 5 to 9 Minutes | 1,118 | 43.0% |
| 10 to 14 Minutes | 305 | 11.7% |
| 15 to 19 Minutes | 215 | 8.3% |
| 20 to 24 Minutes | 215 | 8.3% |
| 25 to 29 Minutes | 58 | 2.2% |
| 30 to 34 Minutes | 253 | 9.7% |
| 35 to 39 Minutes | 8 | 0.3% |
| 40 to 44 Minutes | 70 | 2.7% |
| 45 to 59 Minutes | 76 | 2.9% |
| 60 to 89 Minutes | 9 | 0.4% |
| 90 or more Minutes | 7 | 0.3% |
Commute Time by Sex in Spirit Lake
The most common commute times in Spirit Lake are 5 to 9 minutes (508 commuters, 38.7%) for males and 5 to 9 minutes (610 commuters, 47.3%) for females.
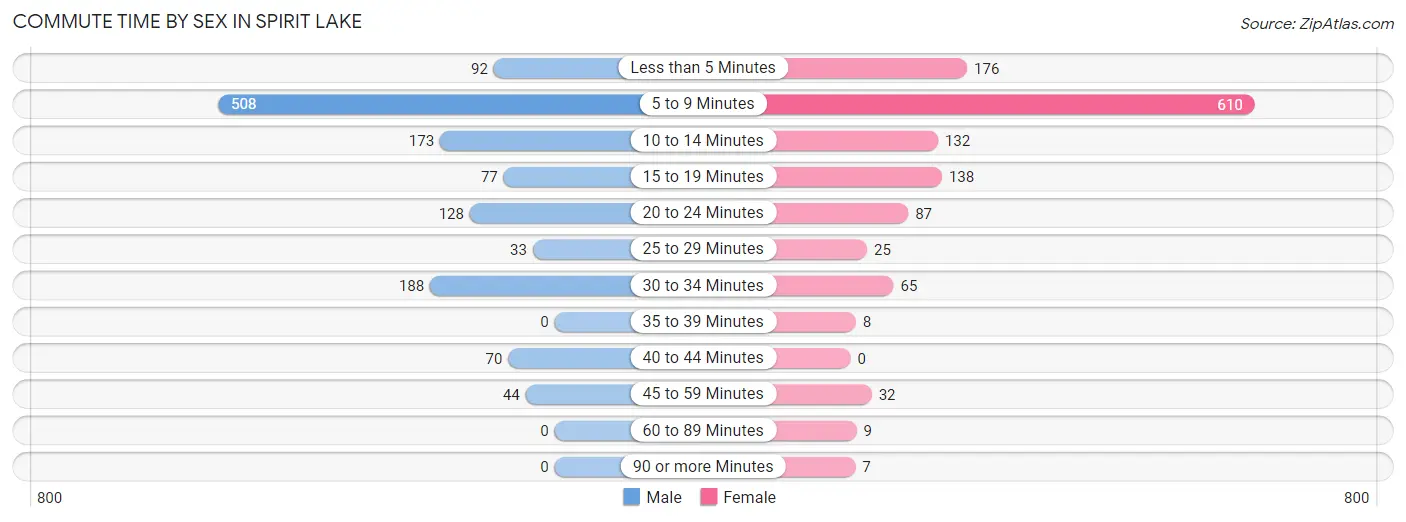
| Commute Time | Male | Female |
| Less than 5 Minutes | 92 (7.0%) | 176 (13.7%) |
| 5 to 9 Minutes | 508 (38.7%) | 610 (47.3%) |
| 10 to 14 Minutes | 173 (13.2%) | 132 (10.2%) |
| 15 to 19 Minutes | 77 (5.9%) | 138 (10.7%) |
| 20 to 24 Minutes | 128 (9.8%) | 87 (6.8%) |
| 25 to 29 Minutes | 33 (2.5%) | 25 (1.9%) |
| 30 to 34 Minutes | 188 (14.3%) | 65 (5.0%) |
| 35 to 39 Minutes | 0 (0.0%) | 8 (0.6%) |
| 40 to 44 Minutes | 70 (5.3%) | 0 (0.0%) |
| 45 to 59 Minutes | 44 (3.4%) | 32 (2.5%) |
| 60 to 89 Minutes | 0 (0.0%) | 9 (0.7%) |
| 90 or more Minutes | 0 (0.0%) | 7 (0.5%) |
Time of Departure to Work by Sex in Spirit Lake
The most frequent times of departure to work in Spirit Lake are 8:00 AM to 8:29 AM (255, 19.4%) for males and 7:30 AM to 7:59 AM (268, 20.8%) for females.
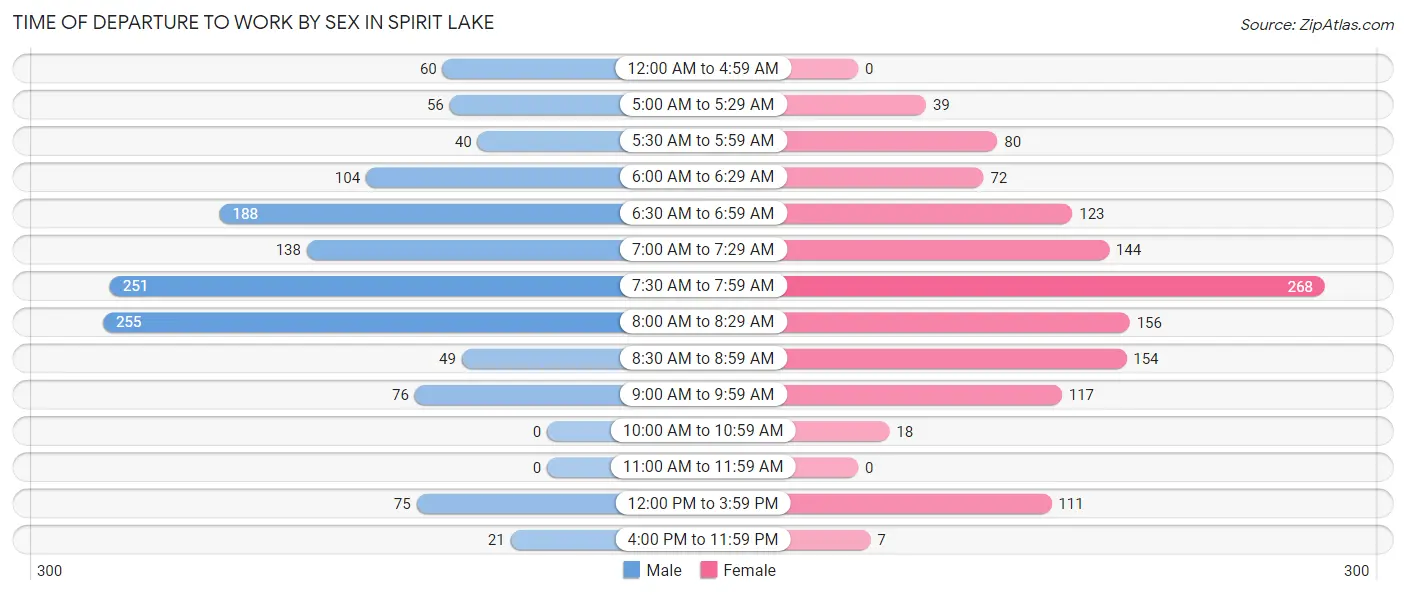
| Time of Departure | Male | Female |
| 12:00 AM to 4:59 AM | 60 (4.6%) | 0 (0.0%) |
| 5:00 AM to 5:29 AM | 56 (4.3%) | 39 (3.0%) |
| 5:30 AM to 5:59 AM | 40 (3.0%) | 80 (6.2%) |
| 6:00 AM to 6:29 AM | 104 (7.9%) | 72 (5.6%) |
| 6:30 AM to 6:59 AM | 188 (14.3%) | 123 (9.5%) |
| 7:00 AM to 7:29 AM | 138 (10.5%) | 144 (11.2%) |
| 7:30 AM to 7:59 AM | 251 (19.1%) | 268 (20.8%) |
| 8:00 AM to 8:29 AM | 255 (19.4%) | 156 (12.1%) |
| 8:30 AM to 8:59 AM | 49 (3.7%) | 154 (11.9%) |
| 9:00 AM to 9:59 AM | 76 (5.8%) | 117 (9.1%) |
| 10:00 AM to 10:59 AM | 0 (0.0%) | 18 (1.4%) |
| 11:00 AM to 11:59 AM | 0 (0.0%) | 0 (0.0%) |
| 12:00 PM to 3:59 PM | 75 (5.7%) | 111 (8.6%) |
| 4:00 PM to 11:59 PM | 21 (1.6%) | 7 (0.5%) |
| Total | 1,313 (100.0%) | 1,289 (100.0%) |
Housing Occupancy in Spirit Lake
Occupancy by Ownership in Spirit Lake
Of the total 2,537 dwellings in Spirit Lake, owner-occupied units account for 1,662 (65.5%), while renter-occupied units make up 875 (34.5%).
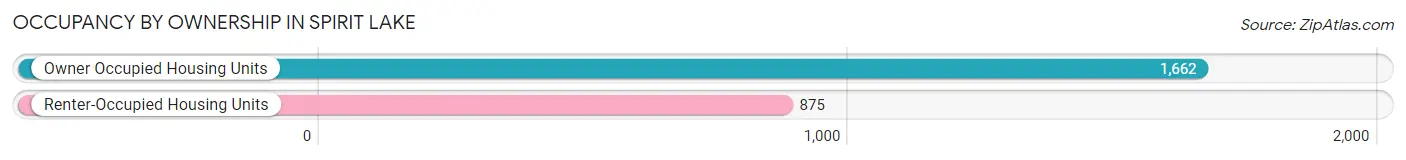
| Occupancy | # Housing Units | % Housing Units |
| Owner Occupied Housing Units | 1,662 | 65.5% |
| Renter-Occupied Housing Units | 875 | 34.5% |
| Total Occupied Housing Units | 2,537 | 100.0% |
Occupancy by Household Size in Spirit Lake
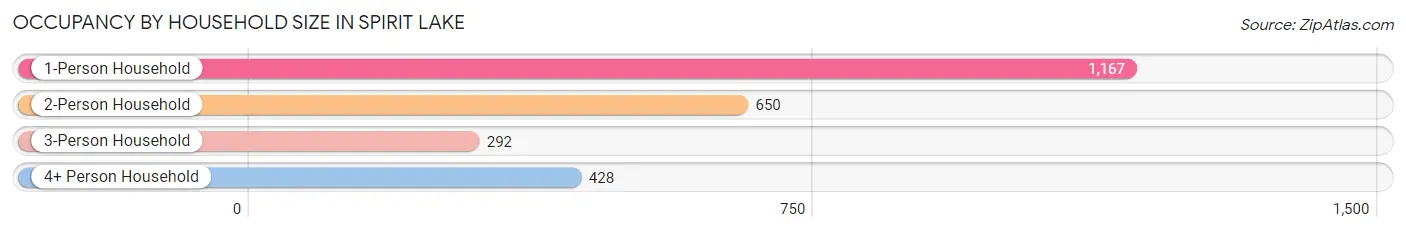
| Household Size | # Housing Units | % Housing Units |
| 1-Person Household | 1,167 | 46.0% |
| 2-Person Household | 650 | 25.6% |
| 3-Person Household | 292 | 11.5% |
| 4+ Person Household | 428 | 16.9% |
| Total Housing Units | 2,537 | 100.0% |
Occupancy by Ownership by Household Size in Spirit Lake
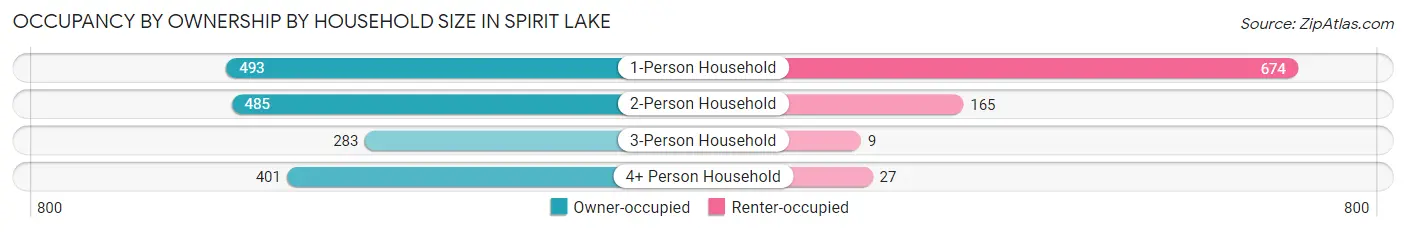
| Household Size | Owner-occupied | Renter-occupied |
| 1-Person Household | 493 (42.2%) | 674 (57.8%) |
| 2-Person Household | 485 (74.6%) | 165 (25.4%) |
| 3-Person Household | 283 (96.9%) | 9 (3.1%) |
| 4+ Person Household | 401 (93.7%) | 27 (6.3%) |
| Total Housing Units | 1,662 (65.5%) | 875 (34.5%) |
Occupancy by Educational Attainment in Spirit Lake
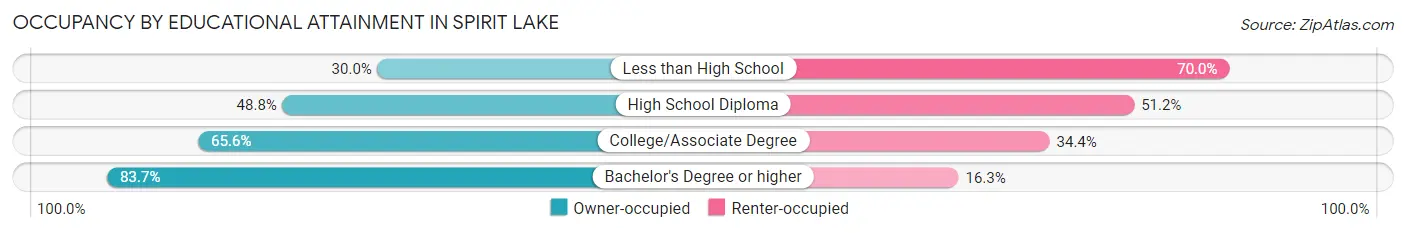
| Household Size | Owner-occupied | Renter-occupied |
| Less than High School | 12 (30.0%) | 28 (70.0%) |
| High School Diploma | 400 (48.8%) | 419 (51.2%) |
| College/Associate Degree | 559 (65.6%) | 293 (34.4%) |
| Bachelor's Degree or higher | 691 (83.7%) | 135 (16.3%) |
Occupancy by Age of Householder in Spirit Lake
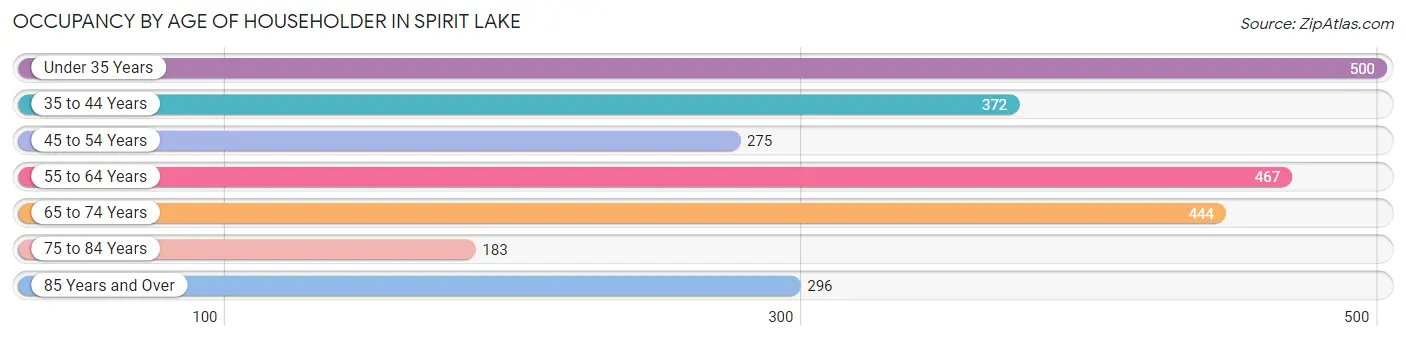
| Age Bracket | # Households | % Households |
| Under 35 Years | 500 | 19.7% |
| 35 to 44 Years | 372 | 14.7% |
| 45 to 54 Years | 275 | 10.8% |
| 55 to 64 Years | 467 | 18.4% |
| 65 to 74 Years | 444 | 17.5% |
| 75 to 84 Years | 183 | 7.2% |
| 85 Years and Over | 296 | 11.7% |
| Total | 2,537 | 100.0% |
Housing Finances in Spirit Lake
Median Income by Occupancy in Spirit Lake
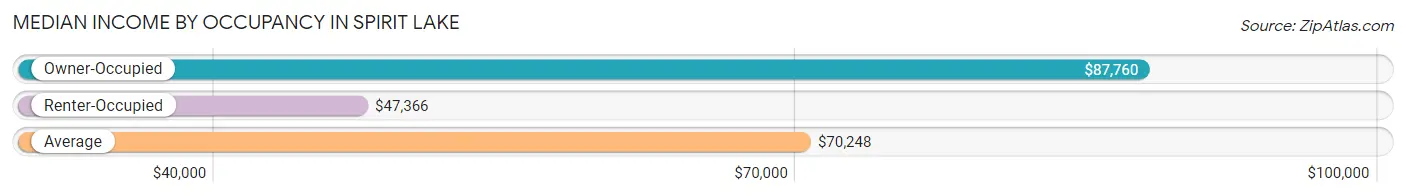
| Occupancy Type | # Households | Median Income |
| Owner-Occupied | 1,662 (65.5%) | $87,760 |
| Renter-Occupied | 875 (34.5%) | $47,366 |
| Average | 2,537 (100.0%) | $70,248 |
Occupancy by Householder Income Bracket in Spirit Lake
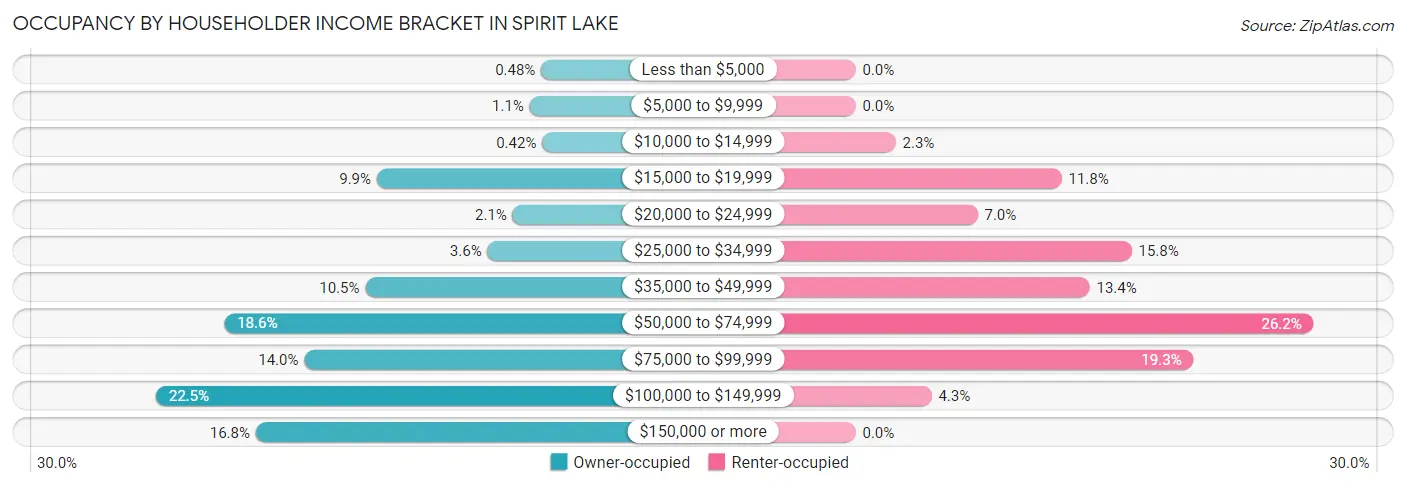
| Income Bracket | Owner-occupied | Renter-occupied |
| Less than $5,000 | 8 (0.5%) | 0 (0.0%) |
| $5,000 to $9,999 | 19 (1.1%) | 0 (0.0%) |
| $10,000 to $14,999 | 7 (0.4%) | 20 (2.3%) |
| $15,000 to $19,999 | 164 (9.9%) | 103 (11.8%) |
| $20,000 to $24,999 | 35 (2.1%) | 61 (7.0%) |
| $25,000 to $34,999 | 59 (3.5%) | 138 (15.8%) |
| $35,000 to $49,999 | 175 (10.5%) | 117 (13.4%) |
| $50,000 to $74,999 | 309 (18.6%) | 229 (26.2%) |
| $75,000 to $99,999 | 233 (14.0%) | 169 (19.3%) |
| $100,000 to $149,999 | 374 (22.5%) | 38 (4.3%) |
| $150,000 or more | 279 (16.8%) | 0 (0.0%) |
| Total | 1,662 (100.0%) | 875 (100.0%) |
Monthly Housing Cost Tiers in Spirit Lake
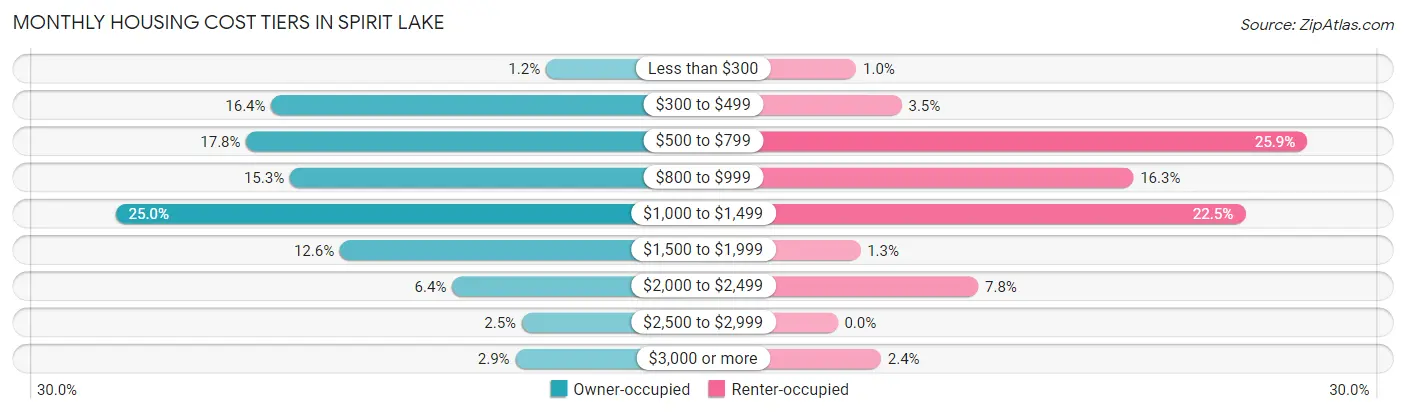
| Monthly Cost | Owner-occupied | Renter-occupied |
| Less than $300 | 20 (1.2%) | 9 (1.0%) |
| $300 to $499 | 272 (16.4%) | 31 (3.5%) |
| $500 to $799 | 295 (17.7%) | 227 (25.9%) |
| $800 to $999 | 255 (15.3%) | 143 (16.3%) |
| $1,000 to $1,499 | 415 (25.0%) | 197 (22.5%) |
| $1,500 to $1,999 | 209 (12.6%) | 11 (1.3%) |
| $2,000 to $2,499 | 106 (6.4%) | 68 (7.8%) |
| $2,500 to $2,999 | 42 (2.5%) | 0 (0.0%) |
| $3,000 or more | 48 (2.9%) | 21 (2.4%) |
| Total | 1,662 (100.0%) | 875 (100.0%) |
Physical Housing Characteristics in Spirit Lake
Housing Structures in Spirit Lake
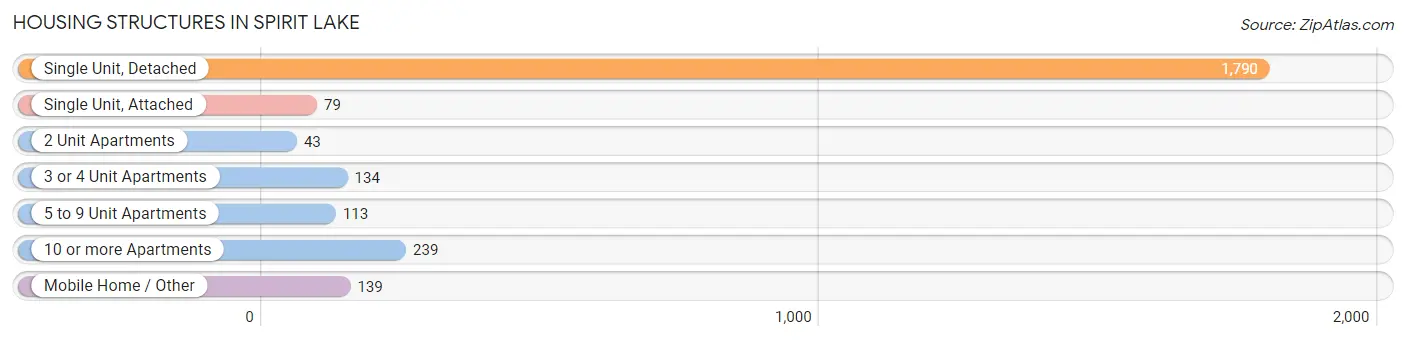
| Structure Type | # Housing Units | % Housing Units |
| Single Unit, Detached | 1,790 | 70.6% |
| Single Unit, Attached | 79 | 3.1% |
| 2 Unit Apartments | 43 | 1.7% |
| 3 or 4 Unit Apartments | 134 | 5.3% |
| 5 to 9 Unit Apartments | 113 | 4.4% |
| 10 or more Apartments | 239 | 9.4% |
| Mobile Home / Other | 139 | 5.5% |
| Total | 2,537 | 100.0% |
Housing Structures by Occupancy in Spirit Lake
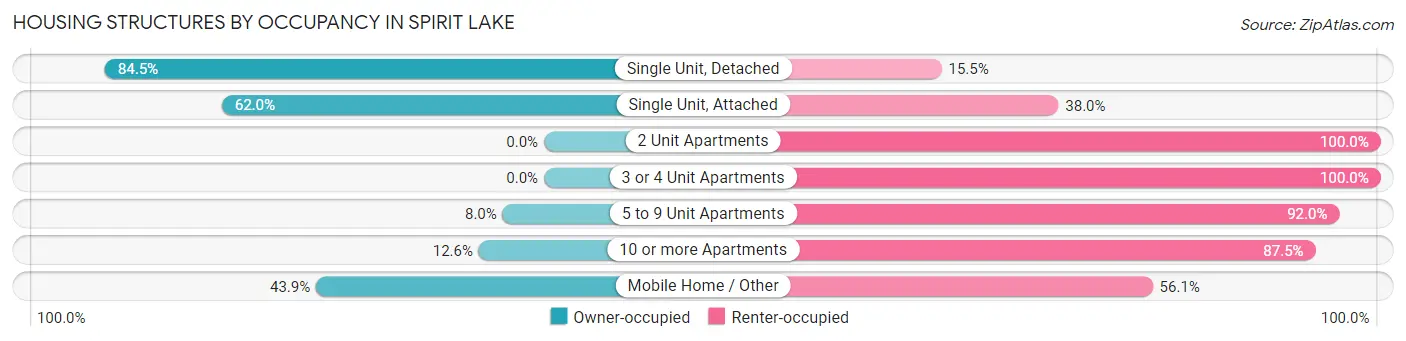
| Structure Type | Owner-occupied | Renter-occupied |
| Single Unit, Detached | 1,513 (84.5%) | 277 (15.5%) |
| Single Unit, Attached | 49 (62.0%) | 30 (38.0%) |
| 2 Unit Apartments | 0 (0.0%) | 43 (100.0%) |
| 3 or 4 Unit Apartments | 0 (0.0%) | 134 (100.0%) |
| 5 to 9 Unit Apartments | 9 (8.0%) | 104 (92.0%) |
| 10 or more Apartments | 30 (12.6%) | 209 (87.5%) |
| Mobile Home / Other | 61 (43.9%) | 78 (56.1%) |
| Total | 1,662 (65.5%) | 875 (34.5%) |
Housing Structures by Number of Rooms in Spirit Lake
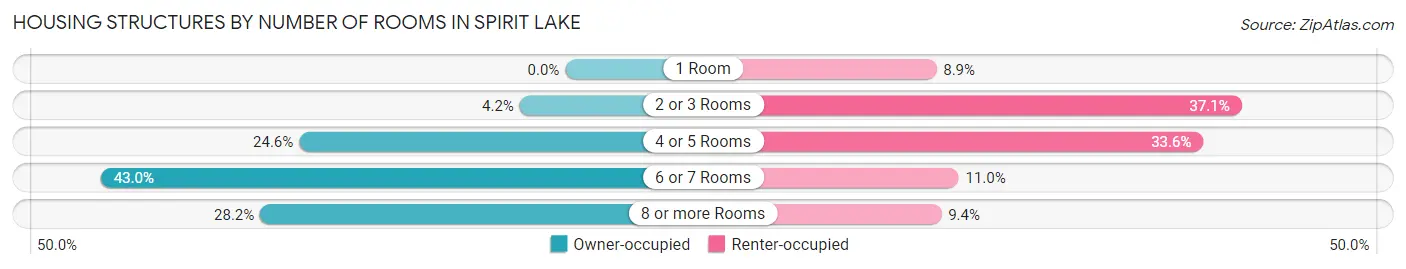
| Number of Rooms | Owner-occupied | Renter-occupied |
| 1 Room | 0 (0.0%) | 78 (8.9%) |
| 2 or 3 Rooms | 70 (4.2%) | 325 (37.1%) |
| 4 or 5 Rooms | 409 (24.6%) | 294 (33.6%) |
| 6 or 7 Rooms | 714 (43.0%) | 96 (11.0%) |
| 8 or more Rooms | 469 (28.2%) | 82 (9.4%) |
| Total | 1,662 (100.0%) | 875 (100.0%) |
Housing Structure by Heating Type in Spirit Lake
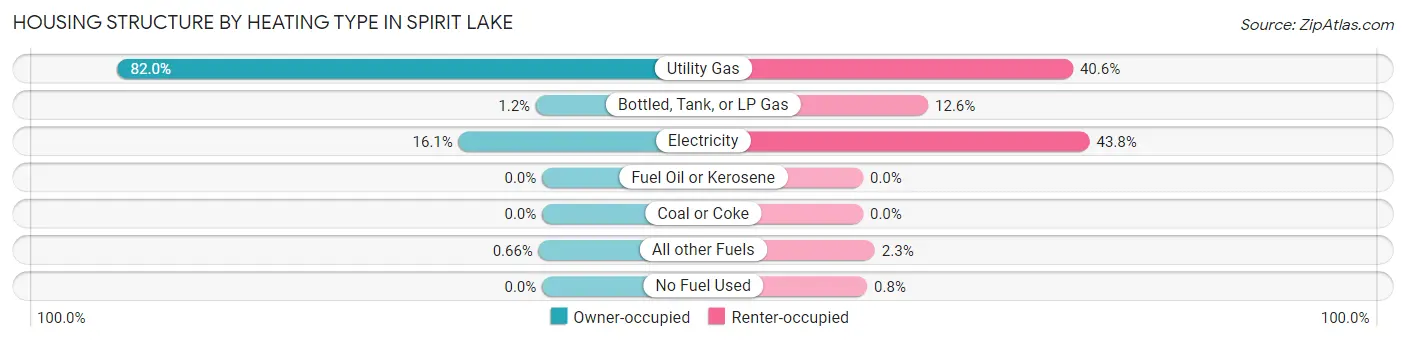
| Heating Type | Owner-occupied | Renter-occupied |
| Utility Gas | 1,363 (82.0%) | 355 (40.6%) |
| Bottled, Tank, or LP Gas | 20 (1.2%) | 110 (12.6%) |
| Electricity | 268 (16.1%) | 383 (43.8%) |
| Fuel Oil or Kerosene | 0 (0.0%) | 0 (0.0%) |
| Coal or Coke | 0 (0.0%) | 0 (0.0%) |
| All other Fuels | 11 (0.7%) | 20 (2.3%) |
| No Fuel Used | 0 (0.0%) | 7 (0.8%) |
| Total | 1,662 (100.0%) | 875 (100.0%) |
Household Vehicle Usage in Spirit Lake
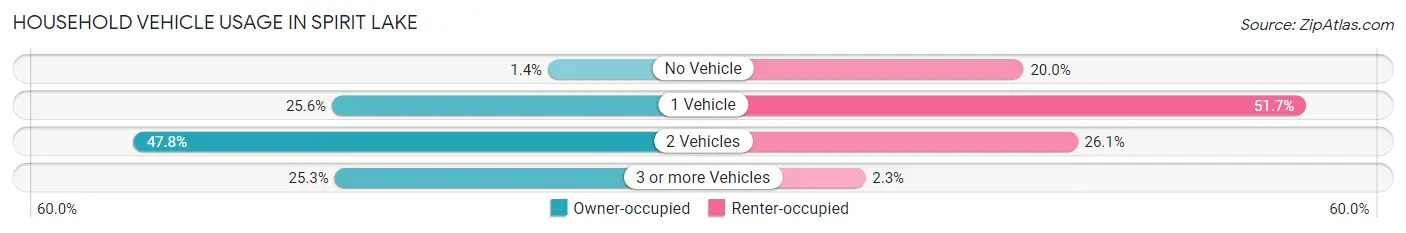
| Vehicles per Household | Owner-occupied | Renter-occupied |
| No Vehicle | 23 (1.4%) | 175 (20.0%) |
| 1 Vehicle | 425 (25.6%) | 452 (51.7%) |
| 2 Vehicles | 794 (47.8%) | 228 (26.1%) |
| 3 or more Vehicles | 420 (25.3%) | 20 (2.3%) |
| Total | 1,662 (100.0%) | 875 (100.0%) |
Real Estate & Mortgages in Spirit Lake
Real Estate and Mortgage Overview in Spirit Lake
| Characteristic | Without Mortgage | With Mortgage |
| Housing Units | 572 | 1,090 |
| Median Property Value | $177,300 | $214,200 |
| Median Household Income | $59,333 | $255 |
| Monthly Housing Costs | $496 | $48 |
| Real Estate Taxes | $2,125 | $3 |
Property Value by Mortgage Status in Spirit Lake
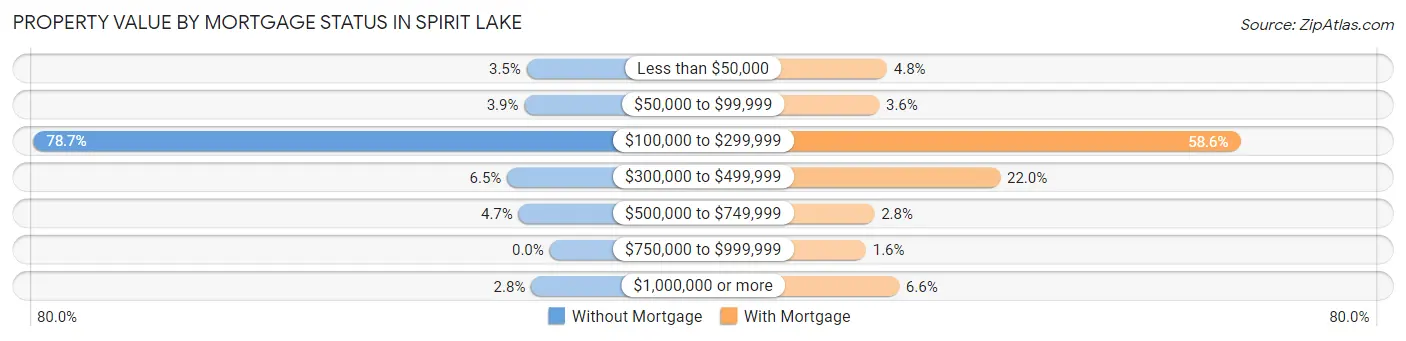
| Property Value | Without Mortgage | With Mortgage |
| Less than $50,000 | 20 (3.5%) | 52 (4.8%) |
| $50,000 to $99,999 | 22 (3.8%) | 39 (3.6%) |
| $100,000 to $299,999 | 450 (78.7%) | 639 (58.6%) |
| $300,000 to $499,999 | 37 (6.5%) | 240 (22.0%) |
| $500,000 to $749,999 | 27 (4.7%) | 31 (2.8%) |
| $750,000 to $999,999 | 0 (0.0%) | 17 (1.6%) |
| $1,000,000 or more | 16 (2.8%) | 72 (6.6%) |
| Total | 572 (100.0%) | 1,090 (100.0%) |
Household Income by Mortgage Status in Spirit Lake
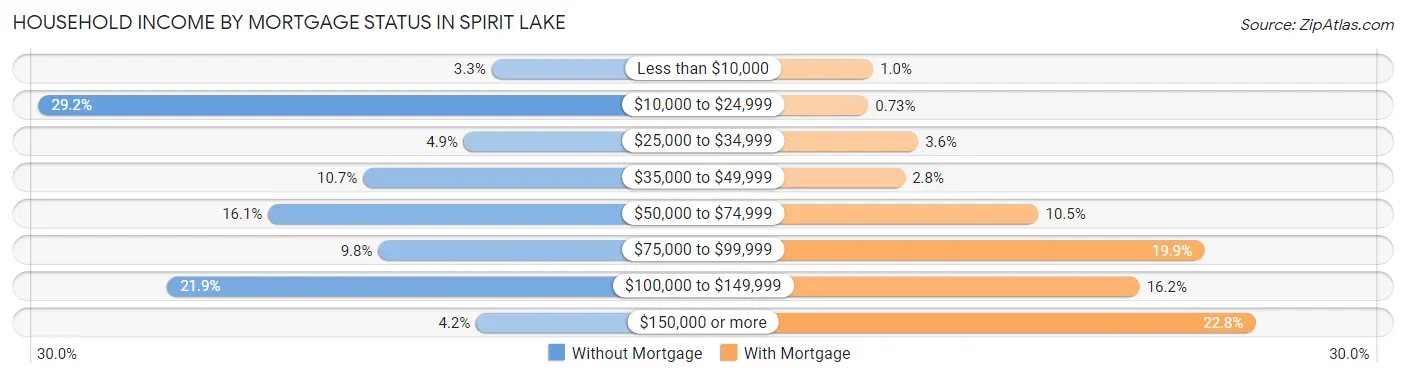
| Household Income | Without Mortgage | With Mortgage |
| Less than $10,000 | 19 (3.3%) | 11 (1.0%) |
| $10,000 to $24,999 | 167 (29.2%) | 8 (0.7%) |
| $25,000 to $34,999 | 28 (4.9%) | 39 (3.6%) |
| $35,000 to $49,999 | 61 (10.7%) | 31 (2.8%) |
| $50,000 to $74,999 | 92 (16.1%) | 114 (10.5%) |
| $75,000 to $99,999 | 56 (9.8%) | 217 (19.9%) |
| $100,000 to $149,999 | 125 (21.8%) | 177 (16.2%) |
| $150,000 or more | 24 (4.2%) | 249 (22.8%) |
| Total | 572 (100.0%) | 1,090 (100.0%) |
Property Value to Household Income Ratio in Spirit Lake
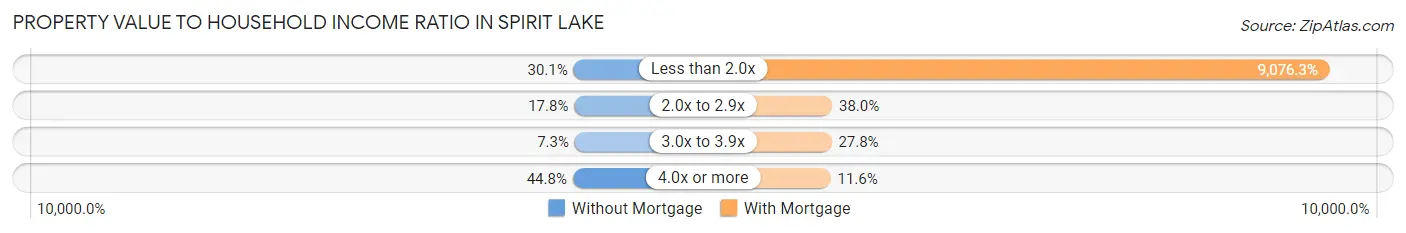
| Value-to-Income Ratio | Without Mortgage | With Mortgage |
| Less than 2.0x | 172 (30.1%) | 98,932 (9,076.3%) |
| 2.0x to 2.9x | 102 (17.8%) | 414 (38.0%) |
| 3.0x to 3.9x | 42 (7.3%) | 303 (27.8%) |
| 4.0x or more | 256 (44.8%) | 126 (11.6%) |
| Total | 572 (100.0%) | 1,090 (100.0%) |
Real Estate Taxes by Mortgage Status in Spirit Lake
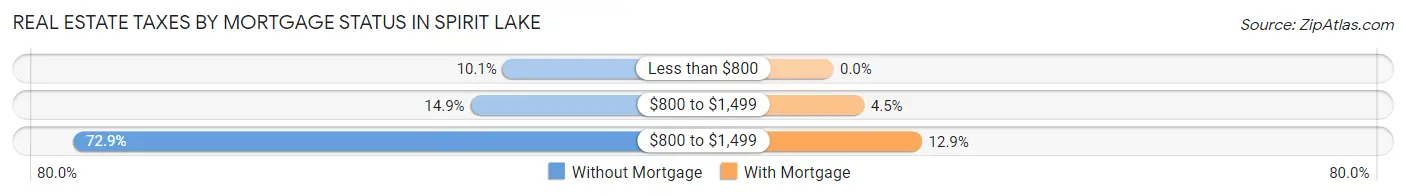
| Property Taxes | Without Mortgage | With Mortgage |
| Less than $800 | 58 (10.1%) | 0 (0.0%) |
| $800 to $1,499 | 85 (14.9%) | 49 (4.5%) |
| $800 to $1,499 | 417 (72.9%) | 141 (12.9%) |
| Total | 572 (100.0%) | 1,090 (100.0%) |
Health & Disability in Spirit Lake
Health Insurance Coverage by Age in Spirit Lake
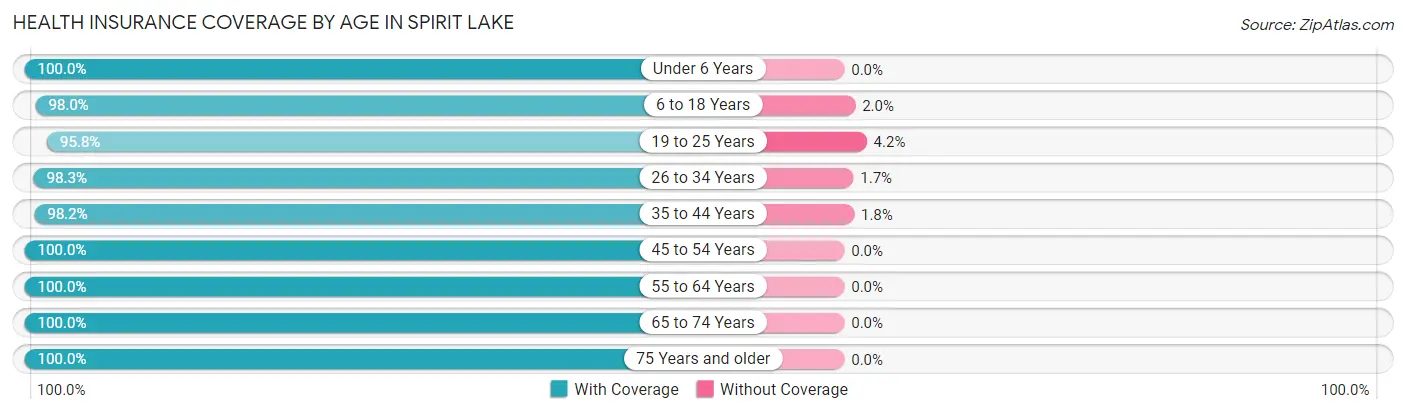
| Age Bracket | With Coverage | Without Coverage |
| Under 6 Years | 370 (100.0%) | 0 (0.0%) |
| 6 to 18 Years | 821 (98.0%) | 17 (2.0%) |
| 19 to 25 Years | 528 (95.8%) | 23 (4.2%) |
| 26 to 34 Years | 640 (98.3%) | 11 (1.7%) |
| 35 to 44 Years | 592 (98.2%) | 11 (1.8%) |
| 45 to 54 Years | 490 (100.0%) | 0 (0.0%) |
| 55 to 64 Years | 609 (100.0%) | 0 (0.0%) |
| 65 to 74 Years | 651 (100.0%) | 0 (0.0%) |
| 75 Years and older | 533 (100.0%) | 0 (0.0%) |
| Total | 5,234 (98.8%) | 62 (1.2%) |
Health Insurance Coverage by Citizenship Status in Spirit Lake
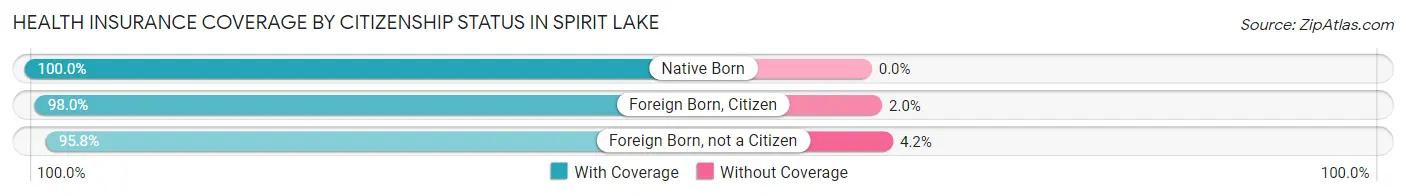
| Citizenship Status | With Coverage | Without Coverage |
| Native Born | 370 (100.0%) | 0 (0.0%) |
| Foreign Born, Citizen | 821 (98.0%) | 17 (2.0%) |
| Foreign Born, not a Citizen | 528 (95.8%) | 23 (4.2%) |
Health Insurance Coverage by Household Income in Spirit Lake
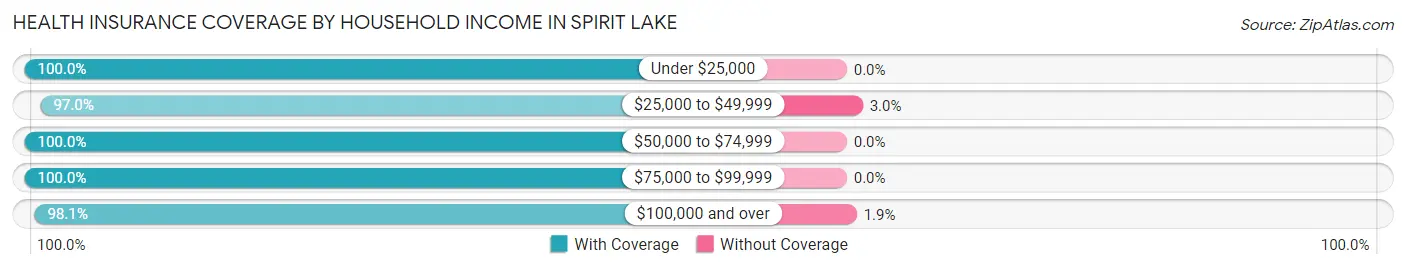
| Household Income | With Coverage | Without Coverage |
| Under $25,000 | 508 (100.0%) | 0 (0.0%) |
| $25,000 to $49,999 | 748 (97.0%) | 23 (3.0%) |
| $50,000 to $74,999 | 1,089 (100.0%) | 0 (0.0%) |
| $75,000 to $99,999 | 809 (100.0%) | 0 (0.0%) |
| $100,000 and over | 2,057 (98.1%) | 39 (1.9%) |
Public vs Private Health Insurance Coverage by Age in Spirit Lake
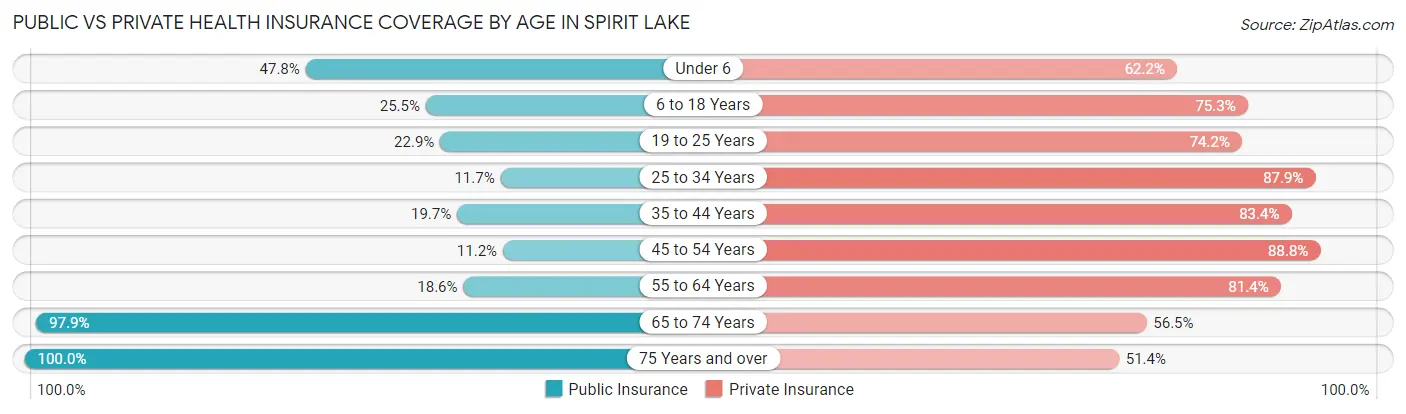
| Age Bracket | Public Insurance | Private Insurance |
| Under 6 | 177 (47.8%) | 230 (62.2%) |
| 6 to 18 Years | 214 (25.5%) | 631 (75.3%) |
| 19 to 25 Years | 126 (22.9%) | 409 (74.2%) |
| 25 to 34 Years | 76 (11.7%) | 572 (87.9%) |
| 35 to 44 Years | 119 (19.7%) | 503 (83.4%) |
| 45 to 54 Years | 55 (11.2%) | 435 (88.8%) |
| 55 to 64 Years | 113 (18.6%) | 496 (81.4%) |
| 65 to 74 Years | 637 (97.9%) | 368 (56.5%) |
| 75 Years and over | 533 (100.0%) | 274 (51.4%) |
| Total | 2,050 (38.7%) | 3,918 (74.0%) |
Disability Status by Sex by Age in Spirit Lake
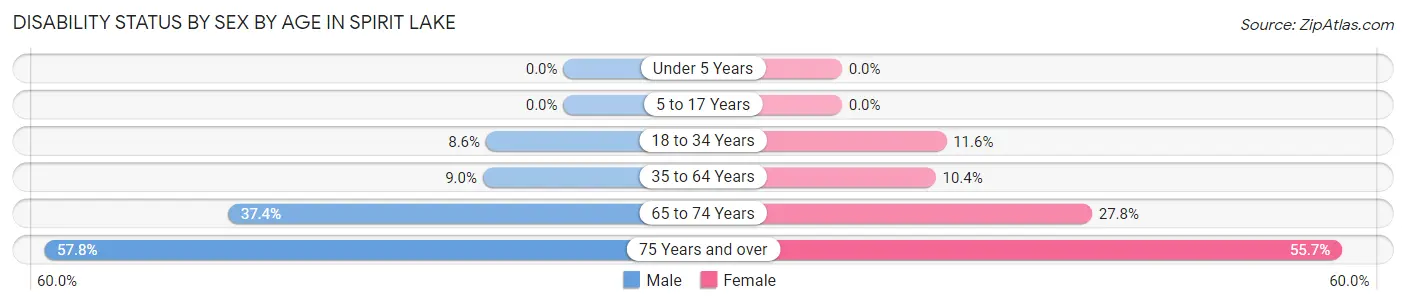
| Age Bracket | Male | Female |
| Under 5 Years | 0 (0.0%) | 0 (0.0%) |
| 5 to 17 Years | 0 (0.0%) | 0 (0.0%) |
| 18 to 34 Years | 51 (8.6%) | 75 (11.6%) |
| 35 to 64 Years | 84 (9.0%) | 80 (10.4%) |
| 65 to 74 Years | 105 (37.4%) | 103 (27.8%) |
| 75 Years and over | 85 (57.8%) | 215 (55.7%) |
Disability Class by Sex by Age in Spirit Lake
Disability Class: Hearing Difficulty
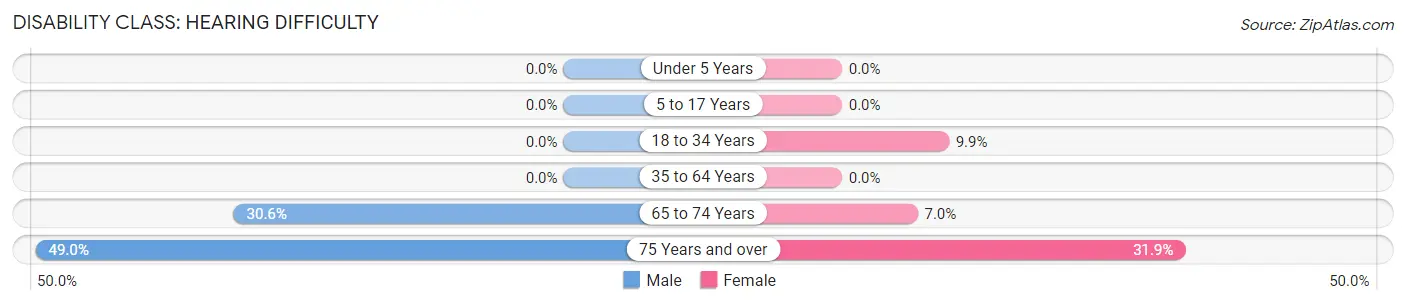
| Age Bracket | Male | Female |
| Under 5 Years | 0 (0.0%) | 0 (0.0%) |
| 5 to 17 Years | 0 (0.0%) | 0 (0.0%) |
| 18 to 34 Years | 0 (0.0%) | 64 (9.9%) |
| 35 to 64 Years | 0 (0.0%) | 0 (0.0%) |
| 65 to 74 Years | 86 (30.6%) | 26 (7.0%) |
| 75 Years and over | 72 (49.0%) | 123 (31.9%) |
Disability Class: Vision Difficulty
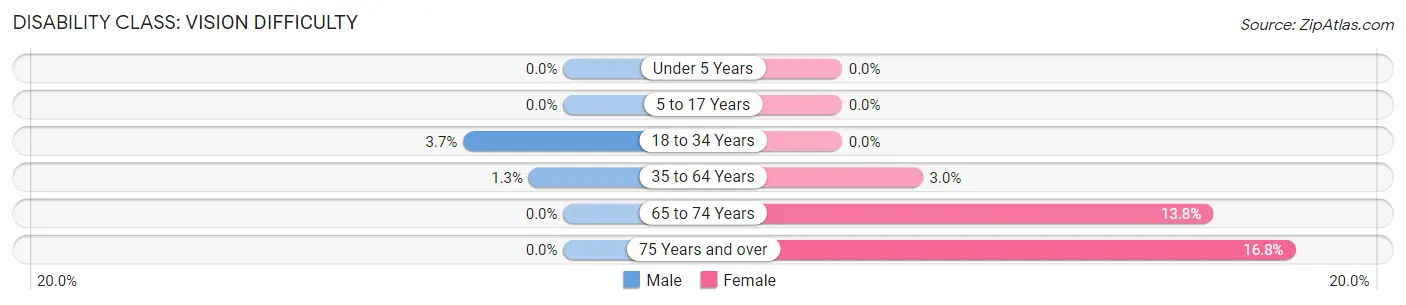
| Age Bracket | Male | Female |
| Under 5 Years | 0 (0.0%) | 0 (0.0%) |
| 5 to 17 Years | 0 (0.0%) | 0 (0.0%) |
| 18 to 34 Years | 22 (3.7%) | 0 (0.0%) |
| 35 to 64 Years | 12 (1.3%) | 23 (3.0%) |
| 65 to 74 Years | 0 (0.0%) | 51 (13.8%) |
| 75 Years and over | 0 (0.0%) | 65 (16.8%) |
Disability Class: Cognitive Difficulty
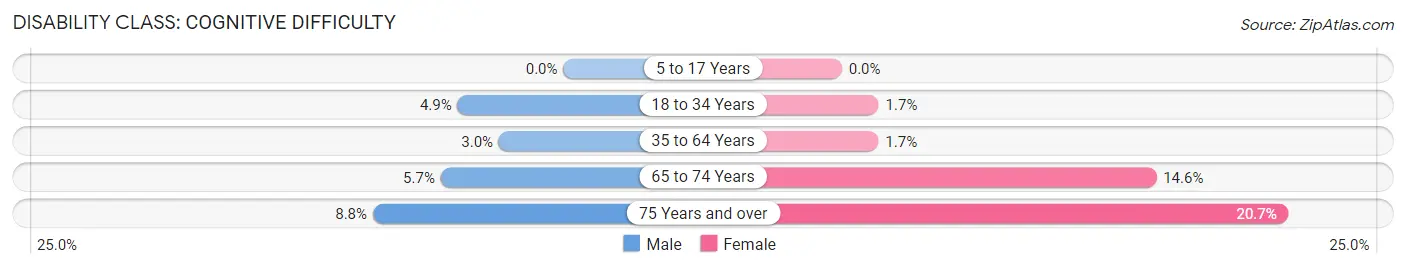
| Age Bracket | Male | Female |
| 5 to 17 Years | 0 (0.0%) | 0 (0.0%) |
| 18 to 34 Years | 29 (4.9%) | 11 (1.7%) |
| 35 to 64 Years | 28 (3.0%) | 13 (1.7%) |
| 65 to 74 Years | 16 (5.7%) | 54 (14.6%) |
| 75 Years and over | 13 (8.8%) | 80 (20.7%) |
Disability Class: Ambulatory Difficulty
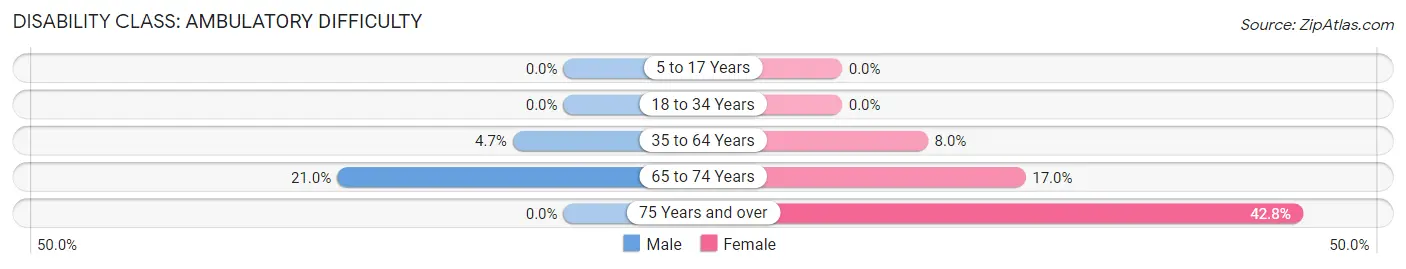
| Age Bracket | Male | Female |
| 5 to 17 Years | 0 (0.0%) | 0 (0.0%) |
| 18 to 34 Years | 0 (0.0%) | 0 (0.0%) |
| 35 to 64 Years | 44 (4.7%) | 61 (8.0%) |
| 65 to 74 Years | 59 (21.0%) | 63 (17.0%) |
| 75 Years and over | 0 (0.0%) | 165 (42.7%) |
Disability Class: Self-Care Difficulty
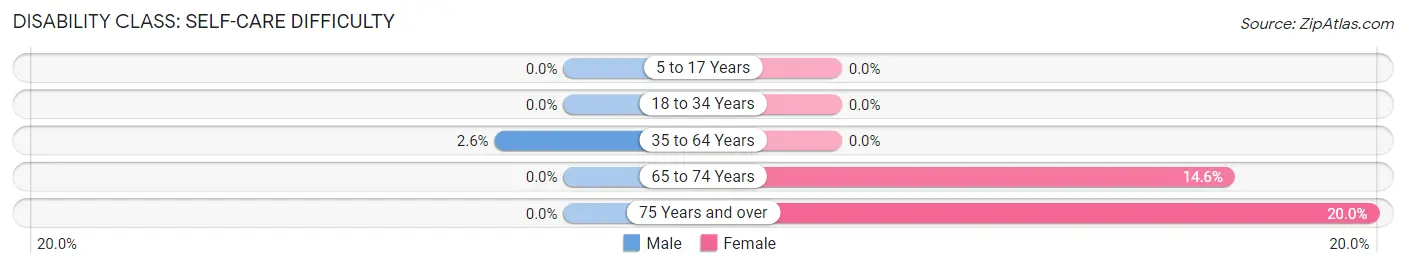
| Age Bracket | Male | Female |
| 5 to 17 Years | 0 (0.0%) | 0 (0.0%) |
| 18 to 34 Years | 0 (0.0%) | 0 (0.0%) |
| 35 to 64 Years | 24 (2.6%) | 0 (0.0%) |
| 65 to 74 Years | 0 (0.0%) | 54 (14.6%) |
| 75 Years and over | 0 (0.0%) | 77 (20.0%) |
Technology Access in Spirit Lake
Computing Device Access in Spirit Lake
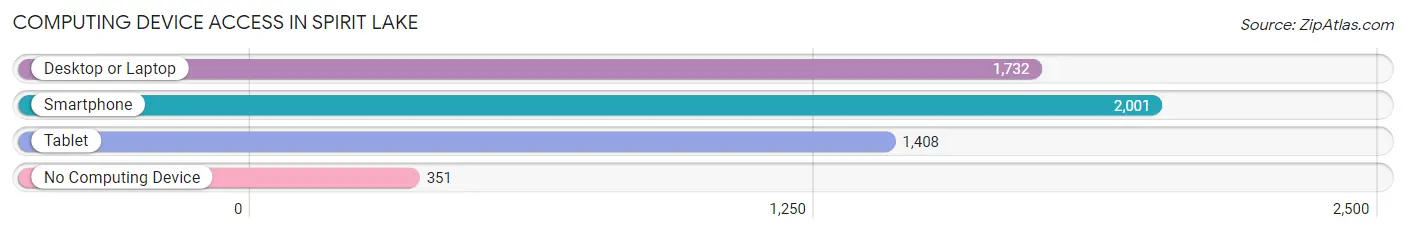
| Device Type | # Households | % Households |
| Desktop or Laptop | 1,732 | 68.3% |
| Smartphone | 2,001 | 78.9% |
| Tablet | 1,408 | 55.5% |
| No Computing Device | 351 | 13.8% |
| Total | 2,537 | 100.0% |
Internet Access in Spirit Lake
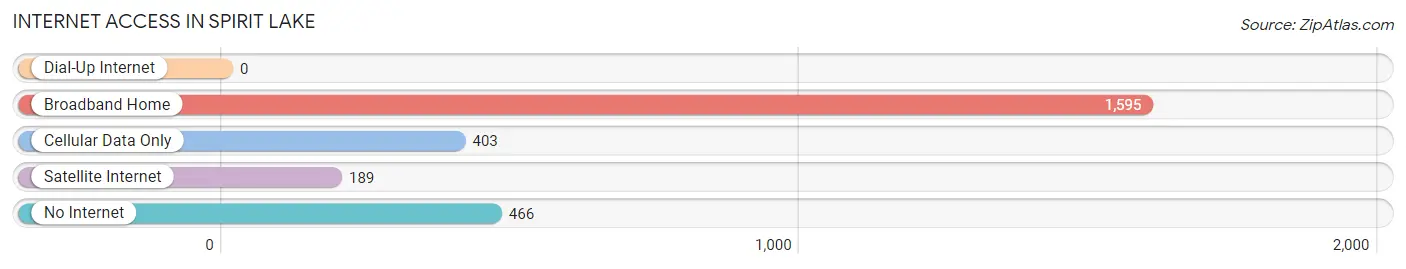
| Internet Type | # Households | % Households |
| Dial-Up Internet | 0 | 0.0% |
| Broadband Home | 1,595 | 62.9% |
| Cellular Data Only | 403 | 15.9% |
| Satellite Internet | 189 | 7.4% |
| No Internet | 466 | 18.4% |
| Total | 2,537 | 100.0% |
Spirit Lake Summary
History
Spirit Lake is a city located in Dickinson County, Iowa. It is situated on the east shore of West Okoboji Lake, one of the Iowa Great Lakes. The city was founded in 1856 by a group of settlers from New York and Wisconsin. The city was originally named Okoboji, but was later changed to Spirit Lake in 1873.
The city was originally a small farming community, but in the late 19th century, it began to develop into a resort town. The first hotel was built in 1877, and the first boardwalk was constructed in 1883. The city was incorporated in 1891.
In the early 20th century, Spirit Lake became a popular tourist destination. The city was home to several amusement parks, including the Okoboji Amusement Park, which opened in 1906. The park featured a roller coaster, a ferris wheel, and a carousel.
In the 1950s, the city began to develop into a residential community. The population of Spirit Lake has grown steadily since then, and it now has a population of over 4,000.
Geography
Spirit Lake is located in northwestern Iowa, in Dickinson County. It is situated on the east shore of West Okoboji Lake, one of the Iowa Great Lakes. The city is located about 25 miles north of the Iowa-Minnesota border.
The city has a total area of 4.2 square miles, all of which is land. The terrain is mostly flat, with some rolling hills. The city is located in the Central Lowland region of the United States.
Economy
The economy of Spirit Lake is largely based on tourism. The city is home to several resorts and hotels, as well as several restaurants and bars. The city is also home to several marinas, which offer boat rentals and other services.
The city is also home to several manufacturing companies, including a plastics manufacturer and a metal fabrication company. The city is also home to several retail stores, including a grocery store and several clothing stores.
Demographics
As of the 2010 census, the population of Spirit Lake was 4,072. The racial makeup of the city was 97.2% White, 0.7% African American, 0.3% Native American, 0.3% Asian, 0.1% Pacific Islander, 0.4% from other races, and 0.9% from two or more races. Hispanic or Latino of any race were 1.7% of the population.
The median household income in Spirit Lake was $45,938, and the median family income was $54,844. The per capita income for the city was $22,845. About 8.2% of families and 10.3% of the population were below the poverty line, including 14.2% of those under age 18 and 6.2% of those age 65 or over.
Common Questions
What is Per Capita Income in Spirit Lake?
Per Capita income in Spirit Lake is $39,860.
What is the Median Family Income in Spirit Lake?
Median Family Income in Spirit Lake is $98,346.
What is the Median Household income in Spirit Lake?
Median Household Income in Spirit Lake is $70,248.
What is Income or Wage Gap in Spirit Lake?
Income or Wage Gap in Spirit Lake is 26.5%.
Women in Spirit Lake earn 73.5 cents for every dollar earned by a man.
What is Inequality or Gini Index in Spirit Lake?
Inequality or Gini Index in Spirit Lake is 0.41.
What is the Total Population of Spirit Lake?
Total Population of Spirit Lake is 5,409.
What is the Total Male Population of Spirit Lake?
Total Male Population of Spirit Lake is 2,615.
What is the Total Female Population of Spirit Lake?
Total Female Population of Spirit Lake is 2,794.
What is the Ratio of Males per 100 Females in Spirit Lake?
There are 93.59 Males per 100 Females in Spirit Lake.
What is the Ratio of Females per 100 Males in Spirit Lake?
There are 106.85 Females per 100 Males in Spirit Lake.
What is the Median Population Age in Spirit Lake?
Median Population Age in Spirit Lake is 40.1 Years.
What is the Average Family Size in Spirit Lake
Average Family Size in Spirit Lake is 3.0 People.
What is the Average Household Size in Spirit Lake
Average Household Size in Spirit Lake is 2.1 People.
How Large is the Labor Force in Spirit Lake?
There are 3,006 People in the Labor Forcein in Spirit Lake.
What is the Percentage of People in the Labor Force in Spirit Lake?
69.4% of People are in the Labor Force in Spirit Lake.
What is the Unemployment Rate in Spirit Lake?
Unemployment Rate in Spirit Lake is 1.2%.