Royal, IA Map & Demographics
Royal Map
Royal Overview
$26,466
PER CAPITA INCOME
$74,167
AVG FAMILY INCOME
$57,500
AVG HOUSEHOLD INCOME
46.7%
WAGE / INCOME GAP [ % ]
53.3¢/ $1
WAGE / INCOME GAP [ $ ]
$6,200
FAMILY INCOME DEFICIT
0.29
INEQUALITY / GINI INDEX
510
TOTAL POPULATION
268
MALE POPULATION
242
FEMALE POPULATION
110.74
MALES / 100 FEMALES
90.30
FEMALES / 100 MALES
29.5
MEDIAN AGE
3.2
AVG FAMILY SIZE
2.4
AVG HOUSEHOLD SIZE
282
LABOR FORCE [ PEOPLE ]
73.6%
PERCENT IN LABOR FORCE
3.5%
UNEMPLOYMENT RATE
Royal Zip Codes
Royal Area Codes
Income in Royal
Income Overview in Royal
Per Capita Income in Royal is $26,466, while median incomes of families and households are $74,167 and $57,500 respectively.
| Characteristic | Number | Measure |
| Per Capita Income | 510 | $26,466 |
| Median Family Income | 104 | $74,167 |
| Mean Family Income | 104 | $75,624 |
| Median Household Income | 212 | $57,500 |
| Mean Household Income | 212 | $61,544 |
| Income Deficit | 104 | $6,200 |
| Wage / Income Gap (%) | 510 | 46.75% |
| Wage / Income Gap ($) | 510 | 53.25¢ per $1 |
| Gini / Inequality Index | 510 | 0.29 |
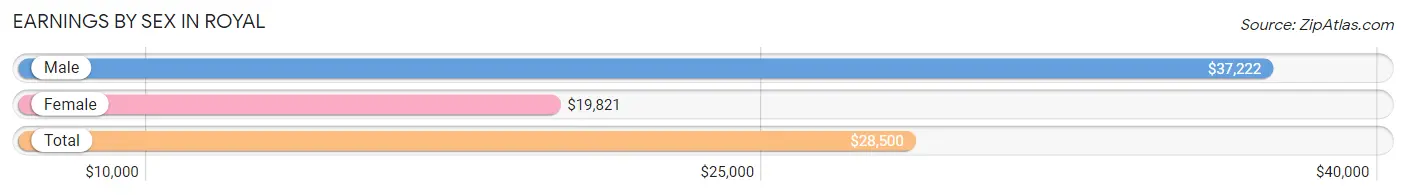
Earnings by Sex in Royal
Average Earnings in Royal are $28,500, $37,222 for men and $19,821 for women, a difference of 46.8%.
| Sex | Number | Average Earnings |
| Male | 178 (60.5%) | $37,222 |
| Female | 116 (39.5%) | $19,821 |
| Total | 294 (100.0%) | $28,500 |
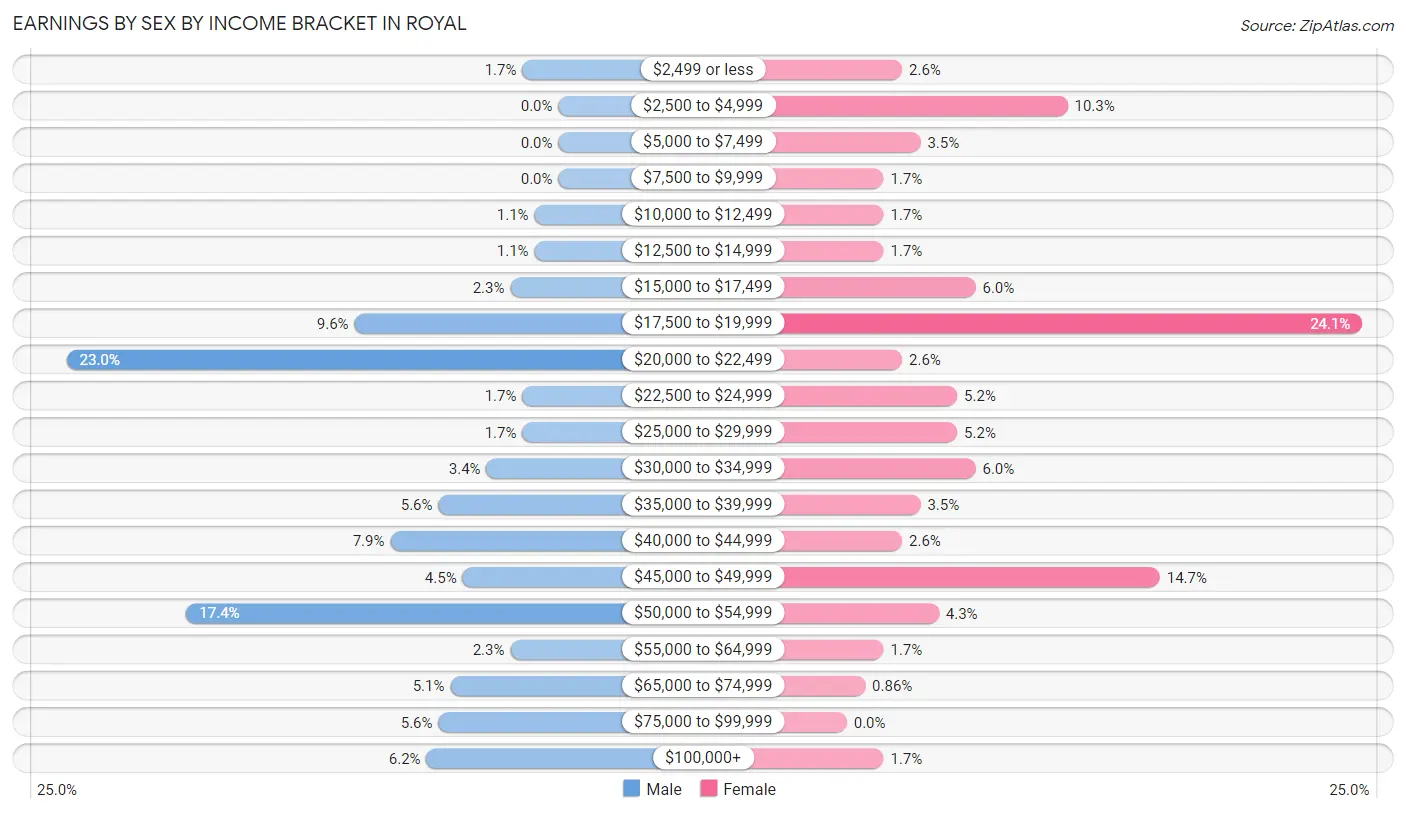
Earnings by Sex by Income Bracket in Royal
The most common earnings brackets in Royal are $20,000 to $22,499 for men (41 | 23.0%) and $17,500 to $19,999 for women (28 | 24.1%).
| Income | Male | Female |
| $2,499 or less | 3 (1.7%) | 3 (2.6%) |
| $2,500 to $4,999 | 0 (0.0%) | 12 (10.3%) |
| $5,000 to $7,499 | 0 (0.0%) | 4 (3.5%) |
| $7,500 to $9,999 | 0 (0.0%) | 2 (1.7%) |
| $10,000 to $12,499 | 2 (1.1%) | 2 (1.7%) |
| $12,500 to $14,999 | 2 (1.1%) | 2 (1.7%) |
| $15,000 to $17,499 | 4 (2.2%) | 7 (6.0%) |
| $17,500 to $19,999 | 17 (9.6%) | 28 (24.1%) |
| $20,000 to $22,499 | 41 (23.0%) | 3 (2.6%) |
| $22,500 to $24,999 | 3 (1.7%) | 6 (5.2%) |
| $25,000 to $29,999 | 3 (1.7%) | 6 (5.2%) |
| $30,000 to $34,999 | 6 (3.4%) | 7 (6.0%) |
| $35,000 to $39,999 | 10 (5.6%) | 4 (3.5%) |
| $40,000 to $44,999 | 14 (7.9%) | 3 (2.6%) |
| $45,000 to $49,999 | 8 (4.5%) | 17 (14.7%) |
| $50,000 to $54,999 | 31 (17.4%) | 5 (4.3%) |
| $55,000 to $64,999 | 4 (2.2%) | 2 (1.7%) |
| $65,000 to $74,999 | 9 (5.1%) | 1 (0.9%) |
| $75,000 to $99,999 | 10 (5.6%) | 0 (0.0%) |
| $100,000+ | 11 (6.2%) | 2 (1.7%) |
| Total | 178 (100.0%) | 116 (100.0%) |
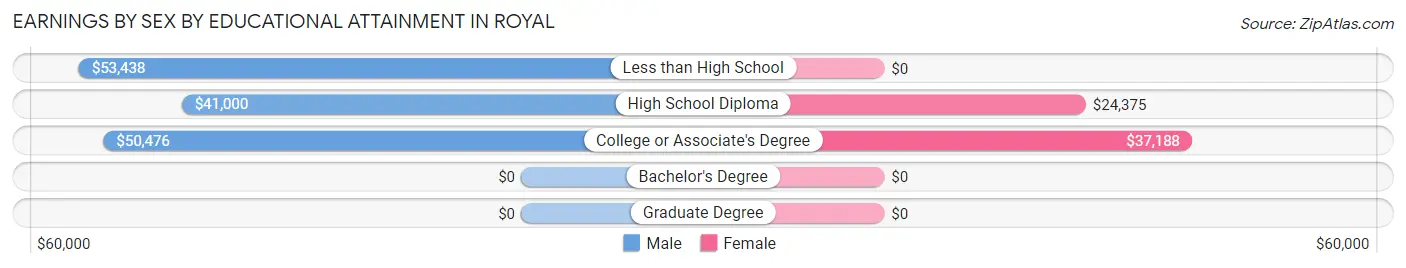
Earnings by Sex by Educational Attainment in Royal
Average earnings in Royal are $50,761 for men and $29,583 for women, a difference of 41.7%. Men with an educational attainment of less than high school enjoy the highest average annual earnings of $53,438, while those with high school diploma education earn the least with $41,000. Women with an educational attainment of college or associate's degree earn the most with the average annual earnings of $37,188, while those with high school diploma education have the smallest earnings of $24,375.
| Educational Attainment | Male Income | Female Income |
| Less than High School | $53,438 | $0 |
| High School Diploma | $41,000 | $24,375 |
| College or Associate's Degree | $50,476 | $37,188 |
| Bachelor's Degree | - | - |
| Graduate Degree | - | - |
| Total | $50,761 | $29,583 |
Family Income in Royal
Family Income Brackets in Royal
According to the Royal family income data, there are 33 families falling into the $50,000 to $74,999 income range, which is the most common income bracket and makes up 31.7% of all families.
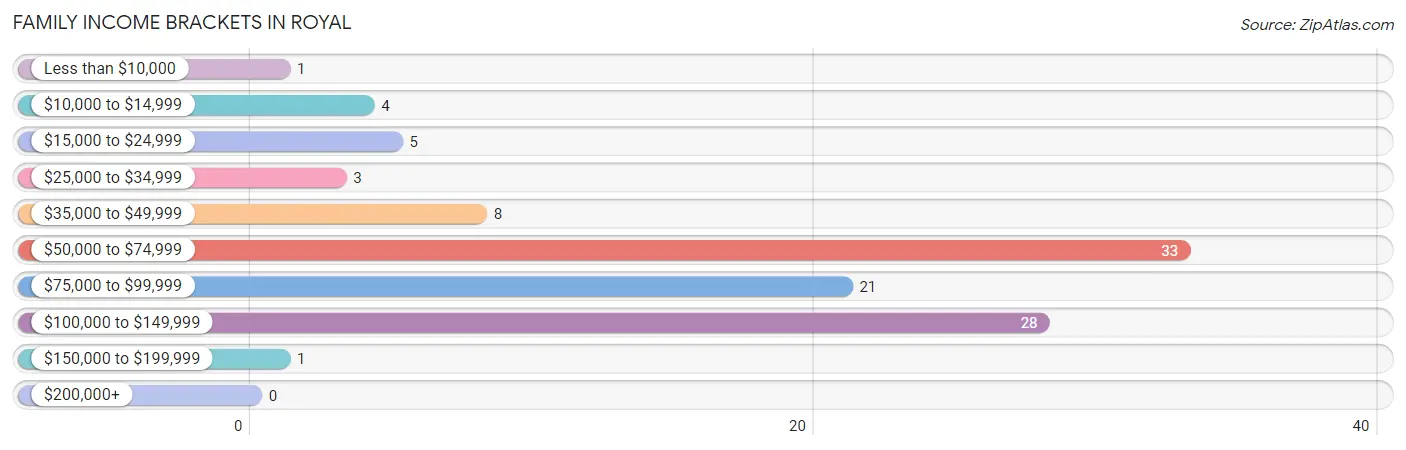
| Income Bracket | # Families | % Families |
| Less than $10,000 | 1 | 1.0% |
| $10,000 to $14,999 | 4 | 3.8% |
| $15,000 to $24,999 | 5 | 4.8% |
| $25,000 to $34,999 | 3 | 2.9% |
| $35,000 to $49,999 | 8 | 7.7% |
| $50,000 to $74,999 | 33 | 31.7% |
| $75,000 to $99,999 | 21 | 20.2% |
| $100,000 to $149,999 | 28 | 26.9% |
| $150,000 to $199,999 | 1 | 1.0% |
| $200,000+ | 0 | 0.0% |
Family Income by Famaliy Size in Royal
4-person families (18 | 17.3%) account for the highest median family income in Royal with $103,000 per family, while 2-person families (61 | 58.7%) have the highest median income of $38,854 per family member.
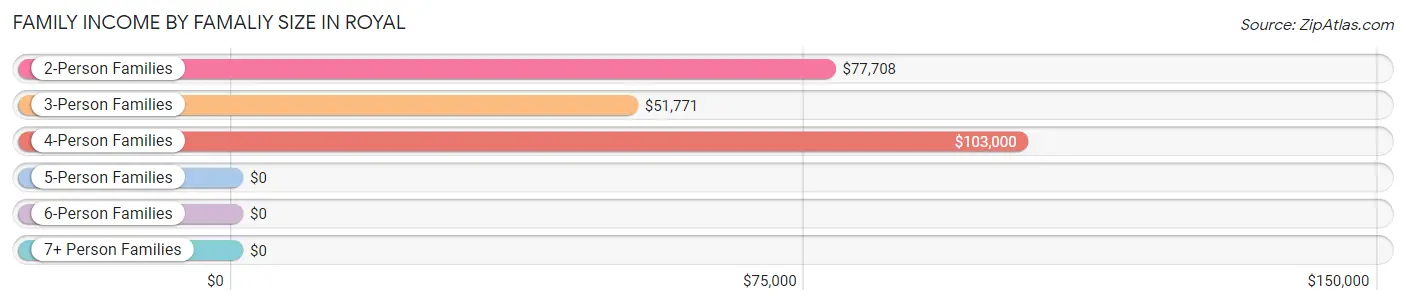
| Income Bracket | # Families | Median Income |
| 2-Person Families | 61 (58.7%) | $77,708 |
| 3-Person Families | 21 (20.2%) | $51,771 |
| 4-Person Families | 18 (17.3%) | $103,000 |
| 5-Person Families | 0 (0.0%) | $0 |
| 6-Person Families | 1 (1.0%) | $0 |
| 7+ Person Families | 3 (2.9%) | $0 |
| Total | 104 (100.0%) | $74,167 |
Family Income by Number of Earners in Royal
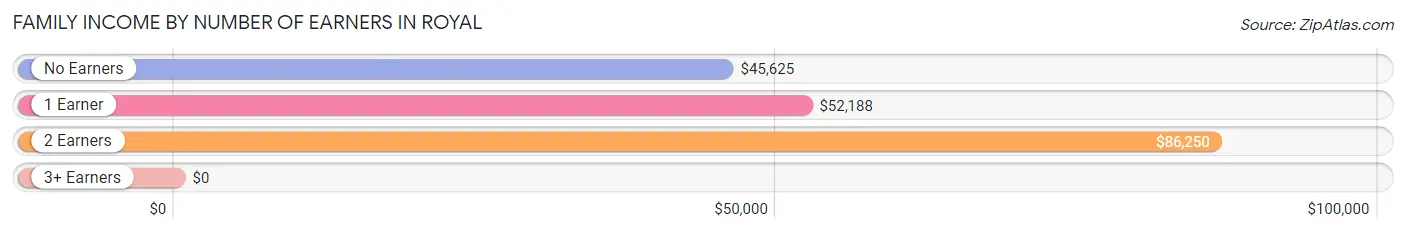
| Number of Earners | # Families | Median Income |
| No Earners | 11 (10.6%) | $45,625 |
| 1 Earner | 49 (47.1%) | $52,188 |
| 2 Earners | 41 (39.4%) | $86,250 |
| 3+ Earners | 3 (2.9%) | $0 |
| Total | 104 (100.0%) | $74,167 |
Household Income in Royal
Household Income Brackets in Royal
With 95 households falling in the category, the $50,000 to $74,999 income range is the most frequent in Royal, accounting for 44.8% of all households.
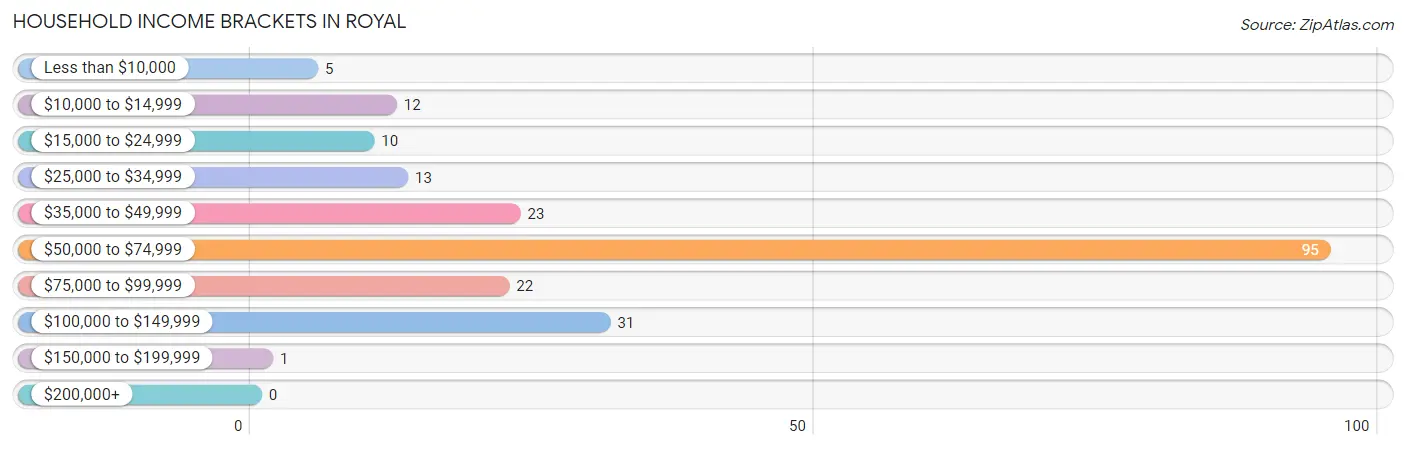
| Income Bracket | # Households | % Households |
| Less than $10,000 | 5 | 2.4% |
| $10,000 to $14,999 | 12 | 5.7% |
| $15,000 to $24,999 | 10 | 4.7% |
| $25,000 to $34,999 | 13 | 6.1% |
| $35,000 to $49,999 | 23 | 10.8% |
| $50,000 to $74,999 | 95 | 44.8% |
| $75,000 to $99,999 | 22 | 10.4% |
| $100,000 to $149,999 | 31 | 14.6% |
| $150,000 to $199,999 | 1 | 0.5% |
| $200,000+ | 0 | 0.0% |
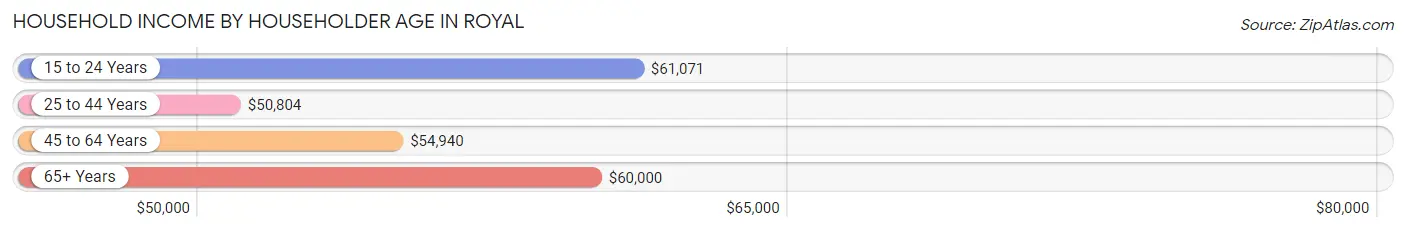
Household Income by Householder Age in Royal
The median household income in Royal is $57,500, with the highest median household income of $61,071 found in the 15 to 24 years age bracket for the primary householder. A total of 32 households (15.1%) fall into this category. Meanwhile, the 25 to 44 years age bracket for the primary householder has the lowest median household income of $50,804, with 63 households (29.7%) in this group.
| Income Bracket | # Households | Median Income |
| 15 to 24 Years | 32 (15.1%) | $61,071 |
| 25 to 44 Years | 63 (29.7%) | $50,804 |
| 45 to 64 Years | 65 (30.7%) | $54,940 |
| 65+ Years | 52 (24.5%) | $60,000 |
| Total | 212 (100.0%) | $57,500 |
Poverty in Royal
Income Below Poverty by Sex and Age in Royal
With 15.7% poverty level for males and 14.9% for females among the residents of Royal, under 5 year old males and 6 to 11 year old females are the most vulnerable to poverty, with 14 males (87.5%) and 2 females (50.0%) in their respective age groups living below the poverty level.
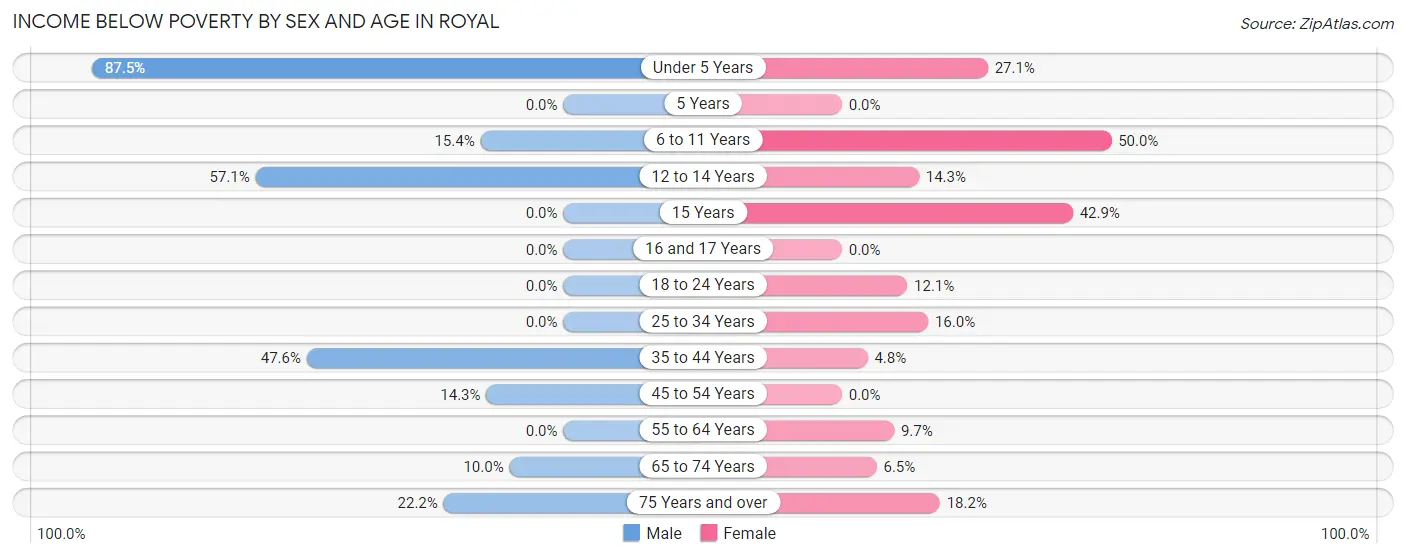
| Age Bracket | Male | Female |
| Under 5 Years | 14 (87.5%) | 13 (27.1%) |
| 5 Years | 0 (0.0%) | 0 (0.0%) |
| 6 to 11 Years | 4 (15.4%) | 2 (50.0%) |
| 12 to 14 Years | 4 (57.1%) | 2 (14.3%) |
| 15 Years | 0 (0.0%) | 3 (42.9%) |
| 16 and 17 Years | 0 (0.0%) | 0 (0.0%) |
| 18 to 24 Years | 0 (0.0%) | 4 (12.1%) |
| 25 to 34 Years | 0 (0.0%) | 4 (16.0%) |
| 35 to 44 Years | 10 (47.6%) | 1 (4.8%) |
| 45 to 54 Years | 5 (14.3%) | 0 (0.0%) |
| 55 to 64 Years | 0 (0.0%) | 3 (9.7%) |
| 65 to 74 Years | 3 (10.0%) | 2 (6.5%) |
| 75 Years and over | 2 (22.2%) | 2 (18.2%) |
| Total | 42 (15.7%) | 36 (14.9%) |
Income Above Poverty by Sex and Age in Royal
According to the poverty statistics in Royal, males aged 15 years and females aged 16 and 17 years are the age groups that are most secure financially, with 100.0% of males and 100.0% of females in these age groups living above the poverty line.
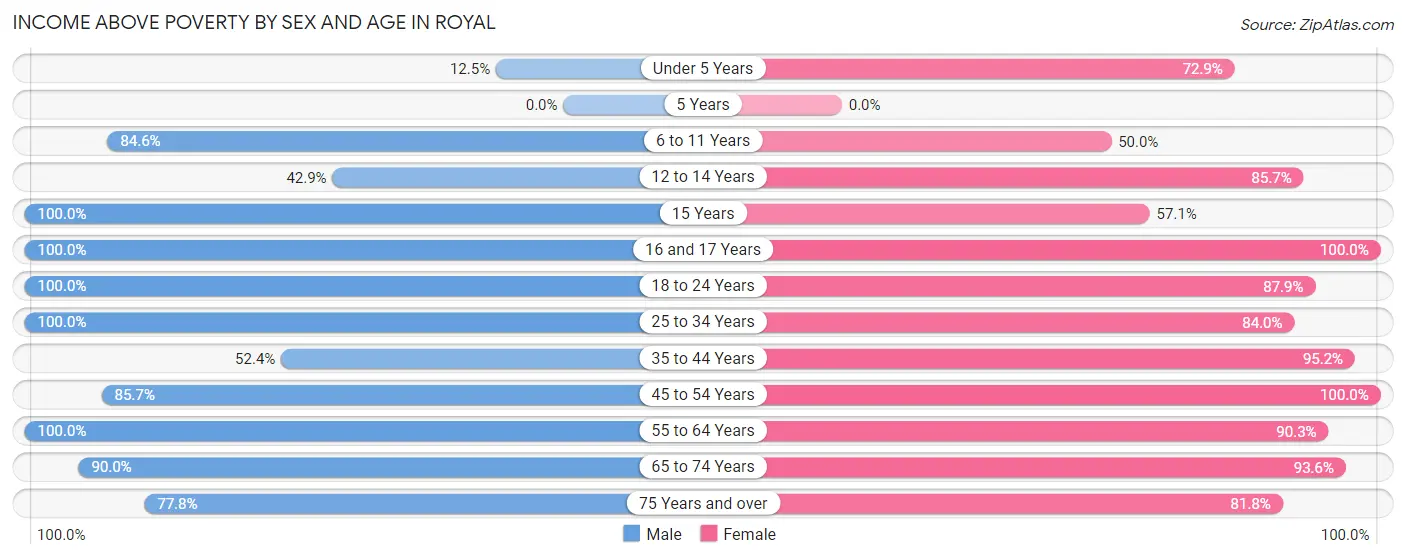
| Age Bracket | Male | Female |
| Under 5 Years | 2 (12.5%) | 35 (72.9%) |
| 5 Years | 0 (0.0%) | 0 (0.0%) |
| 6 to 11 Years | 22 (84.6%) | 2 (50.0%) |
| 12 to 14 Years | 3 (42.9%) | 12 (85.7%) |
| 15 Years | 5 (100.0%) | 4 (57.1%) |
| 16 and 17 Years | 2 (100.0%) | 4 (100.0%) |
| 18 to 24 Years | 70 (100.0%) | 29 (87.9%) |
| 25 to 34 Years | 26 (100.0%) | 21 (84.0%) |
| 35 to 44 Years | 11 (52.4%) | 20 (95.2%) |
| 45 to 54 Years | 30 (85.7%) | 13 (100.0%) |
| 55 to 64 Years | 21 (100.0%) | 28 (90.3%) |
| 65 to 74 Years | 27 (90.0%) | 29 (93.5%) |
| 75 Years and over | 7 (77.8%) | 9 (81.8%) |
| Total | 226 (84.3%) | 206 (85.1%) |
Income Below Poverty Among Married-Couple Families in Royal
The poverty statistics for married-couple families in Royal show that 6.7% or 5 of the total 75 families live below the poverty line. Families with 5 or more children have the highest poverty rate of 100.0%, comprising of 3 families. On the other hand, families with 1 or 2 children have the lowest poverty rate of 0.0%, which includes 0 families.
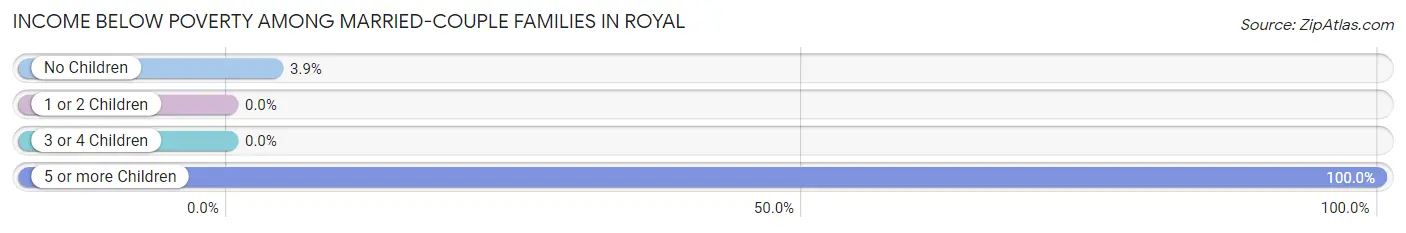
| Children | Above Poverty | Below Poverty |
| No Children | 49 (96.1%) | 2 (3.9%) |
| 1 or 2 Children | 21 (100.0%) | 0 (0.0%) |
| 3 or 4 Children | 0 (0.0%) | 0 (0.0%) |
| 5 or more Children | 0 (0.0%) | 3 (100.0%) |
| Total | 70 (93.3%) | 5 (6.7%) |
Income Below Poverty Among Single-Parent Households in Royal
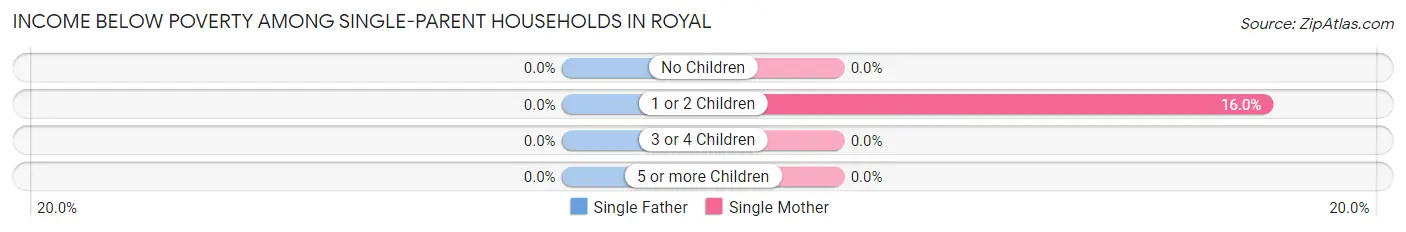
| Children | Single Father | Single Mother |
| No Children | 0 (0.0%) | 0 (0.0%) |
| 1 or 2 Children | 0 (0.0%) | 4 (16.0%) |
| 3 or 4 Children | 0 (0.0%) | 0 (0.0%) |
| 5 or more Children | 0 (0.0%) | 0 (0.0%) |
| Total | 0 (0.0%) | 4 (14.8%) |
Income Below Poverty Among Married-Couple vs Single-Parent Households in Royal
The poverty data for Royal shows that 5 of the married-couple family households (6.7%) and 4 of the single-parent households (13.8%) are living below the poverty level. Within the married-couple family households, those with 5 or more children have the highest poverty rate, with 3 households (100.0%) falling below the poverty line. Among the single-parent households, those with 1 or 2 children have the highest poverty rate, with 4 household (16.0%) living below poverty.
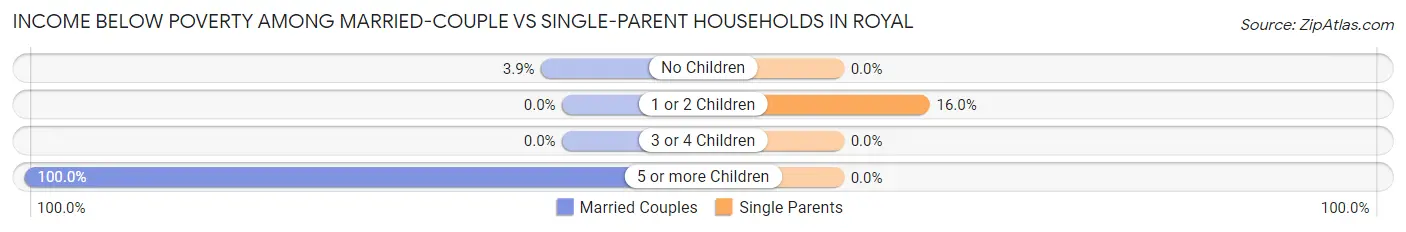
| Children | Married-Couple Families | Single-Parent Households |
| No Children | 2 (3.9%) | 0 (0.0%) |
| 1 or 2 Children | 0 (0.0%) | 4 (16.0%) |
| 3 or 4 Children | 0 (0.0%) | 0 (0.0%) |
| 5 or more Children | 3 (100.0%) | 0 (0.0%) |
| Total | 5 (6.7%) | 4 (13.8%) |
Race in Royal
The most populous races in Royal are White / Caucasian (502 | 98.4%), Hispanic or Latino (74 | 14.5%), and Black / African American (7 | 1.4%).
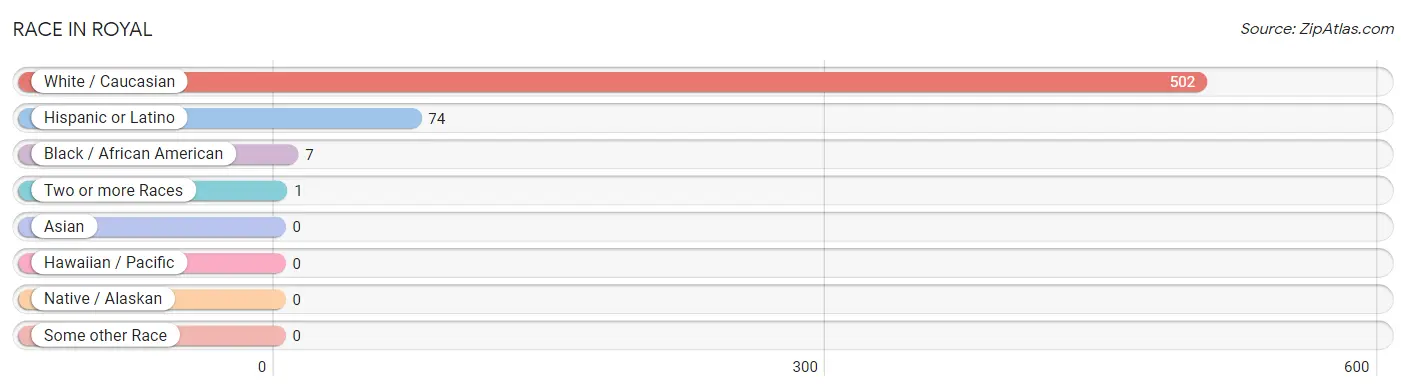
| Race | # Population | % Population |
| Asian | 0 | 0.0% |
| Black / African American | 7 | 1.4% |
| Hawaiian / Pacific | 0 | 0.0% |
| Hispanic or Latino | 74 | 14.5% |
| Native / Alaskan | 0 | 0.0% |
| White / Caucasian | 502 | 98.4% |
| Two or more Races | 1 | 0.2% |
| Some other Race | 0 | 0.0% |
| Total | 510 | 100.0% |
Ancestry in Royal
The most populous ancestries reported in Royal are German (126 | 24.7%), Mexican (73 | 14.3%), Danish (42 | 8.2%), English (38 | 7.4%), and Norwegian (28 | 5.5%), together accounting for 60.2% of all Royal residents.
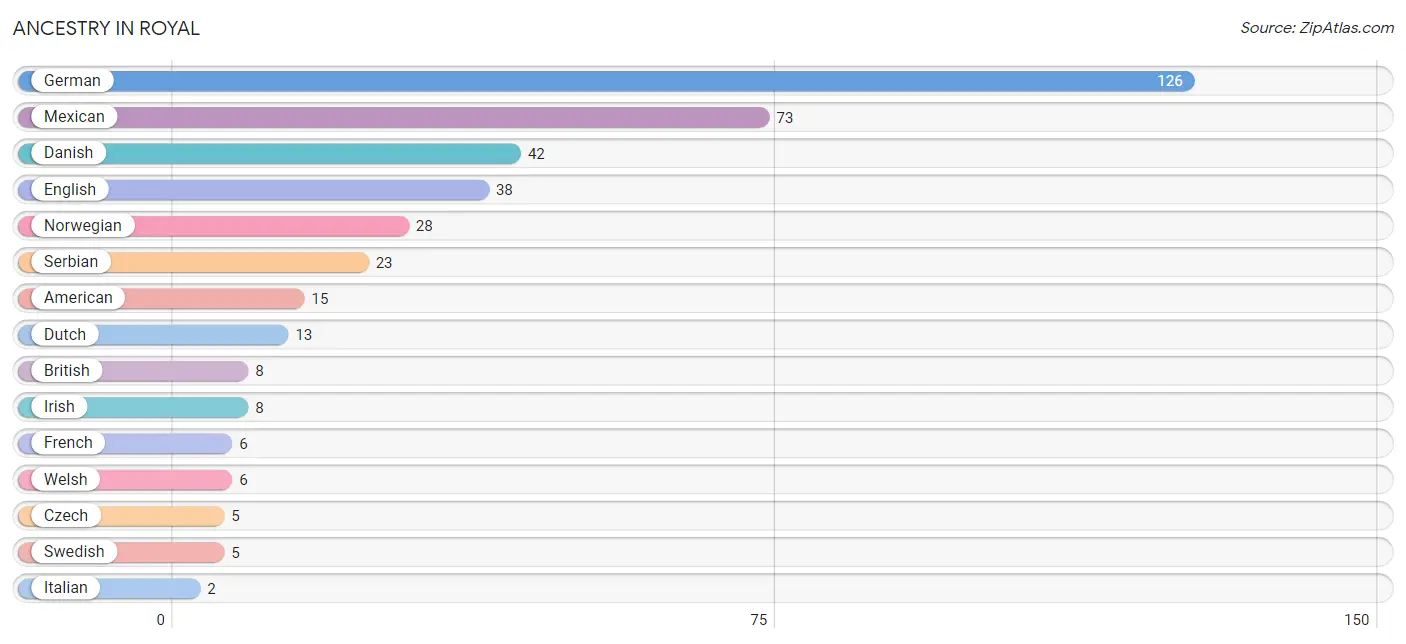
| Ancestry | # Population | % Population |
| American | 15 | 2.9% |
| British | 8 | 1.6% |
| Colombian | 1 | 0.2% |
| Czech | 5 | 1.0% |
| Danish | 42 | 8.2% |
| Dutch | 13 | 2.5% |
| Eastern European | 1 | 0.2% |
| English | 38 | 7.4% |
| European | 1 | 0.2% |
| French | 6 | 1.2% |
| German | 126 | 24.7% |
| Irish | 8 | 1.6% |
| Italian | 2 | 0.4% |
| Luxembourger | 1 | 0.2% |
| Mexican | 73 | 14.3% |
| Norwegian | 28 | 5.5% |
| Scottish | 1 | 0.2% |
| Serbian | 23 | 4.5% |
| South American | 1 | 0.2% |
| Swedish | 5 | 1.0% |
| Welsh | 6 | 1.2% | View All 21 Rows |
Immigrants in Royal
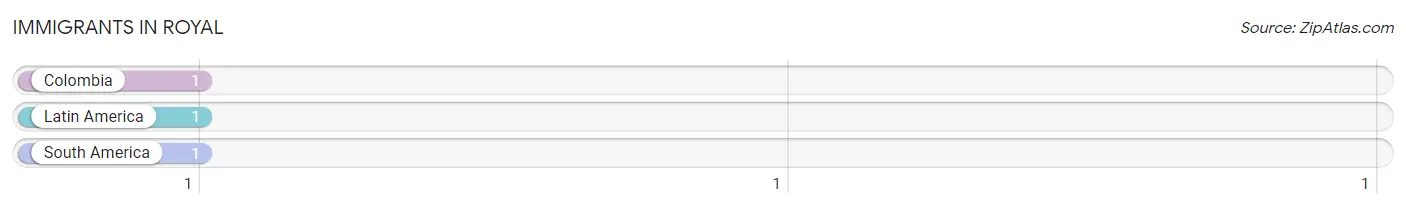
The most numerous immigrant groups reported in Royal came from Colombia (1 | 0.2%), Latin America (1 | 0.2%), and South America (1 | 0.2%), together accounting for 0.6% of all Royal residents.
| Immigration Origin | # Population | % Population |
| Colombia | 1 | 0.2% |
| Latin America | 1 | 0.2% |
| South America | 1 | 0.2% | View All 3 Rows |
Sex and Age in Royal
Sex and Age in Royal
The most populous age groups in Royal are 20 to 24 Years (70 | 26.1%) for men and Under 5 Years (48 | 19.8%) for women.
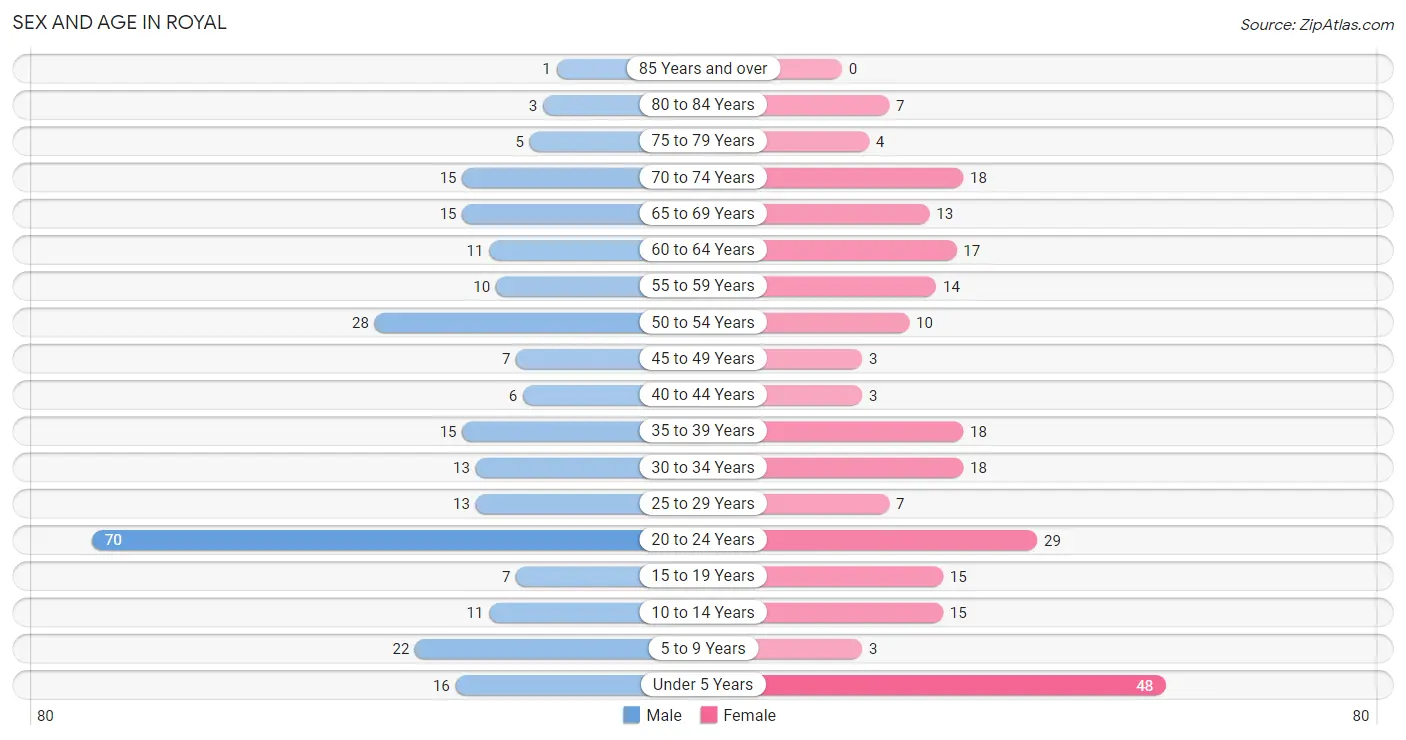
| Age Bracket | Male | Female |
| Under 5 Years | 16 (6.0%) | 48 (19.8%) |
| 5 to 9 Years | 22 (8.2%) | 3 (1.2%) |
| 10 to 14 Years | 11 (4.1%) | 15 (6.2%) |
| 15 to 19 Years | 7 (2.6%) | 15 (6.2%) |
| 20 to 24 Years | 70 (26.1%) | 29 (12.0%) |
| 25 to 29 Years | 13 (4.9%) | 7 (2.9%) |
| 30 to 34 Years | 13 (4.9%) | 18 (7.4%) |
| 35 to 39 Years | 15 (5.6%) | 18 (7.4%) |
| 40 to 44 Years | 6 (2.2%) | 3 (1.2%) |
| 45 to 49 Years | 7 (2.6%) | 3 (1.2%) |
| 50 to 54 Years | 28 (10.4%) | 10 (4.1%) |
| 55 to 59 Years | 10 (3.7%) | 14 (5.8%) |
| 60 to 64 Years | 11 (4.1%) | 17 (7.0%) |
| 65 to 69 Years | 15 (5.6%) | 13 (5.4%) |
| 70 to 74 Years | 15 (5.6%) | 18 (7.4%) |
| 75 to 79 Years | 5 (1.9%) | 4 (1.7%) |
| 80 to 84 Years | 3 (1.1%) | 7 (2.9%) |
| 85 Years and over | 1 (0.4%) | 0 (0.0%) |
| Total | 268 (100.0%) | 242 (100.0%) |
Families and Households in Royal
Median Family Size in Royal
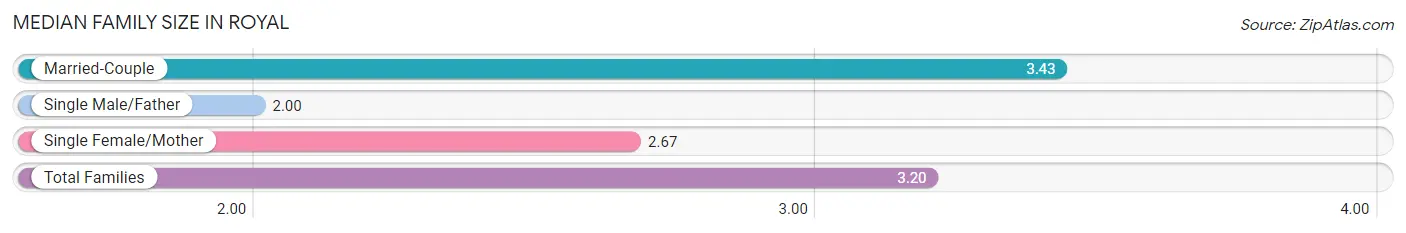
The median family size in Royal is 3.20 persons per family, with married-couple families (75 | 72.1%) accounting for the largest median family size of 3.43 persons per family. On the other hand, single male/father families (2 | 1.9%) represent the smallest median family size with 2.00 persons per family.
| Family Type | # Families | Family Size |
| Married-Couple | 75 (72.1%) | 3.43 |
| Single Male/Father | 2 (1.9%) | 2.00 |
| Single Female/Mother | 27 (26.0%) | 2.67 |
| Total Families | 104 (100.0%) | 3.20 |
Median Household Size in Royal
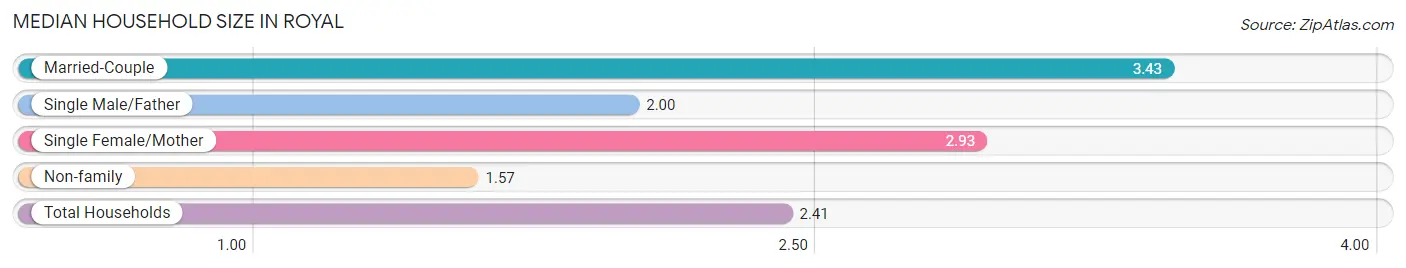
The median household size in Royal is 2.41 persons per household, with married-couple households (75 | 35.4%) accounting for the largest median household size of 3.43 persons per household. non-family households (108 | 50.9%) represent the smallest median household size with 1.57 persons per household.
| Household Type | # Households | Household Size |
| Married-Couple | 75 (35.4%) | 3.43 |
| Single Male/Father | 2 (0.9%) | 2.00 |
| Single Female/Mother | 27 (12.7%) | 2.93 |
| Non-family | 108 (50.9%) | 1.57 |
| Total Households | 212 (100.0%) | 2.41 |
Household Size by Marriage Status in Royal
Out of a total of 212 households in Royal, 104 (49.1%) are family households, while 108 (50.9%) are nonfamily households. The most numerous type of family households are 2-person households, comprising 55, and the most common type of nonfamily households are 1-person households, comprising 81.
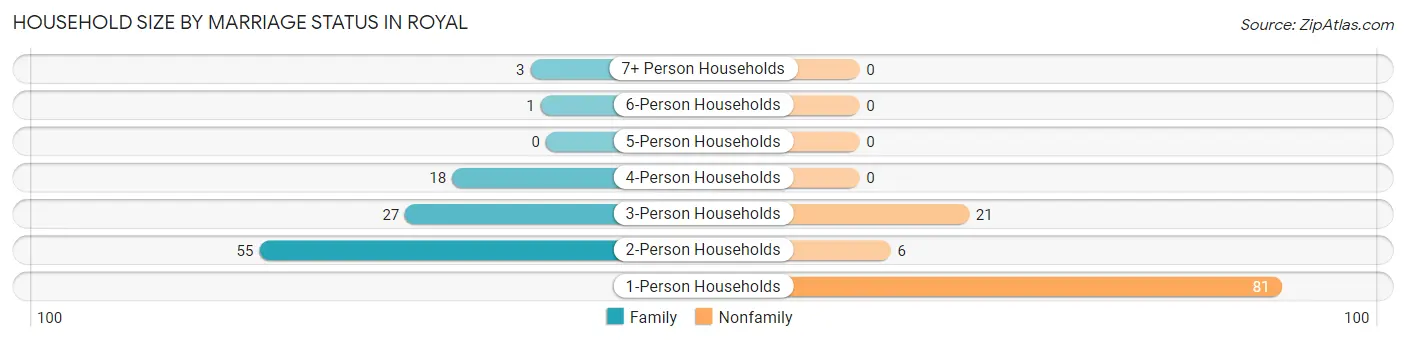
| Household Size | Family Households | Nonfamily Households |
| 1-Person Households | - | 81 (38.2%) |
| 2-Person Households | 55 (25.9%) | 6 (2.8%) |
| 3-Person Households | 27 (12.7%) | 21 (9.9%) |
| 4-Person Households | 18 (8.5%) | 0 (0.0%) |
| 5-Person Households | 0 (0.0%) | 0 (0.0%) |
| 6-Person Households | 1 (0.5%) | 0 (0.0%) |
| 7+ Person Households | 3 (1.4%) | 0 (0.0%) |
| Total | 104 (49.1%) | 108 (50.9%) |
Female Fertility in Royal
Fertility by Age in Royal
Average fertility rate in Royal is 53.0 births per 1,000 women. Women in the age bracket of 20 to 34 years have the highest fertility rate with 93.0 births per 1,000 women. Women in the age bracket of 20 to 34 years acount for 100.0% of all women with births.
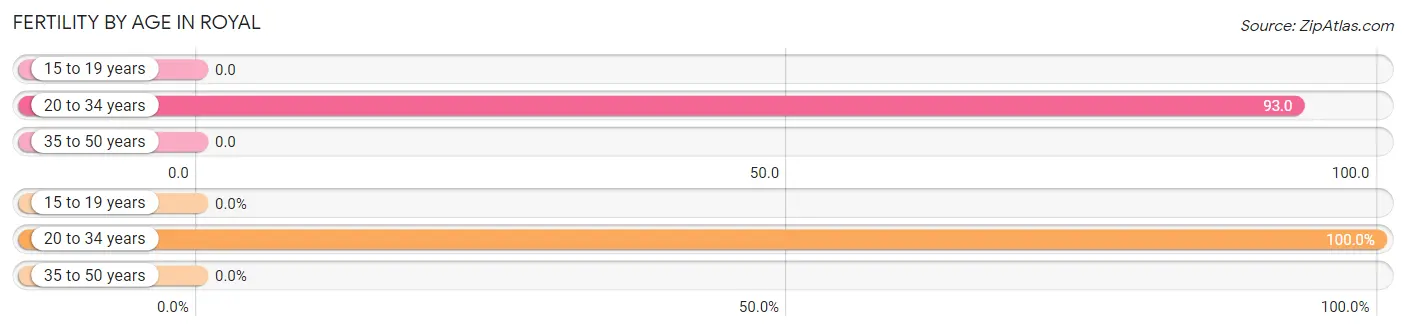
| Age Bracket | Women with Births | Births / 1,000 Women |
| 15 to 19 years | 0 (0.0%) | 0.0 |
| 20 to 34 years | 5 (100.0%) | 93.0 |
| 35 to 50 years | 0 (0.0%) | 0.0 |
| Total | 5 (100.0%) | 53.0 |
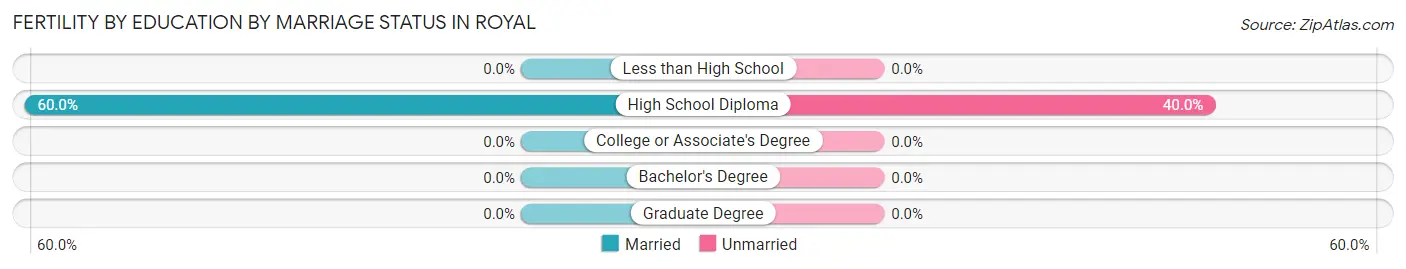
Fertility by Age by Marriage Status in Royal
60.0% of women with births (5) in Royal are married. The highest percentage of unmarried women with births falls into 20 to 34 years age bracket with 40.0% of them unmarried at the time of birth, while the lowest percentage of unmarried women with births belong to 20 to 34 years age bracket with 40.0% of them unmarried.
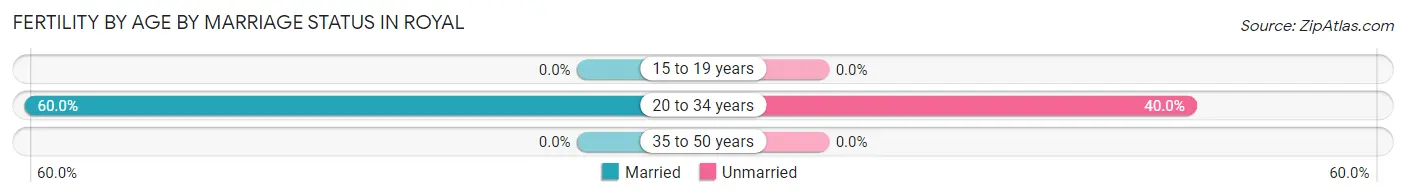
| Age Bracket | Married | Unmarried |
| 15 to 19 years | 0 (0.0%) | 0 (0.0%) |
| 20 to 34 years | 3 (60.0%) | 2 (40.0%) |
| 35 to 50 years | 0 (0.0%) | 0 (0.0%) |
| Total | 3 (60.0%) | 2 (40.0%) |
Fertility by Education in Royal
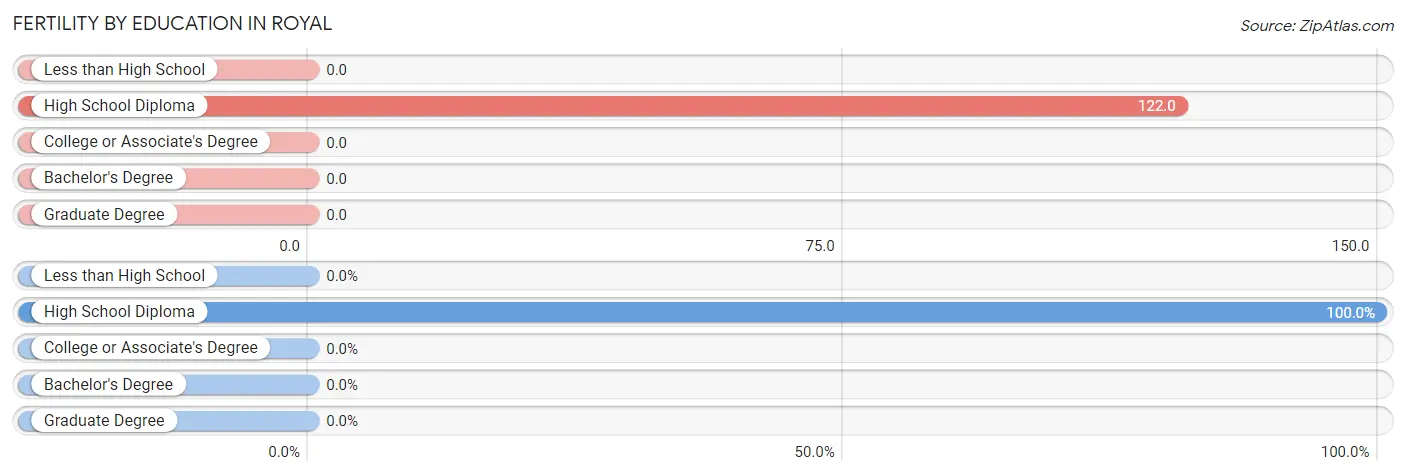
| Educational Attainment | Women with Births | Births / 1,000 Women |
| Less than High School | 0 (0.0%) | 0.0 |
| High School Diploma | 5 (100.0%) | 122.0 |
| College or Associate's Degree | 0 (0.0%) | 0.0 |
| Bachelor's Degree | 0 (0.0%) | 0.0 |
| Graduate Degree | 0 (0.0%) | 0.0 |
| Total | 5 (100.0%) | 53.0 |
Fertility by Education by Marriage Status in Royal
40.0% of women with births in Royal are unmarried. Women with the educational attainment of high school diploma are most likely to be married with 60.0% of them married at childbirth, while women with the educational attainment of high school diploma are least likely to be married with 40.0% of them unmarried at childbirth.
| Educational Attainment | Married | Unmarried |
| Less than High School | 0 (0.0%) | 0 (0.0%) |
| High School Diploma | 3 (60.0%) | 2 (40.0%) |
| College or Associate's Degree | 0 (0.0%) | 0 (0.0%) |
| Bachelor's Degree | 0 (0.0%) | 0 (0.0%) |
| Graduate Degree | 0 (0.0%) | 0 (0.0%) |
| Total | 3 (60.0%) | 2 (40.0%) |
Employment Characteristics in Royal
Employment by Class of Employer in Royal
Among the 267 employed individuals in Royal, private company employees (209 | 78.3%), not-for-profit organizations (29 | 10.9%), and self-employed (not incorporated) (12 | 4.5%) make up the most common classes of employment.
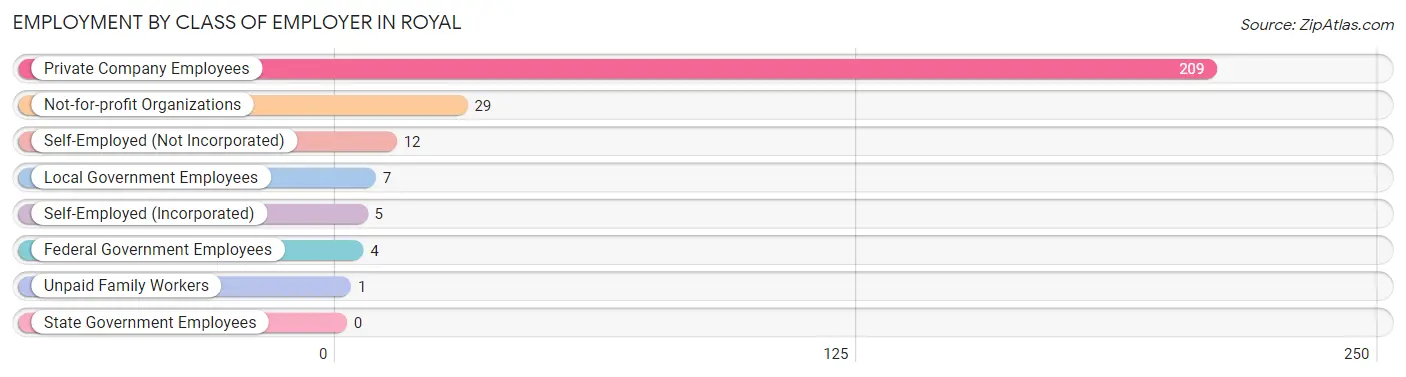
| Employer Class | # Employees | % Employees |
| Private Company Employees | 209 | 78.3% |
| Self-Employed (Incorporated) | 5 | 1.9% |
| Self-Employed (Not Incorporated) | 12 | 4.5% |
| Not-for-profit Organizations | 29 | 10.9% |
| Local Government Employees | 7 | 2.6% |
| State Government Employees | 0 | 0.0% |
| Federal Government Employees | 4 | 1.5% |
| Unpaid Family Workers | 1 | 0.4% |
| Total | 267 | 100.0% |
Employment Status by Age in Royal
According to the labor force statistics for Royal, out of the total population over 16 years of age (383), 73.6% or 282 individuals are in the labor force, with 3.5% or 10 of them unemployed. The age group with the highest labor force participation rate is 20 to 24 years, with 97.0% or 96 individuals in the labor force. Within the labor force, the 16 to 19 years age range has the highest percentage of unemployed individuals, with 100.0% or 4 of them being unemployed.
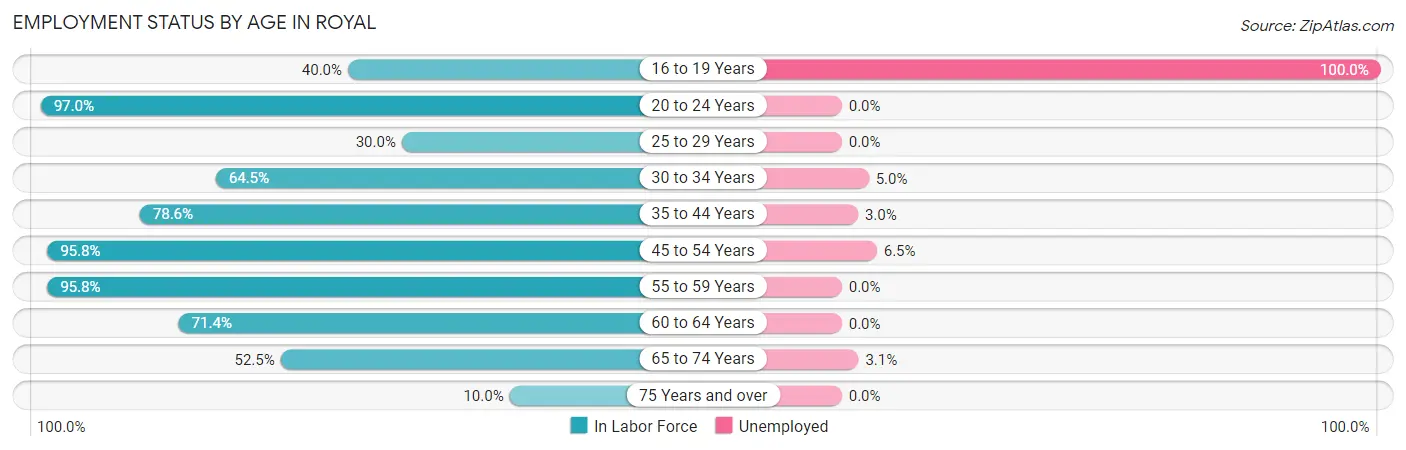
| Age Bracket | In Labor Force | Unemployed |
| 16 to 19 Years | 4 (40.0%) | 4 (100.0%) |
| 20 to 24 Years | 96 (97.0%) | 0 (0.0%) |
| 25 to 29 Years | 6 (30.0%) | 0 (0.0%) |
| 30 to 34 Years | 20 (64.5%) | 1 (5.0%) |
| 35 to 44 Years | 33 (78.6%) | 1 (3.0%) |
| 45 to 54 Years | 46 (95.8%) | 3 (6.5%) |
| 55 to 59 Years | 23 (95.8%) | 0 (0.0%) |
| 60 to 64 Years | 20 (71.4%) | 0 (0.0%) |
| 65 to 74 Years | 32 (52.5%) | 1 (3.1%) |
| 75 Years and over | 2 (10.0%) | 0 (0.0%) |
| Total | 282 (73.6%) | 10 (3.5%) |
Employment Status by Educational Attainment in Royal
According to labor force statistics for Royal, 76.7% of individuals (148) out of the total population between 25 and 64 years of age (193) are in the labor force, with 3.4% or 5 of them being unemployed. The group with the highest labor force participation rate are those with the educational attainment of bachelor's degree or higher, with 88.9% or 24 individuals in the labor force. Within the labor force, individuals with college / associate degree education have the highest percentage of unemployment, with 4.4% or 3 of them being unemployed.
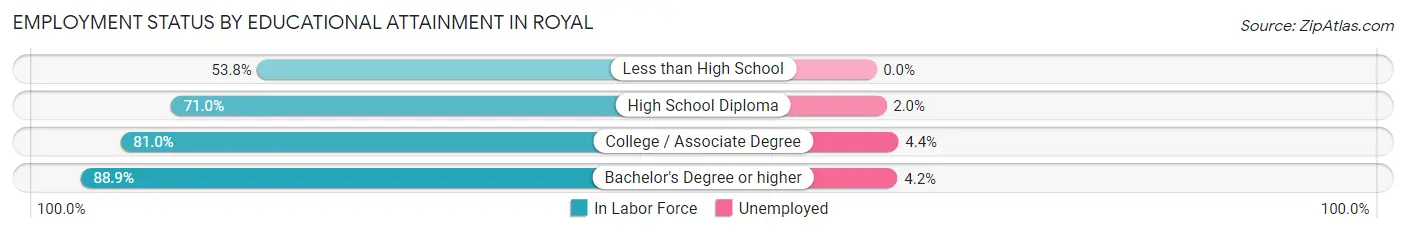
| Educational Attainment | In Labor Force | Unemployed |
| Less than High School | 7 (53.8%) | 0 (0.0%) |
| High School Diploma | 49 (71.0%) | 1 (2.0%) |
| College / Associate Degree | 68 (81.0%) | 4 (4.4%) |
| Bachelor's Degree or higher | 24 (88.9%) | 1 (4.2%) |
| Total | 148 (76.7%) | 7 (3.4%) |
Employment Occupations by Sex in Royal
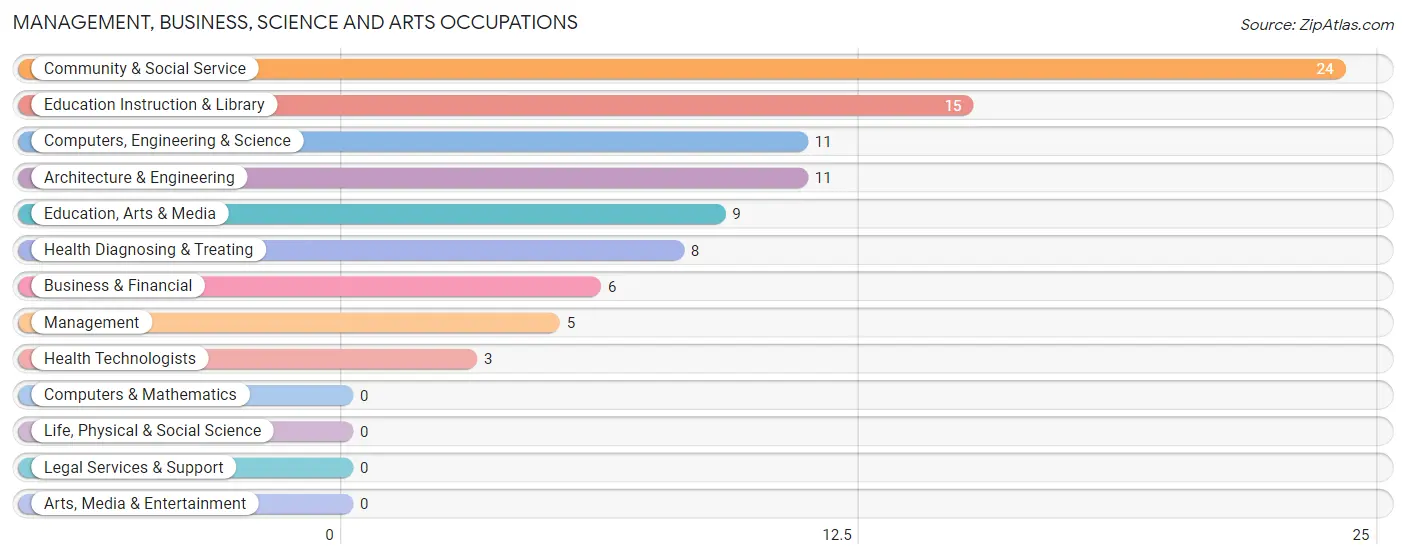
Management, Business, Science and Arts Occupations
The most common Management, Business, Science and Arts occupations in Royal are Community & Social Service (24 | 8.8%), Education Instruction & Library (15 | 5.5%), Computers, Engineering & Science (11 | 4.0%), Architecture & Engineering (11 | 4.0%), and Education, Arts & Media (9 | 3.3%).
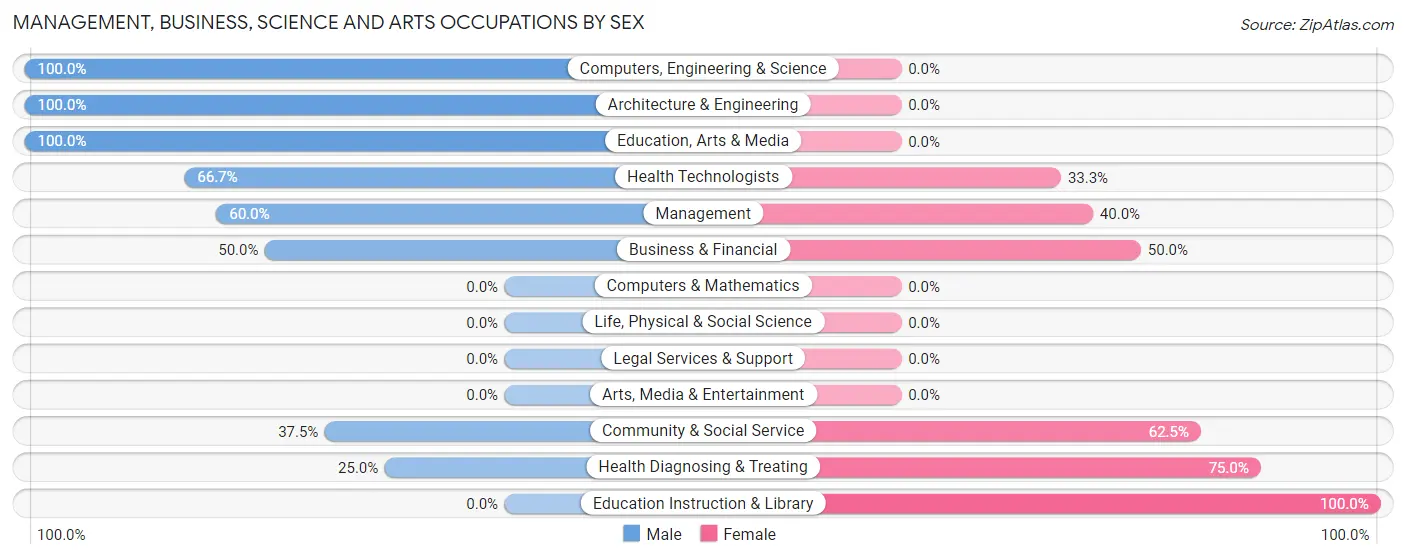
Management, Business, Science and Arts Occupations by Sex
Within the Management, Business, Science and Arts occupations in Royal, the most male-oriented occupations are Computers, Engineering & Science (100.0%), Architecture & Engineering (100.0%), and Education, Arts & Media (100.0%), while the most female-oriented occupations are Education Instruction & Library (100.0%), Health Diagnosing & Treating (75.0%), and Community & Social Service (62.5%).
| Occupation | Male | Female |
| Management | 3 (60.0%) | 2 (40.0%) |
| Business & Financial | 3 (50.0%) | 3 (50.0%) |
| Computers, Engineering & Science | 11 (100.0%) | 0 (0.0%) |
| Computers & Mathematics | 0 (0.0%) | 0 (0.0%) |
| Architecture & Engineering | 11 (100.0%) | 0 (0.0%) |
| Life, Physical & Social Science | 0 (0.0%) | 0 (0.0%) |
| Community & Social Service | 9 (37.5%) | 15 (62.5%) |
| Education, Arts & Media | 9 (100.0%) | 0 (0.0%) |
| Legal Services & Support | 0 (0.0%) | 0 (0.0%) |
| Education Instruction & Library | 0 (0.0%) | 15 (100.0%) |
| Arts, Media & Entertainment | 0 (0.0%) | 0 (0.0%) |
| Health Diagnosing & Treating | 2 (25.0%) | 6 (75.0%) |
| Health Technologists | 2 (66.7%) | 1 (33.3%) |
| Total (Category) | 28 (51.8%) | 26 (48.1%) |
| Total (Overall) | 165 (60.7%) | 107 (39.3%) |
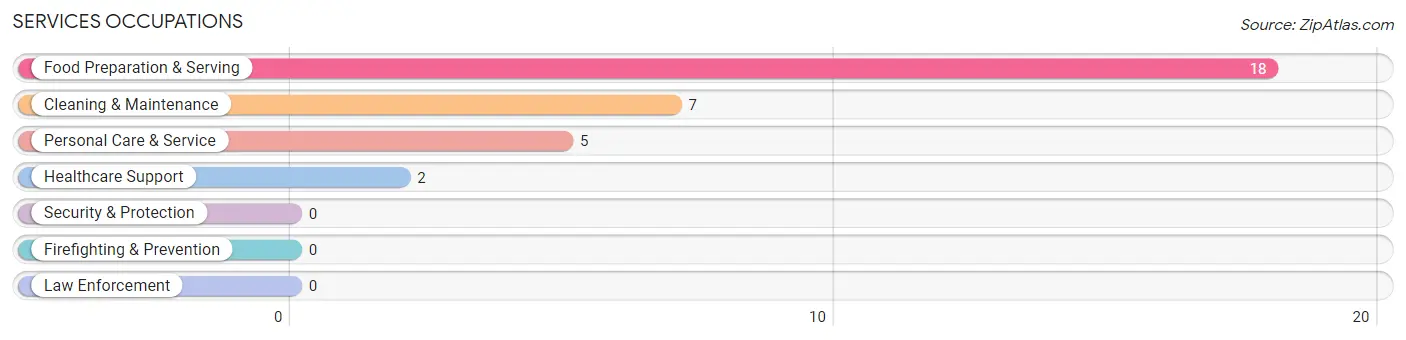
Services Occupations
The most common Services occupations in Royal are Food Preparation & Serving (18 | 6.6%), Cleaning & Maintenance (7 | 2.6%), Personal Care & Service (5 | 1.8%), and Healthcare Support (2 | 0.7%).
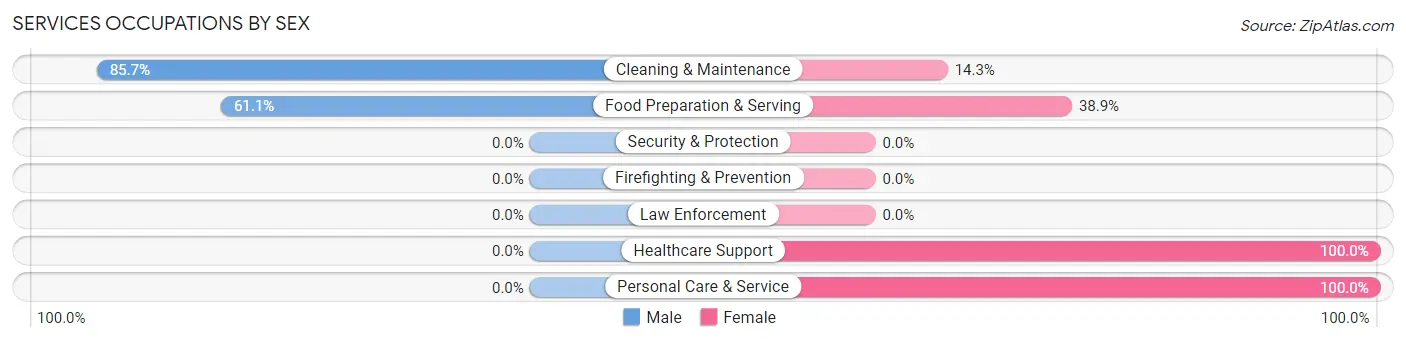
Services Occupations by Sex
Within the Services occupations in Royal, the most male-oriented occupations are Cleaning & Maintenance (85.7%), and Food Preparation & Serving (61.1%), while the most female-oriented occupations are Healthcare Support (100.0%), Personal Care & Service (100.0%), and Food Preparation & Serving (38.9%).
| Occupation | Male | Female |
| Healthcare Support | 0 (0.0%) | 2 (100.0%) |
| Security & Protection | 0 (0.0%) | 0 (0.0%) |
| Firefighting & Prevention | 0 (0.0%) | 0 (0.0%) |
| Law Enforcement | 0 (0.0%) | 0 (0.0%) |
| Food Preparation & Serving | 11 (61.1%) | 7 (38.9%) |
| Cleaning & Maintenance | 6 (85.7%) | 1 (14.3%) |
| Personal Care & Service | 0 (0.0%) | 5 (100.0%) |
| Total (Category) | 17 (53.1%) | 15 (46.9%) |
| Total (Overall) | 165 (60.7%) | 107 (39.3%) |
Sales and Office Occupations
The most common Sales and Office occupations in Royal are Office & Administration (30 | 11.0%), and Sales & Related (13 | 4.8%).
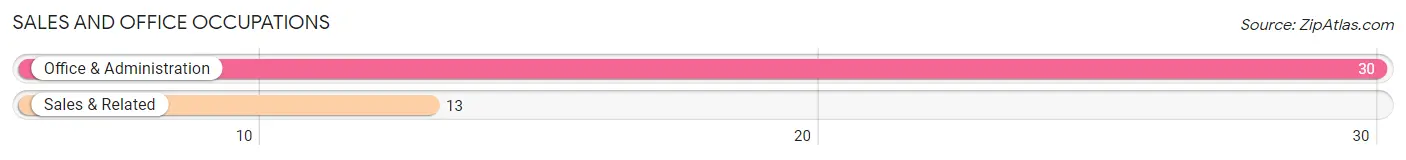
Sales and Office Occupations by Sex
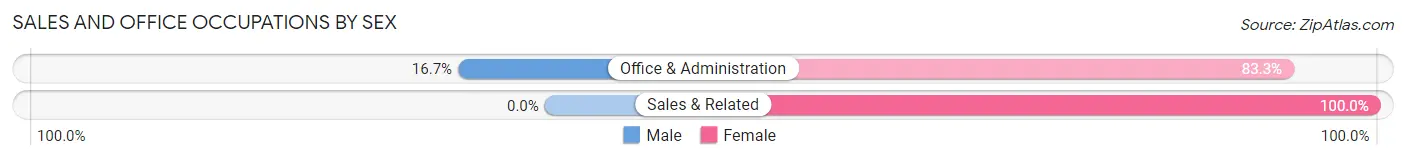
| Occupation | Male | Female |
| Sales & Related | 0 (0.0%) | 13 (100.0%) |
| Office & Administration | 5 (16.7%) | 25 (83.3%) |
| Total (Category) | 5 (11.6%) | 38 (88.4%) |
| Total (Overall) | 165 (60.7%) | 107 (39.3%) |
Natural Resources, Construction and Maintenance Occupations
The most common Natural Resources, Construction and Maintenance occupations in Royal are Installation, Maintenance & Repair (10 | 3.7%), Construction & Extraction (7 | 2.6%), and Farming, Fishing & Forestry (2 | 0.7%).
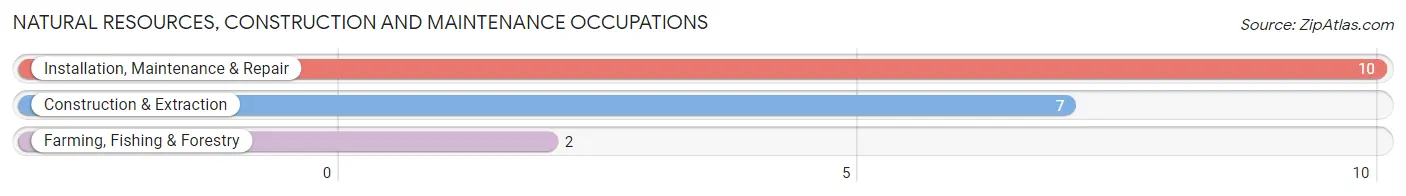
Natural Resources, Construction and Maintenance Occupations by Sex
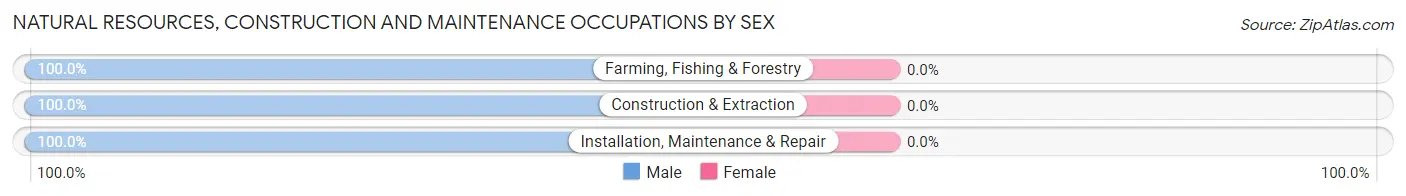
| Occupation | Male | Female |
| Farming, Fishing & Forestry | 2 (100.0%) | 0 (0.0%) |
| Construction & Extraction | 7 (100.0%) | 0 (0.0%) |
| Installation, Maintenance & Repair | 10 (100.0%) | 0 (0.0%) |
| Total (Category) | 19 (100.0%) | 0 (0.0%) |
| Total (Overall) | 165 (60.7%) | 107 (39.3%) |
Production, Transportation and Moving Occupations
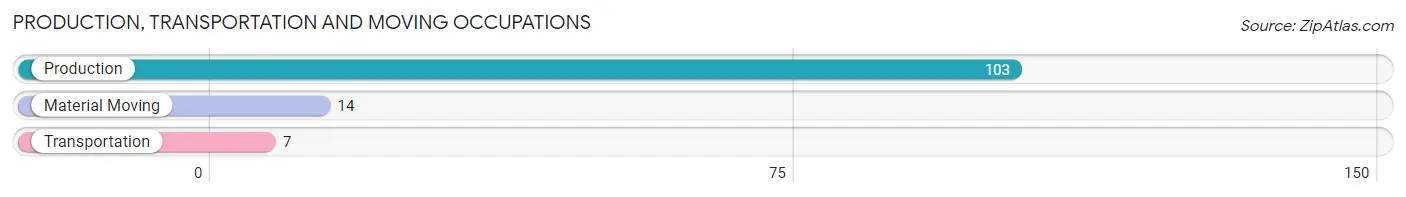
The most common Production, Transportation and Moving occupations in Royal are Production (103 | 37.9%), Material Moving (14 | 5.1%), and Transportation (7 | 2.6%).
Production, Transportation and Moving Occupations by Sex
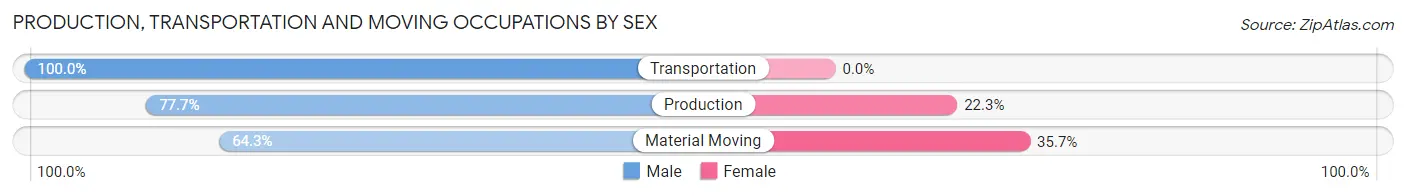
| Occupation | Male | Female |
| Production | 80 (77.7%) | 23 (22.3%) |
| Transportation | 7 (100.0%) | 0 (0.0%) |
| Material Moving | 9 (64.3%) | 5 (35.7%) |
| Total (Category) | 96 (77.4%) | 28 (22.6%) |
| Total (Overall) | 165 (60.7%) | 107 (39.3%) |
Employment Industries by Sex in Royal
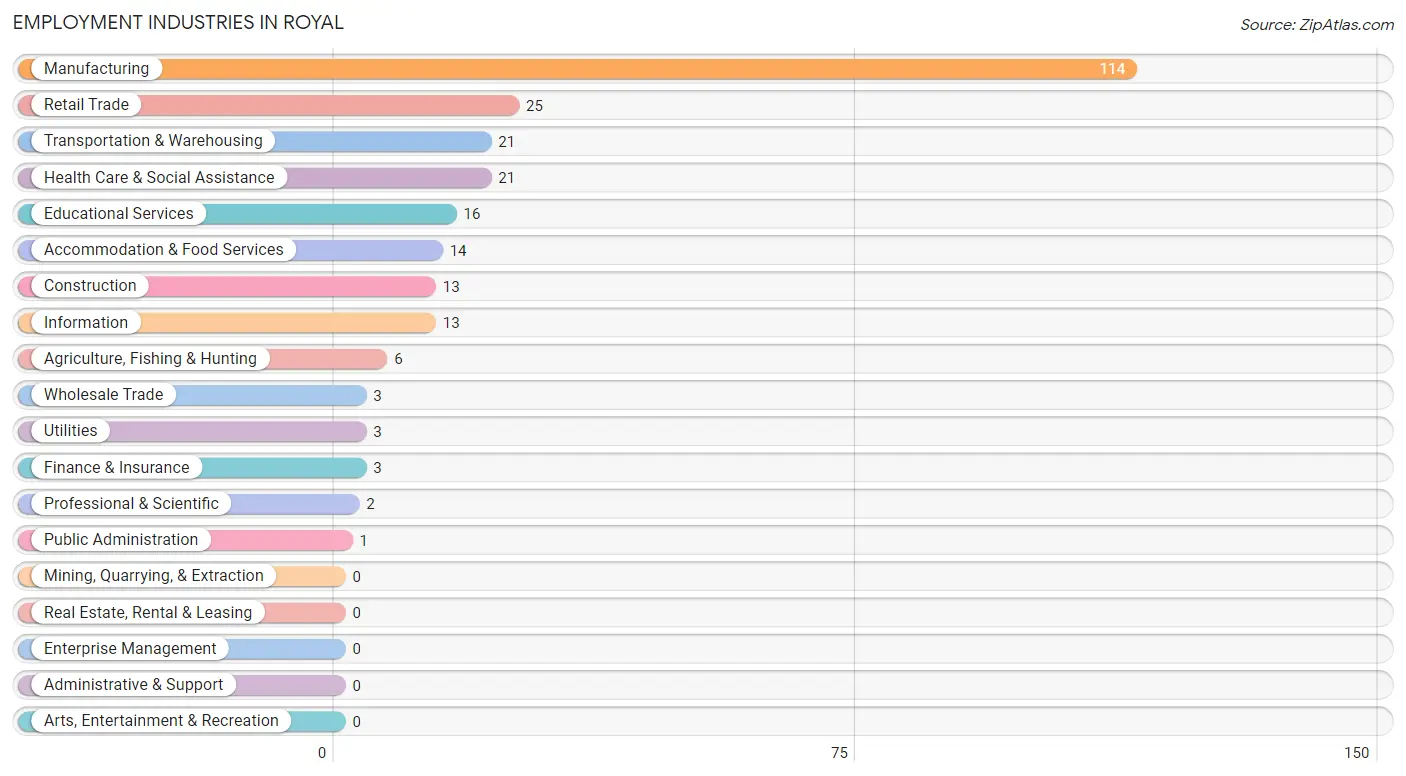
Employment Industries in Royal
The major employment industries in Royal include Manufacturing (114 | 41.9%), Retail Trade (25 | 9.2%), Transportation & Warehousing (21 | 7.7%), Health Care & Social Assistance (21 | 7.7%), and Educational Services (16 | 5.9%).
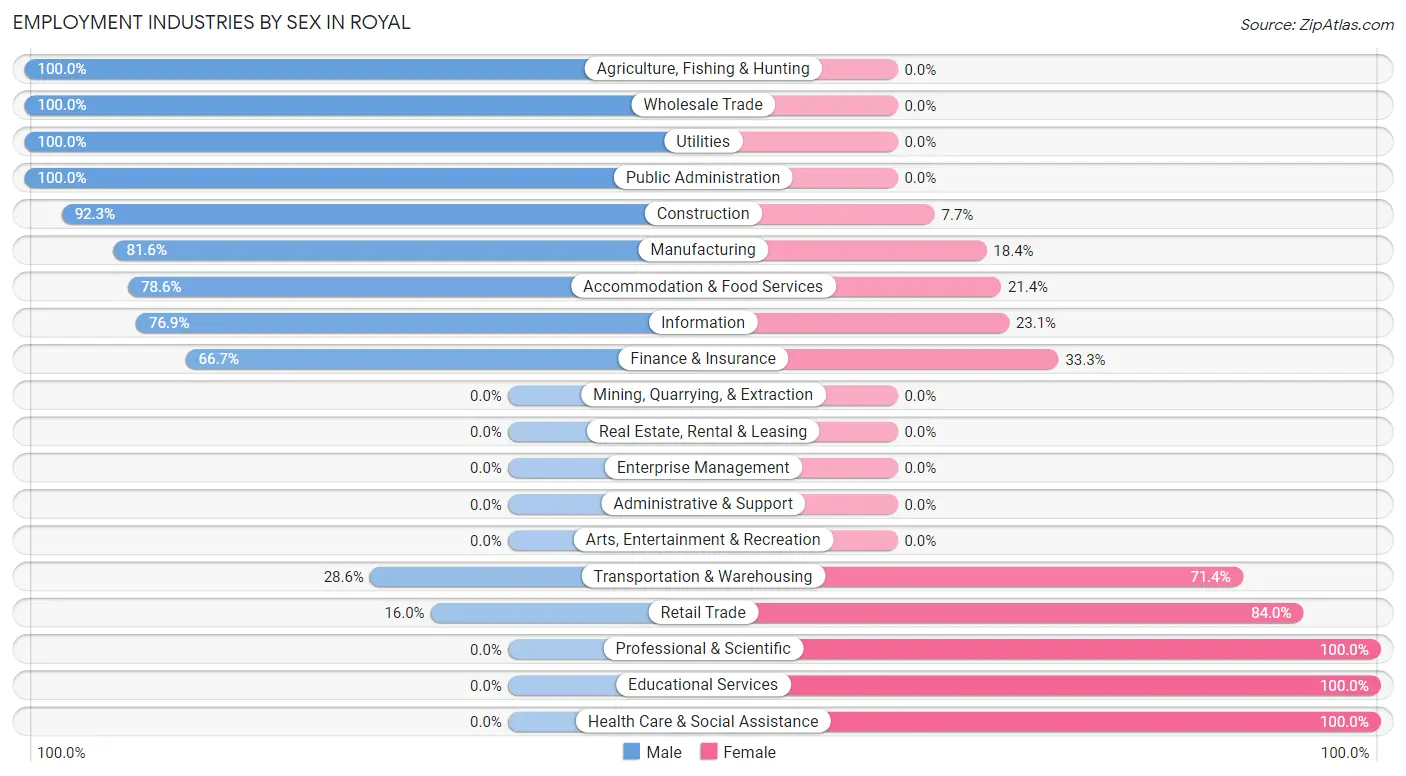
Employment Industries by Sex in Royal
The Royal industries that see more men than women are Agriculture, Fishing & Hunting (100.0%), Wholesale Trade (100.0%), and Utilities (100.0%), whereas the industries that tend to have a higher number of women are Professional & Scientific (100.0%), Educational Services (100.0%), and Health Care & Social Assistance (100.0%).
| Industry | Male | Female |
| Agriculture, Fishing & Hunting | 6 (100.0%) | 0 (0.0%) |
| Mining, Quarrying, & Extraction | 0 (0.0%) | 0 (0.0%) |
| Construction | 12 (92.3%) | 1 (7.7%) |
| Manufacturing | 93 (81.6%) | 21 (18.4%) |
| Wholesale Trade | 3 (100.0%) | 0 (0.0%) |
| Retail Trade | 4 (16.0%) | 21 (84.0%) |
| Transportation & Warehousing | 6 (28.6%) | 15 (71.4%) |
| Utilities | 3 (100.0%) | 0 (0.0%) |
| Information | 10 (76.9%) | 3 (23.1%) |
| Finance & Insurance | 2 (66.7%) | 1 (33.3%) |
| Real Estate, Rental & Leasing | 0 (0.0%) | 0 (0.0%) |
| Professional & Scientific | 0 (0.0%) | 2 (100.0%) |
| Enterprise Management | 0 (0.0%) | 0 (0.0%) |
| Administrative & Support | 0 (0.0%) | 0 (0.0%) |
| Educational Services | 0 (0.0%) | 16 (100.0%) |
| Health Care & Social Assistance | 0 (0.0%) | 21 (100.0%) |
| Arts, Entertainment & Recreation | 0 (0.0%) | 0 (0.0%) |
| Accommodation & Food Services | 11 (78.6%) | 3 (21.4%) |
| Public Administration | 1 (100.0%) | 0 (0.0%) |
| Total | 165 (60.7%) | 107 (39.3%) |
Education in Royal
School Enrollment in Royal
The most common levels of schooling among the 82 students in Royal are high school (23 | 28.1%), middle school (19 | 23.2%), and kindergarten (17 | 20.7%).
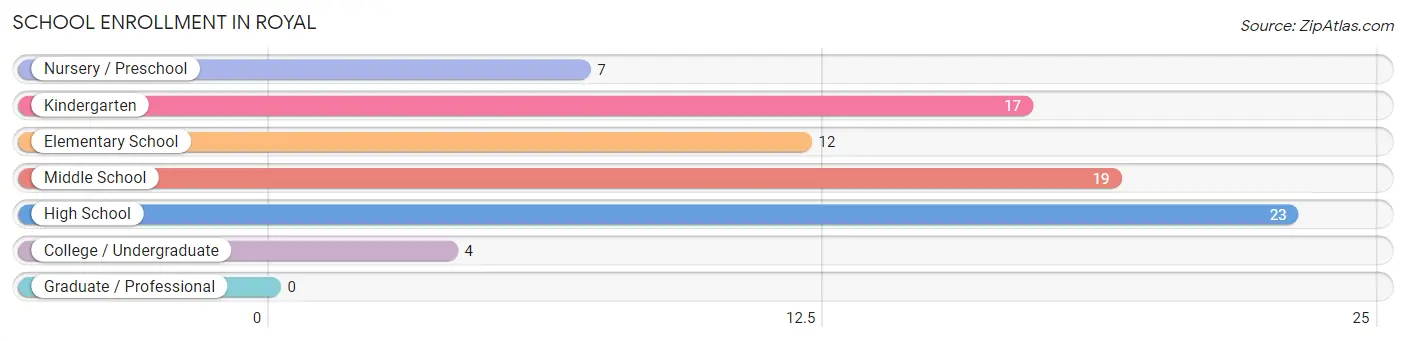
| School Level | # Students | % Students |
| Nursery / Preschool | 7 | 8.5% |
| Kindergarten | 17 | 20.7% |
| Elementary School | 12 | 14.6% |
| Middle School | 19 | 23.2% |
| High School | 23 | 28.1% |
| College / Undergraduate | 4 | 4.9% |
| Graduate / Professional | 0 | 0.0% |
| Total | 82 | 100.0% |
School Enrollment by Age by Funding Source in Royal
Out of a total of 82 students who are enrolled in schools in Royal, 6 (7.3%) attend a private institution, while the remaining 76 (92.7%) are enrolled in public schools. The age group of 18 to 19 year olds has the highest likelihood of being enrolled in private schools, with 2 (50.0% in the age bracket) enrolled. Conversely, the age group of 3 to 4 year olds has the lowest likelihood of being enrolled in a private school, with 7 (100.0% in the age bracket) attending a public institution.
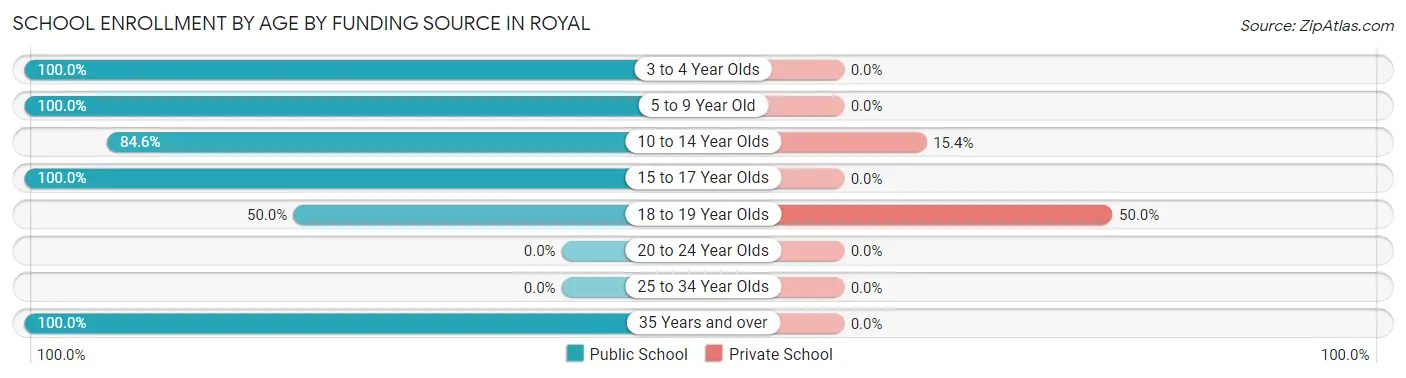
| Age Bracket | Public School | Private School |
| 3 to 4 Year Olds | 7 (100.0%) | 0 (0.0%) |
| 5 to 9 Year Old | 25 (100.0%) | 0 (0.0%) |
| 10 to 14 Year Olds | 22 (84.6%) | 4 (15.4%) |
| 15 to 17 Year Olds | 18 (100.0%) | 0 (0.0%) |
| 18 to 19 Year Olds | 2 (50.0%) | 2 (50.0%) |
| 20 to 24 Year Olds | 0 (0.0%) | 0 (0.0%) |
| 25 to 34 Year Olds | 0 (0.0%) | 0 (0.0%) |
| 35 Years and over | 2 (100.0%) | 0 (0.0%) |
| Total | 76 (92.7%) | 6 (7.3%) |
Educational Attainment by Field of Study in Royal
Business (16 | 28.1%), education (12 | 21.0%), liberal arts & history (8 | 14.0%), visual & performing arts (8 | 14.0%), and arts & humanities (4 | 7.0%) are the most common fields of study among 57 individuals in Royal who have obtained a bachelor's degree or higher.
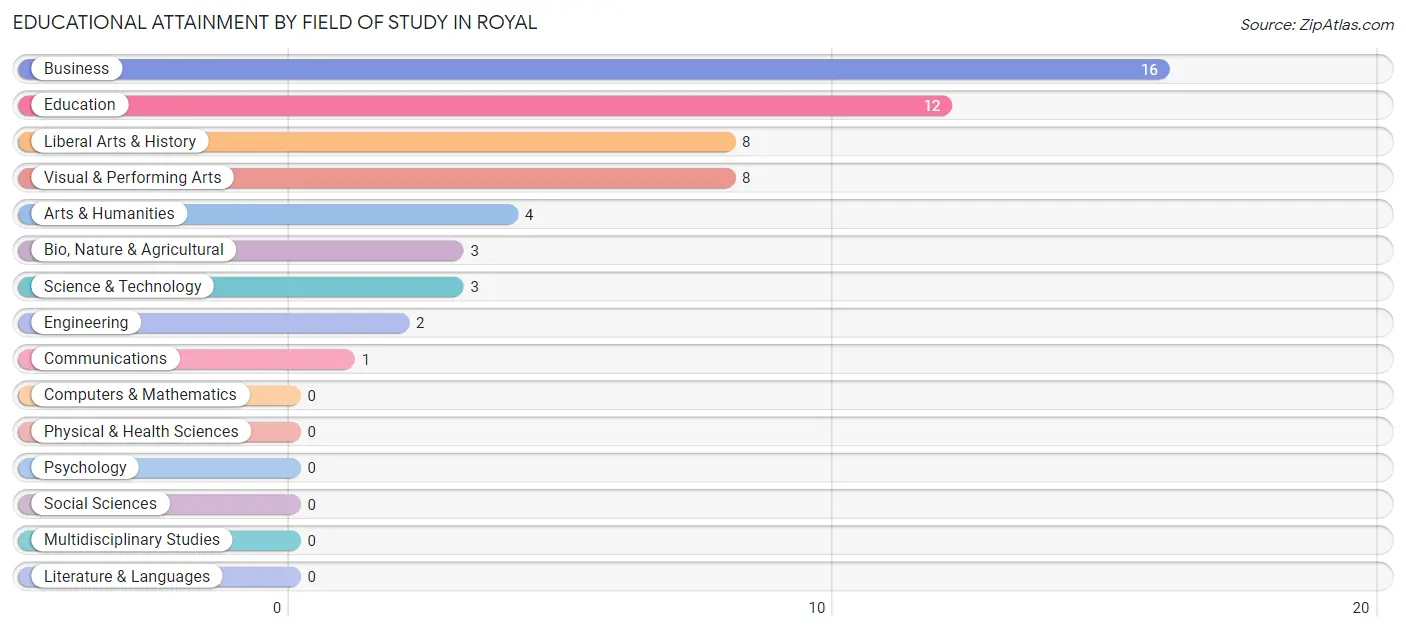
| Field of Study | # Graduates | % Graduates |
| Computers & Mathematics | 0 | 0.0% |
| Bio, Nature & Agricultural | 3 | 5.3% |
| Physical & Health Sciences | 0 | 0.0% |
| Psychology | 0 | 0.0% |
| Social Sciences | 0 | 0.0% |
| Engineering | 2 | 3.5% |
| Multidisciplinary Studies | 0 | 0.0% |
| Science & Technology | 3 | 5.3% |
| Business | 16 | 28.1% |
| Education | 12 | 21.0% |
| Literature & Languages | 0 | 0.0% |
| Liberal Arts & History | 8 | 14.0% |
| Visual & Performing Arts | 8 | 14.0% |
| Communications | 1 | 1.8% |
| Arts & Humanities | 4 | 7.0% |
| Total | 57 | 100.0% |
Transportation & Commute in Royal
Vehicle Availability by Sex in Royal
The most prevalent vehicle ownership categories in Royal are males with 2 vehicles (81, accounting for 49.4%) and females with 2 vehicles (40, making up 78.6%).
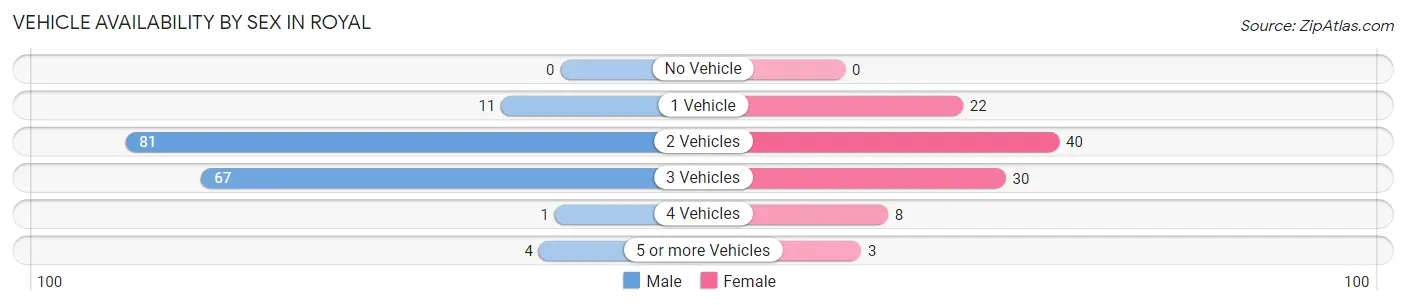
| Vehicles Available | Male | Female |
| No Vehicle | 0 (0.0%) | 0 (0.0%) |
| 1 Vehicle | 11 (6.7%) | 22 (21.4%) |
| 2 Vehicles | 81 (49.4%) | 40 (38.8%) |
| 3 Vehicles | 67 (40.8%) | 30 (29.1%) |
| 4 Vehicles | 1 (0.6%) | 8 (7.8%) |
| 5 or more Vehicles | 4 (2.4%) | 3 (2.9%) |
| Total | 164 (100.0%) | 103 (100.0%) |
Commute Time in Royal
The most frequently occuring commute durations in Royal are 40 to 44 minutes (83 commuters, 33.3%), 15 to 19 minutes (50 commuters, 20.1%), and 20 to 24 minutes (50 commuters, 20.1%).
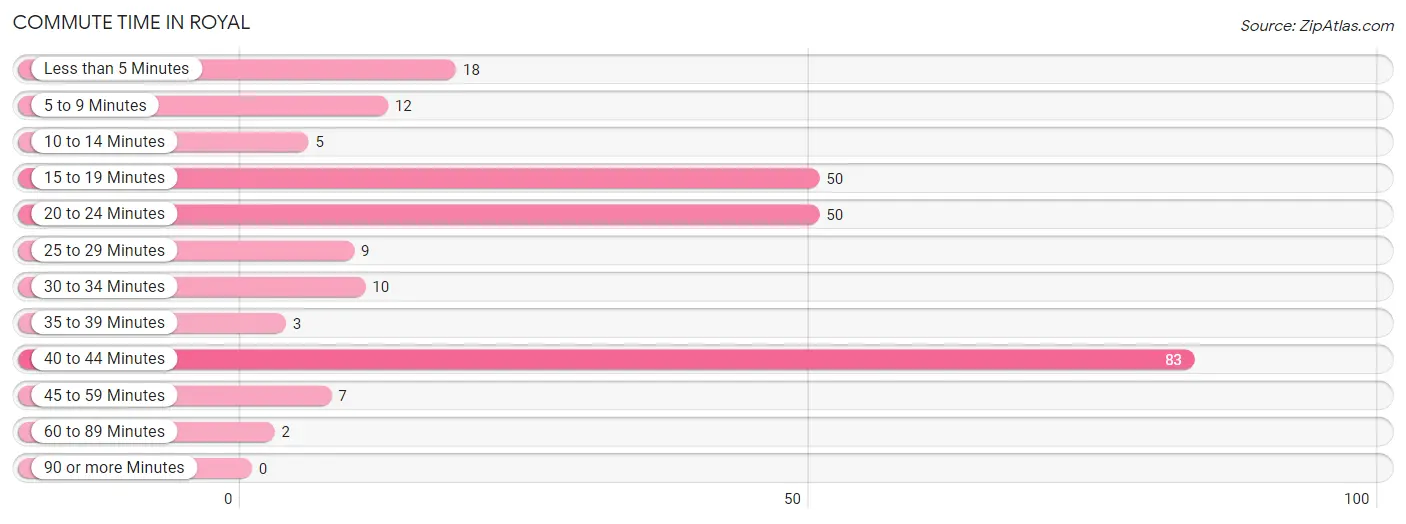
| Commute Time | # Commuters | % Commuters |
| Less than 5 Minutes | 18 | 7.2% |
| 5 to 9 Minutes | 12 | 4.8% |
| 10 to 14 Minutes | 5 | 2.0% |
| 15 to 19 Minutes | 50 | 20.1% |
| 20 to 24 Minutes | 50 | 20.1% |
| 25 to 29 Minutes | 9 | 3.6% |
| 30 to 34 Minutes | 10 | 4.0% |
| 35 to 39 Minutes | 3 | 1.2% |
| 40 to 44 Minutes | 83 | 33.3% |
| 45 to 59 Minutes | 7 | 2.8% |
| 60 to 89 Minutes | 2 | 0.8% |
| 90 or more Minutes | 0 | 0.0% |
Commute Time by Sex in Royal
The most common commute times in Royal are 40 to 44 minutes (58 commuters, 37.7%) for males and 40 to 44 minutes (25 commuters, 26.3%) for females.
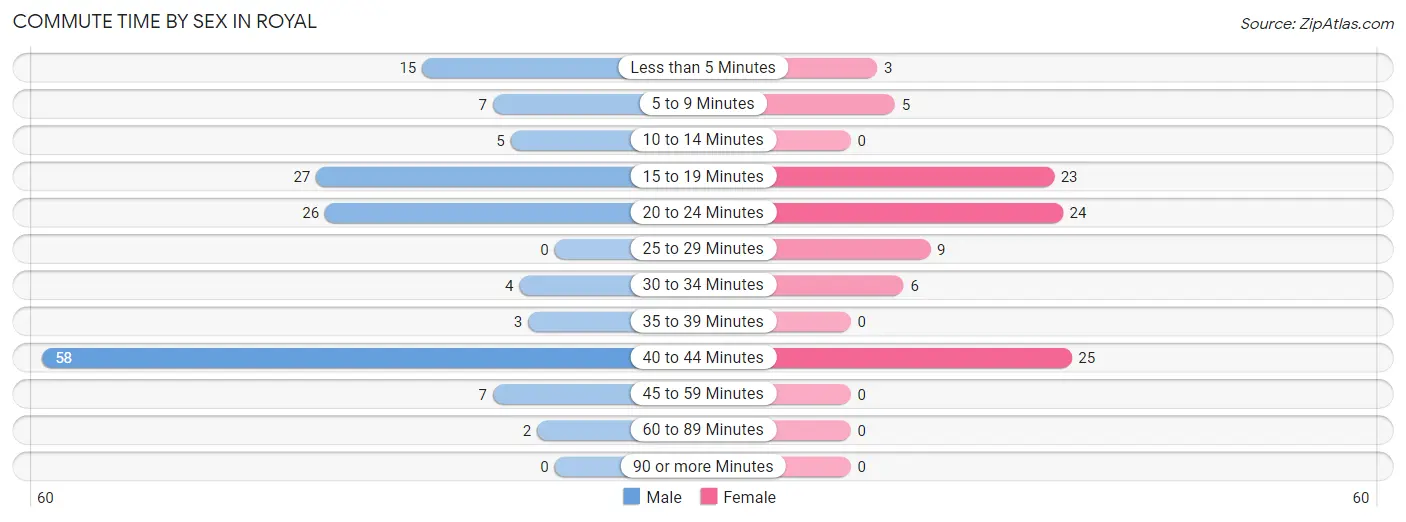
| Commute Time | Male | Female |
| Less than 5 Minutes | 15 (9.7%) | 3 (3.2%) |
| 5 to 9 Minutes | 7 (4.5%) | 5 (5.3%) |
| 10 to 14 Minutes | 5 (3.3%) | 0 (0.0%) |
| 15 to 19 Minutes | 27 (17.5%) | 23 (24.2%) |
| 20 to 24 Minutes | 26 (16.9%) | 24 (25.3%) |
| 25 to 29 Minutes | 0 (0.0%) | 9 (9.5%) |
| 30 to 34 Minutes | 4 (2.6%) | 6 (6.3%) |
| 35 to 39 Minutes | 3 (1.9%) | 0 (0.0%) |
| 40 to 44 Minutes | 58 (37.7%) | 25 (26.3%) |
| 45 to 59 Minutes | 7 (4.5%) | 0 (0.0%) |
| 60 to 89 Minutes | 2 (1.3%) | 0 (0.0%) |
| 90 or more Minutes | 0 (0.0%) | 0 (0.0%) |
Time of Departure to Work by Sex in Royal
The most frequent times of departure to work in Royal are 5:30 AM to 5:59 AM (55, 35.7%) for males and 5:30 AM to 5:59 AM (21, 22.1%) for females.
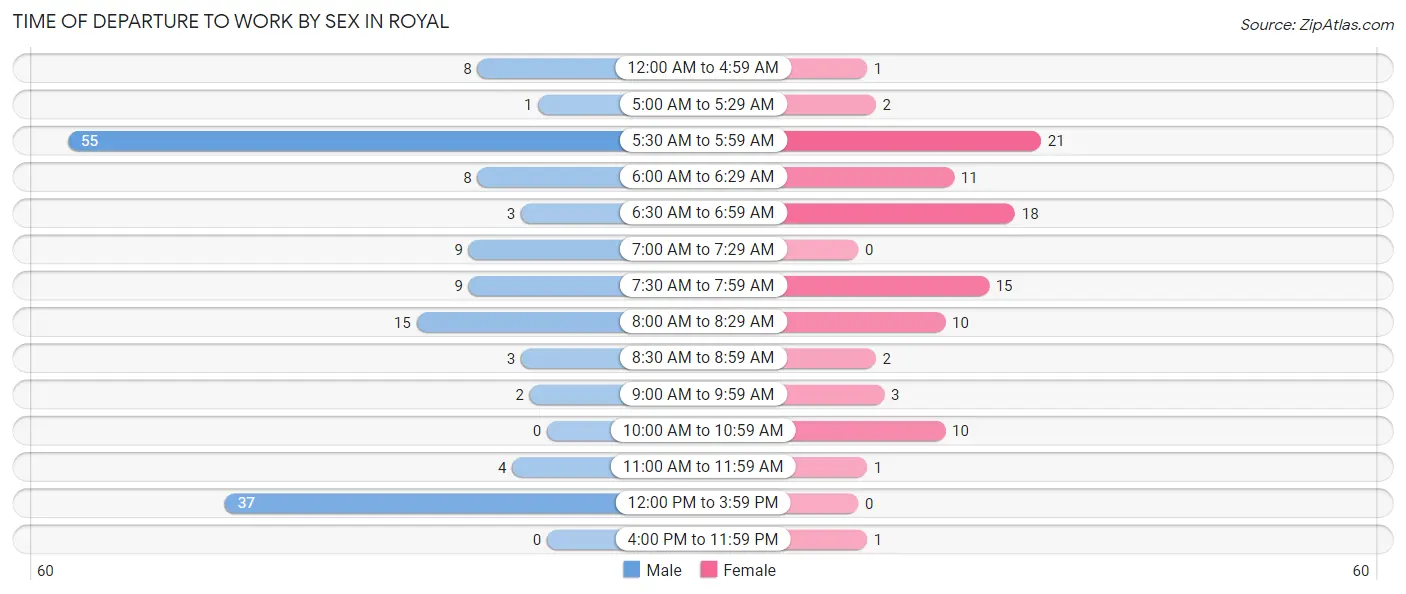
| Time of Departure | Male | Female |
| 12:00 AM to 4:59 AM | 8 (5.2%) | 1 (1.1%) |
| 5:00 AM to 5:29 AM | 1 (0.6%) | 2 (2.1%) |
| 5:30 AM to 5:59 AM | 55 (35.7%) | 21 (22.1%) |
| 6:00 AM to 6:29 AM | 8 (5.2%) | 11 (11.6%) |
| 6:30 AM to 6:59 AM | 3 (1.9%) | 18 (19.0%) |
| 7:00 AM to 7:29 AM | 9 (5.8%) | 0 (0.0%) |
| 7:30 AM to 7:59 AM | 9 (5.8%) | 15 (15.8%) |
| 8:00 AM to 8:29 AM | 15 (9.7%) | 10 (10.5%) |
| 8:30 AM to 8:59 AM | 3 (1.9%) | 2 (2.1%) |
| 9:00 AM to 9:59 AM | 2 (1.3%) | 3 (3.2%) |
| 10:00 AM to 10:59 AM | 0 (0.0%) | 10 (10.5%) |
| 11:00 AM to 11:59 AM | 4 (2.6%) | 1 (1.1%) |
| 12:00 PM to 3:59 PM | 37 (24.0%) | 0 (0.0%) |
| 4:00 PM to 11:59 PM | 0 (0.0%) | 1 (1.1%) |
| Total | 154 (100.0%) | 95 (100.0%) |
Housing Occupancy in Royal
Occupancy by Ownership in Royal
Of the total 212 dwellings in Royal, owner-occupied units account for 143 (67.4%), while renter-occupied units make up 69 (32.6%).
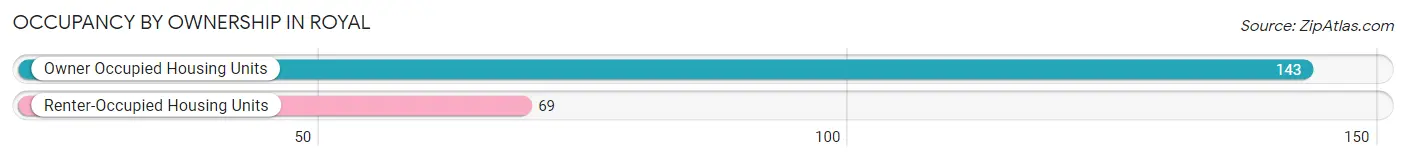
| Occupancy | # Housing Units | % Housing Units |
| Owner Occupied Housing Units | 143 | 67.4% |
| Renter-Occupied Housing Units | 69 | 32.6% |
| Total Occupied Housing Units | 212 | 100.0% |
Occupancy by Household Size in Royal
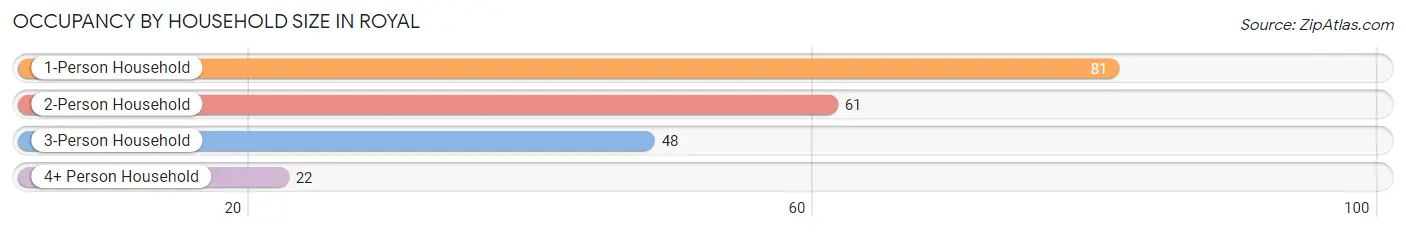
| Household Size | # Housing Units | % Housing Units |
| 1-Person Household | 81 | 38.2% |
| 2-Person Household | 61 | 28.8% |
| 3-Person Household | 48 | 22.6% |
| 4+ Person Household | 22 | 10.4% |
| Total Housing Units | 212 | 100.0% |
Occupancy by Ownership by Household Size in Royal
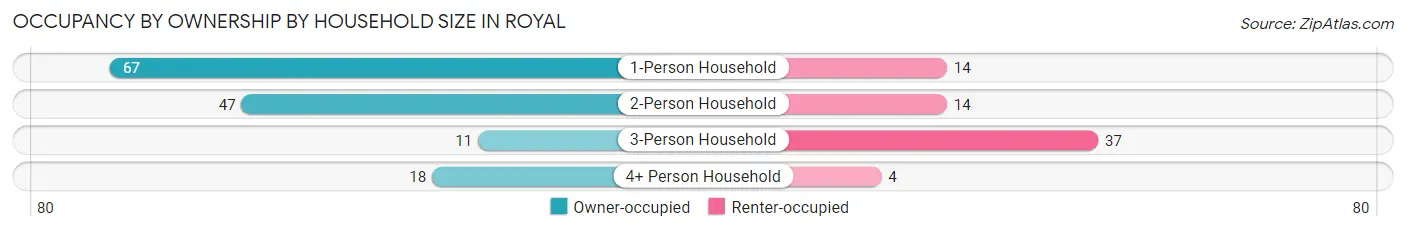
| Household Size | Owner-occupied | Renter-occupied |
| 1-Person Household | 67 (82.7%) | 14 (17.3%) |
| 2-Person Household | 47 (77.0%) | 14 (23.0%) |
| 3-Person Household | 11 (22.9%) | 37 (77.1%) |
| 4+ Person Household | 18 (81.8%) | 4 (18.2%) |
| Total Housing Units | 143 (67.4%) | 69 (32.6%) |
Occupancy by Educational Attainment in Royal
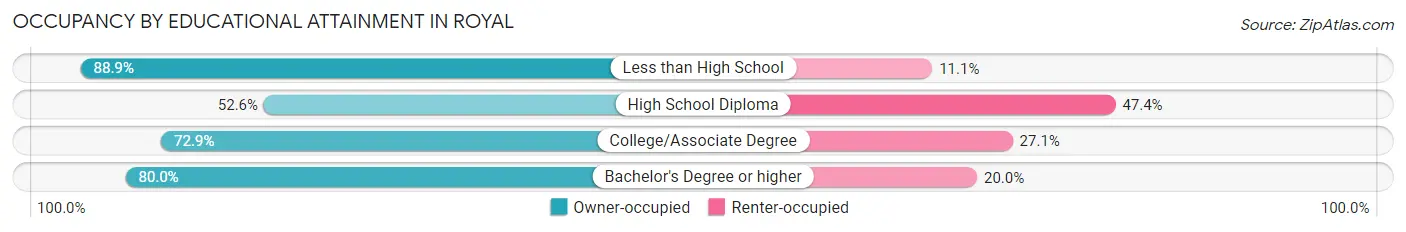
| Household Size | Owner-occupied | Renter-occupied |
| Less than High School | 8 (88.9%) | 1 (11.1%) |
| High School Diploma | 41 (52.6%) | 37 (47.4%) |
| College/Associate Degree | 62 (72.9%) | 23 (27.1%) |
| Bachelor's Degree or higher | 32 (80.0%) | 8 (20.0%) |
Occupancy by Age of Householder in Royal
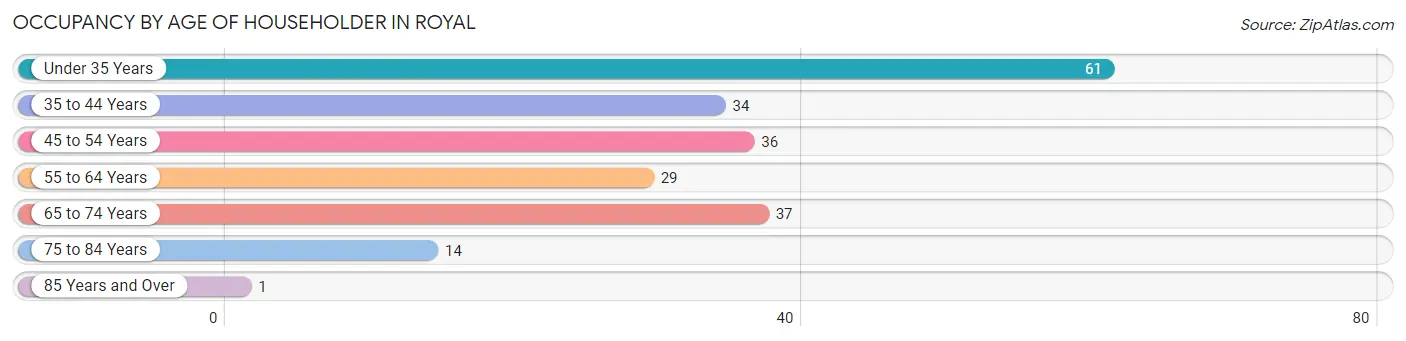
| Age Bracket | # Households | % Households |
| Under 35 Years | 61 | 28.8% |
| 35 to 44 Years | 34 | 16.0% |
| 45 to 54 Years | 36 | 17.0% |
| 55 to 64 Years | 29 | 13.7% |
| 65 to 74 Years | 37 | 17.4% |
| 75 to 84 Years | 14 | 6.6% |
| 85 Years and Over | 1 | 0.5% |
| Total | 212 | 100.0% |
Housing Finances in Royal
Median Income by Occupancy in Royal
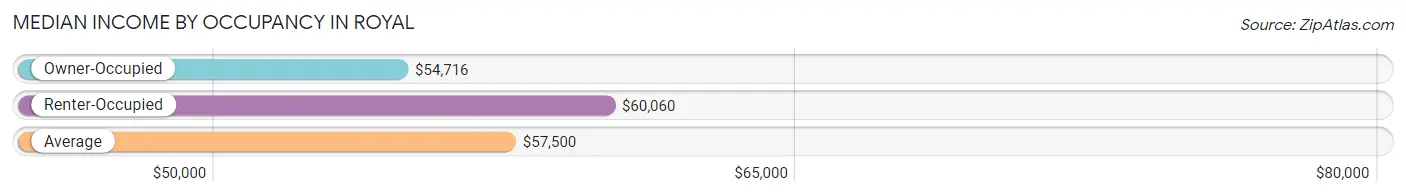
| Occupancy Type | # Households | Median Income |
| Owner-Occupied | 143 (67.4%) | $54,716 |
| Renter-Occupied | 69 (32.6%) | $60,060 |
| Average | 212 (100.0%) | $57,500 |
Occupancy by Householder Income Bracket in Royal
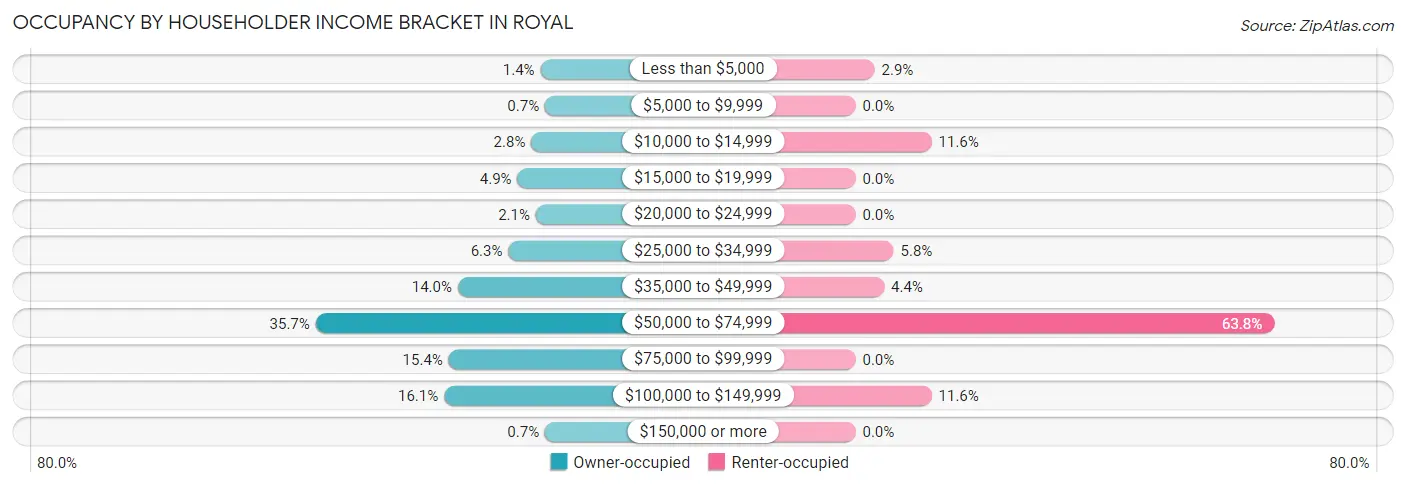
| Income Bracket | Owner-occupied | Renter-occupied |
| Less than $5,000 | 2 (1.4%) | 2 (2.9%) |
| $5,000 to $9,999 | 1 (0.7%) | 0 (0.0%) |
| $10,000 to $14,999 | 4 (2.8%) | 8 (11.6%) |
| $15,000 to $19,999 | 7 (4.9%) | 0 (0.0%) |
| $20,000 to $24,999 | 3 (2.1%) | 0 (0.0%) |
| $25,000 to $34,999 | 9 (6.3%) | 4 (5.8%) |
| $35,000 to $49,999 | 20 (14.0%) | 3 (4.3%) |
| $50,000 to $74,999 | 51 (35.7%) | 44 (63.8%) |
| $75,000 to $99,999 | 22 (15.4%) | 0 (0.0%) |
| $100,000 to $149,999 | 23 (16.1%) | 8 (11.6%) |
| $150,000 or more | 1 (0.7%) | 0 (0.0%) |
| Total | 143 (100.0%) | 69 (100.0%) |
Monthly Housing Cost Tiers in Royal
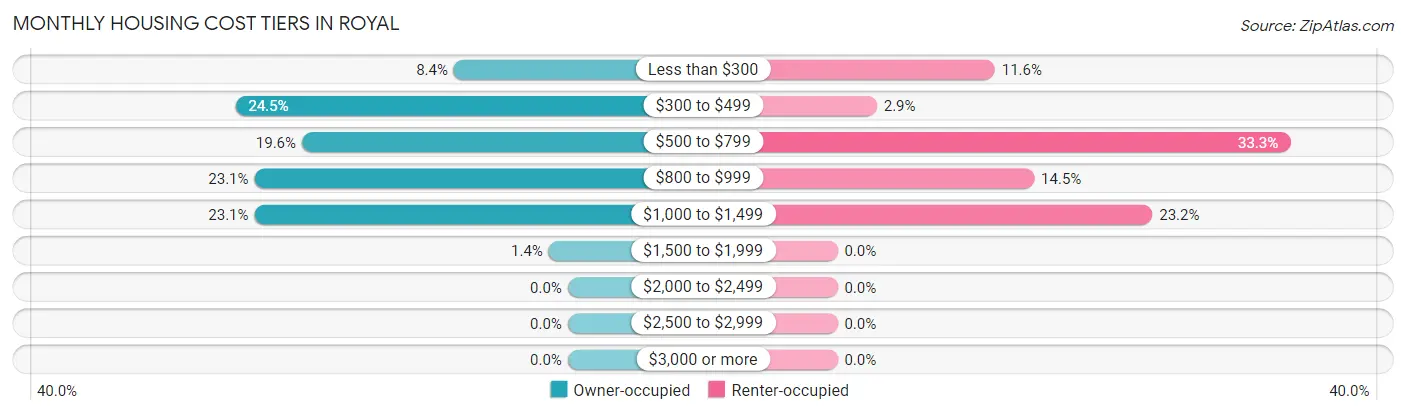
| Monthly Cost | Owner-occupied | Renter-occupied |
| Less than $300 | 12 (8.4%) | 8 (11.6%) |
| $300 to $499 | 35 (24.5%) | 2 (2.9%) |
| $500 to $799 | 28 (19.6%) | 23 (33.3%) |
| $800 to $999 | 33 (23.1%) | 10 (14.5%) |
| $1,000 to $1,499 | 33 (23.1%) | 16 (23.2%) |
| $1,500 to $1,999 | 2 (1.4%) | 0 (0.0%) |
| $2,000 to $2,499 | 0 (0.0%) | 0 (0.0%) |
| $2,500 to $2,999 | 0 (0.0%) | 0 (0.0%) |
| $3,000 or more | 0 (0.0%) | 0 (0.0%) |
| Total | 143 (100.0%) | 69 (100.0%) |
Physical Housing Characteristics in Royal
Housing Structures in Royal
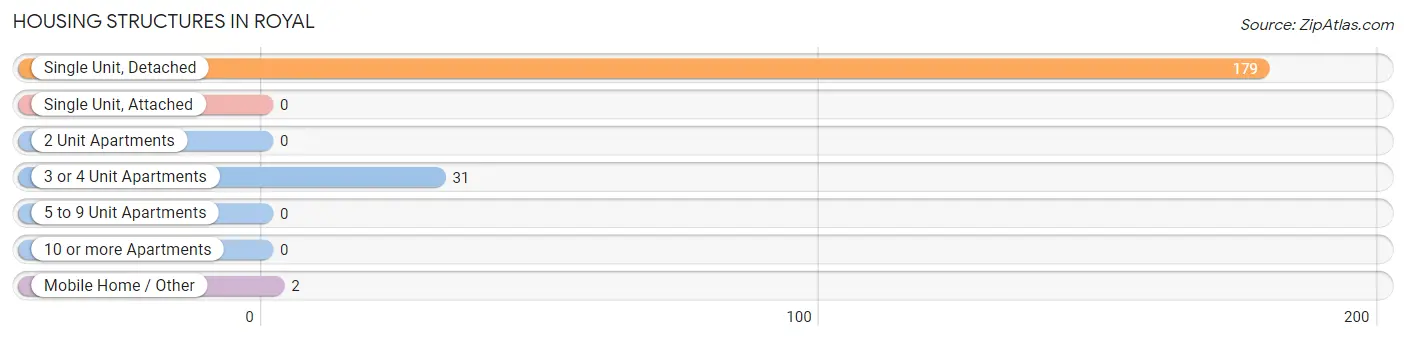
| Structure Type | # Housing Units | % Housing Units |
| Single Unit, Detached | 179 | 84.4% |
| Single Unit, Attached | 0 | 0.0% |
| 2 Unit Apartments | 0 | 0.0% |
| 3 or 4 Unit Apartments | 31 | 14.6% |
| 5 to 9 Unit Apartments | 0 | 0.0% |
| 10 or more Apartments | 0 | 0.0% |
| Mobile Home / Other | 2 | 0.9% |
| Total | 212 | 100.0% |
Housing Structures by Occupancy in Royal
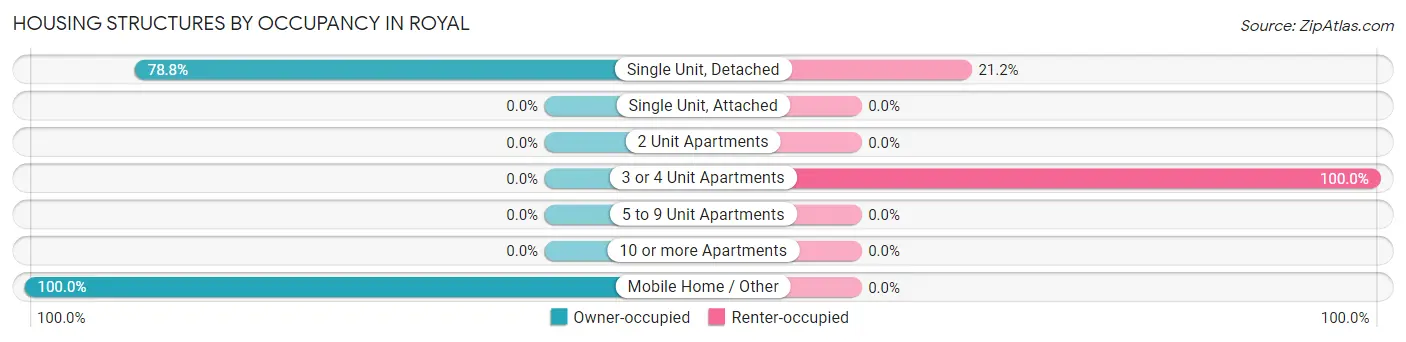
| Structure Type | Owner-occupied | Renter-occupied |
| Single Unit, Detached | 141 (78.8%) | 38 (21.2%) |
| Single Unit, Attached | 0 (0.0%) | 0 (0.0%) |
| 2 Unit Apartments | 0 (0.0%) | 0 (0.0%) |
| 3 or 4 Unit Apartments | 0 (0.0%) | 31 (100.0%) |
| 5 to 9 Unit Apartments | 0 (0.0%) | 0 (0.0%) |
| 10 or more Apartments | 0 (0.0%) | 0 (0.0%) |
| Mobile Home / Other | 2 (100.0%) | 0 (0.0%) |
| Total | 143 (67.4%) | 69 (32.6%) |
Housing Structures by Number of Rooms in Royal
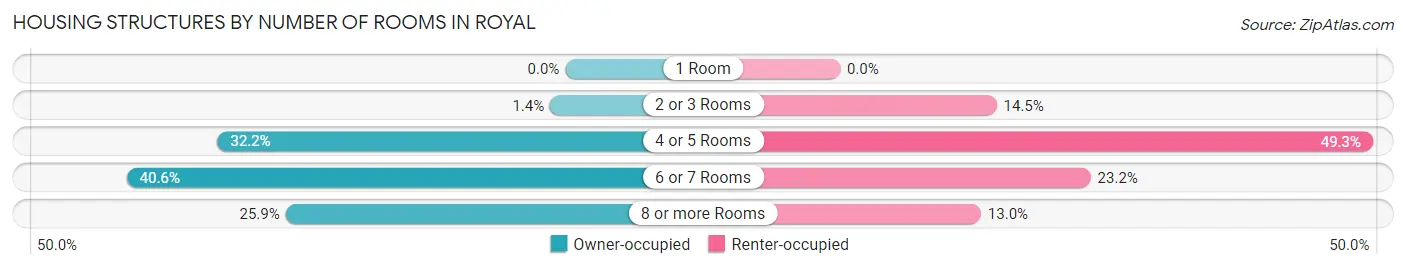
| Number of Rooms | Owner-occupied | Renter-occupied |
| 1 Room | 0 (0.0%) | 0 (0.0%) |
| 2 or 3 Rooms | 2 (1.4%) | 10 (14.5%) |
| 4 or 5 Rooms | 46 (32.2%) | 34 (49.3%) |
| 6 or 7 Rooms | 58 (40.6%) | 16 (23.2%) |
| 8 or more Rooms | 37 (25.9%) | 9 (13.0%) |
| Total | 143 (100.0%) | 69 (100.0%) |
Housing Structure by Heating Type in Royal
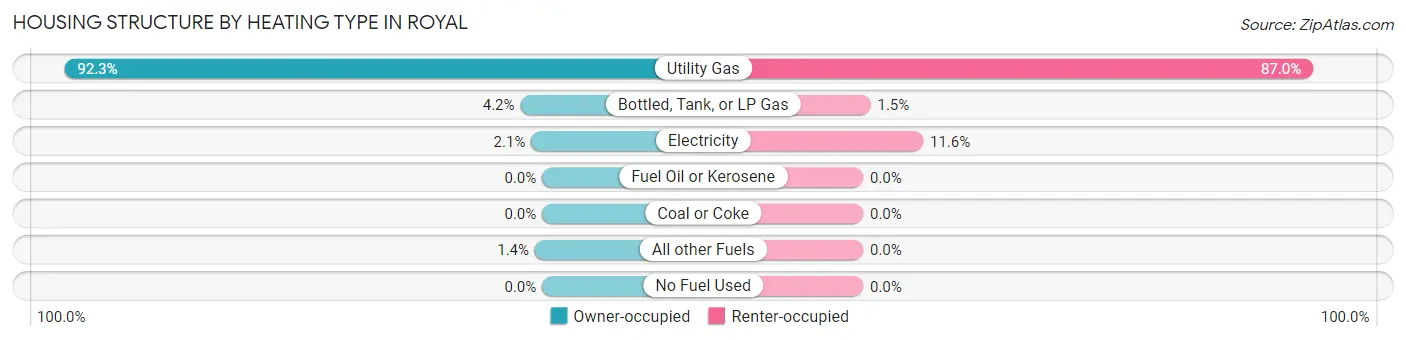
| Heating Type | Owner-occupied | Renter-occupied |
| Utility Gas | 132 (92.3%) | 60 (87.0%) |
| Bottled, Tank, or LP Gas | 6 (4.2%) | 1 (1.5%) |
| Electricity | 3 (2.1%) | 8 (11.6%) |
| Fuel Oil or Kerosene | 0 (0.0%) | 0 (0.0%) |
| Coal or Coke | 0 (0.0%) | 0 (0.0%) |
| All other Fuels | 2 (1.4%) | 0 (0.0%) |
| No Fuel Used | 0 (0.0%) | 0 (0.0%) |
| Total | 143 (100.0%) | 69 (100.0%) |
Household Vehicle Usage in Royal
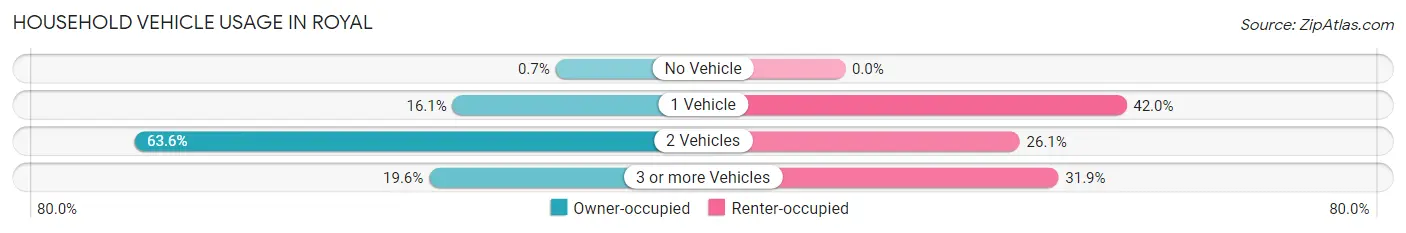
| Vehicles per Household | Owner-occupied | Renter-occupied |
| No Vehicle | 1 (0.7%) | 0 (0.0%) |
| 1 Vehicle | 23 (16.1%) | 29 (42.0%) |
| 2 Vehicles | 91 (63.6%) | 18 (26.1%) |
| 3 or more Vehicles | 28 (19.6%) | 22 (31.9%) |
| Total | 143 (100.0%) | 69 (100.0%) |
Real Estate & Mortgages in Royal
Real Estate and Mortgage Overview in Royal
| Characteristic | Without Mortgage | With Mortgage |
| Housing Units | 64 | 79 |
| Median Property Value | $76,400 | $80,900 |
| Median Household Income | $58,750 | $0 |
| Monthly Housing Costs | $421 | $0 |
| Real Estate Taxes | $1,065 | $0 |
Property Value by Mortgage Status in Royal
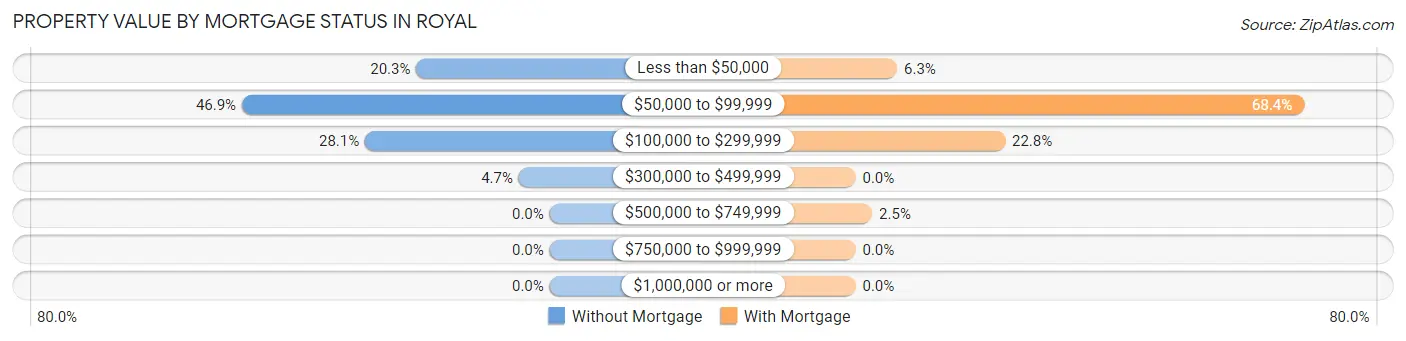
| Property Value | Without Mortgage | With Mortgage |
| Less than $50,000 | 13 (20.3%) | 5 (6.3%) |
| $50,000 to $99,999 | 30 (46.9%) | 54 (68.3%) |
| $100,000 to $299,999 | 18 (28.1%) | 18 (22.8%) |
| $300,000 to $499,999 | 3 (4.7%) | 0 (0.0%) |
| $500,000 to $749,999 | 0 (0.0%) | 2 (2.5%) |
| $750,000 to $999,999 | 0 (0.0%) | 0 (0.0%) |
| $1,000,000 or more | 0 (0.0%) | 0 (0.0%) |
| Total | 64 (100.0%) | 79 (100.0%) |
Household Income by Mortgage Status in Royal
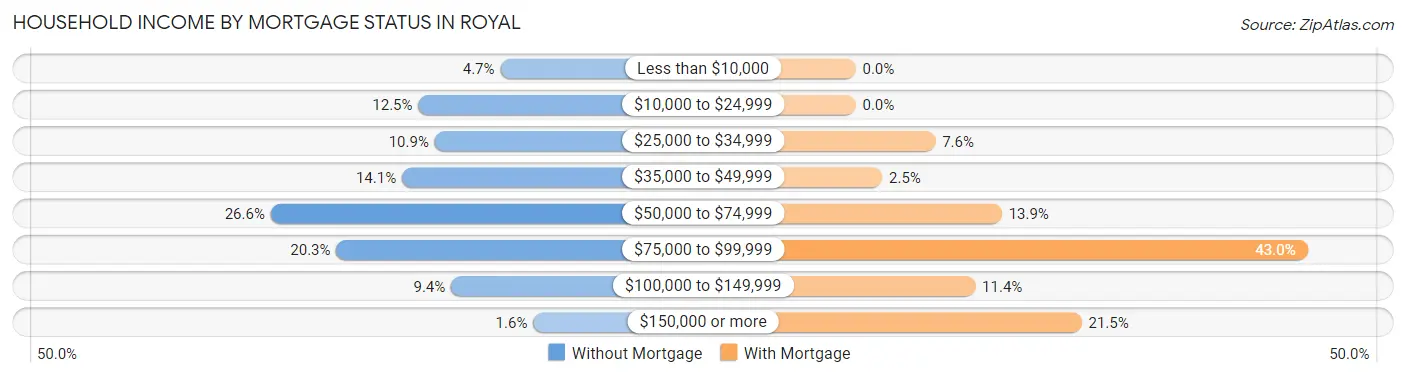
| Household Income | Without Mortgage | With Mortgage |
| Less than $10,000 | 3 (4.7%) | 0 (0.0%) |
| $10,000 to $24,999 | 8 (12.5%) | 0 (0.0%) |
| $25,000 to $34,999 | 7 (10.9%) | 6 (7.6%) |
| $35,000 to $49,999 | 9 (14.1%) | 2 (2.5%) |
| $50,000 to $74,999 | 17 (26.6%) | 11 (13.9%) |
| $75,000 to $99,999 | 13 (20.3%) | 34 (43.0%) |
| $100,000 to $149,999 | 6 (9.4%) | 9 (11.4%) |
| $150,000 or more | 1 (1.6%) | 17 (21.5%) |
| Total | 64 (100.0%) | 79 (100.0%) |
Property Value to Household Income Ratio in Royal
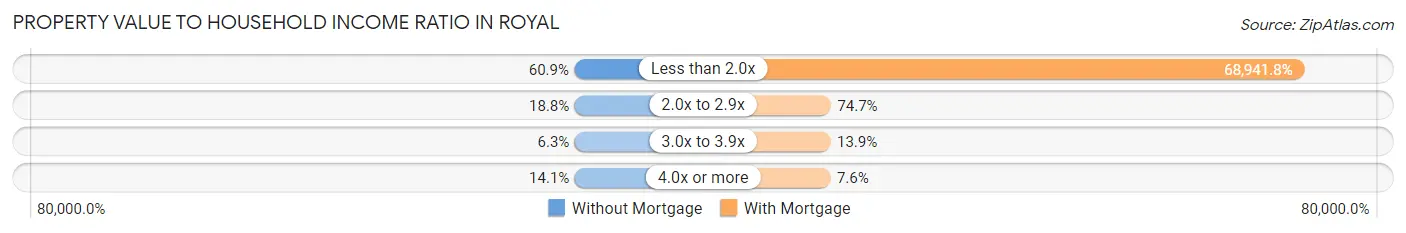
| Value-to-Income Ratio | Without Mortgage | With Mortgage |
| Less than 2.0x | 39 (60.9%) | 54,464 (68,941.8%) |
| 2.0x to 2.9x | 12 (18.8%) | 59 (74.7%) |
| 3.0x to 3.9x | 4 (6.2%) | 11 (13.9%) |
| 4.0x or more | 9 (14.1%) | 6 (7.6%) |
| Total | 64 (100.0%) | 79 (100.0%) |
Real Estate Taxes by Mortgage Status in Royal
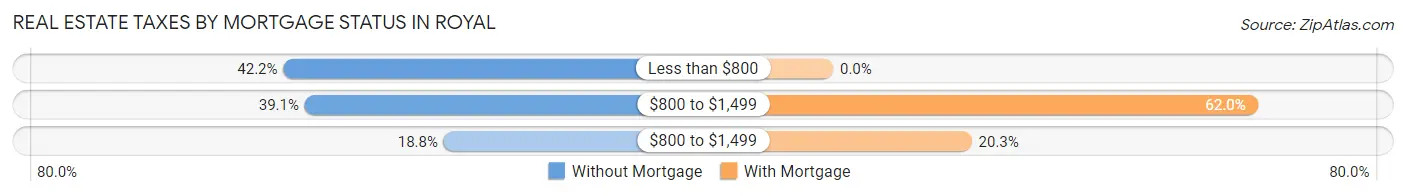
| Property Taxes | Without Mortgage | With Mortgage |
| Less than $800 | 27 (42.2%) | 0 (0.0%) |
| $800 to $1,499 | 25 (39.1%) | 49 (62.0%) |
| $800 to $1,499 | 12 (18.8%) | 16 (20.3%) |
| Total | 64 (100.0%) | 79 (100.0%) |
Health & Disability in Royal
Health Insurance Coverage by Age in Royal
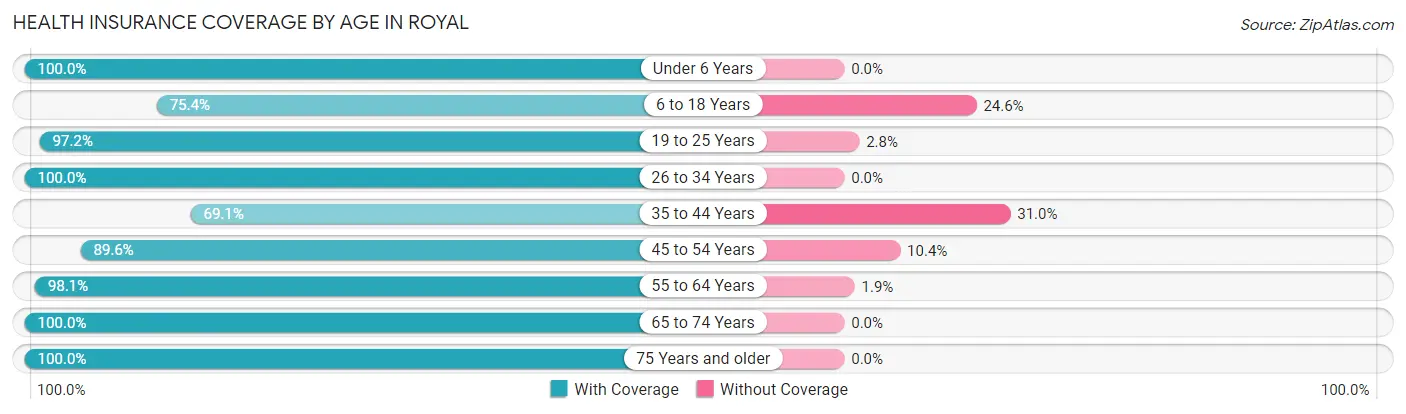
| Age Bracket | With Coverage | Without Coverage |
| Under 6 Years | 64 (100.0%) | 0 (0.0%) |
| 6 to 18 Years | 52 (75.4%) | 17 (24.6%) |
| 19 to 25 Years | 105 (97.2%) | 3 (2.8%) |
| 26 to 34 Years | 46 (100.0%) | 0 (0.0%) |
| 35 to 44 Years | 29 (69.1%) | 13 (30.9%) |
| 45 to 54 Years | 43 (89.6%) | 5 (10.4%) |
| 55 to 64 Years | 51 (98.1%) | 1 (1.9%) |
| 65 to 74 Years | 61 (100.0%) | 0 (0.0%) |
| 75 Years and older | 20 (100.0%) | 0 (0.0%) |
| Total | 471 (92.3%) | 39 (7.6%) |
Health Insurance Coverage by Citizenship Status in Royal
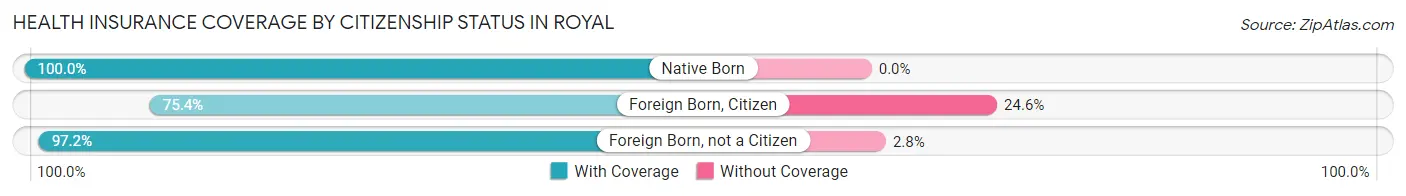
| Citizenship Status | With Coverage | Without Coverage |
| Native Born | 64 (100.0%) | 0 (0.0%) |
| Foreign Born, Citizen | 52 (75.4%) | 17 (24.6%) |
| Foreign Born, not a Citizen | 105 (97.2%) | 3 (2.8%) |
Health Insurance Coverage by Household Income in Royal
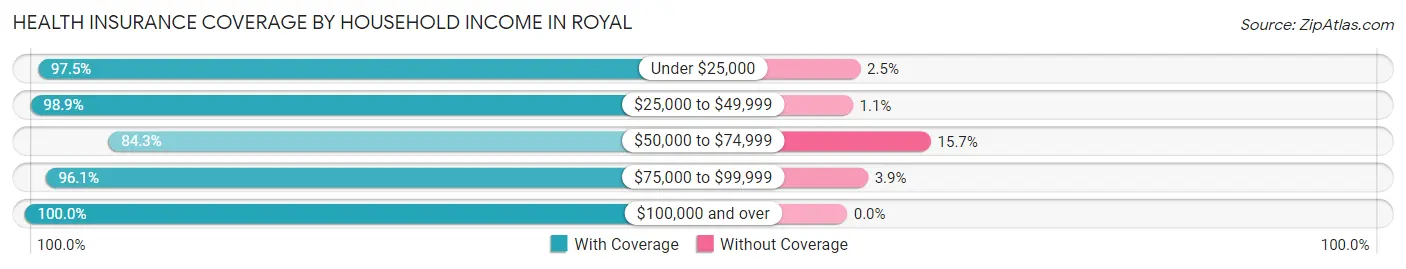
| Household Income | With Coverage | Without Coverage |
| Under $25,000 | 39 (97.5%) | 1 (2.5%) |
| $25,000 to $49,999 | 91 (98.9%) | 1 (1.1%) |
| $50,000 to $74,999 | 188 (84.3%) | 35 (15.7%) |
| $75,000 to $99,999 | 49 (96.1%) | 2 (3.9%) |
| $100,000 and over | 104 (100.0%) | 0 (0.0%) |
Public vs Private Health Insurance Coverage by Age in Royal
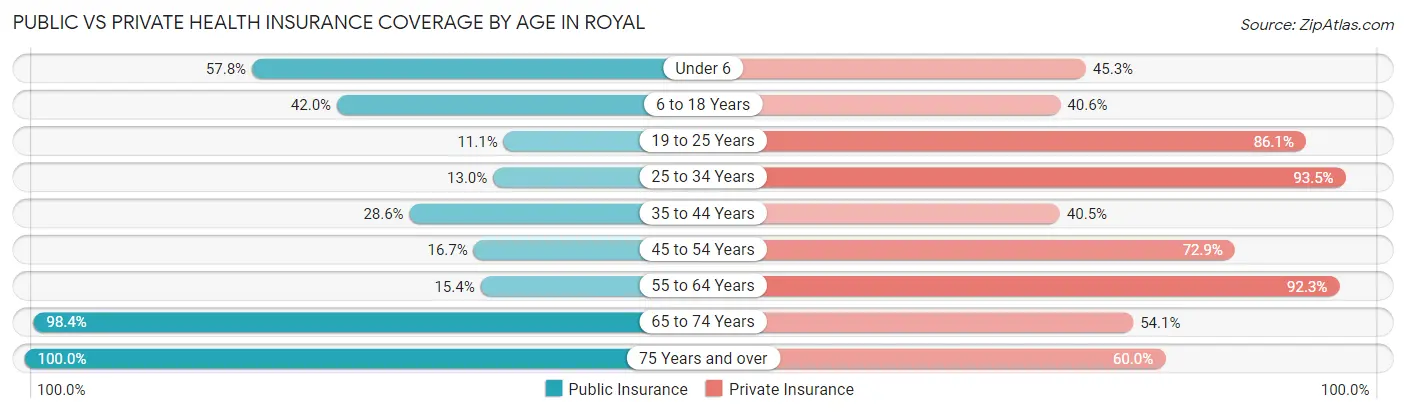
| Age Bracket | Public Insurance | Private Insurance |
| Under 6 | 37 (57.8%) | 29 (45.3%) |
| 6 to 18 Years | 29 (42.0%) | 28 (40.6%) |
| 19 to 25 Years | 12 (11.1%) | 93 (86.1%) |
| 25 to 34 Years | 6 (13.0%) | 43 (93.5%) |
| 35 to 44 Years | 12 (28.6%) | 17 (40.5%) |
| 45 to 54 Years | 8 (16.7%) | 35 (72.9%) |
| 55 to 64 Years | 8 (15.4%) | 48 (92.3%) |
| 65 to 74 Years | 60 (98.4%) | 33 (54.1%) |
| 75 Years and over | 20 (100.0%) | 12 (60.0%) |
| Total | 192 (37.7%) | 338 (66.3%) |
Disability Status by Sex by Age in Royal
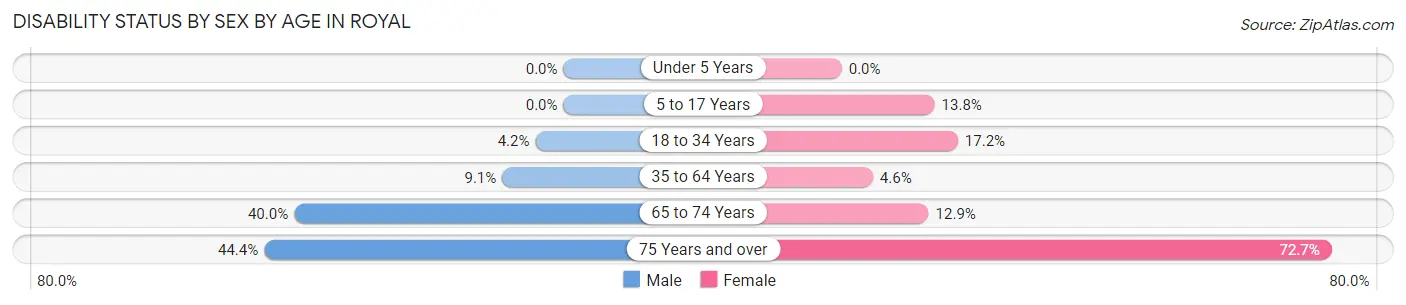
| Age Bracket | Male | Female |
| Under 5 Years | 0 (0.0%) | 0 (0.0%) |
| 5 to 17 Years | 0 (0.0%) | 4 (13.8%) |
| 18 to 34 Years | 4 (4.2%) | 10 (17.2%) |
| 35 to 64 Years | 7 (9.1%) | 3 (4.6%) |
| 65 to 74 Years | 12 (40.0%) | 4 (12.9%) |
| 75 Years and over | 4 (44.4%) | 8 (72.7%) |
Disability Class by Sex by Age in Royal
Disability Class: Hearing Difficulty
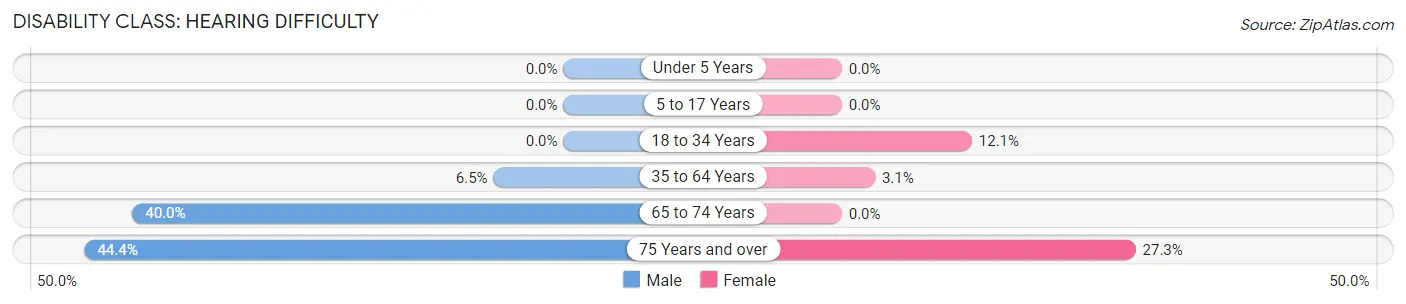
| Age Bracket | Male | Female |
| Under 5 Years | 0 (0.0%) | 0 (0.0%) |
| 5 to 17 Years | 0 (0.0%) | 0 (0.0%) |
| 18 to 34 Years | 0 (0.0%) | 7 (12.1%) |
| 35 to 64 Years | 5 (6.5%) | 2 (3.1%) |
| 65 to 74 Years | 12 (40.0%) | 0 (0.0%) |
| 75 Years and over | 4 (44.4%) | 3 (27.3%) |
Disability Class: Vision Difficulty
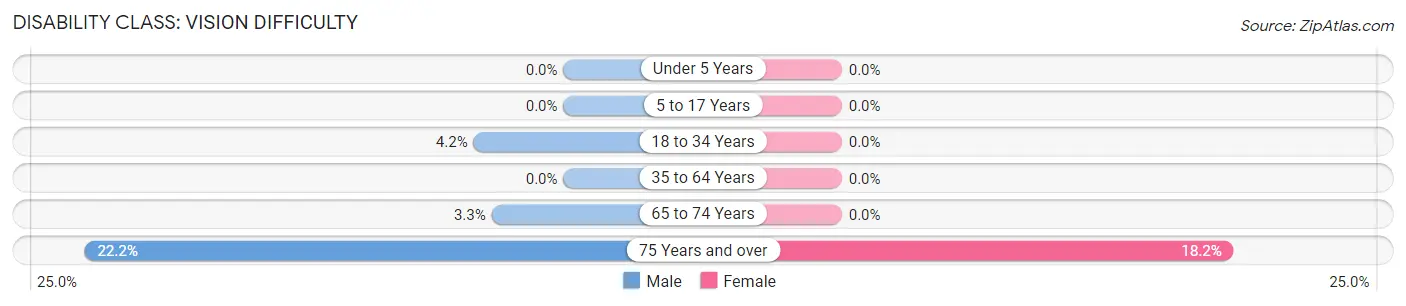
| Age Bracket | Male | Female |
| Under 5 Years | 0 (0.0%) | 0 (0.0%) |
| 5 to 17 Years | 0 (0.0%) | 0 (0.0%) |
| 18 to 34 Years | 4 (4.2%) | 0 (0.0%) |
| 35 to 64 Years | 0 (0.0%) | 0 (0.0%) |
| 65 to 74 Years | 1 (3.3%) | 0 (0.0%) |
| 75 Years and over | 2 (22.2%) | 2 (18.2%) |
Disability Class: Cognitive Difficulty
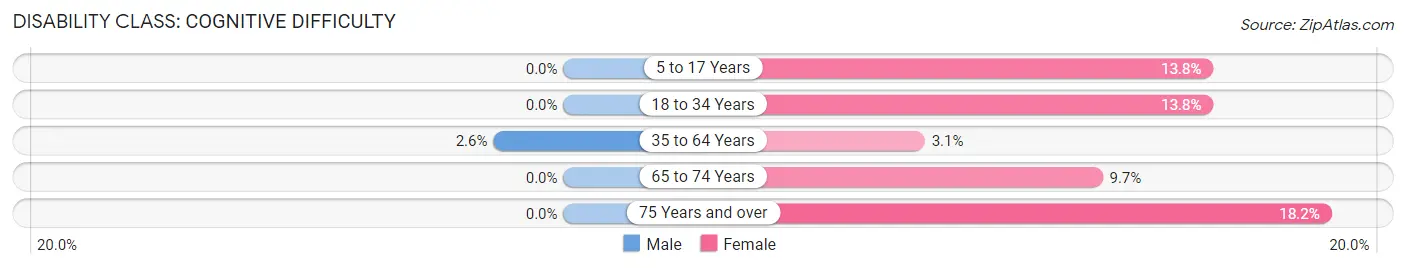
| Age Bracket | Male | Female |
| 5 to 17 Years | 0 (0.0%) | 4 (13.8%) |
| 18 to 34 Years | 0 (0.0%) | 8 (13.8%) |
| 35 to 64 Years | 2 (2.6%) | 2 (3.1%) |
| 65 to 74 Years | 0 (0.0%) | 3 (9.7%) |
| 75 Years and over | 0 (0.0%) | 2 (18.2%) |
Disability Class: Ambulatory Difficulty
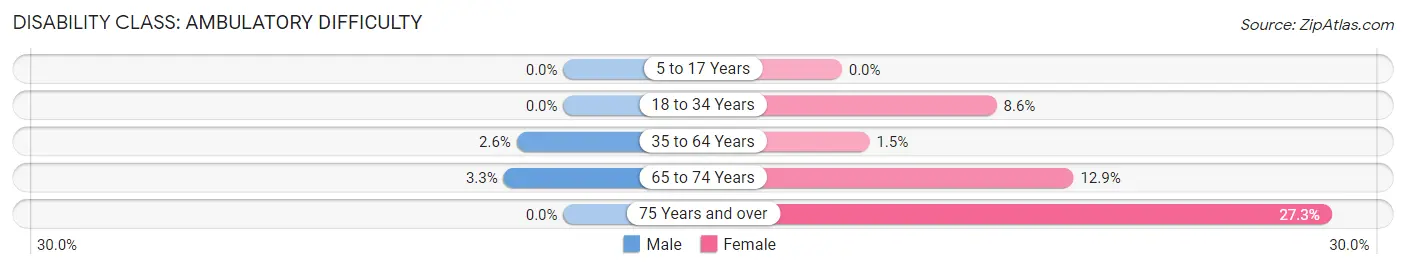
| Age Bracket | Male | Female |
| 5 to 17 Years | 0 (0.0%) | 0 (0.0%) |
| 18 to 34 Years | 0 (0.0%) | 5 (8.6%) |
| 35 to 64 Years | 2 (2.6%) | 1 (1.5%) |
| 65 to 74 Years | 1 (3.3%) | 4 (12.9%) |
| 75 Years and over | 0 (0.0%) | 3 (27.3%) |
Disability Class: Self-Care Difficulty
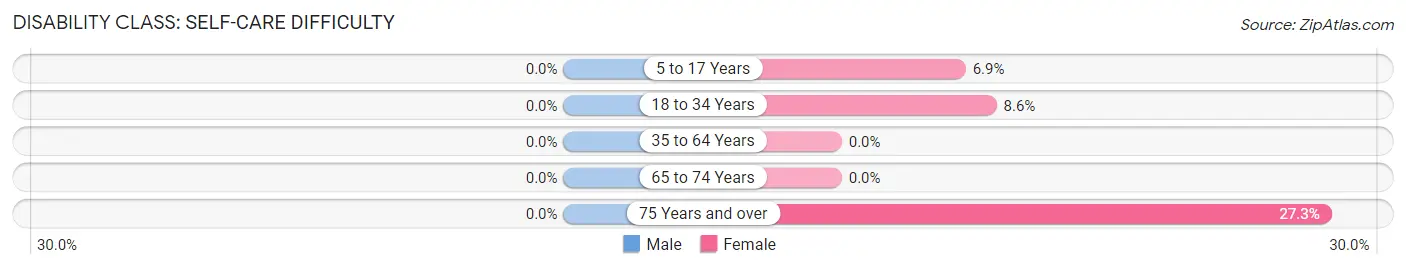
| Age Bracket | Male | Female |
| 5 to 17 Years | 0 (0.0%) | 2 (6.9%) |
| 18 to 34 Years | 0 (0.0%) | 5 (8.6%) |
| 35 to 64 Years | 0 (0.0%) | 0 (0.0%) |
| 65 to 74 Years | 0 (0.0%) | 0 (0.0%) |
| 75 Years and over | 0 (0.0%) | 3 (27.3%) |
Technology Access in Royal
Computing Device Access in Royal
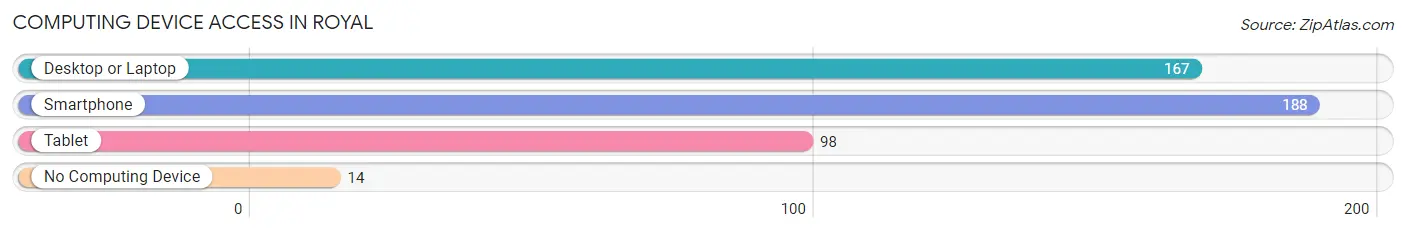
| Device Type | # Households | % Households |
| Desktop or Laptop | 167 | 78.8% |
| Smartphone | 188 | 88.7% |
| Tablet | 98 | 46.2% |
| No Computing Device | 14 | 6.6% |
| Total | 212 | 100.0% |
Internet Access in Royal
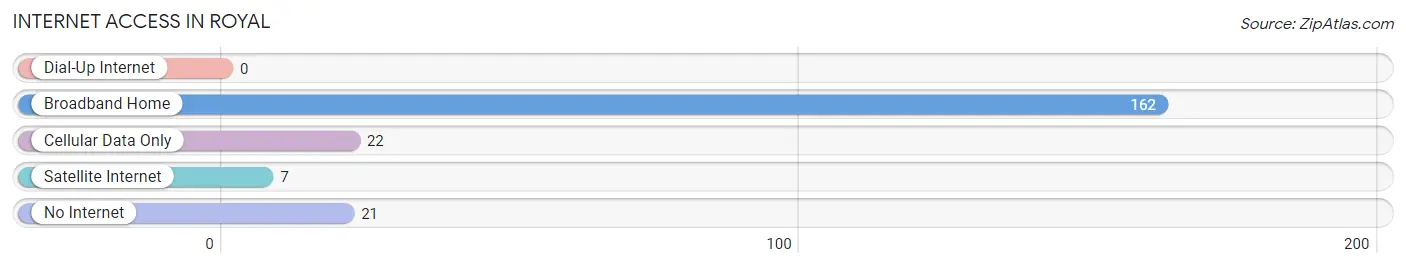
| Internet Type | # Households | % Households |
| Dial-Up Internet | 0 | 0.0% |
| Broadband Home | 162 | 76.4% |
| Cellular Data Only | 22 | 10.4% |
| Satellite Internet | 7 | 3.3% |
| No Internet | 21 | 9.9% |
| Total | 212 | 100.0% |
Royal Summary
Royal, Iowa is a small city located in the southwestern corner of the state, in the county of Pottawattamie. It is situated on the banks of the Missouri River, and is part of the Omaha-Council Bluffs metropolitan area. The city has a population of approximately 1,400 people, and is home to a variety of businesses, including a large manufacturing plant.
History
The area that is now Royal, Iowa was first settled in the early 1800s by settlers from the United States and Canada. The first settlers were mostly of German and Irish descent, and the area was known as “Royal” due to the presence of a large number of Royal families in the area. The town was officially incorporated in 1875, and the first post office was established in 1876.
In the late 1800s, Royal was a thriving agricultural community, with a variety of crops being grown in the area. The town was also home to a number of businesses, including a flour mill, a sawmill, and a brickyard.
In the early 1900s, Royal began to experience a period of growth and development. The town was connected to the rest of the state by the Chicago, Rock Island and Pacific Railroad, and a number of new businesses were established in the area. In the 1920s, a large manufacturing plant was built in Royal, and the town began to experience a period of economic prosperity.
Geography
Royal is located in the southwestern corner of Iowa, in the county of Pottawattamie. The city is situated on the banks of the Missouri River, and is part of the Omaha-Council Bluffs metropolitan area. The city has a total area of 1.3 square miles, all of which is land.
The climate in Royal is classified as humid continental, with hot summers and cold winters. The average annual temperature is around 50 degrees Fahrenheit, and the average annual precipitation is around 30 inches.
Economy
The economy of Royal is largely based on manufacturing and agriculture. The city is home to a large manufacturing plant, which produces a variety of products, including automotive parts, furniture, and electronics. The city is also home to a number of agricultural businesses, including dairy farms, grain elevators, and feed mills.
In addition to manufacturing and agriculture, Royal is also home to a variety of other businesses, including retail stores, restaurants, and hotels. The city is also home to a number of government offices, including the Pottawattamie County Courthouse.
Demographics
As of the 2010 census, the population of Royal was 1,400 people. The racial makeup of the city was 97.3% White, 0.7% African American, 0.3% Native American, 0.3% Asian, and 1.4% from other races. The median household income in Royal was $41,250, and the median family income was $50,000. The per capita income in Royal was $20,000.
Common Questions
What is Per Capita Income in Royal?
Per Capita income in Royal is $26,466.
What is the Median Family Income in Royal?
Median Family Income in Royal is $74,167.
What is the Median Household income in Royal?
Median Household Income in Royal is $57,500.
What is Income or Wage Gap in Royal?
Income or Wage Gap in Royal is 46.7%.
Women in Royal earn 53.3 cents for every dollar earned by a man.
What is Family Income Deficit in Royal?
Family Income Deficit in Royal is $6,200.
Families that are below poverty line in Royal earn $6,200 less on average than the poverty threshold level.
What is Inequality or Gini Index in Royal?
Inequality or Gini Index in Royal is 0.29.
What is the Total Population of Royal?
Total Population of Royal is 510.
What is the Total Male Population of Royal?
Total Male Population of Royal is 268.
What is the Total Female Population of Royal?
Total Female Population of Royal is 242.
What is the Ratio of Males per 100 Females in Royal?
There are 110.74 Males per 100 Females in Royal.
What is the Ratio of Females per 100 Males in Royal?
There are 90.30 Females per 100 Males in Royal.
What is the Median Population Age in Royal?
Median Population Age in Royal is 29.5 Years.
What is the Average Family Size in Royal
Average Family Size in Royal is 3.2 People.
What is the Average Household Size in Royal
Average Household Size in Royal is 2.4 People.
How Large is the Labor Force in Royal?
There are 282 People in the Labor Forcein in Royal.
What is the Percentage of People in the Labor Force in Royal?
73.6% of People are in the Labor Force in Royal.
What is the Unemployment Rate in Royal?
Unemployment Rate in Royal is 3.5%.