Rock Rapids, IA Map & Demographics
Rock Rapids Map
Rock Rapids Overview
$30,853
PER CAPITA INCOME
$77,464
AVG FAMILY INCOME
$67,625
AVG HOUSEHOLD INCOME
27.8%
WAGE / INCOME GAP [ % ]
72.2¢/ $1
WAGE / INCOME GAP [ $ ]
0.38
INEQUALITY / GINI INDEX
2,631
TOTAL POPULATION
1,425
MALE POPULATION
1,206
FEMALE POPULATION
118.16
MALES / 100 FEMALES
84.63
FEMALES / 100 MALES
40.6
MEDIAN AGE
3.3
AVG FAMILY SIZE
2.7
AVG HOUSEHOLD SIZE
1,210
LABOR FORCE [ PEOPLE ]
63.1%
PERCENT IN LABOR FORCE
4.1%
UNEMPLOYMENT RATE
Rock Rapids Zip Codes
Rock Rapids Area Codes
Income in Rock Rapids
Income Overview in Rock Rapids
Per Capita Income in Rock Rapids is $30,853, while median incomes of families and households are $77,464 and $67,625 respectively.
| Characteristic | Number | Measure |
| Per Capita Income | 2,631 | $30,853 |
| Median Family Income | 669 | $77,464 |
| Mean Family Income | 669 | $95,674 |
| Median Household Income | 950 | $67,625 |
| Mean Household Income | 950 | $81,589 |
| Income Deficit | 669 | $0 |
| Wage / Income Gap (%) | 2,631 | 27.78% |
| Wage / Income Gap ($) | 2,631 | 72.22¢ per $1 |
| Gini / Inequality Index | 2,631 | 0.38 |
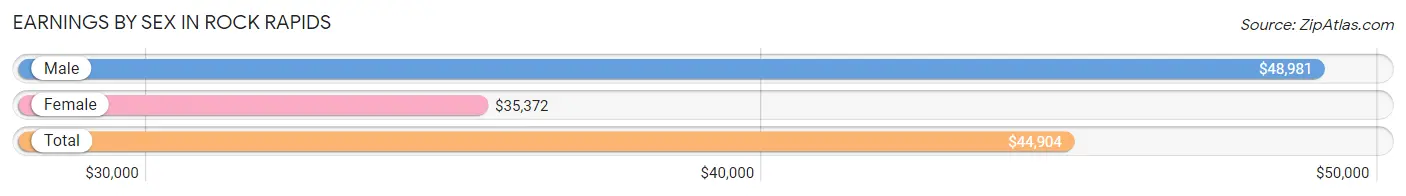
Earnings by Sex in Rock Rapids
Average Earnings in Rock Rapids are $44,904, $48,981 for men and $35,372 for women, a difference of 27.8%.
| Sex | Number | Average Earnings |
| Male | 682 (52.9%) | $48,981 |
| Female | 606 (47.0%) | $35,372 |
| Total | 1,288 (100.0%) | $44,904 |
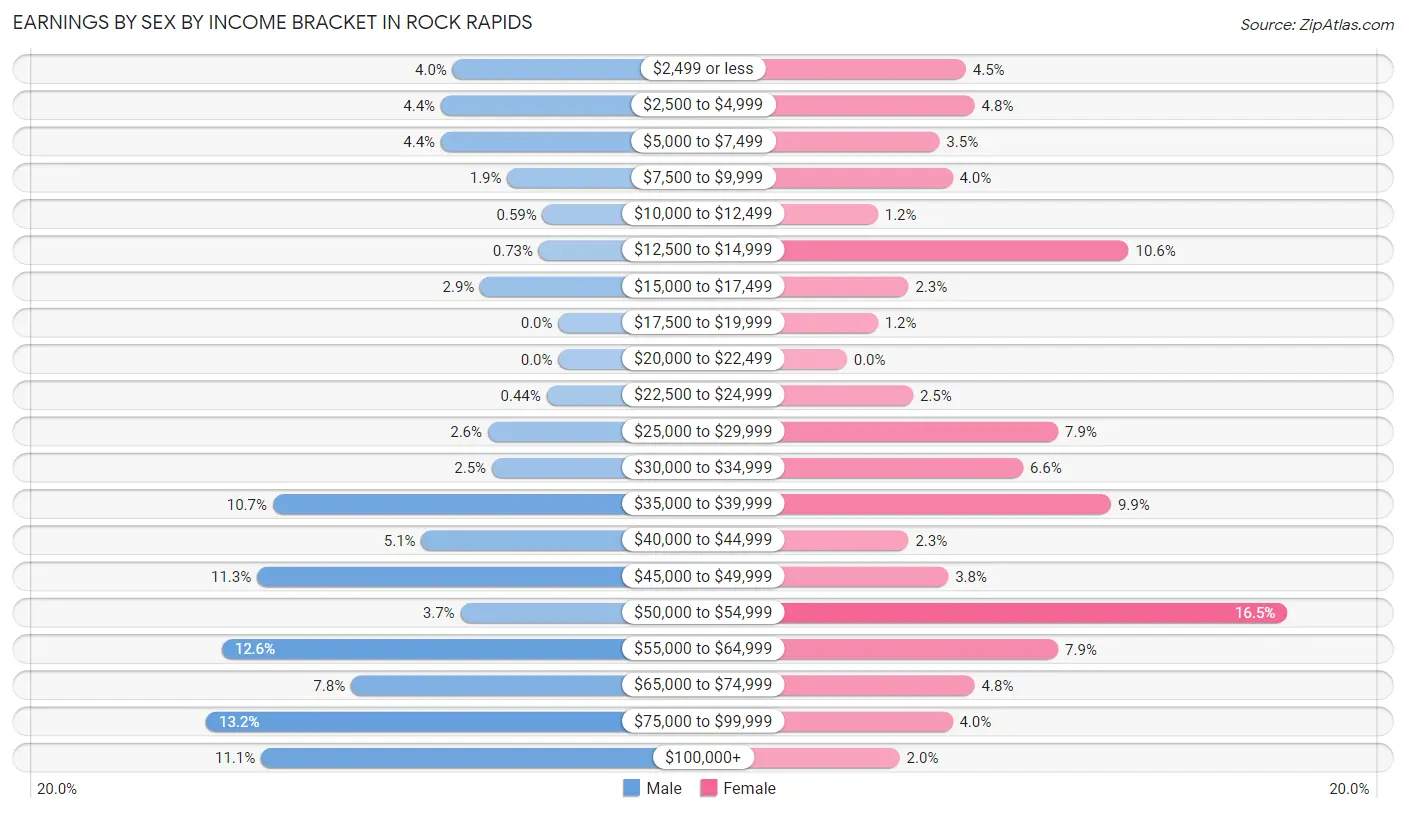
Earnings by Sex by Income Bracket in Rock Rapids
The most common earnings brackets in Rock Rapids are $75,000 to $99,999 for men (90 | 13.2%) and $50,000 to $54,999 for women (100 | 16.5%).
| Income | Male | Female |
| $2,499 or less | 27 (4.0%) | 27 (4.5%) |
| $2,500 to $4,999 | 30 (4.4%) | 29 (4.8%) |
| $5,000 to $7,499 | 30 (4.4%) | 21 (3.5%) |
| $7,500 to $9,999 | 13 (1.9%) | 24 (4.0%) |
| $10,000 to $12,499 | 4 (0.6%) | 7 (1.2%) |
| $12,500 to $14,999 | 5 (0.7%) | 64 (10.6%) |
| $15,000 to $17,499 | 20 (2.9%) | 14 (2.3%) |
| $17,500 to $19,999 | 0 (0.0%) | 7 (1.2%) |
| $20,000 to $22,499 | 0 (0.0%) | 0 (0.0%) |
| $22,500 to $24,999 | 3 (0.4%) | 15 (2.5%) |
| $25,000 to $29,999 | 18 (2.6%) | 48 (7.9%) |
| $30,000 to $34,999 | 17 (2.5%) | 40 (6.6%) |
| $35,000 to $39,999 | 73 (10.7%) | 60 (9.9%) |
| $40,000 to $44,999 | 35 (5.1%) | 14 (2.3%) |
| $45,000 to $49,999 | 77 (11.3%) | 23 (3.8%) |
| $50,000 to $54,999 | 25 (3.7%) | 100 (16.5%) |
| $55,000 to $64,999 | 86 (12.6%) | 48 (7.9%) |
| $65,000 to $74,999 | 53 (7.8%) | 29 (4.8%) |
| $75,000 to $99,999 | 90 (13.2%) | 24 (4.0%) |
| $100,000+ | 76 (11.1%) | 12 (2.0%) |
| Total | 682 (100.0%) | 606 (100.0%) |
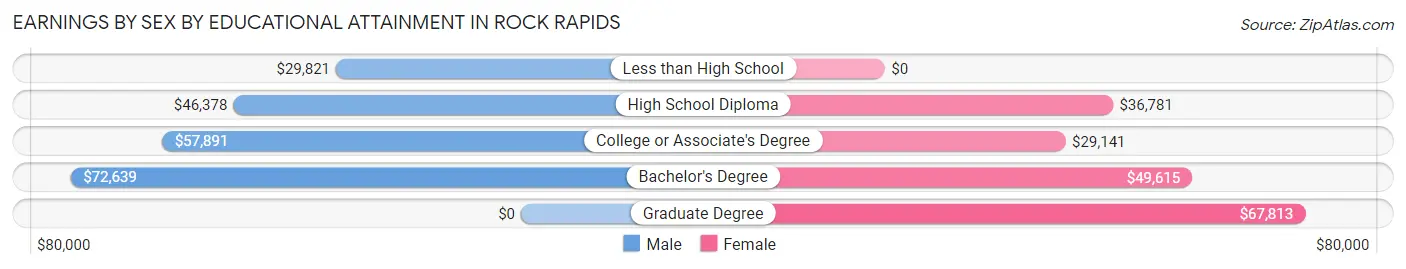
Earnings by Sex by Educational Attainment in Rock Rapids
Average earnings in Rock Rapids are $54,485 for men and $37,500 for women, a difference of 31.2%. Men with an educational attainment of bachelor's degree enjoy the highest average annual earnings of $72,639, while those with less than high school education earn the least with $29,821. Women with an educational attainment of graduate degree earn the most with the average annual earnings of $67,813, while those with college or associate's degree education have the smallest earnings of $29,141.
| Educational Attainment | Male Income | Female Income |
| Less than High School | $29,821 | $0 |
| High School Diploma | $46,378 | $36,781 |
| College or Associate's Degree | $57,891 | $29,141 |
| Bachelor's Degree | $72,639 | $49,615 |
| Graduate Degree | - | - |
| Total | $54,485 | $37,500 |
Family Income in Rock Rapids
Family Income Brackets in Rock Rapids
According to the Rock Rapids family income data, there are 181 families falling into the $100,000 to $149,999 income range, which is the most common income bracket and makes up 27.1% of all families.
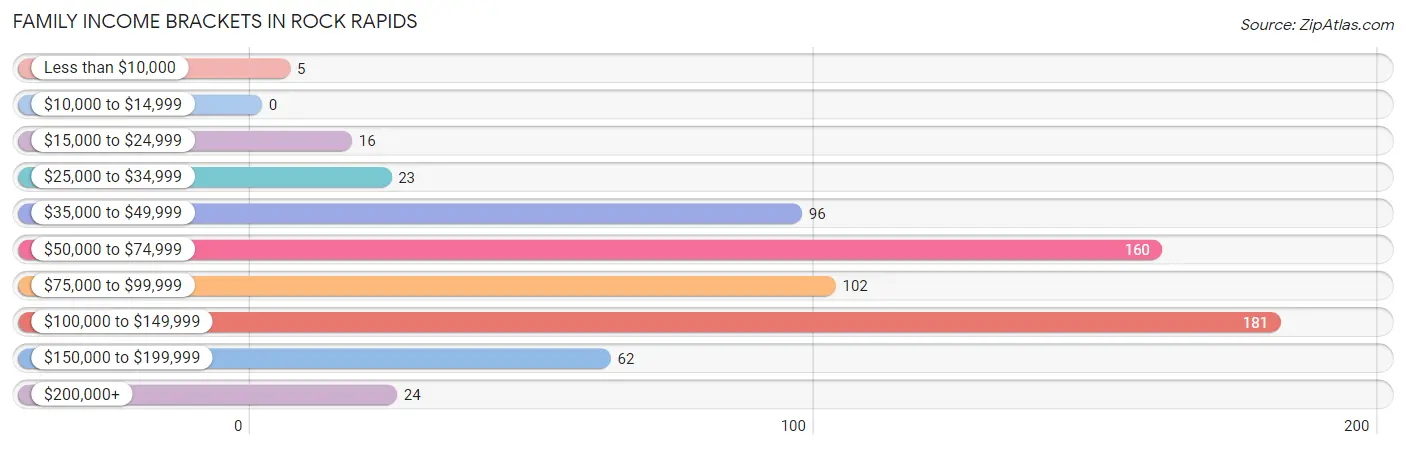
| Income Bracket | # Families | % Families |
| Less than $10,000 | 5 | 0.7% |
| $10,000 to $14,999 | 0 | 0.0% |
| $15,000 to $24,999 | 16 | 2.4% |
| $25,000 to $34,999 | 23 | 3.4% |
| $35,000 to $49,999 | 96 | 14.3% |
| $50,000 to $74,999 | 160 | 23.9% |
| $75,000 to $99,999 | 102 | 15.2% |
| $100,000 to $149,999 | 181 | 27.1% |
| $150,000 to $199,999 | 62 | 9.3% |
| $200,000+ | 24 | 3.6% |
Family Income by Famaliy Size in Rock Rapids
6-person families (30 | 4.5%) account for the highest median family income in Rock Rapids with $157,045 per family, while 2-person families (340 | 50.8%) have the highest median income of $33,625 per family member.
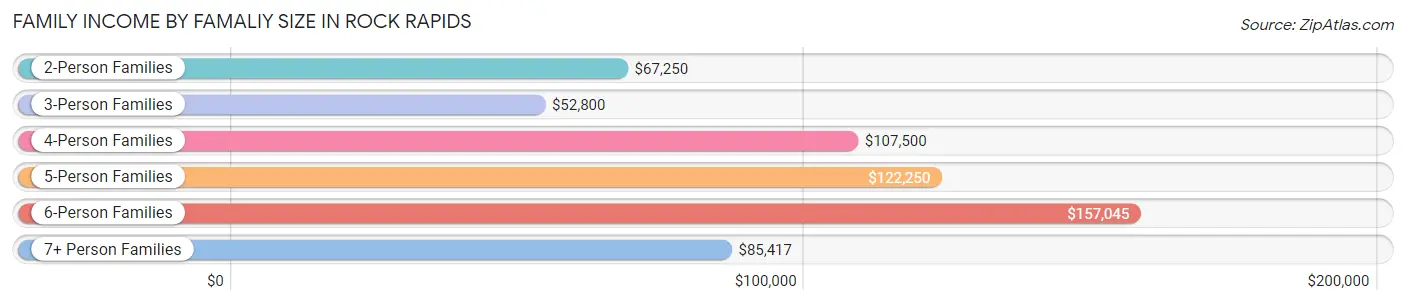
| Income Bracket | # Families | Median Income |
| 2-Person Families | 340 (50.8%) | $67,250 |
| 3-Person Families | 100 (14.9%) | $52,800 |
| 4-Person Families | 120 (17.9%) | $107,500 |
| 5-Person Families | 59 (8.8%) | $122,250 |
| 6-Person Families | 30 (4.5%) | $157,045 |
| 7+ Person Families | 20 (3.0%) | $85,417 |
| Total | 669 (100.0%) | $77,464 |
Family Income by Number of Earners in Rock Rapids
The median family income in Rock Rapids is $77,464, with families comprising 3+ earners (40) having the highest median family income of $129,583, while families with no earners (118) have the lowest median family income of $50,227, accounting for 6.0% and 17.6% of families, respectively.
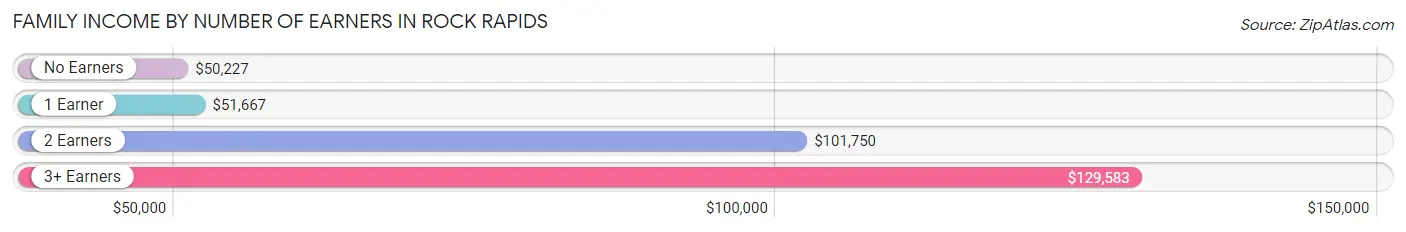
| Number of Earners | # Families | Median Income |
| No Earners | 118 (17.6%) | $50,227 |
| 1 Earner | 172 (25.7%) | $51,667 |
| 2 Earners | 339 (50.7%) | $101,750 |
| 3+ Earners | 40 (6.0%) | $129,583 |
| Total | 669 (100.0%) | $77,464 |
Household Income in Rock Rapids
Household Income Brackets in Rock Rapids
With 218 households falling in the category, the $50,000 to $74,999 income range is the most frequent in Rock Rapids, accounting for 23.0% of all households. In contrast, only 15 households (1.6%) fall into the less than $10,000 income bracket, making it the least populous group.
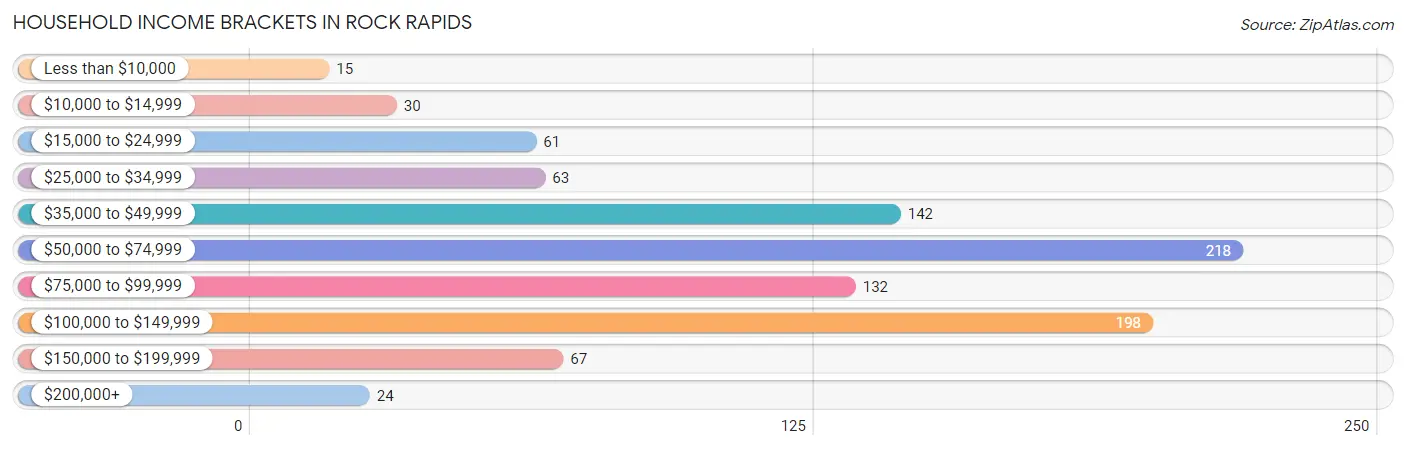
| Income Bracket | # Households | % Households |
| Less than $10,000 | 15 | 1.6% |
| $10,000 to $14,999 | 30 | 3.2% |
| $15,000 to $24,999 | 61 | 6.4% |
| $25,000 to $34,999 | 63 | 6.6% |
| $35,000 to $49,999 | 142 | 14.9% |
| $50,000 to $74,999 | 218 | 22.9% |
| $75,000 to $99,999 | 132 | 13.9% |
| $100,000 to $149,999 | 198 | 20.8% |
| $150,000 to $199,999 | 67 | 7.1% |
| $200,000+ | 24 | 2.5% |
Household Income by Householder Age in Rock Rapids
The median household income in Rock Rapids is $67,625, with the highest median household income of $95,000 found in the 45 to 64 years age bracket for the primary householder. A total of 308 households (32.4%) fall into this category. Meanwhile, the 15 to 24 years age bracket for the primary householder has the lowest median household income of $0, with 8 households (0.8%) in this group.
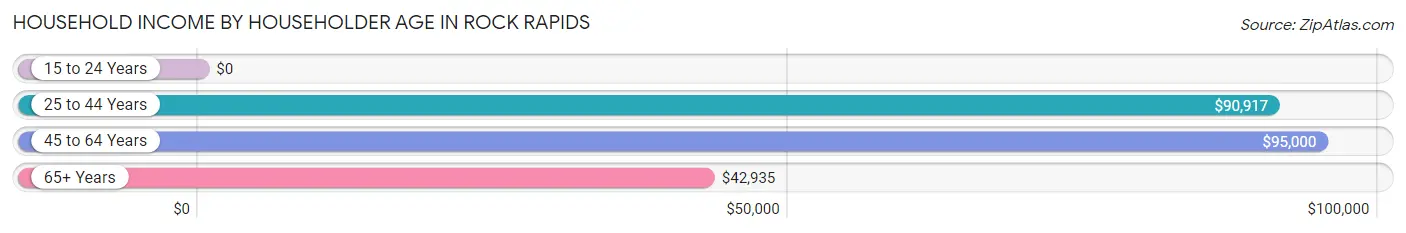
| Income Bracket | # Households | Median Income |
| 15 to 24 Years | 8 (0.8%) | $0 |
| 25 to 44 Years | 314 (33.1%) | $90,917 |
| 45 to 64 Years | 308 (32.4%) | $95,000 |
| 65+ Years | 320 (33.7%) | $42,935 |
| Total | 950 (100.0%) | $67,625 |
Poverty in Rock Rapids
Income Below Poverty by Sex and Age in Rock Rapids
With 1.4% poverty level for males and 3.7% for females among the residents of Rock Rapids, 75 year old and over males and 25 to 34 year old females are the most vulnerable to poverty, with 6 males (8.0%) and 8 females (17.4%) in their respective age groups living below the poverty level.
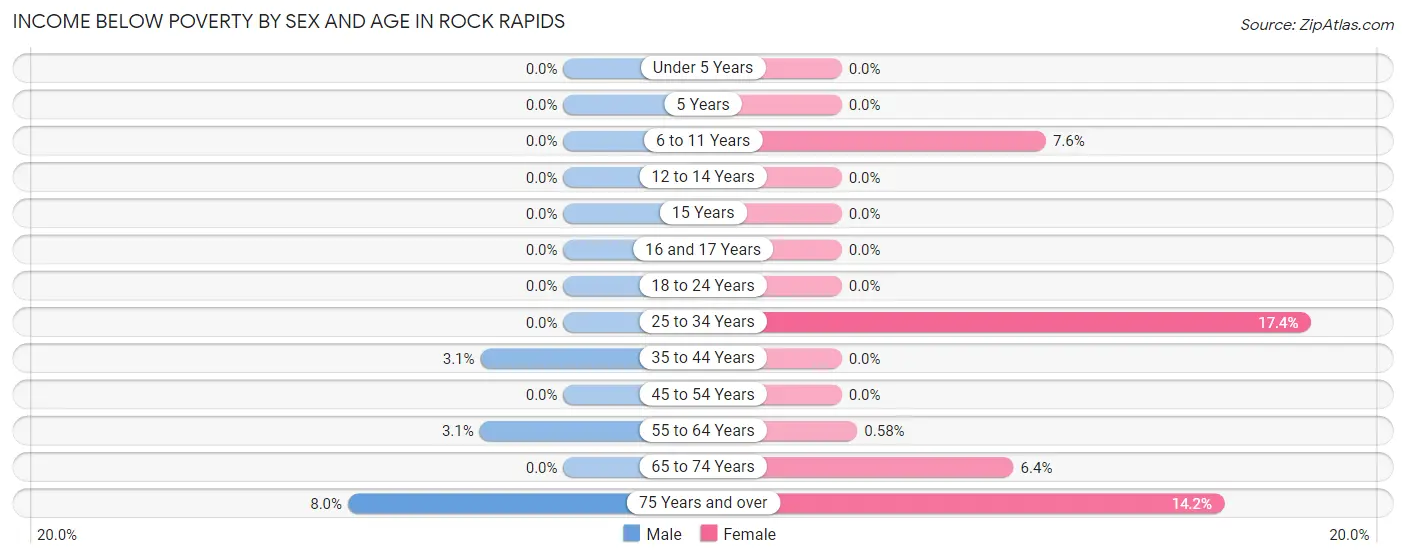
| Age Bracket | Male | Female |
| Under 5 Years | 0 (0.0%) | 0 (0.0%) |
| 5 Years | 0 (0.0%) | 0 (0.0%) |
| 6 to 11 Years | 0 (0.0%) | 5 (7.6%) |
| 12 to 14 Years | 0 (0.0%) | 0 (0.0%) |
| 15 Years | 0 (0.0%) | 0 (0.0%) |
| 16 and 17 Years | 0 (0.0%) | 0 (0.0%) |
| 18 to 24 Years | 0 (0.0%) | 0 (0.0%) |
| 25 to 34 Years | 0 (0.0%) | 8 (17.4%) |
| 35 to 44 Years | 7 (3.1%) | 0 (0.0%) |
| 45 to 54 Years | 0 (0.0%) | 0 (0.0%) |
| 55 to 64 Years | 6 (3.1%) | 1 (0.6%) |
| 65 to 74 Years | 0 (0.0%) | 9 (6.4%) |
| 75 Years and over | 6 (8.0%) | 19 (14.2%) |
| Total | 19 (1.4%) | 42 (3.7%) |
Income Above Poverty by Sex and Age in Rock Rapids
According to the poverty statistics in Rock Rapids, males aged under 5 years and females aged under 5 years are the age groups that are most secure financially, with 100.0% of males and 100.0% of females in these age groups living above the poverty line.
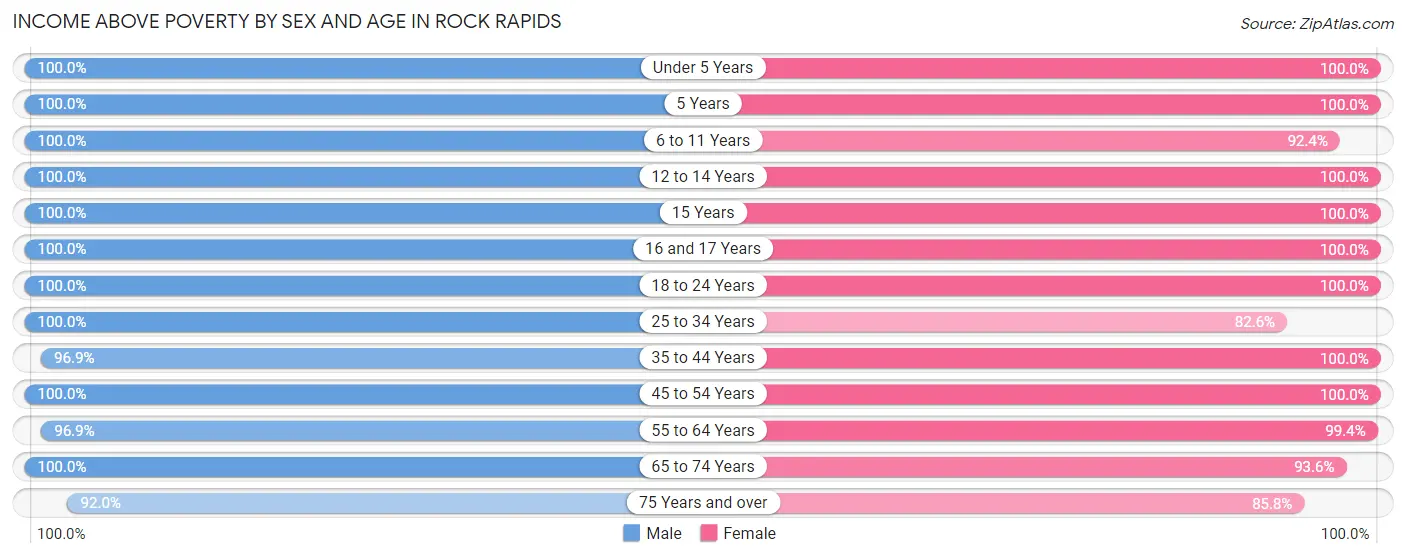
| Age Bracket | Male | Female |
| Under 5 Years | 80 (100.0%) | 33 (100.0%) |
| 5 Years | 14 (100.0%) | 14 (100.0%) |
| 6 to 11 Years | 268 (100.0%) | 61 (92.4%) |
| 12 to 14 Years | 93 (100.0%) | 63 (100.0%) |
| 15 Years | 13 (100.0%) | 66 (100.0%) |
| 16 and 17 Years | 41 (100.0%) | 28 (100.0%) |
| 18 to 24 Years | 102 (100.0%) | 61 (100.0%) |
| 25 to 34 Years | 56 (100.0%) | 38 (82.6%) |
| 35 to 44 Years | 220 (96.9%) | 234 (100.0%) |
| 45 to 54 Years | 97 (100.0%) | 85 (100.0%) |
| 55 to 64 Years | 187 (96.9%) | 170 (99.4%) |
| 65 to 74 Years | 123 (100.0%) | 132 (93.6%) |
| 75 Years and over | 69 (92.0%) | 115 (85.8%) |
| Total | 1,363 (98.6%) | 1,100 (96.3%) |
Income Below Poverty Among Married-Couple Families in Rock Rapids
The poverty statistics for married-couple families in Rock Rapids show that 0.9% or 5 of the total 548 families live below the poverty line. Families with 1 or 2 children have the highest poverty rate of 3.5%, comprising of 5 families. On the other hand, families with no children have the lowest poverty rate of 0.0%, which includes 0 families.
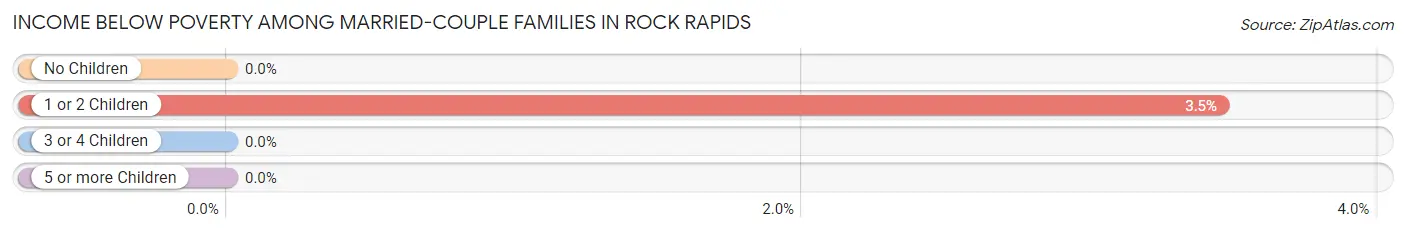
| Children | Above Poverty | Below Poverty |
| No Children | 306 (100.0%) | 0 (0.0%) |
| 1 or 2 Children | 140 (96.6%) | 5 (3.5%) |
| 3 or 4 Children | 77 (100.0%) | 0 (0.0%) |
| 5 or more Children | 20 (100.0%) | 0 (0.0%) |
| Total | 543 (99.1%) | 5 (0.9%) |
Income Below Poverty Among Single-Parent Households in Rock Rapids
| Children | Single Father | Single Mother |
| No Children | 0 (0.0%) | 0 (0.0%) |
| 1 or 2 Children | 0 (0.0%) | 0 (0.0%) |
| 3 or 4 Children | 0 (0.0%) | 0 (0.0%) |
| 5 or more Children | 0 (0.0%) | 0 (0.0%) |
| Total | 0 (0.0%) | 0 (0.0%) |
Income Below Poverty Among Married-Couple vs Single-Parent Households in Rock Rapids
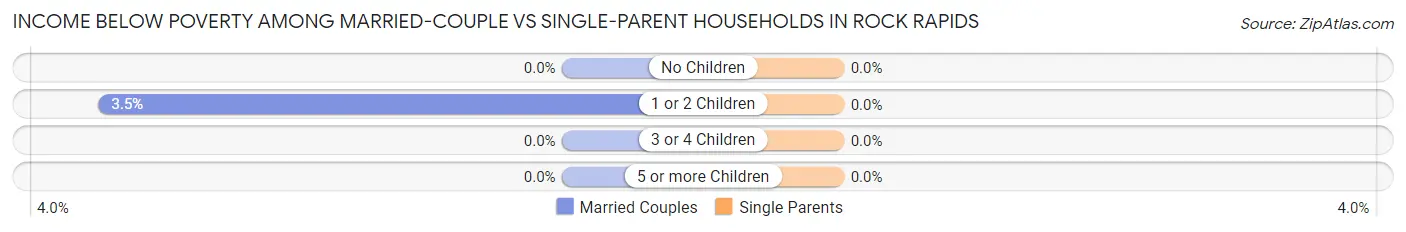
| Children | Married-Couple Families | Single-Parent Households |
| No Children | 0 (0.0%) | 0 (0.0%) |
| 1 or 2 Children | 5 (3.5%) | 0 (0.0%) |
| 3 or 4 Children | 0 (0.0%) | 0 (0.0%) |
| 5 or more Children | 0 (0.0%) | 0 (0.0%) |
| Total | 5 (0.9%) | 0 (0.0%) |
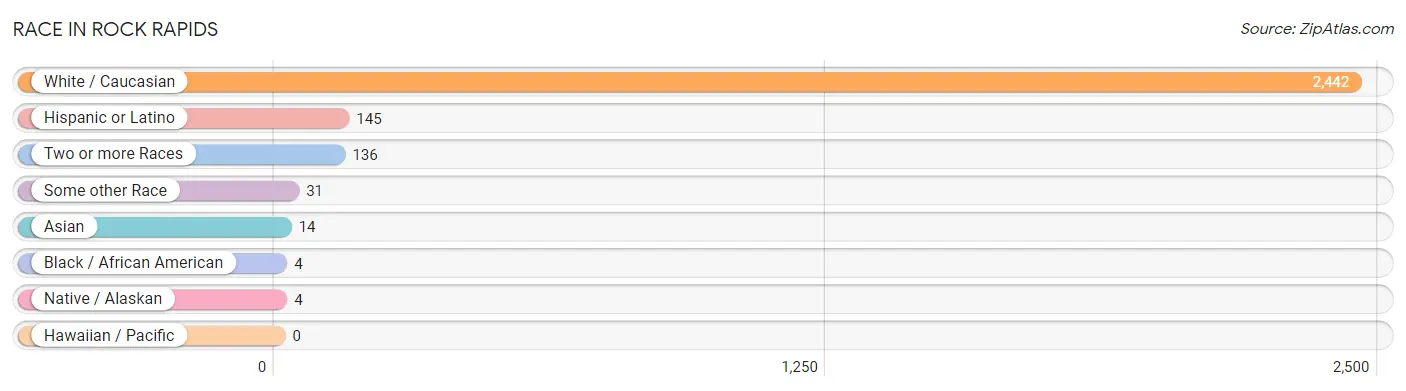
Race in Rock Rapids
The most populous races in Rock Rapids are White / Caucasian (2,442 | 92.8%), Hispanic or Latino (145 | 5.5%), and Two or more Races (136 | 5.2%).
| Race | # Population | % Population |
| Asian | 14 | 0.5% |
| Black / African American | 4 | 0.2% |
| Hawaiian / Pacific | 0 | 0.0% |
| Hispanic or Latino | 145 | 5.5% |
| Native / Alaskan | 4 | 0.2% |
| White / Caucasian | 2,442 | 92.8% |
| Two or more Races | 136 | 5.2% |
| Some other Race | 31 | 1.2% |
| Total | 2,631 | 100.0% |
Ancestry in Rock Rapids
The most populous ancestries reported in Rock Rapids are German (1,042 | 39.6%), Dutch (640 | 24.3%), American (159 | 6.0%), Irish (149 | 5.7%), and Mexican (145 | 5.5%), together accounting for 81.1% of all Rock Rapids residents.
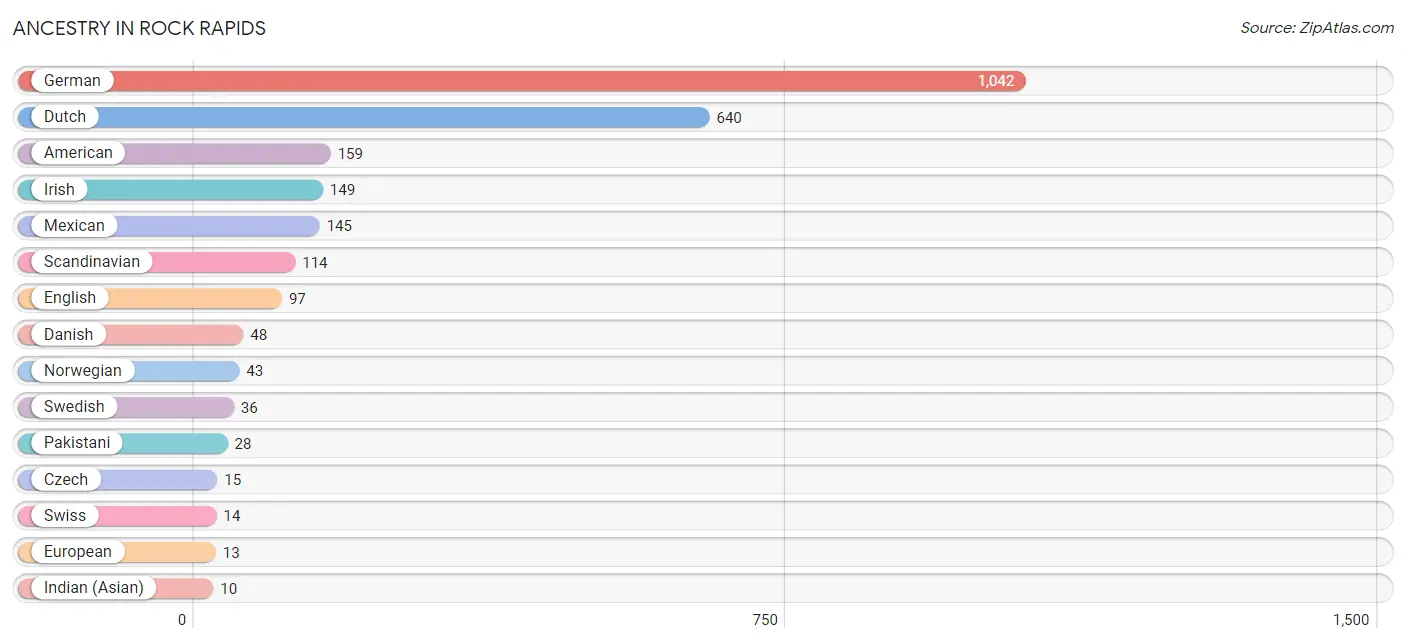
| Ancestry | # Population | % Population |
| American | 159 | 6.0% |
| Cherokee | 2 | 0.1% |
| Czech | 15 | 0.6% |
| Danish | 48 | 1.8% |
| Dutch | 640 | 24.3% |
| English | 97 | 3.7% |
| European | 13 | 0.5% |
| French Canadian | 5 | 0.2% |
| German | 1,042 | 39.6% |
| Indian (Asian) | 10 | 0.4% |
| Irish | 149 | 5.7% |
| Italian | 5 | 0.2% |
| Luxembourger | 3 | 0.1% |
| Mexican | 145 | 5.5% |
| Norwegian | 43 | 1.6% |
| Pakistani | 28 | 1.1% |
| Polish | 4 | 0.2% |
| Scandinavian | 114 | 4.3% |
| Scottish | 4 | 0.2% |
| Sioux | 4 | 0.2% |
| Swedish | 36 | 1.4% |
| Swiss | 14 | 0.5% |
| Ukrainian | 8 | 0.3% | View All 23 Rows |
Immigrants in Rock Rapids
The most numerous immigrant groups reported in Rock Rapids came from Central America (51 | 1.9%), Latin America (51 | 1.9%), Mexico (51 | 1.9%), Asia (14 | 0.5%), and China (10 | 0.4%), together accounting for 6.7% of all Rock Rapids residents.
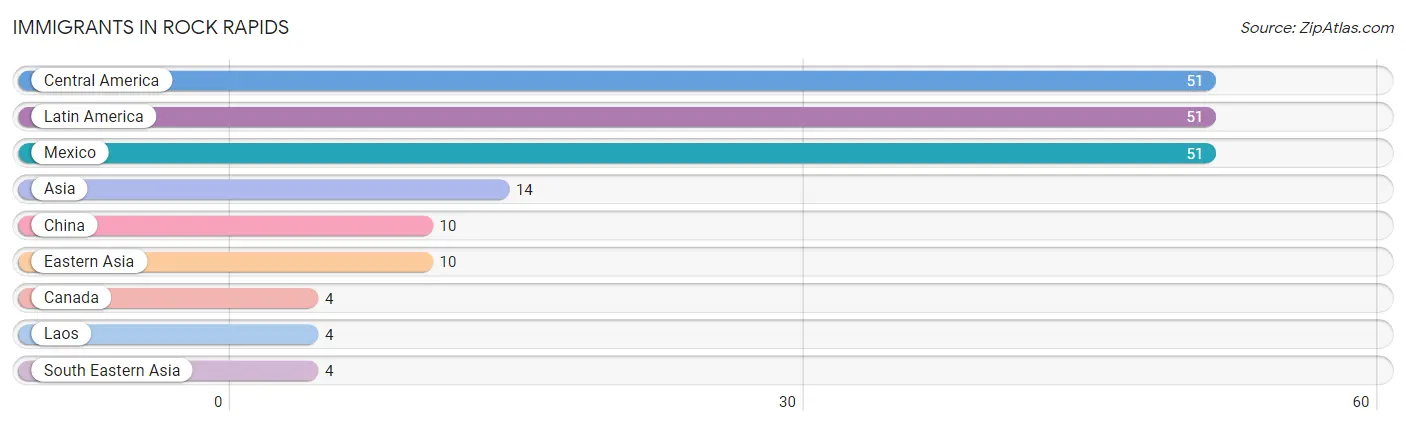
| Immigration Origin | # Population | % Population |
| Asia | 14 | 0.5% |
| Canada | 4 | 0.2% |
| Central America | 51 | 1.9% |
| China | 10 | 0.4% |
| Eastern Asia | 10 | 0.4% |
| Laos | 4 | 0.2% |
| Latin America | 51 | 1.9% |
| Mexico | 51 | 1.9% |
| South Eastern Asia | 4 | 0.2% | View All 9 Rows |
Sex and Age in Rock Rapids
Sex and Age in Rock Rapids
The most populous age groups in Rock Rapids are 5 to 9 Years (213 | 14.9%) for men and 35 to 39 Years (145 | 12.0%) for women.
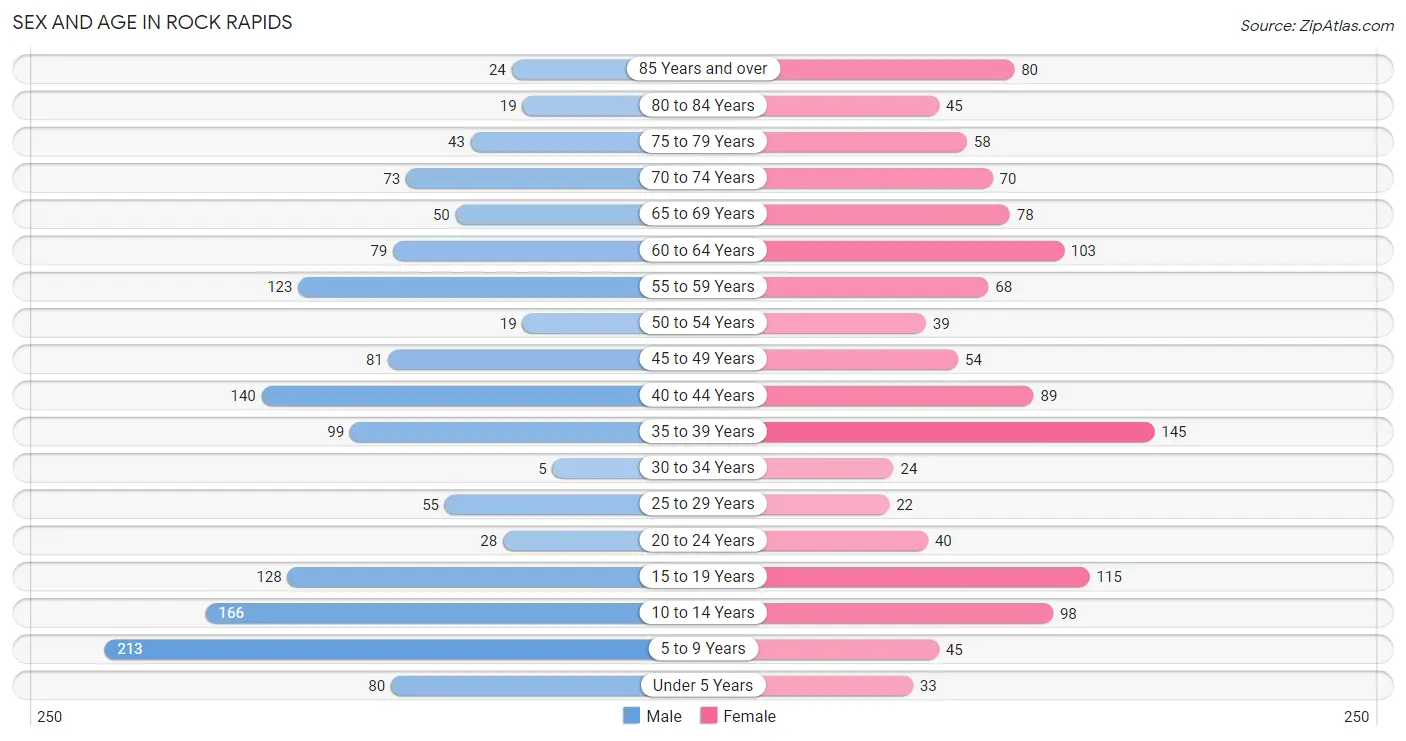
| Age Bracket | Male | Female |
| Under 5 Years | 80 (5.6%) | 33 (2.7%) |
| 5 to 9 Years | 213 (14.9%) | 45 (3.7%) |
| 10 to 14 Years | 166 (11.7%) | 98 (8.1%) |
| 15 to 19 Years | 128 (9.0%) | 115 (9.5%) |
| 20 to 24 Years | 28 (2.0%) | 40 (3.3%) |
| 25 to 29 Years | 55 (3.9%) | 22 (1.8%) |
| 30 to 34 Years | 5 (0.4%) | 24 (2.0%) |
| 35 to 39 Years | 99 (7.0%) | 145 (12.0%) |
| 40 to 44 Years | 140 (9.8%) | 89 (7.4%) |
| 45 to 49 Years | 81 (5.7%) | 54 (4.5%) |
| 50 to 54 Years | 19 (1.3%) | 39 (3.2%) |
| 55 to 59 Years | 123 (8.6%) | 68 (5.6%) |
| 60 to 64 Years | 79 (5.5%) | 103 (8.5%) |
| 65 to 69 Years | 50 (3.5%) | 78 (6.5%) |
| 70 to 74 Years | 73 (5.1%) | 70 (5.8%) |
| 75 to 79 Years | 43 (3.0%) | 58 (4.8%) |
| 80 to 84 Years | 19 (1.3%) | 45 (3.7%) |
| 85 Years and over | 24 (1.7%) | 80 (6.6%) |
| Total | 1,425 (100.0%) | 1,206 (100.0%) |
Families and Households in Rock Rapids
Median Family Size in Rock Rapids
The median family size in Rock Rapids is 3.26 persons per family, with single female/mother families (58 | 8.7%) accounting for the largest median family size of 3.33 persons per family. On the other hand, single male/father families (63 | 9.4%) represent the smallest median family size with 3.19 persons per family.
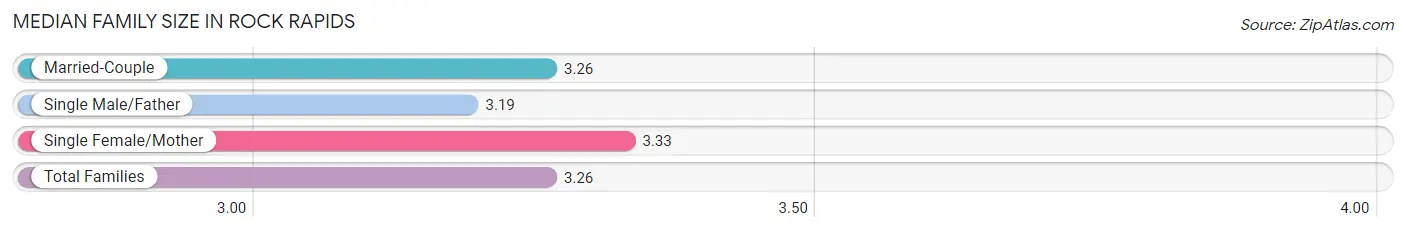
| Family Type | # Families | Family Size |
| Married-Couple | 548 (81.9%) | 3.26 |
| Single Male/Father | 63 (9.4%) | 3.19 |
| Single Female/Mother | 58 (8.7%) | 3.33 |
| Total Families | 669 (100.0%) | 3.26 |
Median Household Size in Rock Rapids
The median household size in Rock Rapids is 2.66 persons per household, with single female/mother households (58 | 6.1%) accounting for the largest median household size of 3.33 persons per household. non-family households (281 | 29.6%) represent the smallest median household size with 1.21 persons per household.
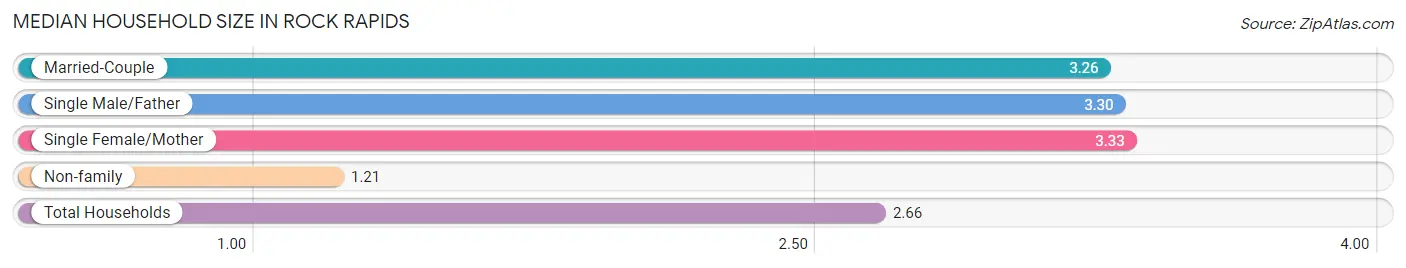
| Household Type | # Households | Household Size |
| Married-Couple | 548 (57.7%) | 3.26 |
| Single Male/Father | 63 (6.6%) | 3.30 |
| Single Female/Mother | 58 (6.1%) | 3.33 |
| Non-family | 281 (29.6%) | 1.21 |
| Total Households | 950 (100.0%) | 2.66 |
Household Size by Marriage Status in Rock Rapids
Out of a total of 950 households in Rock Rapids, 669 (70.4%) are family households, while 281 (29.6%) are nonfamily households. The most numerous type of family households are 2-person households, comprising 340, and the most common type of nonfamily households are 1-person households, comprising 225.
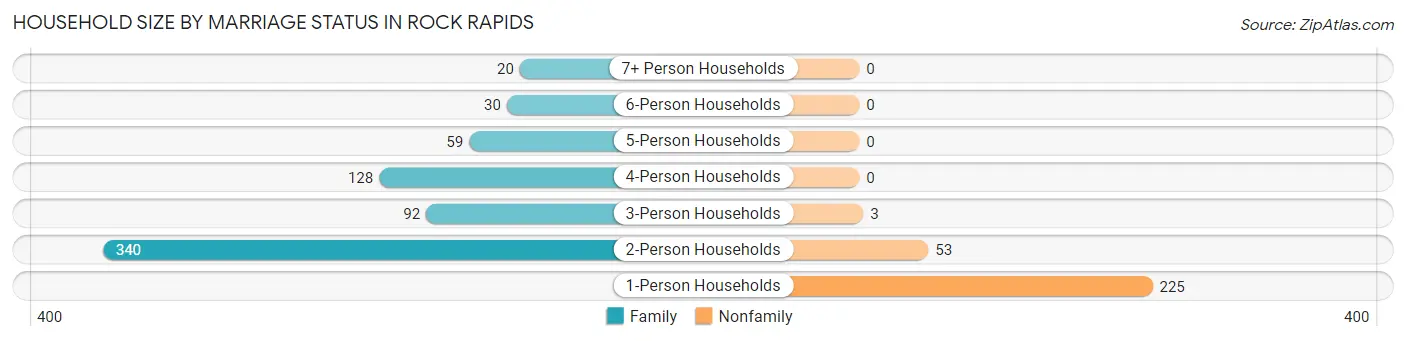
| Household Size | Family Households | Nonfamily Households |
| 1-Person Households | - | 225 (23.7%) |
| 2-Person Households | 340 (35.8%) | 53 (5.6%) |
| 3-Person Households | 92 (9.7%) | 3 (0.3%) |
| 4-Person Households | 128 (13.5%) | 0 (0.0%) |
| 5-Person Households | 59 (6.2%) | 0 (0.0%) |
| 6-Person Households | 30 (3.2%) | 0 (0.0%) |
| 7+ Person Households | 20 (2.1%) | 0 (0.0%) |
| Total | 669 (70.4%) | 281 (29.6%) |
Female Fertility in Rock Rapids
Fertility by Age in Rock Rapids
Average fertility rate in Rock Rapids is 43.0 births per 1,000 women. Women in the age bracket of 35 to 50 years have the highest fertility rate with 73.0 births per 1,000 women. Women in the age bracket of 35 to 50 years acount for 100.0% of all women with births.
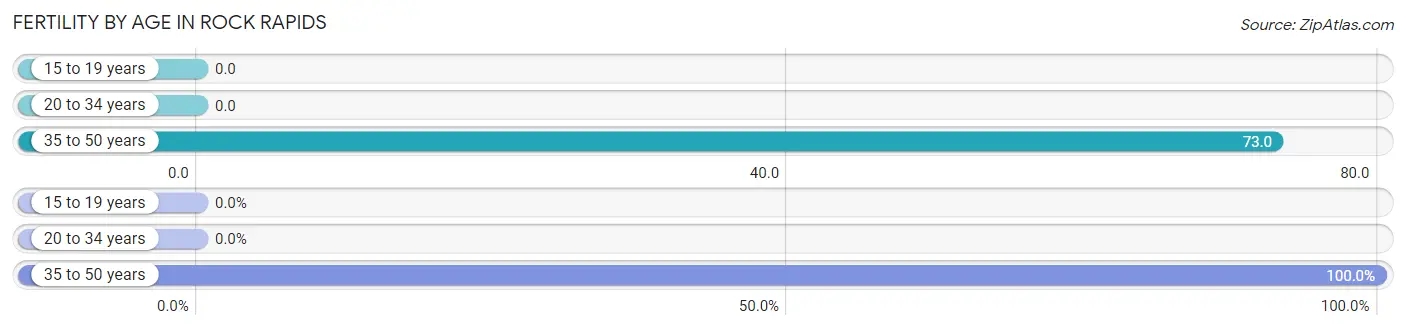
| Age Bracket | Women with Births | Births / 1,000 Women |
| 15 to 19 years | 0 (0.0%) | 0.0 |
| 20 to 34 years | 0 (0.0%) | 0.0 |
| 35 to 50 years | 21 (100.0%) | 73.0 |
| Total | 21 (100.0%) | 43.0 |
Fertility by Age by Marriage Status in Rock Rapids
66.7% of women with births (21) in Rock Rapids are married. The highest percentage of unmarried women with births falls into 35 to 50 years age bracket with 33.3% of them unmarried at the time of birth, while the lowest percentage of unmarried women with births belong to 35 to 50 years age bracket with 33.3% of them unmarried.
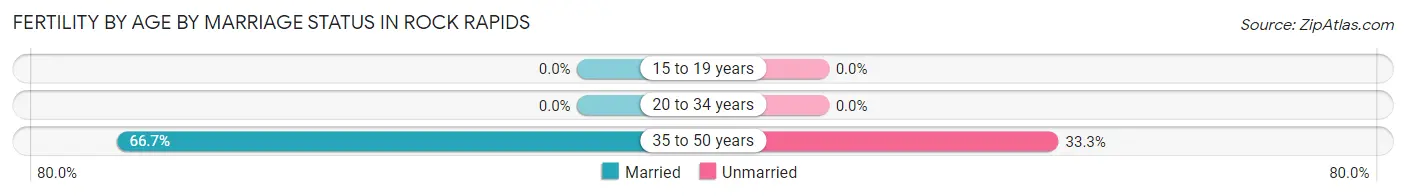
| Age Bracket | Married | Unmarried |
| 15 to 19 years | 0 (0.0%) | 0 (0.0%) |
| 20 to 34 years | 0 (0.0%) | 0 (0.0%) |
| 35 to 50 years | 14 (66.7%) | 7 (33.3%) |
| Total | 14 (66.7%) | 7 (33.3%) |
Fertility by Education in Rock Rapids
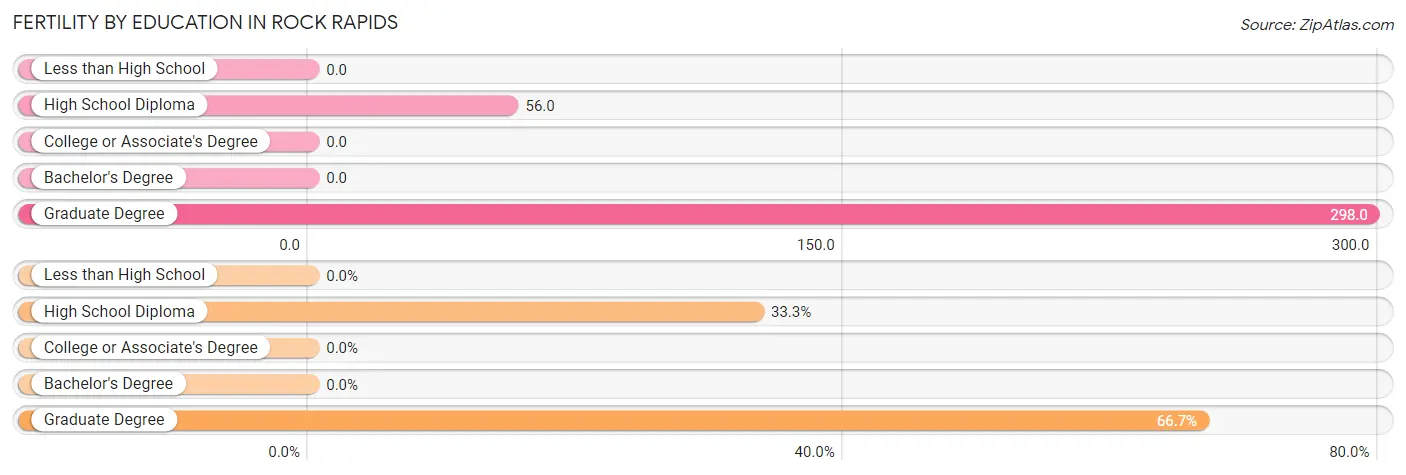
| Educational Attainment | Women with Births | Births / 1,000 Women |
| Less than High School | 0 (0.0%) | 0.0 |
| High School Diploma | 7 (33.3%) | 56.0 |
| College or Associate's Degree | 0 (0.0%) | 0.0 |
| Bachelor's Degree | 0 (0.0%) | 0.0 |
| Graduate Degree | 14 (66.7%) | 298.0 |
| Total | 21 (100.0%) | 43.0 |
Fertility by Education by Marriage Status in Rock Rapids
33.3% of women with births in Rock Rapids are unmarried. Women with the educational attainment of graduate degree are most likely to be married with 100.0% of them married at childbirth, while women with the educational attainment of high school diploma are least likely to be married with 100.0% of them unmarried at childbirth.
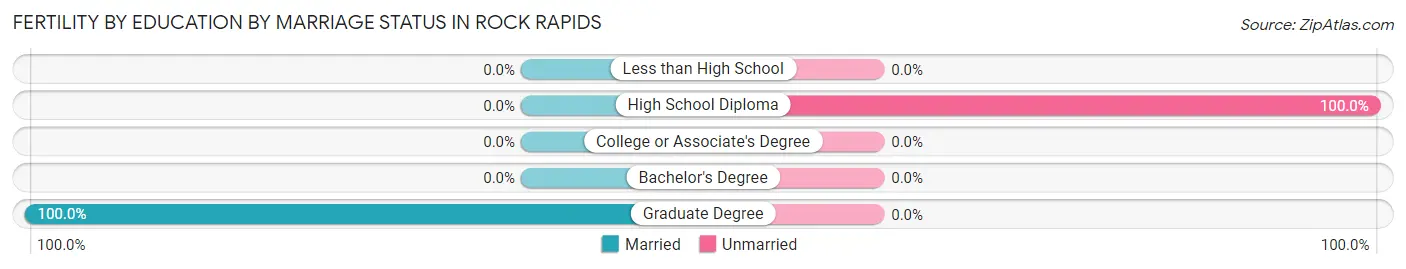
| Educational Attainment | Married | Unmarried |
| Less than High School | 0 (0.0%) | 0 (0.0%) |
| High School Diploma | 0 (0.0%) | 7 (100.0%) |
| College or Associate's Degree | 0 (0.0%) | 0 (0.0%) |
| Bachelor's Degree | 0 (0.0%) | 0 (0.0%) |
| Graduate Degree | 14 (100.0%) | 0 (0.0%) |
| Total | 14 (66.7%) | 7 (33.3%) |
Employment Characteristics in Rock Rapids
Employment by Class of Employer in Rock Rapids
Among the 1,147 employed individuals in Rock Rapids, private company employees (608 | 53.0%), local government employees (192 | 16.7%), and not-for-profit organizations (129 | 11.3%) make up the most common classes of employment.
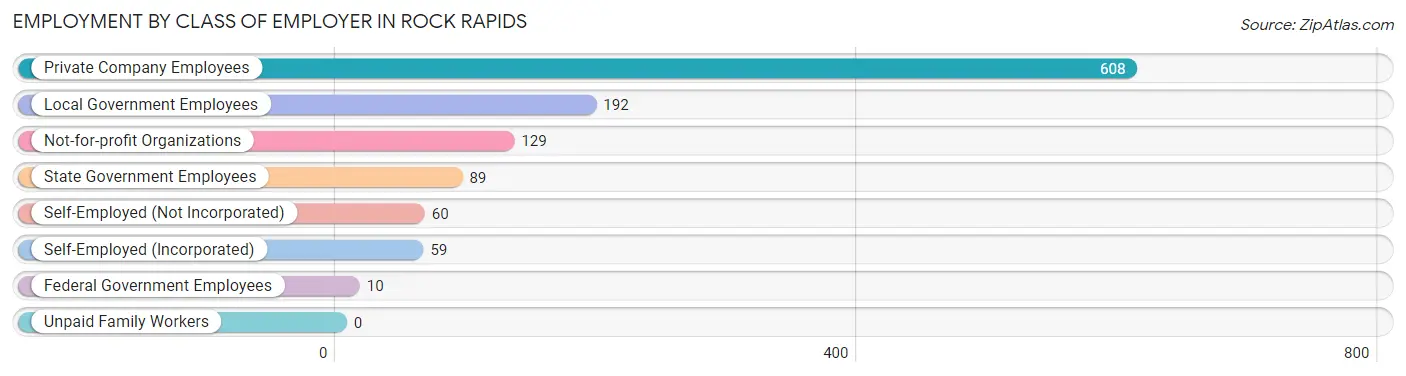
| Employer Class | # Employees | % Employees |
| Private Company Employees | 608 | 53.0% |
| Self-Employed (Incorporated) | 59 | 5.1% |
| Self-Employed (Not Incorporated) | 60 | 5.2% |
| Not-for-profit Organizations | 129 | 11.3% |
| Local Government Employees | 192 | 16.7% |
| State Government Employees | 89 | 7.8% |
| Federal Government Employees | 10 | 0.9% |
| Unpaid Family Workers | 0 | 0.0% |
| Total | 1,147 | 100.0% |
Employment Status by Age in Rock Rapids
According to the labor force statistics for Rock Rapids, out of the total population over 16 years of age (1,917), 63.1% or 1,210 individuals are in the labor force, with 4.1% or 50 of them unemployed. The age group with the highest labor force participation rate is 45 to 54 years, with 94.3% or 182 individuals in the labor force. Within the labor force, the 20 to 24 years age range has the highest percentage of unemployed individuals, with 70.2% or 33 of them being unemployed.
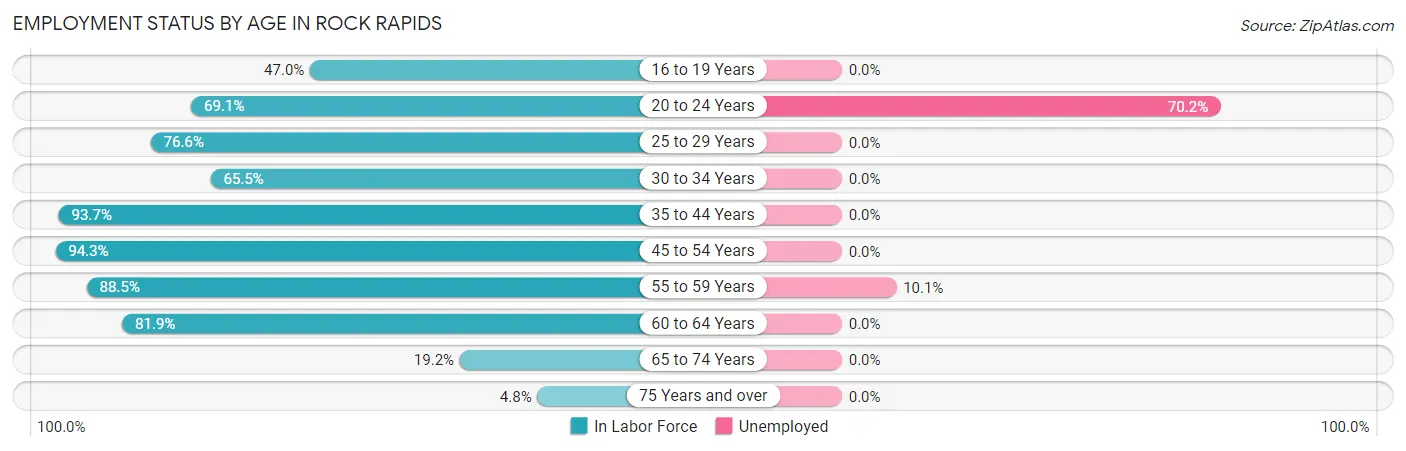
| Age Bracket | In Labor Force | Unemployed |
| 16 to 19 Years | 77 (47.0%) | 0 (0.0%) |
| 20 to 24 Years | 47 (69.1%) | 33 (70.2%) |
| 25 to 29 Years | 59 (76.6%) | 0 (0.0%) |
| 30 to 34 Years | 19 (65.5%) | 0 (0.0%) |
| 35 to 44 Years | 443 (93.7%) | 0 (0.0%) |
| 45 to 54 Years | 182 (94.3%) | 0 (0.0%) |
| 55 to 59 Years | 169 (88.5%) | 17 (10.1%) |
| 60 to 64 Years | 149 (81.9%) | 0 (0.0%) |
| 65 to 74 Years | 52 (19.2%) | 0 (0.0%) |
| 75 Years and over | 13 (4.8%) | 0 (0.0%) |
| Total | 1,210 (63.1%) | 50 (4.1%) |
Employment Status by Educational Attainment in Rock Rapids
According to labor force statistics for Rock Rapids, 89.2% of individuals (1,021) out of the total population between 25 and 64 years of age (1,145) are in the labor force, with 1.7% or 17 of them being unemployed. The group with the highest labor force participation rate are those with the educational attainment of college / associate degree, with 95.0% or 363 individuals in the labor force. Within the labor force, individuals with college / associate degree education have the highest percentage of unemployment, with 4.7% or 17 of them being unemployed.
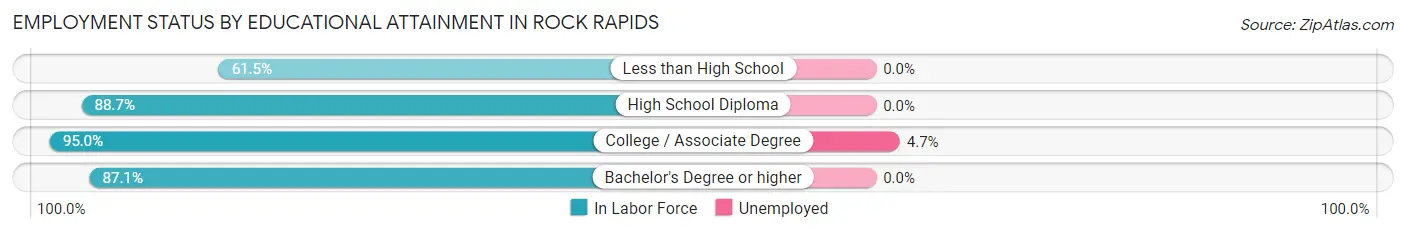
| Educational Attainment | In Labor Force | Unemployed |
| Less than High School | 32 (61.5%) | 0 (0.0%) |
| High School Diploma | 362 (88.7%) | 0 (0.0%) |
| College / Associate Degree | 363 (95.0%) | 18 (4.7%) |
| Bachelor's Degree or higher | 264 (87.1%) | 0 (0.0%) |
| Total | 1,021 (89.2%) | 19 (1.7%) |
Employment Occupations by Sex in Rock Rapids
Management, Business, Science and Arts Occupations
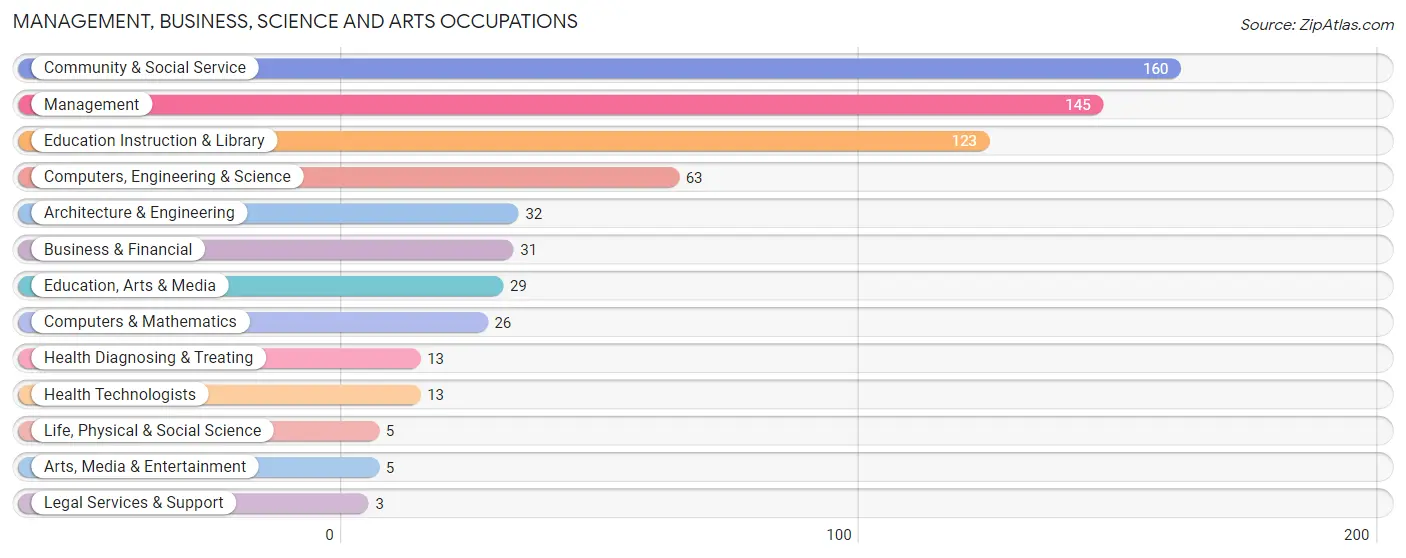
The most common Management, Business, Science and Arts occupations in Rock Rapids are Community & Social Service (160 | 13.8%), Management (145 | 12.5%), Education Instruction & Library (123 | 10.6%), Computers, Engineering & Science (63 | 5.4%), and Architecture & Engineering (32 | 2.8%).
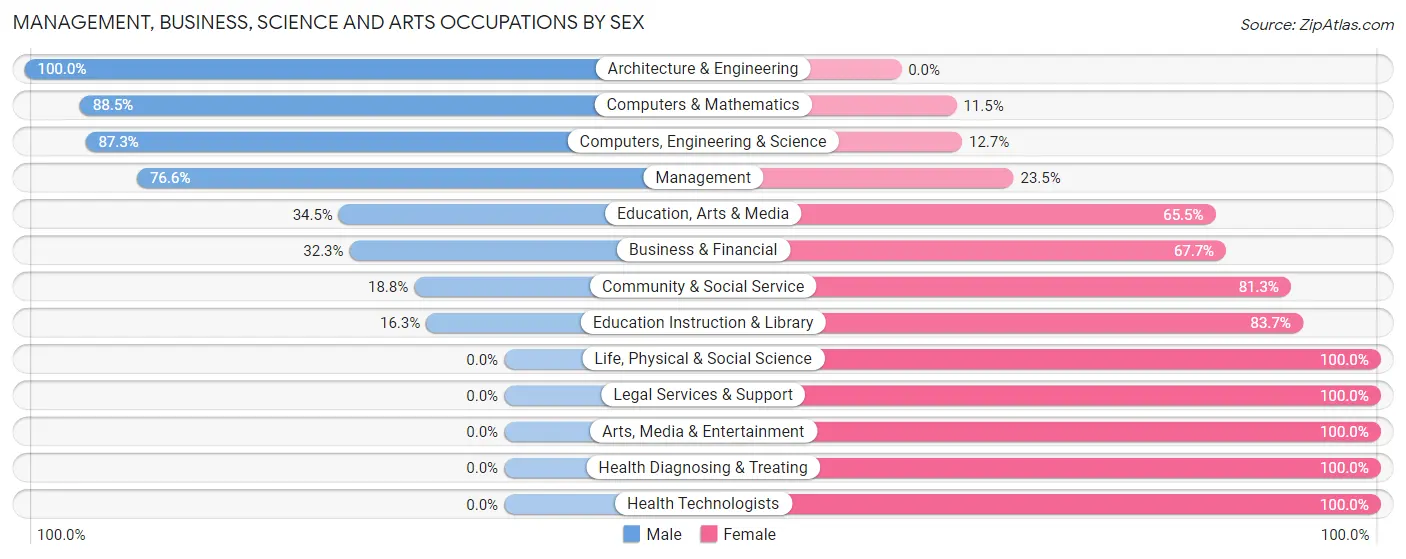
Management, Business, Science and Arts Occupations by Sex
Within the Management, Business, Science and Arts occupations in Rock Rapids, the most male-oriented occupations are Architecture & Engineering (100.0%), Computers & Mathematics (88.5%), and Computers, Engineering & Science (87.3%), while the most female-oriented occupations are Life, Physical & Social Science (100.0%), Legal Services & Support (100.0%), and Arts, Media & Entertainment (100.0%).
| Occupation | Male | Female |
| Management | 111 (76.5%) | 34 (23.4%) |
| Business & Financial | 10 (32.3%) | 21 (67.7%) |
| Computers, Engineering & Science | 55 (87.3%) | 8 (12.7%) |
| Computers & Mathematics | 23 (88.5%) | 3 (11.5%) |
| Architecture & Engineering | 32 (100.0%) | 0 (0.0%) |
| Life, Physical & Social Science | 0 (0.0%) | 5 (100.0%) |
| Community & Social Service | 30 (18.8%) | 130 (81.2%) |
| Education, Arts & Media | 10 (34.5%) | 19 (65.5%) |
| Legal Services & Support | 0 (0.0%) | 3 (100.0%) |
| Education Instruction & Library | 20 (16.3%) | 103 (83.7%) |
| Arts, Media & Entertainment | 0 (0.0%) | 5 (100.0%) |
| Health Diagnosing & Treating | 0 (0.0%) | 13 (100.0%) |
| Health Technologists | 0 (0.0%) | 13 (100.0%) |
| Total (Category) | 206 (50.0%) | 206 (50.0%) |
| Total (Overall) | 614 (52.9%) | 546 (47.1%) |
Services Occupations
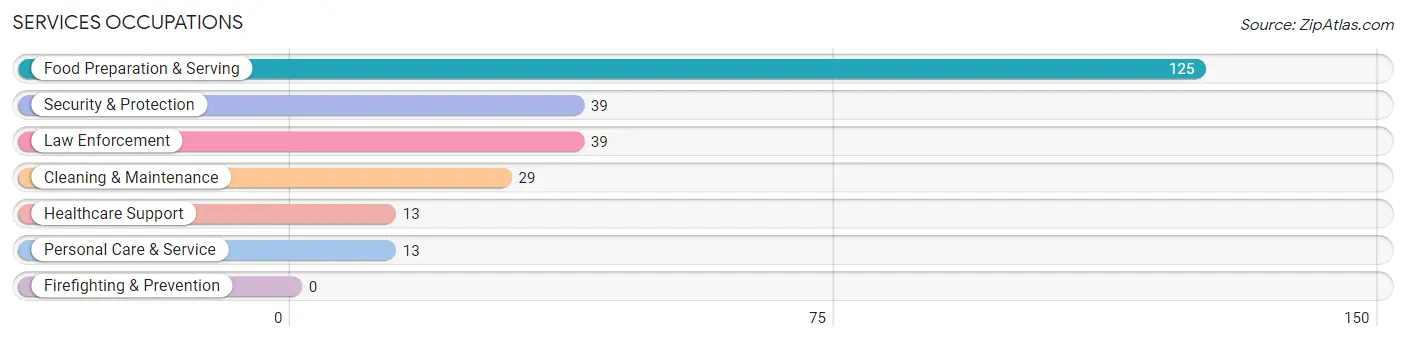
The most common Services occupations in Rock Rapids are Food Preparation & Serving (125 | 10.8%), Security & Protection (39 | 3.4%), Law Enforcement (39 | 3.4%), Cleaning & Maintenance (29 | 2.5%), and Healthcare Support (13 | 1.1%).
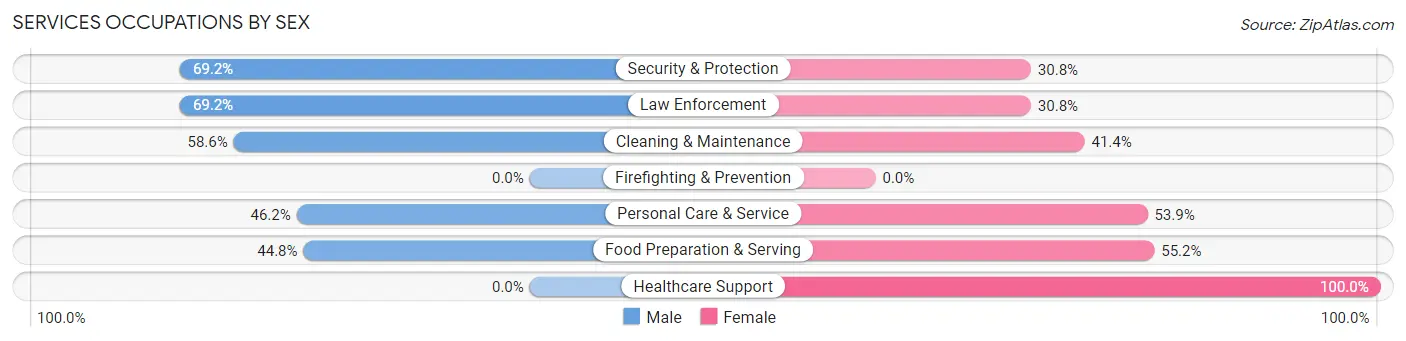
Services Occupations by Sex
Within the Services occupations in Rock Rapids, the most male-oriented occupations are Security & Protection (69.2%), Law Enforcement (69.2%), and Cleaning & Maintenance (58.6%), while the most female-oriented occupations are Healthcare Support (100.0%), Food Preparation & Serving (55.2%), and Personal Care & Service (53.8%).
| Occupation | Male | Female |
| Healthcare Support | 0 (0.0%) | 13 (100.0%) |
| Security & Protection | 27 (69.2%) | 12 (30.8%) |
| Firefighting & Prevention | 0 (0.0%) | 0 (0.0%) |
| Law Enforcement | 27 (69.2%) | 12 (30.8%) |
| Food Preparation & Serving | 56 (44.8%) | 69 (55.2%) |
| Cleaning & Maintenance | 17 (58.6%) | 12 (41.4%) |
| Personal Care & Service | 6 (46.2%) | 7 (53.8%) |
| Total (Category) | 106 (48.4%) | 113 (51.6%) |
| Total (Overall) | 614 (52.9%) | 546 (47.1%) |
Sales and Office Occupations
The most common Sales and Office occupations in Rock Rapids are Office & Administration (124 | 10.7%), and Sales & Related (77 | 6.6%).

Sales and Office Occupations by Sex
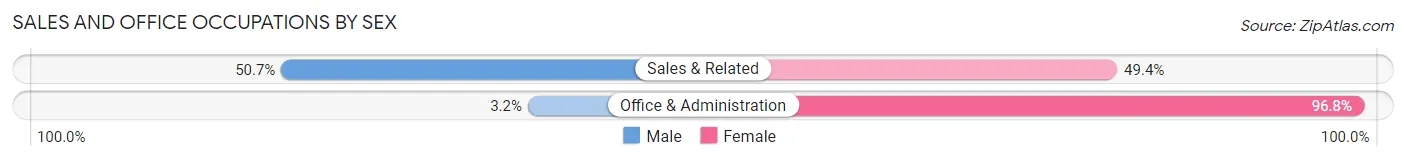
| Occupation | Male | Female |
| Sales & Related | 39 (50.6%) | 38 (49.3%) |
| Office & Administration | 4 (3.2%) | 120 (96.8%) |
| Total (Category) | 43 (21.4%) | 158 (78.6%) |
| Total (Overall) | 614 (52.9%) | 546 (47.1%) |
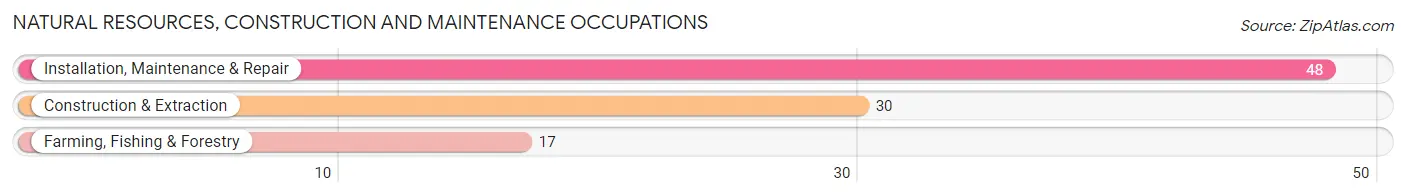
Natural Resources, Construction and Maintenance Occupations
The most common Natural Resources, Construction and Maintenance occupations in Rock Rapids are Installation, Maintenance & Repair (48 | 4.1%), Construction & Extraction (30 | 2.6%), and Farming, Fishing & Forestry (17 | 1.5%).
Natural Resources, Construction and Maintenance Occupations by Sex
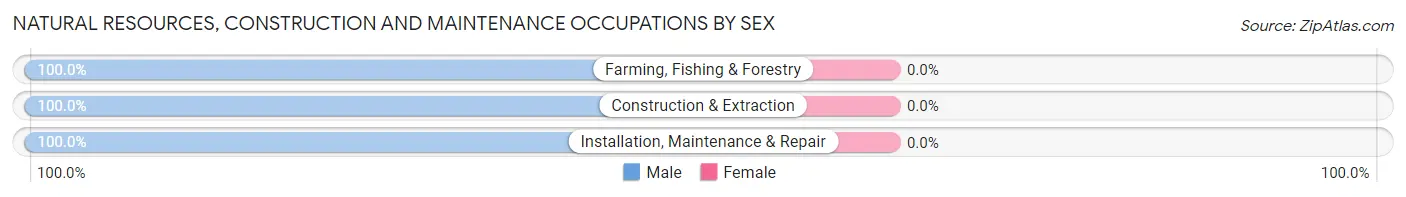
| Occupation | Male | Female |
| Farming, Fishing & Forestry | 17 (100.0%) | 0 (0.0%) |
| Construction & Extraction | 30 (100.0%) | 0 (0.0%) |
| Installation, Maintenance & Repair | 48 (100.0%) | 0 (0.0%) |
| Total (Category) | 95 (100.0%) | 0 (0.0%) |
| Total (Overall) | 614 (52.9%) | 546 (47.1%) |
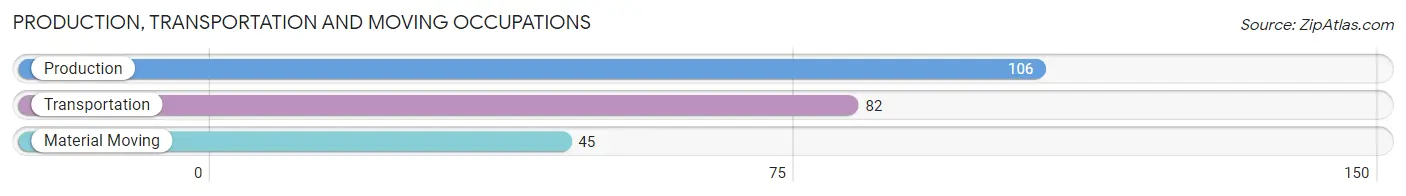
Production, Transportation and Moving Occupations
The most common Production, Transportation and Moving occupations in Rock Rapids are Production (106 | 9.1%), Transportation (82 | 7.1%), and Material Moving (45 | 3.9%).
Production, Transportation and Moving Occupations by Sex
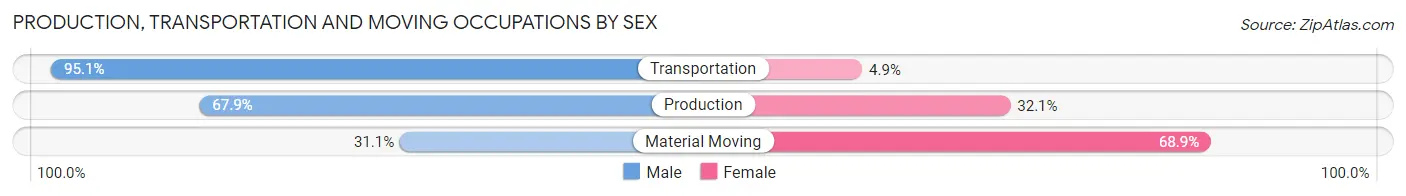
| Occupation | Male | Female |
| Production | 72 (67.9%) | 34 (32.1%) |
| Transportation | 78 (95.1%) | 4 (4.9%) |
| Material Moving | 14 (31.1%) | 31 (68.9%) |
| Total (Category) | 164 (70.4%) | 69 (29.6%) |
| Total (Overall) | 614 (52.9%) | 546 (47.1%) |
Employment Industries by Sex in Rock Rapids
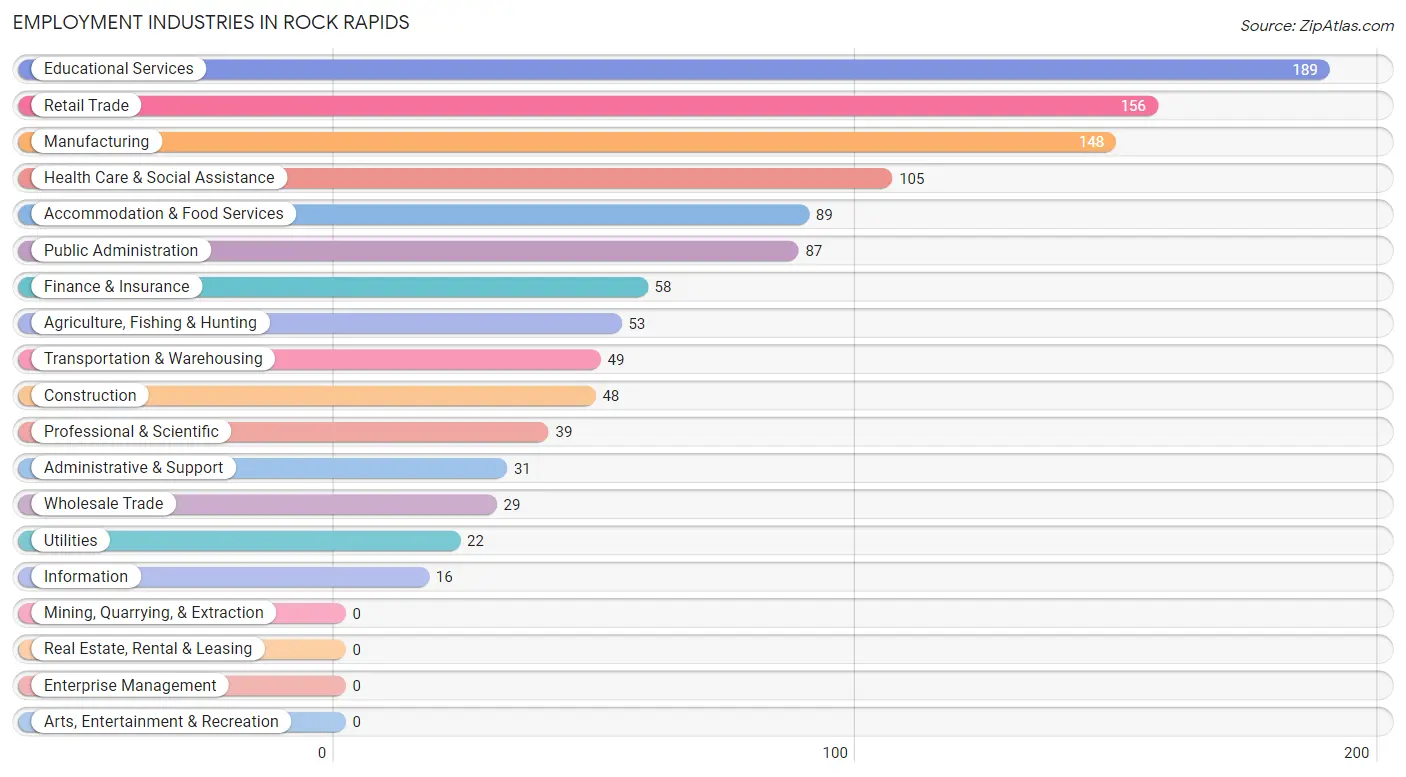
Employment Industries in Rock Rapids
The major employment industries in Rock Rapids include Educational Services (189 | 16.3%), Retail Trade (156 | 13.5%), Manufacturing (148 | 12.8%), Health Care & Social Assistance (105 | 9.0%), and Accommodation & Food Services (89 | 7.7%).
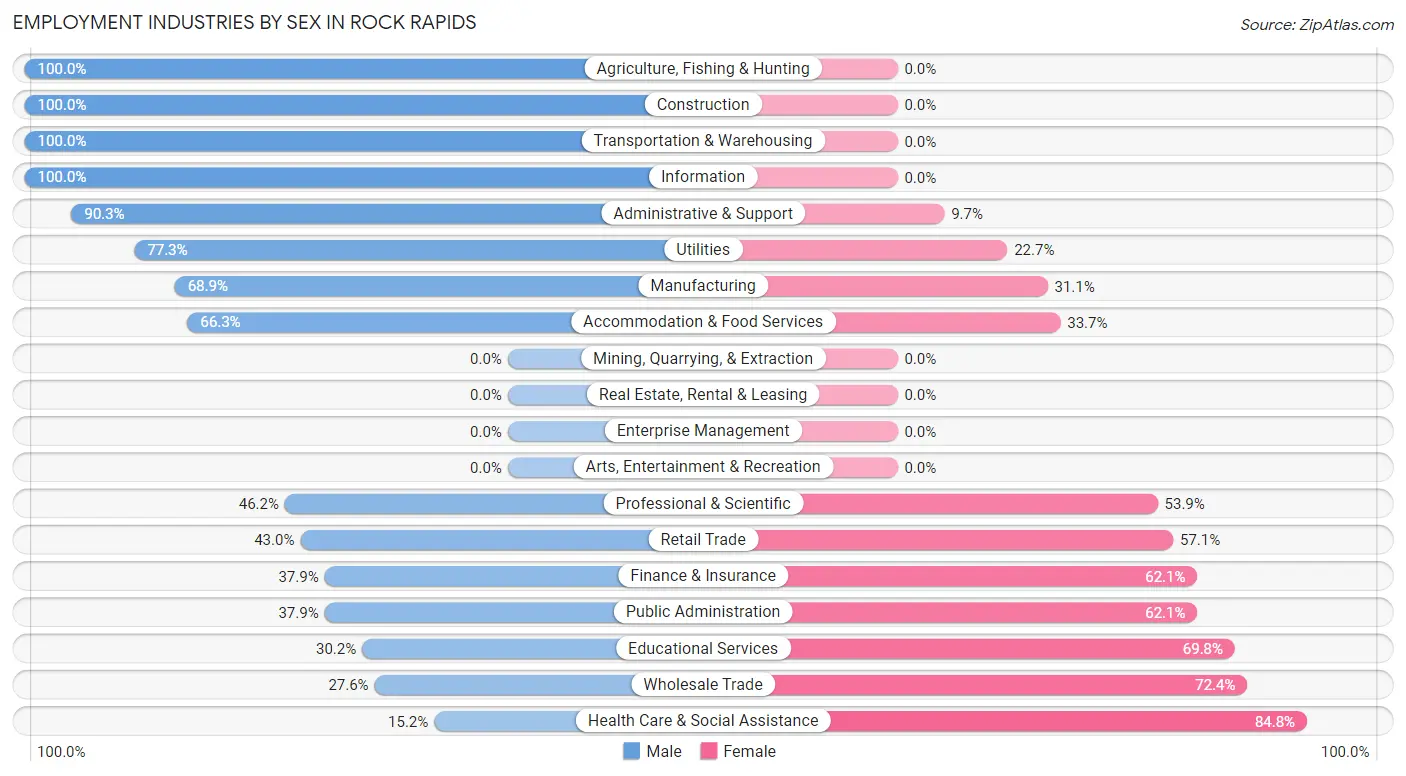
Employment Industries by Sex in Rock Rapids
The Rock Rapids industries that see more men than women are Agriculture, Fishing & Hunting (100.0%), Construction (100.0%), and Transportation & Warehousing (100.0%), whereas the industries that tend to have a higher number of women are Health Care & Social Assistance (84.8%), Wholesale Trade (72.4%), and Educational Services (69.8%).
| Industry | Male | Female |
| Agriculture, Fishing & Hunting | 53 (100.0%) | 0 (0.0%) |
| Mining, Quarrying, & Extraction | 0 (0.0%) | 0 (0.0%) |
| Construction | 48 (100.0%) | 0 (0.0%) |
| Manufacturing | 102 (68.9%) | 46 (31.1%) |
| Wholesale Trade | 8 (27.6%) | 21 (72.4%) |
| Retail Trade | 67 (42.9%) | 89 (57.1%) |
| Transportation & Warehousing | 49 (100.0%) | 0 (0.0%) |
| Utilities | 17 (77.3%) | 5 (22.7%) |
| Information | 16 (100.0%) | 0 (0.0%) |
| Finance & Insurance | 22 (37.9%) | 36 (62.1%) |
| Real Estate, Rental & Leasing | 0 (0.0%) | 0 (0.0%) |
| Professional & Scientific | 18 (46.2%) | 21 (53.8%) |
| Enterprise Management | 0 (0.0%) | 0 (0.0%) |
| Administrative & Support | 28 (90.3%) | 3 (9.7%) |
| Educational Services | 57 (30.2%) | 132 (69.8%) |
| Health Care & Social Assistance | 16 (15.2%) | 89 (84.8%) |
| Arts, Entertainment & Recreation | 0 (0.0%) | 0 (0.0%) |
| Accommodation & Food Services | 59 (66.3%) | 30 (33.7%) |
| Public Administration | 33 (37.9%) | 54 (62.1%) |
| Total | 614 (52.9%) | 546 (47.1%) |
Education in Rock Rapids
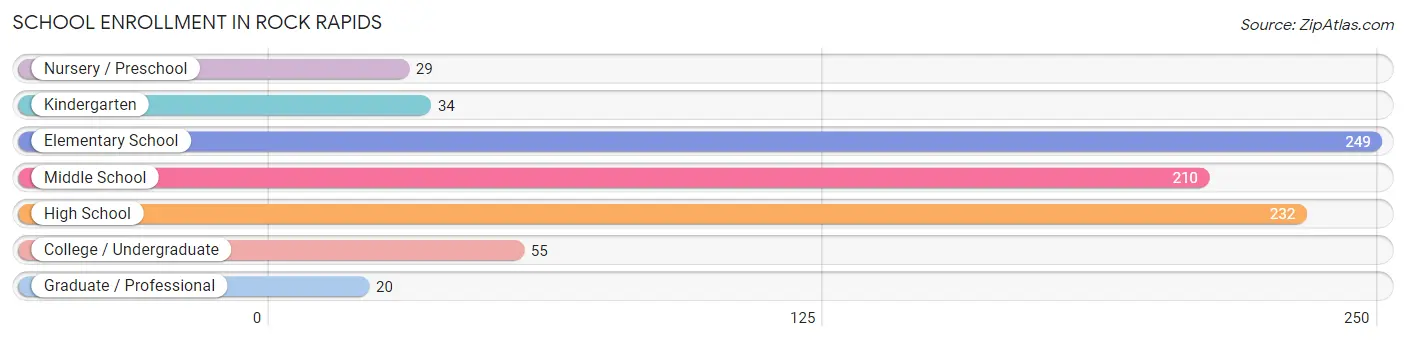
School Enrollment in Rock Rapids
The most common levels of schooling among the 829 students in Rock Rapids are elementary school (249 | 30.0%), high school (232 | 28.0%), and middle school (210 | 25.3%).
| School Level | # Students | % Students |
| Nursery / Preschool | 29 | 3.5% |
| Kindergarten | 34 | 4.1% |
| Elementary School | 249 | 30.0% |
| Middle School | 210 | 25.3% |
| High School | 232 | 28.0% |
| College / Undergraduate | 55 | 6.6% |
| Graduate / Professional | 20 | 2.4% |
| Total | 829 | 100.0% |
School Enrollment by Age by Funding Source in Rock Rapids
Out of a total of 829 students who are enrolled in schools in Rock Rapids, 80 (9.7%) attend a private institution, while the remaining 749 (90.3%) are enrolled in public schools. The age group of 3 to 4 year olds has the highest likelihood of being enrolled in private schools, with 4 (22.2% in the age bracket) enrolled. Conversely, the age group of 15 to 17 year olds has the lowest likelihood of being enrolled in a private school, with 148 (100.0% in the age bracket) attending a public institution.
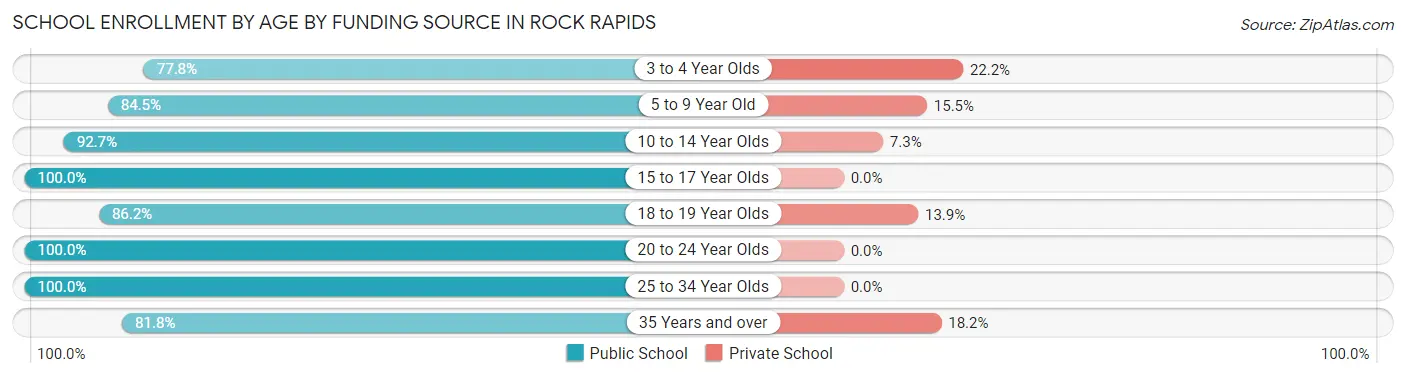
| Age Bracket | Public School | Private School |
| 3 to 4 Year Olds | 14 (77.8%) | 4 (22.2%) |
| 5 to 9 Year Old | 218 (84.5%) | 40 (15.5%) |
| 10 to 14 Year Olds | 241 (92.7%) | 19 (7.3%) |
| 15 to 17 Year Olds | 148 (100.0%) | 0 (0.0%) |
| 18 to 19 Year Olds | 56 (86.2%) | 9 (13.9%) |
| 20 to 24 Year Olds | 28 (100.0%) | 0 (0.0%) |
| 25 to 34 Year Olds | 8 (100.0%) | 0 (0.0%) |
| 35 Years and over | 36 (81.8%) | 8 (18.2%) |
| Total | 749 (90.3%) | 80 (9.7%) |
Educational Attainment by Field of Study in Rock Rapids
Education (138 | 35.6%), business (66 | 17.0%), arts & humanities (46 | 11.9%), bio, nature & agricultural (35 | 9.0%), and social sciences (23 | 5.9%) are the most common fields of study among 388 individuals in Rock Rapids who have obtained a bachelor's degree or higher.
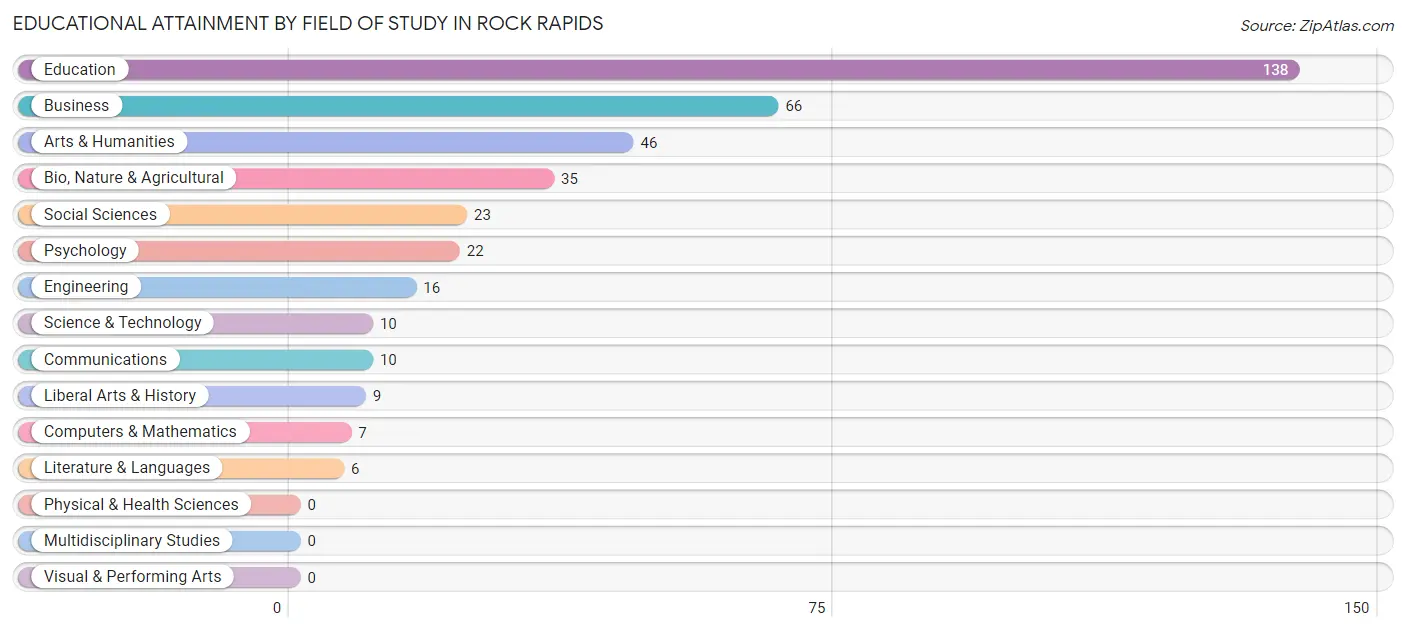
| Field of Study | # Graduates | % Graduates |
| Computers & Mathematics | 7 | 1.8% |
| Bio, Nature & Agricultural | 35 | 9.0% |
| Physical & Health Sciences | 0 | 0.0% |
| Psychology | 22 | 5.7% |
| Social Sciences | 23 | 5.9% |
| Engineering | 16 | 4.1% |
| Multidisciplinary Studies | 0 | 0.0% |
| Science & Technology | 10 | 2.6% |
| Business | 66 | 17.0% |
| Education | 138 | 35.6% |
| Literature & Languages | 6 | 1.5% |
| Liberal Arts & History | 9 | 2.3% |
| Visual & Performing Arts | 0 | 0.0% |
| Communications | 10 | 2.6% |
| Arts & Humanities | 46 | 11.9% |
| Total | 388 | 100.0% |
Transportation & Commute in Rock Rapids
Vehicle Availability by Sex in Rock Rapids
The most prevalent vehicle ownership categories in Rock Rapids are males with 3 vehicles (225, accounting for 37.1%) and females with 3 vehicles (213, making up 41.7%).
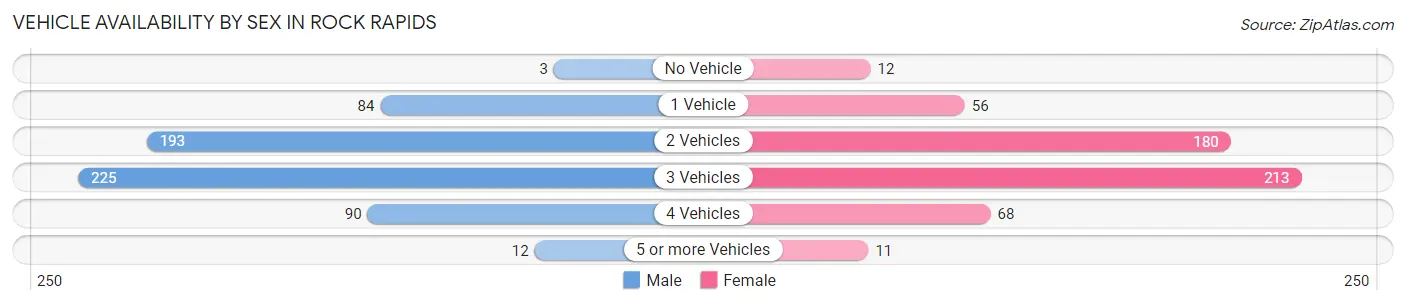
| Vehicles Available | Male | Female |
| No Vehicle | 3 (0.5%) | 12 (2.2%) |
| 1 Vehicle | 84 (13.8%) | 56 (10.4%) |
| 2 Vehicles | 193 (31.8%) | 180 (33.3%) |
| 3 Vehicles | 225 (37.1%) | 213 (39.4%) |
| 4 Vehicles | 90 (14.8%) | 68 (12.6%) |
| 5 or more Vehicles | 12 (2.0%) | 11 (2.0%) |
| Total | 607 (100.0%) | 540 (100.0%) |
Commute Time in Rock Rapids
The most frequently occuring commute durations in Rock Rapids are 5 to 9 minutes (344 commuters, 33.3%), less than 5 minutes (313 commuters, 30.3%), and 10 to 14 minutes (134 commuters, 13.0%).
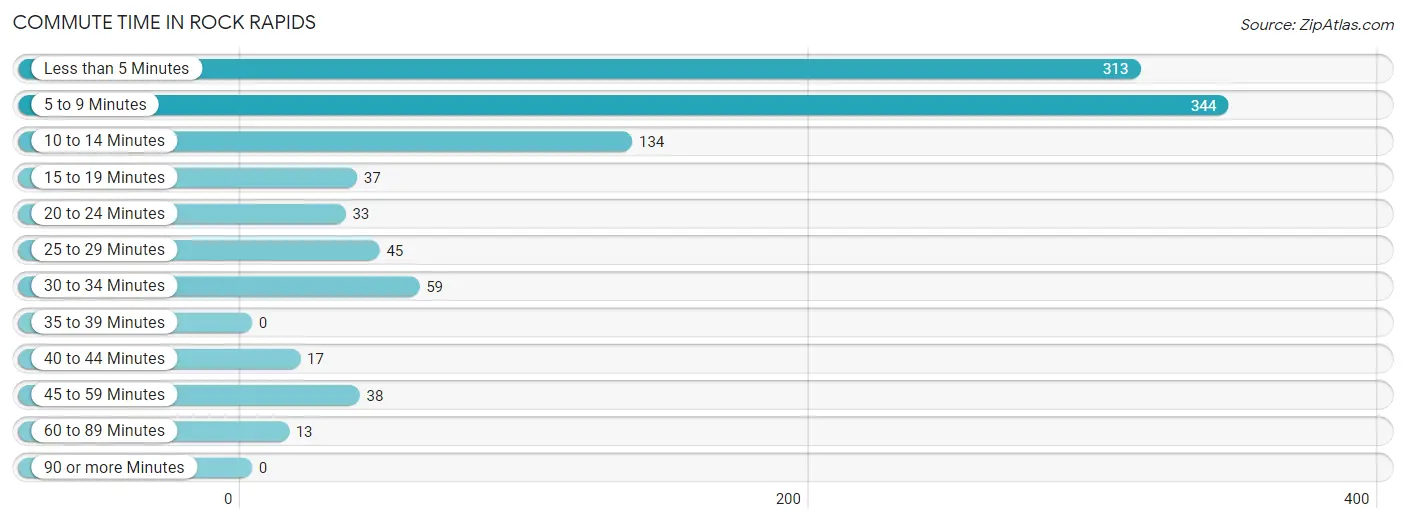
| Commute Time | # Commuters | % Commuters |
| Less than 5 Minutes | 313 | 30.3% |
| 5 to 9 Minutes | 344 | 33.3% |
| 10 to 14 Minutes | 134 | 13.0% |
| 15 to 19 Minutes | 37 | 3.6% |
| 20 to 24 Minutes | 33 | 3.2% |
| 25 to 29 Minutes | 45 | 4.4% |
| 30 to 34 Minutes | 59 | 5.7% |
| 35 to 39 Minutes | 0 | 0.0% |
| 40 to 44 Minutes | 17 | 1.7% |
| 45 to 59 Minutes | 38 | 3.7% |
| 60 to 89 Minutes | 13 | 1.3% |
| 90 or more Minutes | 0 | 0.0% |
Commute Time by Sex in Rock Rapids
The most common commute times in Rock Rapids are 5 to 9 minutes (172 commuters, 30.4%) for males and 5 to 9 minutes (172 commuters, 36.7%) for females.
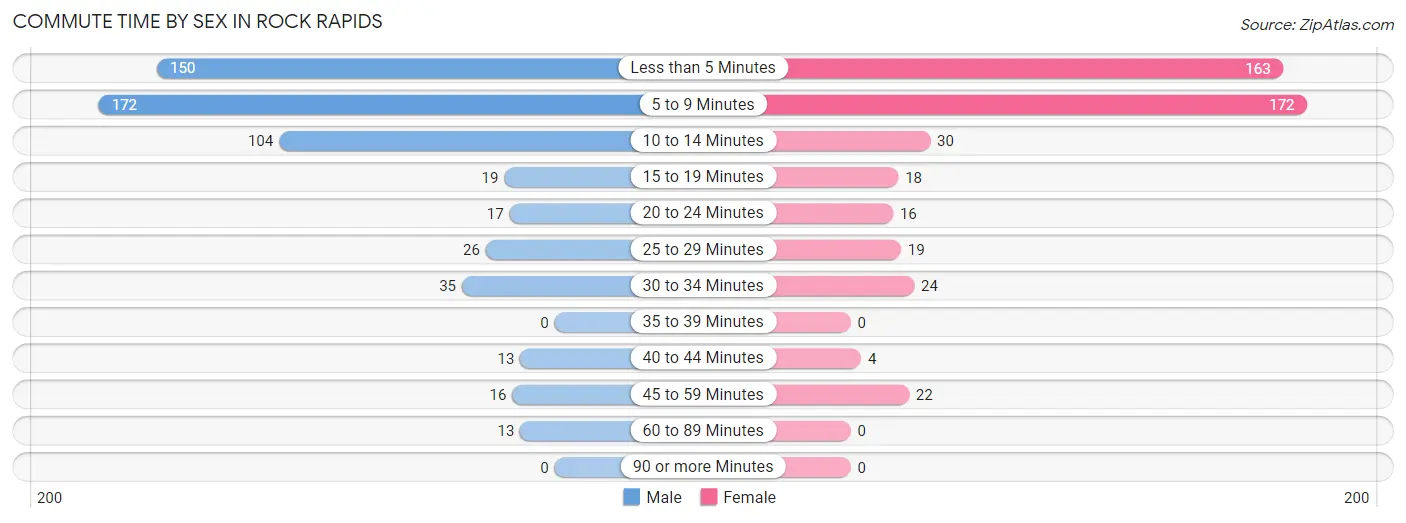
| Commute Time | Male | Female |
| Less than 5 Minutes | 150 (26.6%) | 163 (34.8%) |
| 5 to 9 Minutes | 172 (30.4%) | 172 (36.7%) |
| 10 to 14 Minutes | 104 (18.4%) | 30 (6.4%) |
| 15 to 19 Minutes | 19 (3.4%) | 18 (3.8%) |
| 20 to 24 Minutes | 17 (3.0%) | 16 (3.4%) |
| 25 to 29 Minutes | 26 (4.6%) | 19 (4.1%) |
| 30 to 34 Minutes | 35 (6.2%) | 24 (5.1%) |
| 35 to 39 Minutes | 0 (0.0%) | 0 (0.0%) |
| 40 to 44 Minutes | 13 (2.3%) | 4 (0.9%) |
| 45 to 59 Minutes | 16 (2.8%) | 22 (4.7%) |
| 60 to 89 Minutes | 13 (2.3%) | 0 (0.0%) |
| 90 or more Minutes | 0 (0.0%) | 0 (0.0%) |
Time of Departure to Work by Sex in Rock Rapids
The most frequent times of departure to work in Rock Rapids are 7:30 AM to 7:59 AM (165, 29.2%) for males and 7:30 AM to 7:59 AM (179, 38.3%) for females.
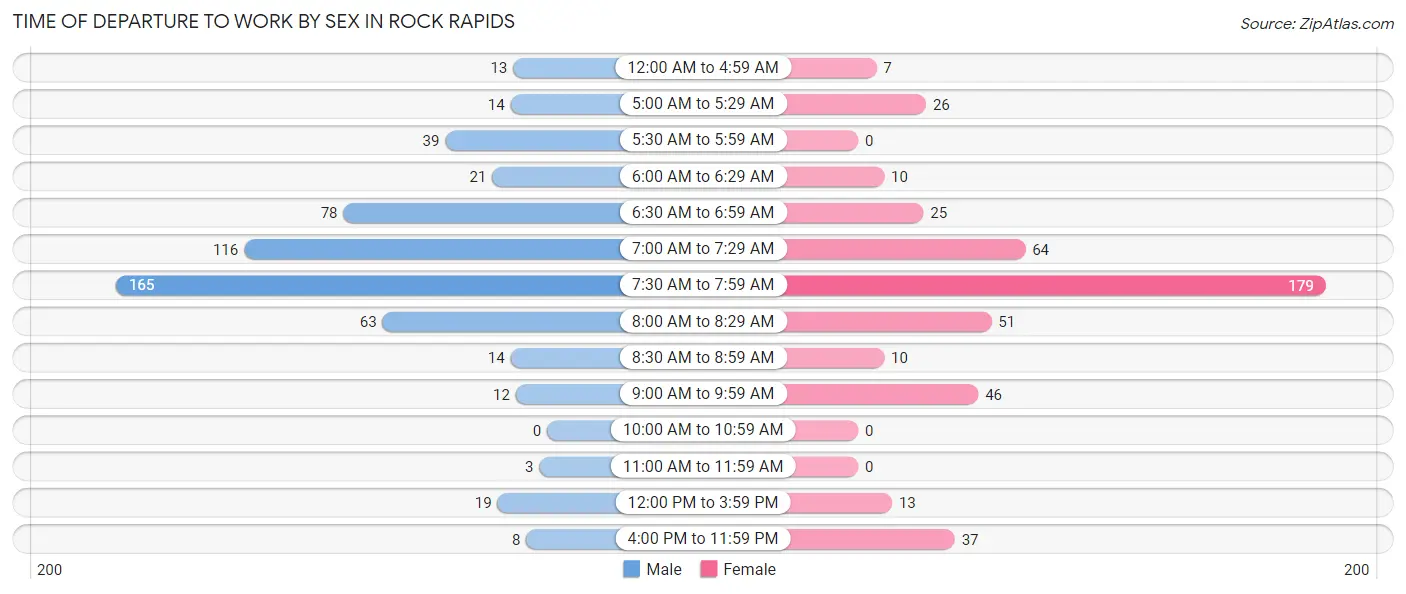
| Time of Departure | Male | Female |
| 12:00 AM to 4:59 AM | 13 (2.3%) | 7 (1.5%) |
| 5:00 AM to 5:29 AM | 14 (2.5%) | 26 (5.6%) |
| 5:30 AM to 5:59 AM | 39 (6.9%) | 0 (0.0%) |
| 6:00 AM to 6:29 AM | 21 (3.7%) | 10 (2.1%) |
| 6:30 AM to 6:59 AM | 78 (13.8%) | 25 (5.3%) |
| 7:00 AM to 7:29 AM | 116 (20.5%) | 64 (13.7%) |
| 7:30 AM to 7:59 AM | 165 (29.2%) | 179 (38.3%) |
| 8:00 AM to 8:29 AM | 63 (11.2%) | 51 (10.9%) |
| 8:30 AM to 8:59 AM | 14 (2.5%) | 10 (2.1%) |
| 9:00 AM to 9:59 AM | 12 (2.1%) | 46 (9.8%) |
| 10:00 AM to 10:59 AM | 0 (0.0%) | 0 (0.0%) |
| 11:00 AM to 11:59 AM | 3 (0.5%) | 0 (0.0%) |
| 12:00 PM to 3:59 PM | 19 (3.4%) | 13 (2.8%) |
| 4:00 PM to 11:59 PM | 8 (1.4%) | 37 (7.9%) |
| Total | 565 (100.0%) | 468 (100.0%) |
Housing Occupancy in Rock Rapids
Occupancy by Ownership in Rock Rapids
Of the total 950 dwellings in Rock Rapids, owner-occupied units account for 749 (78.8%), while renter-occupied units make up 201 (21.2%).
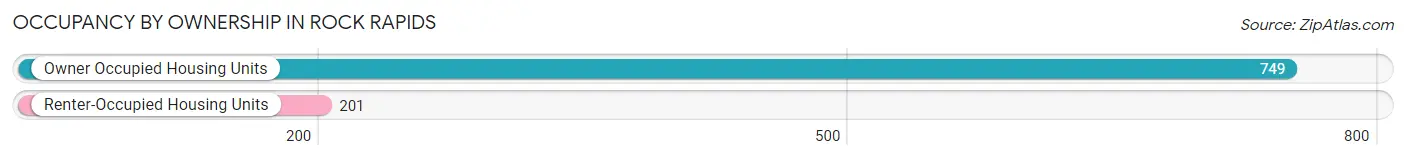
| Occupancy | # Housing Units | % Housing Units |
| Owner Occupied Housing Units | 749 | 78.8% |
| Renter-Occupied Housing Units | 201 | 21.2% |
| Total Occupied Housing Units | 950 | 100.0% |
Occupancy by Household Size in Rock Rapids
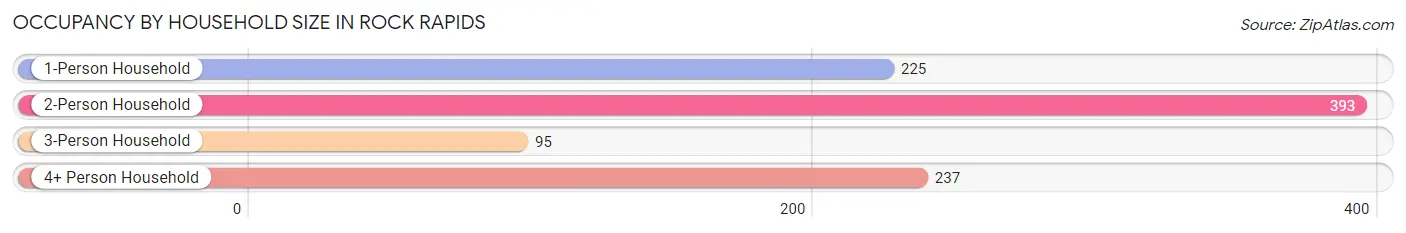
| Household Size | # Housing Units | % Housing Units |
| 1-Person Household | 225 | 23.7% |
| 2-Person Household | 393 | 41.4% |
| 3-Person Household | 95 | 10.0% |
| 4+ Person Household | 237 | 24.9% |
| Total Housing Units | 950 | 100.0% |
Occupancy by Ownership by Household Size in Rock Rapids
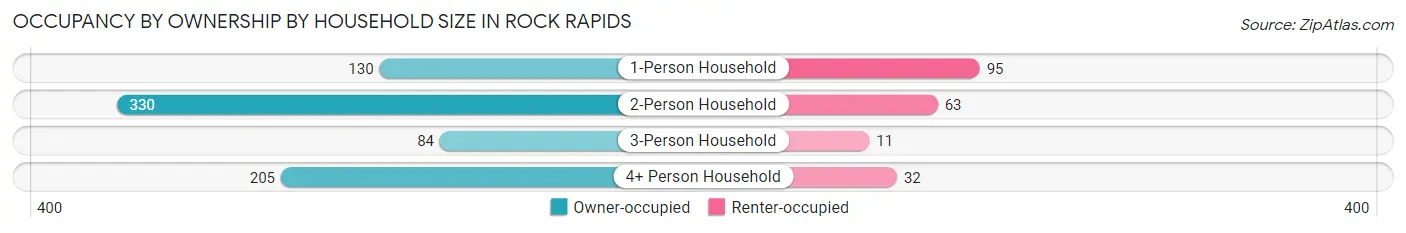
| Household Size | Owner-occupied | Renter-occupied |
| 1-Person Household | 130 (57.8%) | 95 (42.2%) |
| 2-Person Household | 330 (84.0%) | 63 (16.0%) |
| 3-Person Household | 84 (88.4%) | 11 (11.6%) |
| 4+ Person Household | 205 (86.5%) | 32 (13.5%) |
| Total Housing Units | 749 (78.8%) | 201 (21.2%) |
Occupancy by Educational Attainment in Rock Rapids
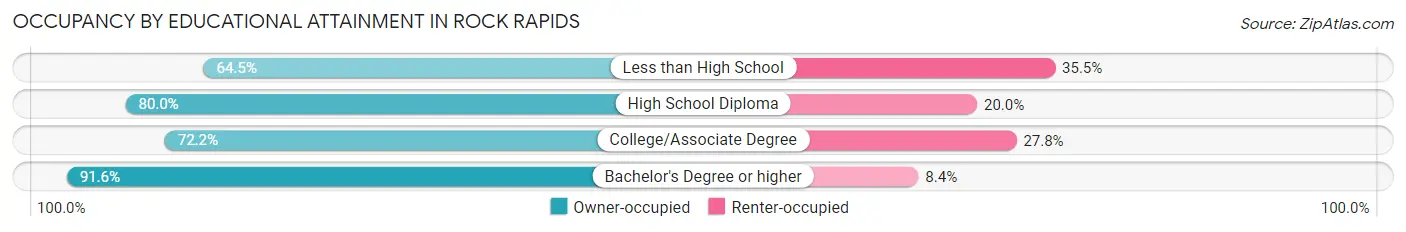
| Household Size | Owner-occupied | Renter-occupied |
| Less than High School | 40 (64.5%) | 22 (35.5%) |
| High School Diploma | 292 (80.0%) | 73 (20.0%) |
| College/Associate Degree | 231 (72.2%) | 89 (27.8%) |
| Bachelor's Degree or higher | 186 (91.6%) | 17 (8.4%) |
Occupancy by Age of Householder in Rock Rapids
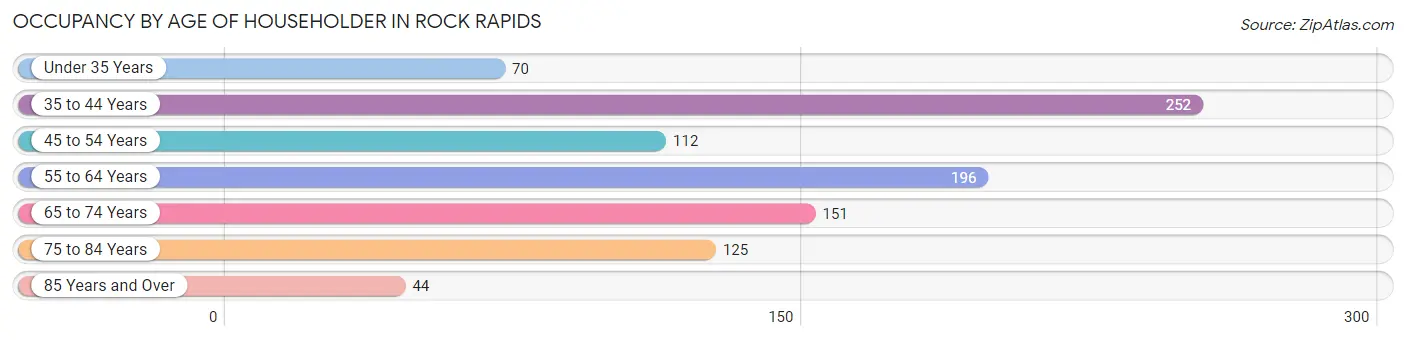
| Age Bracket | # Households | % Households |
| Under 35 Years | 70 | 7.4% |
| 35 to 44 Years | 252 | 26.5% |
| 45 to 54 Years | 112 | 11.8% |
| 55 to 64 Years | 196 | 20.6% |
| 65 to 74 Years | 151 | 15.9% |
| 75 to 84 Years | 125 | 13.2% |
| 85 Years and Over | 44 | 4.6% |
| Total | 950 | 100.0% |
Housing Finances in Rock Rapids
Median Income by Occupancy in Rock Rapids
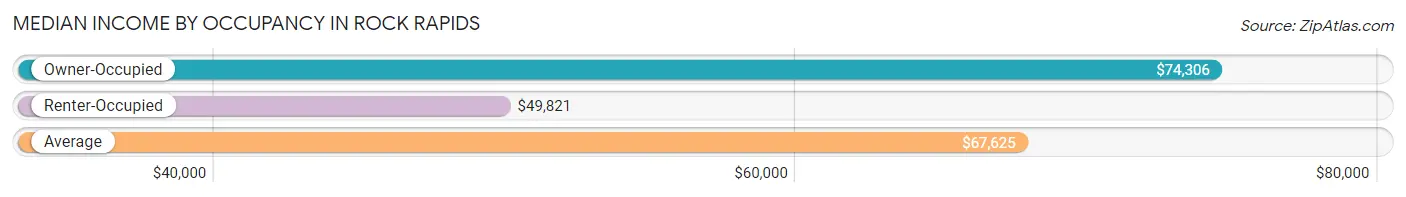
| Occupancy Type | # Households | Median Income |
| Owner-Occupied | 749 (78.8%) | $74,306 |
| Renter-Occupied | 201 (21.2%) | $49,821 |
| Average | 950 (100.0%) | $67,625 |
Occupancy by Householder Income Bracket in Rock Rapids
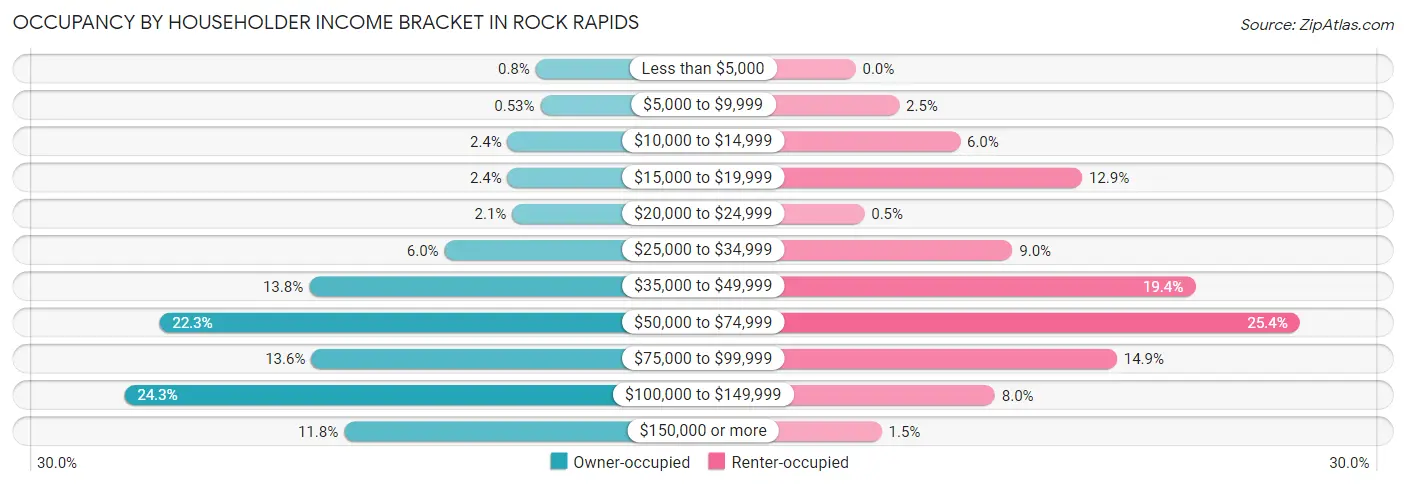
| Income Bracket | Owner-occupied | Renter-occupied |
| Less than $5,000 | 6 (0.8%) | 0 (0.0%) |
| $5,000 to $9,999 | 4 (0.5%) | 5 (2.5%) |
| $10,000 to $14,999 | 18 (2.4%) | 12 (6.0%) |
| $15,000 to $19,999 | 18 (2.4%) | 26 (12.9%) |
| $20,000 to $24,999 | 16 (2.1%) | 1 (0.5%) |
| $25,000 to $34,999 | 45 (6.0%) | 18 (9.0%) |
| $35,000 to $49,999 | 103 (13.8%) | 39 (19.4%) |
| $50,000 to $74,999 | 167 (22.3%) | 51 (25.4%) |
| $75,000 to $99,999 | 102 (13.6%) | 30 (14.9%) |
| $100,000 to $149,999 | 182 (24.3%) | 16 (8.0%) |
| $150,000 or more | 88 (11.7%) | 3 (1.5%) |
| Total | 749 (100.0%) | 201 (100.0%) |
Monthly Housing Cost Tiers in Rock Rapids
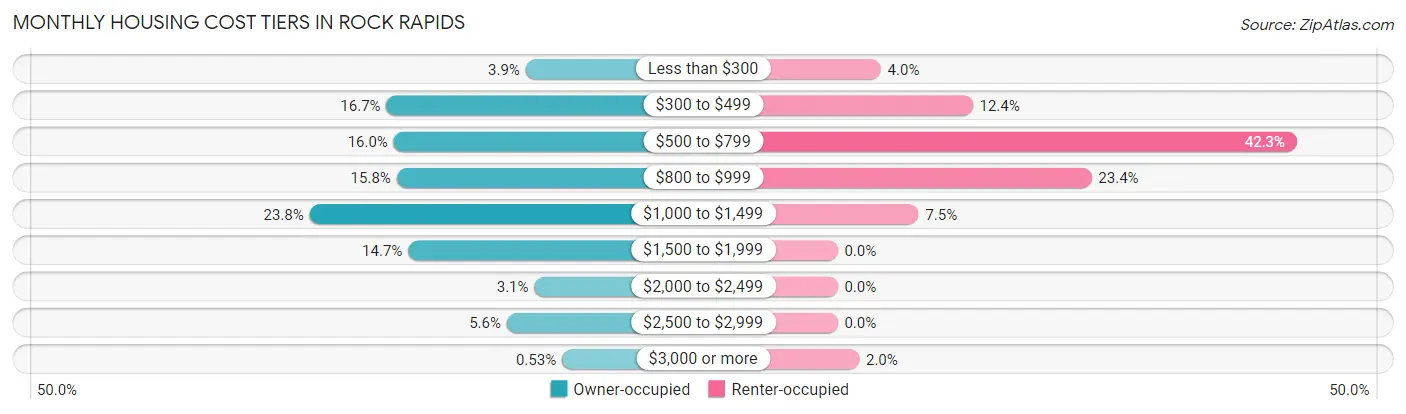
| Monthly Cost | Owner-occupied | Renter-occupied |
| Less than $300 | 29 (3.9%) | 8 (4.0%) |
| $300 to $499 | 125 (16.7%) | 25 (12.4%) |
| $500 to $799 | 120 (16.0%) | 85 (42.3%) |
| $800 to $999 | 118 (15.8%) | 47 (23.4%) |
| $1,000 to $1,499 | 178 (23.8%) | 15 (7.5%) |
| $1,500 to $1,999 | 110 (14.7%) | 0 (0.0%) |
| $2,000 to $2,499 | 23 (3.1%) | 0 (0.0%) |
| $2,500 to $2,999 | 42 (5.6%) | 0 (0.0%) |
| $3,000 or more | 4 (0.5%) | 4 (2.0%) |
| Total | 749 (100.0%) | 201 (100.0%) |
Physical Housing Characteristics in Rock Rapids
Housing Structures in Rock Rapids
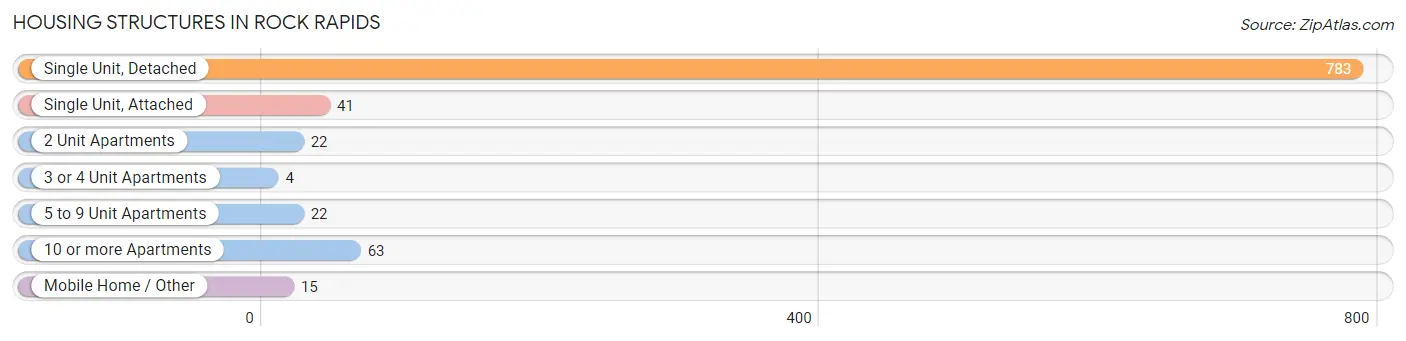
| Structure Type | # Housing Units | % Housing Units |
| Single Unit, Detached | 783 | 82.4% |
| Single Unit, Attached | 41 | 4.3% |
| 2 Unit Apartments | 22 | 2.3% |
| 3 or 4 Unit Apartments | 4 | 0.4% |
| 5 to 9 Unit Apartments | 22 | 2.3% |
| 10 or more Apartments | 63 | 6.6% |
| Mobile Home / Other | 15 | 1.6% |
| Total | 950 | 100.0% |
Housing Structures by Occupancy in Rock Rapids
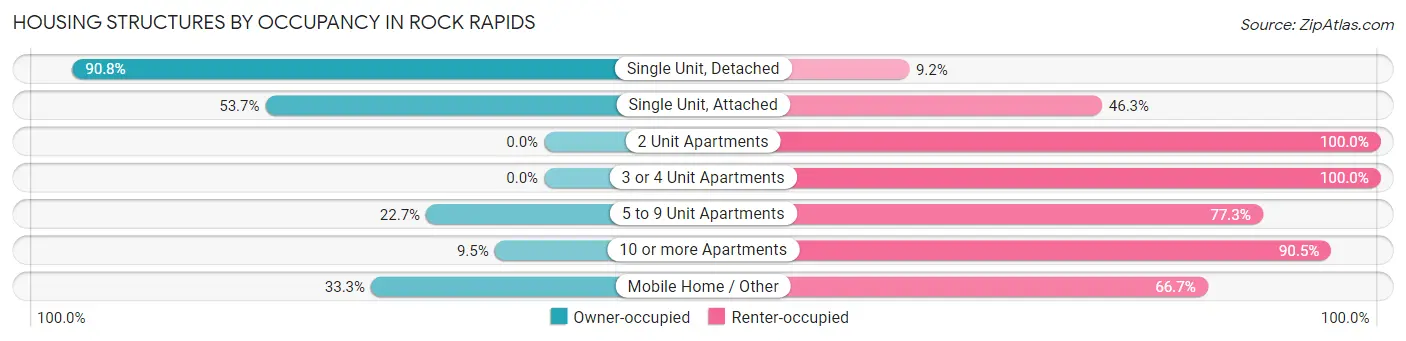
| Structure Type | Owner-occupied | Renter-occupied |
| Single Unit, Detached | 711 (90.8%) | 72 (9.2%) |
| Single Unit, Attached | 22 (53.7%) | 19 (46.3%) |
| 2 Unit Apartments | 0 (0.0%) | 22 (100.0%) |
| 3 or 4 Unit Apartments | 0 (0.0%) | 4 (100.0%) |
| 5 to 9 Unit Apartments | 5 (22.7%) | 17 (77.3%) |
| 10 or more Apartments | 6 (9.5%) | 57 (90.5%) |
| Mobile Home / Other | 5 (33.3%) | 10 (66.7%) |
| Total | 749 (78.8%) | 201 (21.2%) |
Housing Structures by Number of Rooms in Rock Rapids
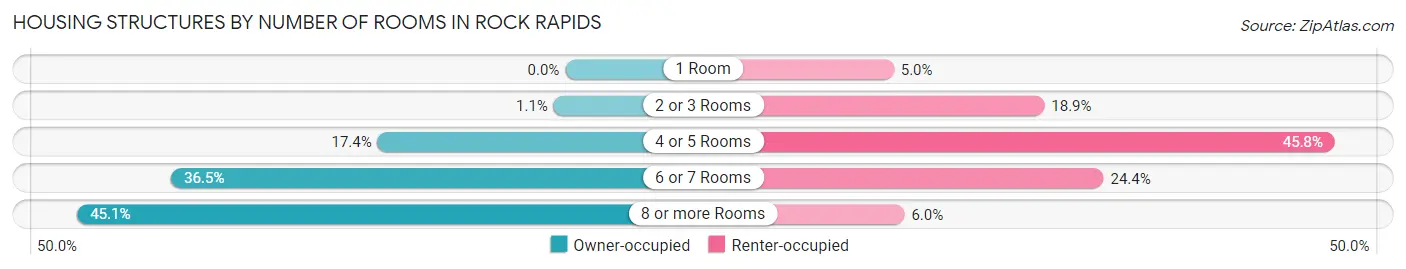
| Number of Rooms | Owner-occupied | Renter-occupied |
| 1 Room | 0 (0.0%) | 10 (5.0%) |
| 2 or 3 Rooms | 8 (1.1%) | 38 (18.9%) |
| 4 or 5 Rooms | 130 (17.4%) | 92 (45.8%) |
| 6 or 7 Rooms | 273 (36.4%) | 49 (24.4%) |
| 8 or more Rooms | 338 (45.1%) | 12 (6.0%) |
| Total | 749 (100.0%) | 201 (100.0%) |
Housing Structure by Heating Type in Rock Rapids
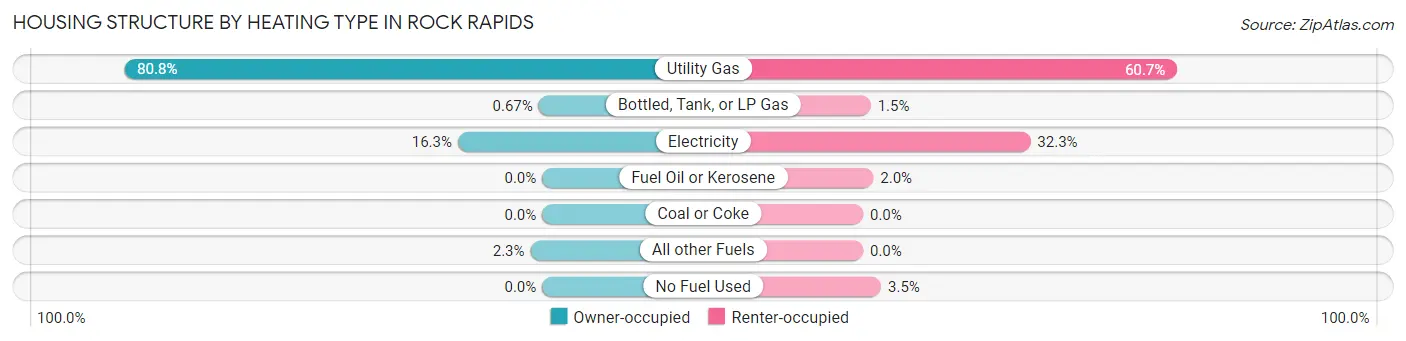
| Heating Type | Owner-occupied | Renter-occupied |
| Utility Gas | 605 (80.8%) | 122 (60.7%) |
| Bottled, Tank, or LP Gas | 5 (0.7%) | 3 (1.5%) |
| Electricity | 122 (16.3%) | 65 (32.3%) |
| Fuel Oil or Kerosene | 0 (0.0%) | 4 (2.0%) |
| Coal or Coke | 0 (0.0%) | 0 (0.0%) |
| All other Fuels | 17 (2.3%) | 0 (0.0%) |
| No Fuel Used | 0 (0.0%) | 7 (3.5%) |
| Total | 749 (100.0%) | 201 (100.0%) |
Household Vehicle Usage in Rock Rapids
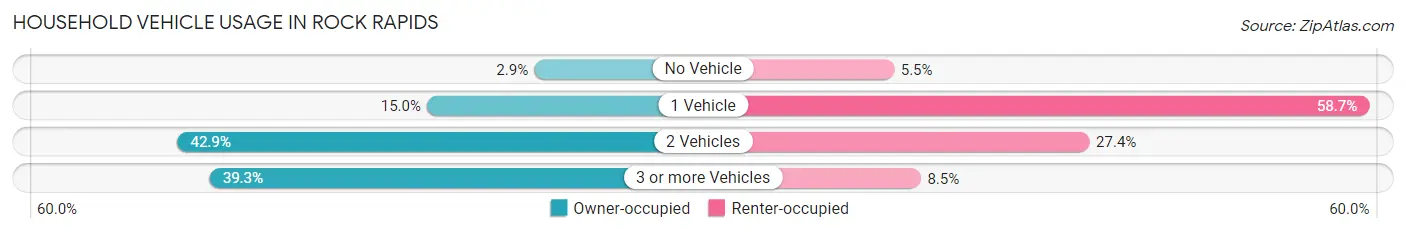
| Vehicles per Household | Owner-occupied | Renter-occupied |
| No Vehicle | 22 (2.9%) | 11 (5.5%) |
| 1 Vehicle | 112 (14.9%) | 118 (58.7%) |
| 2 Vehicles | 321 (42.9%) | 55 (27.4%) |
| 3 or more Vehicles | 294 (39.3%) | 17 (8.5%) |
| Total | 749 (100.0%) | 201 (100.0%) |
Real Estate & Mortgages in Rock Rapids
Real Estate and Mortgage Overview in Rock Rapids
| Characteristic | Without Mortgage | With Mortgage |
| Housing Units | 299 | 450 |
| Median Property Value | $168,800 | $206,500 |
| Median Household Income | $57,969 | $72 |
| Monthly Housing Costs | $494 | $4 |
| Real Estate Taxes | $2,486 | $10 |
Property Value by Mortgage Status in Rock Rapids
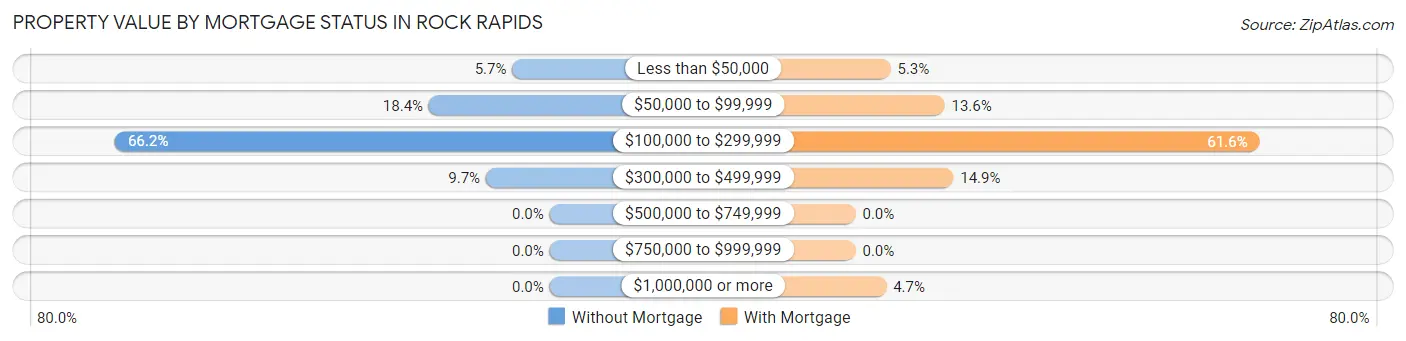
| Property Value | Without Mortgage | With Mortgage |
| Less than $50,000 | 17 (5.7%) | 24 (5.3%) |
| $50,000 to $99,999 | 55 (18.4%) | 61 (13.6%) |
| $100,000 to $299,999 | 198 (66.2%) | 277 (61.6%) |
| $300,000 to $499,999 | 29 (9.7%) | 67 (14.9%) |
| $500,000 to $749,999 | 0 (0.0%) | 0 (0.0%) |
| $750,000 to $999,999 | 0 (0.0%) | 0 (0.0%) |
| $1,000,000 or more | 0 (0.0%) | 21 (4.7%) |
| Total | 299 (100.0%) | 450 (100.0%) |
Household Income by Mortgage Status in Rock Rapids
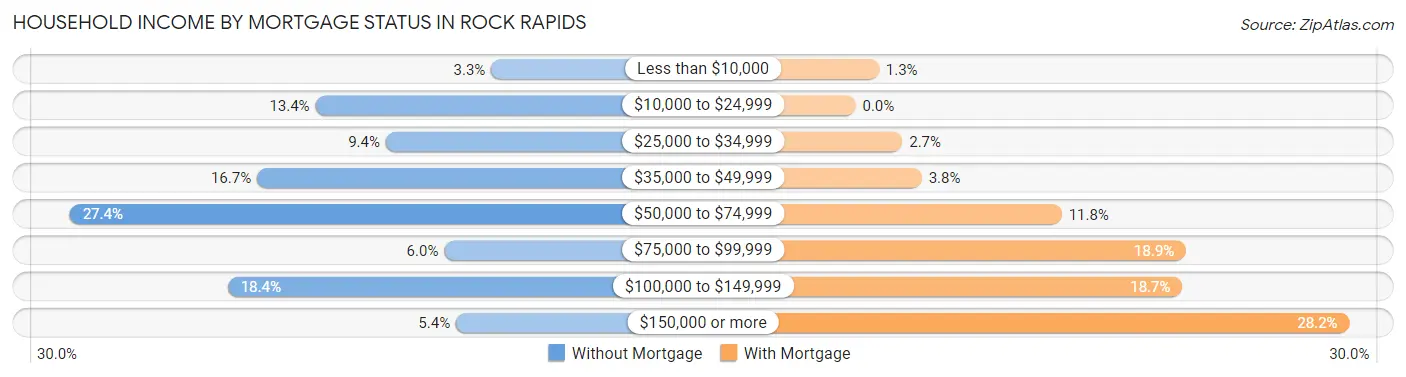
| Household Income | Without Mortgage | With Mortgage |
| Less than $10,000 | 10 (3.3%) | 6 (1.3%) |
| $10,000 to $24,999 | 40 (13.4%) | 0 (0.0%) |
| $25,000 to $34,999 | 28 (9.4%) | 12 (2.7%) |
| $35,000 to $49,999 | 50 (16.7%) | 17 (3.8%) |
| $50,000 to $74,999 | 82 (27.4%) | 53 (11.8%) |
| $75,000 to $99,999 | 18 (6.0%) | 85 (18.9%) |
| $100,000 to $149,999 | 55 (18.4%) | 84 (18.7%) |
| $150,000 or more | 16 (5.3%) | 127 (28.2%) |
| Total | 299 (100.0%) | 450 (100.0%) |
Property Value to Household Income Ratio in Rock Rapids
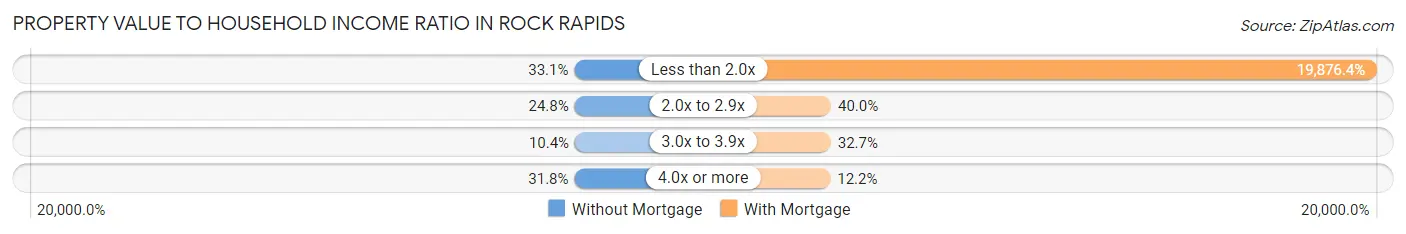
| Value-to-Income Ratio | Without Mortgage | With Mortgage |
| Less than 2.0x | 99 (33.1%) | 89,444 (19,876.4%) |
| 2.0x to 2.9x | 74 (24.7%) | 180 (40.0%) |
| 3.0x to 3.9x | 31 (10.4%) | 147 (32.7%) |
| 4.0x or more | 95 (31.8%) | 55 (12.2%) |
| Total | 299 (100.0%) | 450 (100.0%) |
Real Estate Taxes by Mortgage Status in Rock Rapids
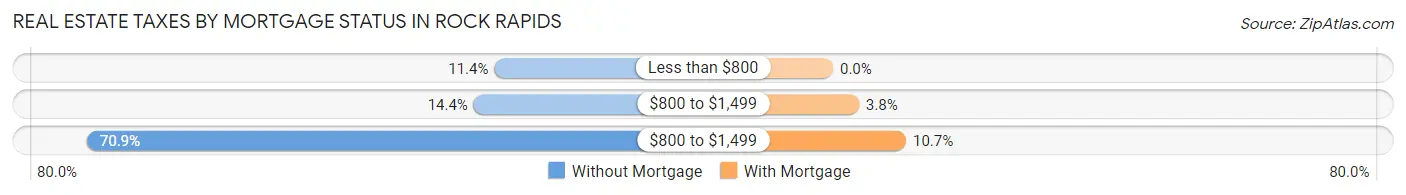
| Property Taxes | Without Mortgage | With Mortgage |
| Less than $800 | 34 (11.4%) | 0 (0.0%) |
| $800 to $1,499 | 43 (14.4%) | 17 (3.8%) |
| $800 to $1,499 | 212 (70.9%) | 48 (10.7%) |
| Total | 299 (100.0%) | 450 (100.0%) |
Health & Disability in Rock Rapids
Health Insurance Coverage by Age in Rock Rapids
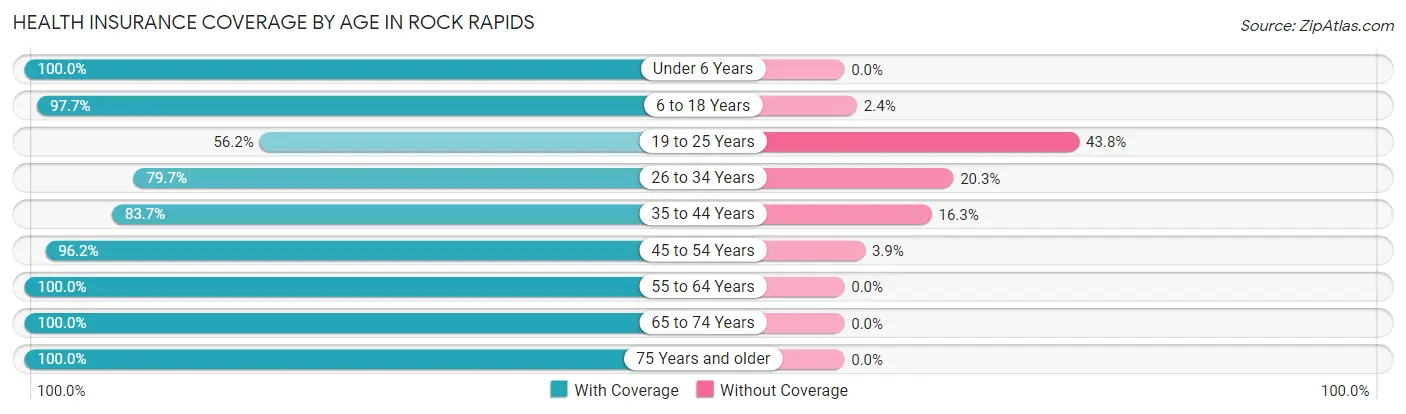
| Age Bracket | With Coverage | Without Coverage |
| Under 6 Years | 141 (100.0%) | 0 (0.0%) |
| 6 to 18 Years | 705 (97.7%) | 17 (2.4%) |
| 19 to 25 Years | 68 (56.2%) | 53 (43.8%) |
| 26 to 34 Years | 51 (79.7%) | 13 (20.3%) |
| 35 to 44 Years | 386 (83.7%) | 75 (16.3%) |
| 45 to 54 Years | 175 (96.2%) | 7 (3.8%) |
| 55 to 64 Years | 364 (100.0%) | 0 (0.0%) |
| 65 to 74 Years | 264 (100.0%) | 0 (0.0%) |
| 75 Years and older | 209 (100.0%) | 0 (0.0%) |
| Total | 2,363 (93.5%) | 165 (6.5%) |
Health Insurance Coverage by Citizenship Status in Rock Rapids
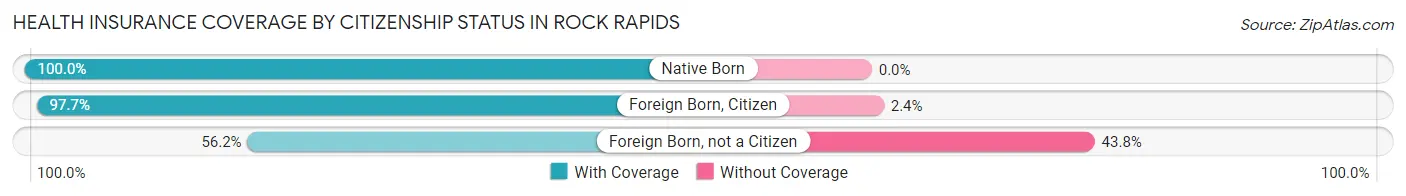
| Citizenship Status | With Coverage | Without Coverage |
| Native Born | 141 (100.0%) | 0 (0.0%) |
| Foreign Born, Citizen | 705 (97.7%) | 17 (2.4%) |
| Foreign Born, not a Citizen | 68 (56.2%) | 53 (43.8%) |
Health Insurance Coverage by Household Income in Rock Rapids
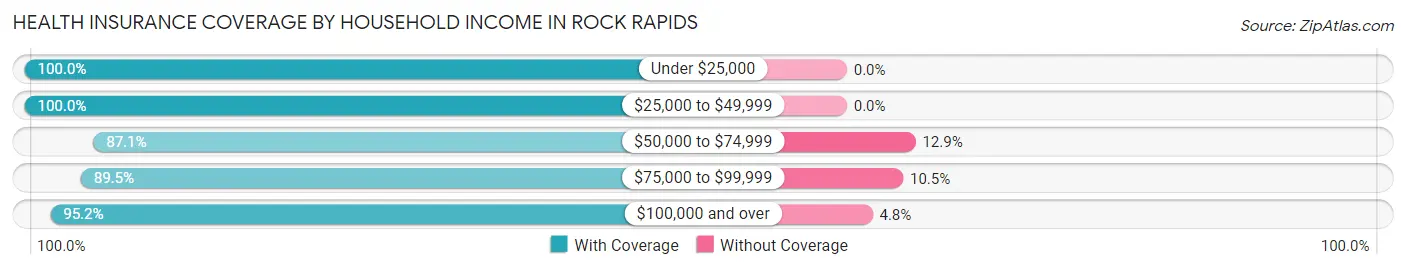
| Household Income | With Coverage | Without Coverage |
| Under $25,000 | 139 (100.0%) | 0 (0.0%) |
| $25,000 to $49,999 | 390 (100.0%) | 0 (0.0%) |
| $50,000 to $74,999 | 467 (87.1%) | 69 (12.9%) |
| $75,000 to $99,999 | 399 (89.5%) | 47 (10.5%) |
| $100,000 and over | 967 (95.2%) | 49 (4.8%) |
Public vs Private Health Insurance Coverage by Age in Rock Rapids
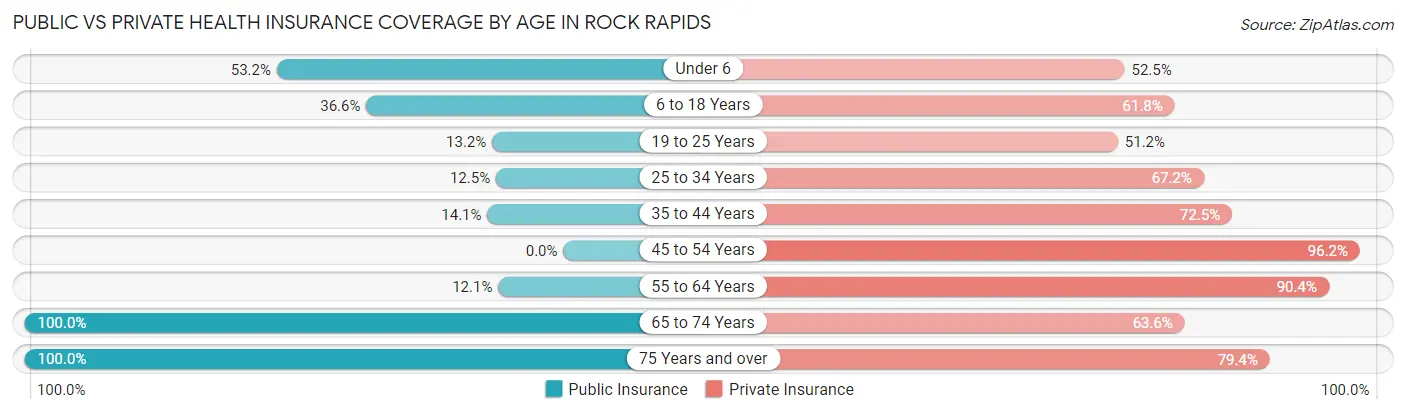
| Age Bracket | Public Insurance | Private Insurance |
| Under 6 | 75 (53.2%) | 74 (52.5%) |
| 6 to 18 Years | 264 (36.6%) | 446 (61.8%) |
| 19 to 25 Years | 16 (13.2%) | 62 (51.2%) |
| 25 to 34 Years | 8 (12.5%) | 43 (67.2%) |
| 35 to 44 Years | 65 (14.1%) | 334 (72.5%) |
| 45 to 54 Years | 0 (0.0%) | 175 (96.2%) |
| 55 to 64 Years | 44 (12.1%) | 329 (90.4%) |
| 65 to 74 Years | 264 (100.0%) | 168 (63.6%) |
| 75 Years and over | 209 (100.0%) | 166 (79.4%) |
| Total | 945 (37.4%) | 1,797 (71.1%) |
Disability Status by Sex by Age in Rock Rapids
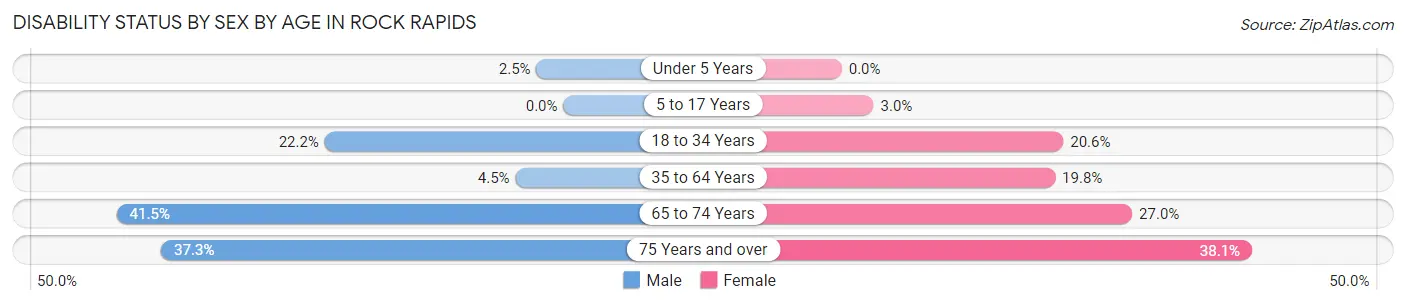
| Age Bracket | Male | Female |
| Under 5 Years | 2 (2.5%) | 0 (0.0%) |
| 5 to 17 Years | 0 (0.0%) | 7 (2.9%) |
| 18 to 34 Years | 35 (22.2%) | 22 (20.6%) |
| 35 to 64 Years | 23 (4.4%) | 97 (19.8%) |
| 65 to 74 Years | 51 (41.5%) | 38 (27.0%) |
| 75 Years and over | 28 (37.3%) | 51 (38.1%) |
Disability Class by Sex by Age in Rock Rapids
Disability Class: Hearing Difficulty
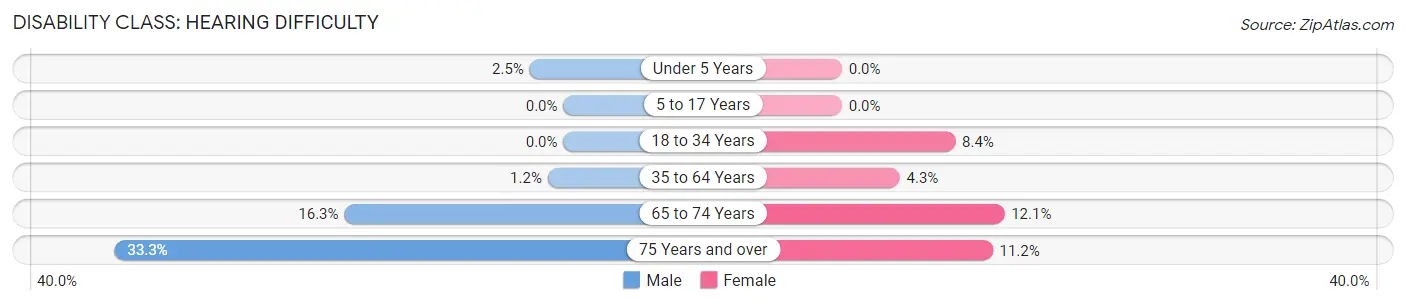
| Age Bracket | Male | Female |
| Under 5 Years | 2 (2.5%) | 0 (0.0%) |
| 5 to 17 Years | 0 (0.0%) | 0 (0.0%) |
| 18 to 34 Years | 0 (0.0%) | 9 (8.4%) |
| 35 to 64 Years | 6 (1.2%) | 21 (4.3%) |
| 65 to 74 Years | 20 (16.3%) | 17 (12.1%) |
| 75 Years and over | 25 (33.3%) | 15 (11.2%) |
Disability Class: Vision Difficulty
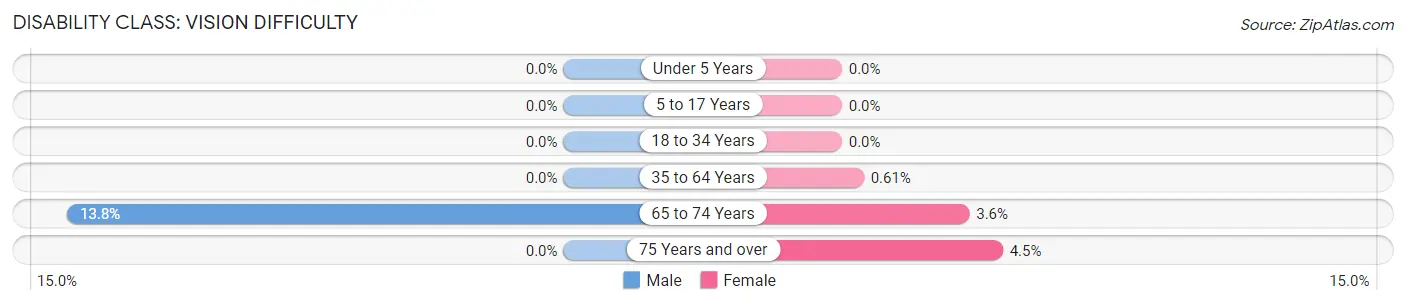
| Age Bracket | Male | Female |
| Under 5 Years | 0 (0.0%) | 0 (0.0%) |
| 5 to 17 Years | 0 (0.0%) | 0 (0.0%) |
| 18 to 34 Years | 0 (0.0%) | 0 (0.0%) |
| 35 to 64 Years | 0 (0.0%) | 3 (0.6%) |
| 65 to 74 Years | 17 (13.8%) | 5 (3.5%) |
| 75 Years and over | 0 (0.0%) | 6 (4.5%) |
Disability Class: Cognitive Difficulty
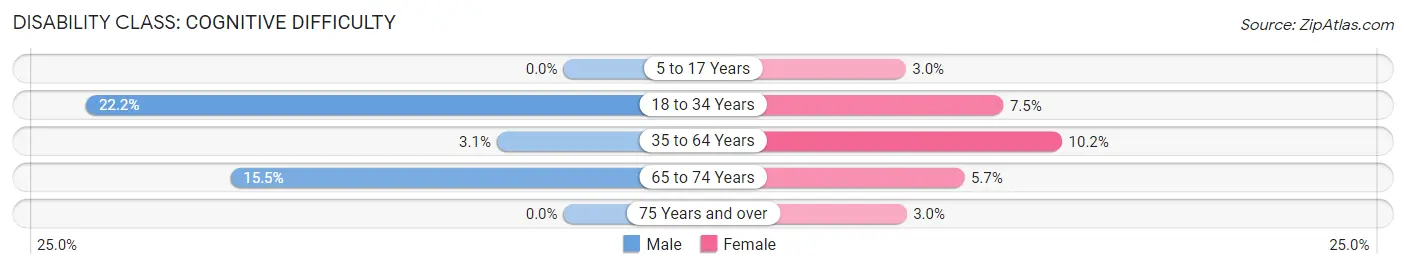
| Age Bracket | Male | Female |
| 5 to 17 Years | 0 (0.0%) | 7 (2.9%) |
| 18 to 34 Years | 35 (22.2%) | 8 (7.5%) |
| 35 to 64 Years | 16 (3.1%) | 50 (10.2%) |
| 65 to 74 Years | 19 (15.4%) | 8 (5.7%) |
| 75 Years and over | 0 (0.0%) | 4 (3.0%) |
Disability Class: Ambulatory Difficulty
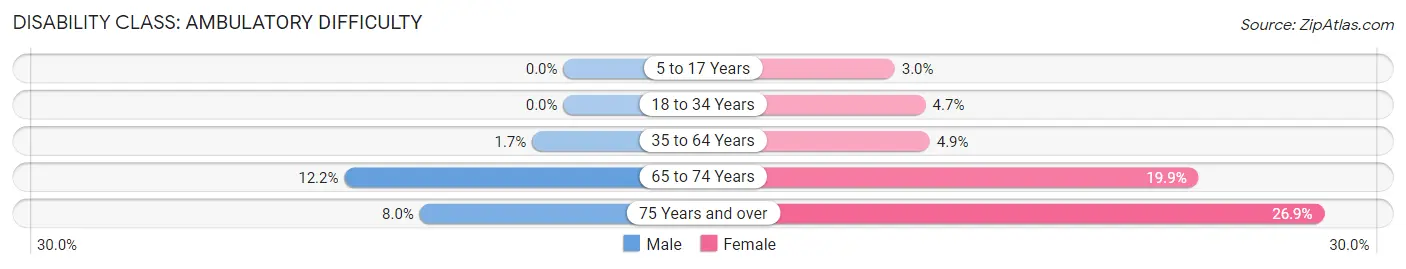
| Age Bracket | Male | Female |
| 5 to 17 Years | 0 (0.0%) | 7 (2.9%) |
| 18 to 34 Years | 0 (0.0%) | 5 (4.7%) |
| 35 to 64 Years | 9 (1.7%) | 24 (4.9%) |
| 65 to 74 Years | 15 (12.2%) | 28 (19.9%) |
| 75 Years and over | 6 (8.0%) | 36 (26.9%) |
Disability Class: Self-Care Difficulty
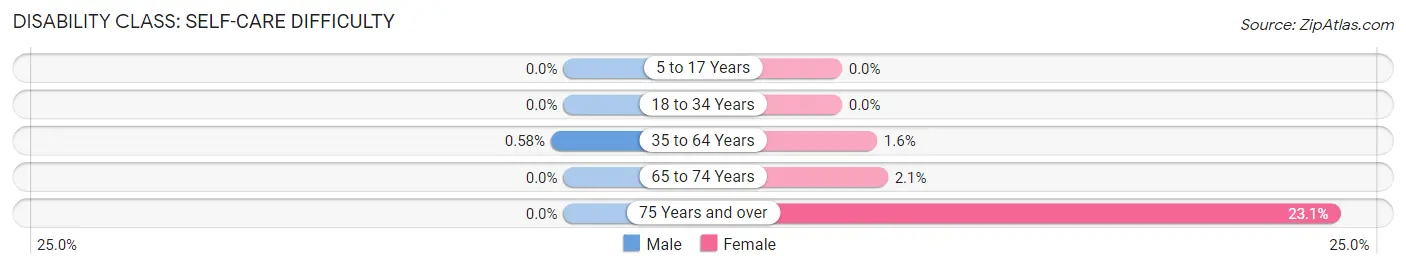
| Age Bracket | Male | Female |
| 5 to 17 Years | 0 (0.0%) | 0 (0.0%) |
| 18 to 34 Years | 0 (0.0%) | 0 (0.0%) |
| 35 to 64 Years | 3 (0.6%) | 8 (1.6%) |
| 65 to 74 Years | 0 (0.0%) | 3 (2.1%) |
| 75 Years and over | 0 (0.0%) | 31 (23.1%) |
Technology Access in Rock Rapids
Computing Device Access in Rock Rapids
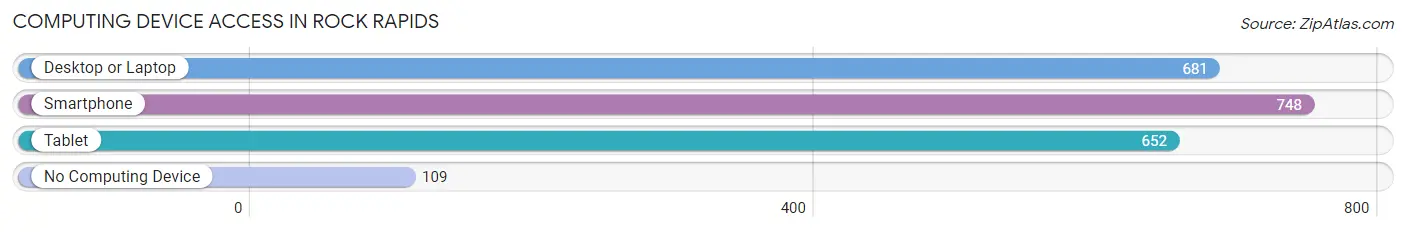
| Device Type | # Households | % Households |
| Desktop or Laptop | 681 | 71.7% |
| Smartphone | 748 | 78.7% |
| Tablet | 652 | 68.6% |
| No Computing Device | 109 | 11.5% |
| Total | 950 | 100.0% |
Internet Access in Rock Rapids
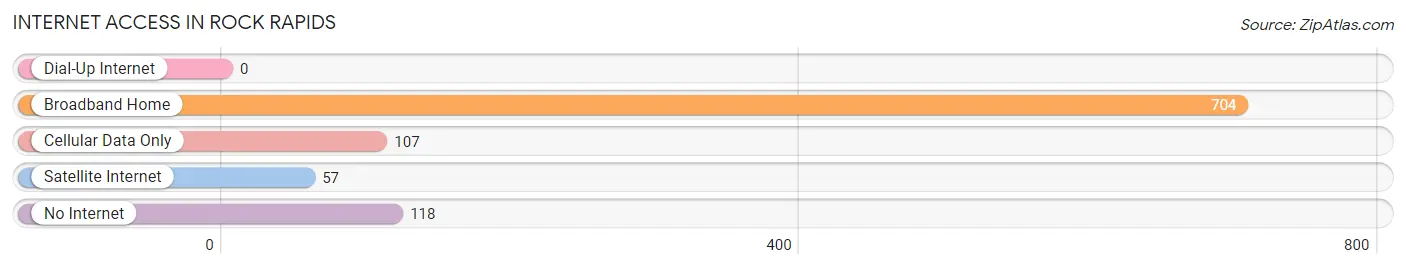
| Internet Type | # Households | % Households |
| Dial-Up Internet | 0 | 0.0% |
| Broadband Home | 704 | 74.1% |
| Cellular Data Only | 107 | 11.3% |
| Satellite Internet | 57 | 6.0% |
| No Internet | 118 | 12.4% |
| Total | 950 | 100.0% |
Rock Rapids Summary
History
Rock Rapids, Iowa is a small city located in Lyon County, Iowa. It is situated on the banks of the Rock River, which is a tributary of the Big Sioux River. The city was founded in 1871 by a group of settlers from Rockford, Illinois. The city was named after the rapids in the Rock River.
The first settlers in the area were mostly farmers, and the city quickly grew as a center for agriculture. The first post office was established in 1872, and the first school was built in 1873. The city was incorporated in 1876.
In the late 19th century, Rock Rapids became a major railroad hub, with the Chicago, Milwaukee, St. Paul and Pacific Railroad running through the city. This allowed the city to become a major shipping center for the surrounding area.
The city continued to grow throughout the 20th century, and by the 2000 census, the population had grown to 2,845.
Geography
Rock Rapids is located in Lyon County, Iowa, in the northwest corner of the state. It is situated on the banks of the Rock River, which is a tributary of the Big Sioux River. The city is located at an elevation of 1,072 feet (326 m).
The city has a total area of 2.2 square miles (5.7 km2), all of which is land. The climate is characterized by hot, humid summers and cold, dry winters. The average annual temperature is 48.2 °F (9.0 °C).
Economy
Rock Rapids is a small city with a population of just over 2,800 people. The city’s economy is largely based on agriculture, with the surrounding area being home to many farms and ranches. The city is also home to several manufacturing companies, including a plastics manufacturer and a metal fabrication company.
The city is also home to several retail stores, restaurants, and other businesses. The city is served by the Rock Rapids Municipal Airport, which is located just outside of town.
Demographics
As of the 2000 census, there were 2,845 people, 1,093 households, and 745 families living in the city. The population density was 1,279.2 people per square mile (493.2/km2). There were 1,179 housing units at an average density of 527.2 per square mile (203.3/km2).
The racial makeup of the city was 97.2% White, 0.3% African American, 0.3% Native American, 0.3% Asian, 0.1% Pacific Islander, 0.7% from other races, and 1.2% from two or more races. Hispanic or Latino of any race were 1.7% of the population.
There were 1,093 households, out of which 33.2% had children under the age of 18 living with them, 54.2% were married couples living together, 9.3% had a female householder with no husband present, and 32.2% were non-families. 28.2% of all households were made up of individuals, and 14.7% had someone living alone who was 65 years of age or older. The average household size was 2.50 and the average family size was 3.06.
In the city, the population was spread out, with 26.7% under the age of 18, 8.2% from 18 to 24, 26.2% from 25 to 44, 21.2% from 45 to 64, and 17.7% who were 65 years of age or older. The median age was 38 years. For every 100 females, there were 92.2 males. For every 100 females age 18 and over, there were 88.2 males.
The median income for a household in the city was $37,917, and the median income for a family was $45,000. Males had a median income of $30,938 versus $21,964 for females. The per capita income for the city was $17,845. About 6.2% of families and 8.2% of the population were below the poverty line, including 10.2% of those under age 18 and 8.2% of those age 65 or over.
Common Questions
What is Per Capita Income in Rock Rapids?
Per Capita income in Rock Rapids is $30,853.
What is the Median Family Income in Rock Rapids?
Median Family Income in Rock Rapids is $77,464.
What is the Median Household income in Rock Rapids?
Median Household Income in Rock Rapids is $67,625.
What is Income or Wage Gap in Rock Rapids?
Income or Wage Gap in Rock Rapids is 27.8%.
Women in Rock Rapids earn 72.2 cents for every dollar earned by a man.
What is Inequality or Gini Index in Rock Rapids?
Inequality or Gini Index in Rock Rapids is 0.38.
What is the Total Population of Rock Rapids?
Total Population of Rock Rapids is 2,631.
What is the Total Male Population of Rock Rapids?
Total Male Population of Rock Rapids is 1,425.
What is the Total Female Population of Rock Rapids?
Total Female Population of Rock Rapids is 1,206.
What is the Ratio of Males per 100 Females in Rock Rapids?
There are 118.16 Males per 100 Females in Rock Rapids.
What is the Ratio of Females per 100 Males in Rock Rapids?
There are 84.63 Females per 100 Males in Rock Rapids.
What is the Median Population Age in Rock Rapids?
Median Population Age in Rock Rapids is 40.6 Years.
What is the Average Family Size in Rock Rapids
Average Family Size in Rock Rapids is 3.3 People.
What is the Average Household Size in Rock Rapids
Average Household Size in Rock Rapids is 2.7 People.
How Large is the Labor Force in Rock Rapids?
There are 1,210 People in the Labor Forcein in Rock Rapids.
What is the Percentage of People in the Labor Force in Rock Rapids?
63.1% of People are in the Labor Force in Rock Rapids.
What is the Unemployment Rate in Rock Rapids?
Unemployment Rate in Rock Rapids is 4.1%.