Peterson, IA Map & Demographics
Peterson Map
Peterson Overview
$36,312
PER CAPITA INCOME
$74,583
AVG FAMILY INCOME
$68,750
AVG HOUSEHOLD INCOME
48.7%
WAGE / INCOME GAP [ % ]
51.3¢/ $1
WAGE / INCOME GAP [ $ ]
0.38
INEQUALITY / GINI INDEX
382
TOTAL POPULATION
202
MALE POPULATION
180
FEMALE POPULATION
112.22
MALES / 100 FEMALES
89.11
FEMALES / 100 MALES
38.8
MEDIAN AGE
3.2
AVG FAMILY SIZE
2.4
AVG HOUSEHOLD SIZE
200
LABOR FORCE [ PEOPLE ]
68.3%
PERCENT IN LABOR FORCE
3.0%
UNEMPLOYMENT RATE
Peterson Zip Codes
Peterson Area Codes
Income in Peterson
Income Overview in Peterson
Per Capita Income in Peterson is $36,312, while median incomes of families and households are $74,583 and $68,750 respectively.
| Characteristic | Number | Measure |
| Per Capita Income | 382 | $36,312 |
| Median Family Income | 85 | $74,583 |
| Mean Family Income | 85 | $87,860 |
| Median Household Income | 160 | $68,750 |
| Mean Household Income | 160 | $84,746 |
| Income Deficit | 85 | $0 |
| Wage / Income Gap (%) | 382 | 48.74% |
| Wage / Income Gap ($) | 382 | 51.26¢ per $1 |
| Gini / Inequality Index | 382 | 0.38 |
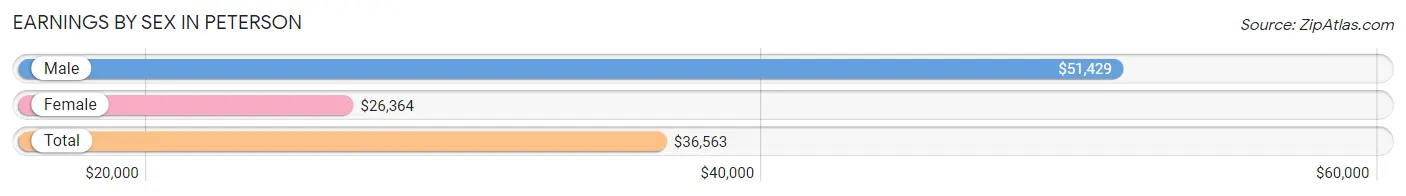
Earnings by Sex in Peterson
Average Earnings in Peterson are $36,563, $51,429 for men and $26,364 for women, a difference of 48.7%.
| Sex | Number | Average Earnings |
| Male | 126 (60.0%) | $51,429 |
| Female | 84 (40.0%) | $26,364 |
| Total | 210 (100.0%) | $36,563 |
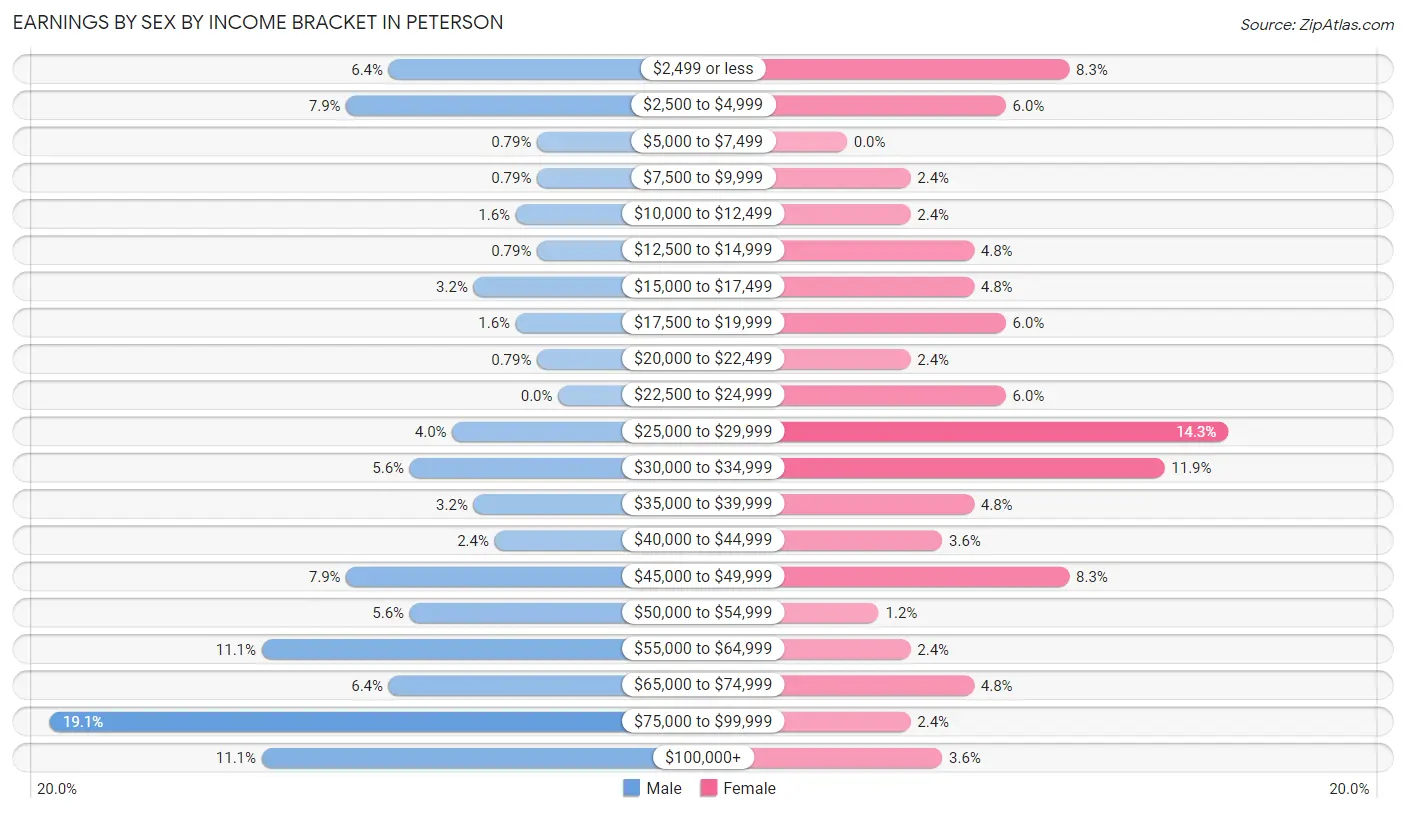
Earnings by Sex by Income Bracket in Peterson
The most common earnings brackets in Peterson are $75,000 to $99,999 for men (24 | 19.1%) and $25,000 to $29,999 for women (12 | 14.3%).
| Income | Male | Female |
| $2,499 or less | 8 (6.4%) | 7 (8.3%) |
| $2,500 to $4,999 | 10 (7.9%) | 5 (5.9%) |
| $5,000 to $7,499 | 1 (0.8%) | 0 (0.0%) |
| $7,500 to $9,999 | 1 (0.8%) | 2 (2.4%) |
| $10,000 to $12,499 | 2 (1.6%) | 2 (2.4%) |
| $12,500 to $14,999 | 1 (0.8%) | 4 (4.8%) |
| $15,000 to $17,499 | 4 (3.2%) | 4 (4.8%) |
| $17,500 to $19,999 | 2 (1.6%) | 5 (5.9%) |
| $20,000 to $22,499 | 1 (0.8%) | 2 (2.4%) |
| $22,500 to $24,999 | 0 (0.0%) | 5 (5.9%) |
| $25,000 to $29,999 | 5 (4.0%) | 12 (14.3%) |
| $30,000 to $34,999 | 7 (5.6%) | 10 (11.9%) |
| $35,000 to $39,999 | 4 (3.2%) | 4 (4.8%) |
| $40,000 to $44,999 | 3 (2.4%) | 3 (3.6%) |
| $45,000 to $49,999 | 10 (7.9%) | 7 (8.3%) |
| $50,000 to $54,999 | 7 (5.6%) | 1 (1.2%) |
| $55,000 to $64,999 | 14 (11.1%) | 2 (2.4%) |
| $65,000 to $74,999 | 8 (6.4%) | 4 (4.8%) |
| $75,000 to $99,999 | 24 (19.1%) | 2 (2.4%) |
| $100,000+ | 14 (11.1%) | 3 (3.6%) |
| Total | 126 (100.0%) | 84 (100.0%) |
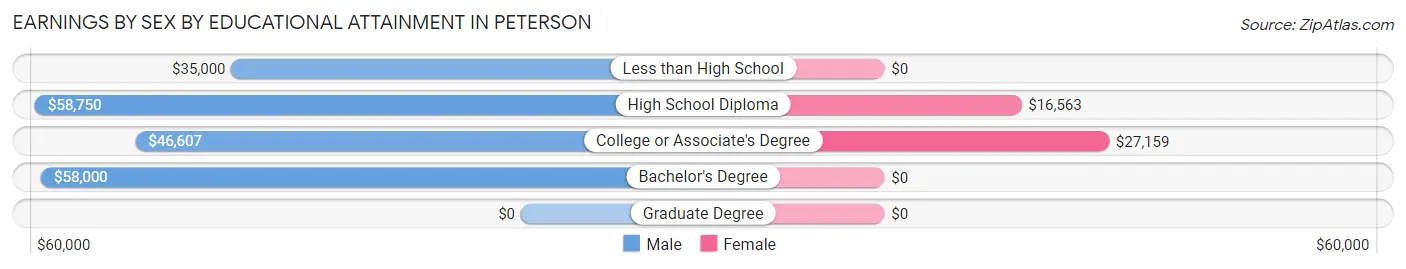
Earnings by Sex by Educational Attainment in Peterson
Average earnings in Peterson are $57,083 for men and $26,705 for women, a difference of 53.2%. Men with an educational attainment of high school diploma enjoy the highest average annual earnings of $58,750, while those with less than high school education earn the least with $35,000. Women with an educational attainment of college or associate's degree earn the most with the average annual earnings of $27,159, while those with high school diploma education have the smallest earnings of $16,563.
| Educational Attainment | Male Income | Female Income |
| Less than High School | $35,000 | $0 |
| High School Diploma | $58,750 | $16,563 |
| College or Associate's Degree | $46,607 | $27,159 |
| Bachelor's Degree | $58,000 | $0 |
| Graduate Degree | - | - |
| Total | $57,083 | $26,705 |
Family Income in Peterson
Family Income Brackets in Peterson
According to the Peterson family income data, there are 24 families falling into the $50,000 to $74,999 income range, which is the most common income bracket and makes up 28.2% of all families.
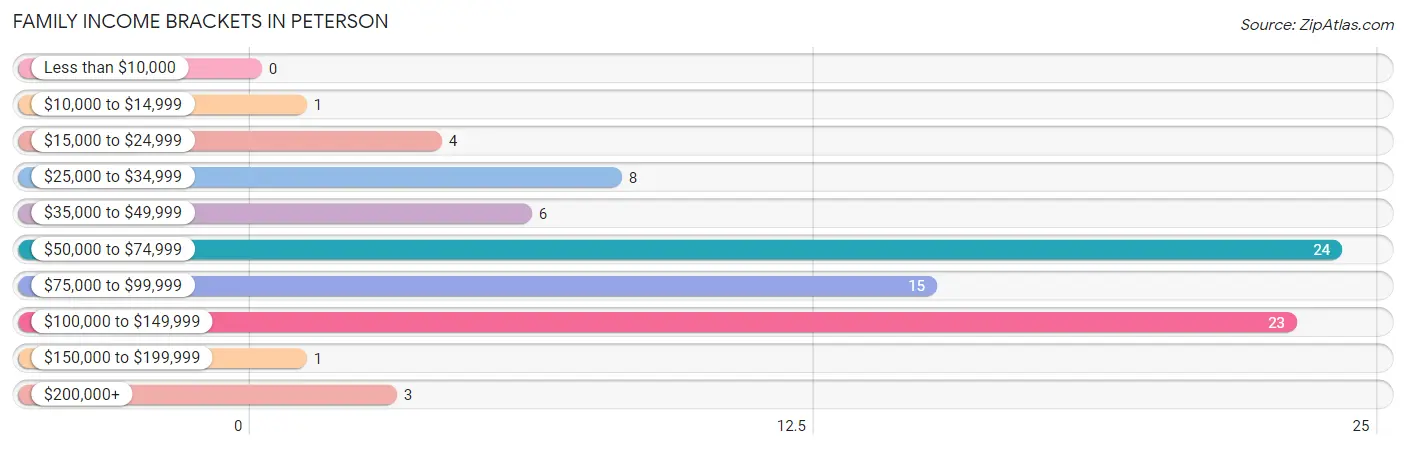
| Income Bracket | # Families | % Families |
| Less than $10,000 | 0 | 0.0% |
| $10,000 to $14,999 | 1 | 1.2% |
| $15,000 to $24,999 | 4 | 4.7% |
| $25,000 to $34,999 | 8 | 9.4% |
| $35,000 to $49,999 | 6 | 7.1% |
| $50,000 to $74,999 | 24 | 28.2% |
| $75,000 to $99,999 | 15 | 17.6% |
| $100,000 to $149,999 | 23 | 27.1% |
| $150,000 to $199,999 | 1 | 1.2% |
| $200,000+ | 3 | 3.5% |
Family Income by Famaliy Size in Peterson
4-person families (4 | 4.7%) account for the highest median family income in Peterson with $132,500 per family, while 2-person families (55 | 64.7%) have the highest median income of $35,312 per family member.
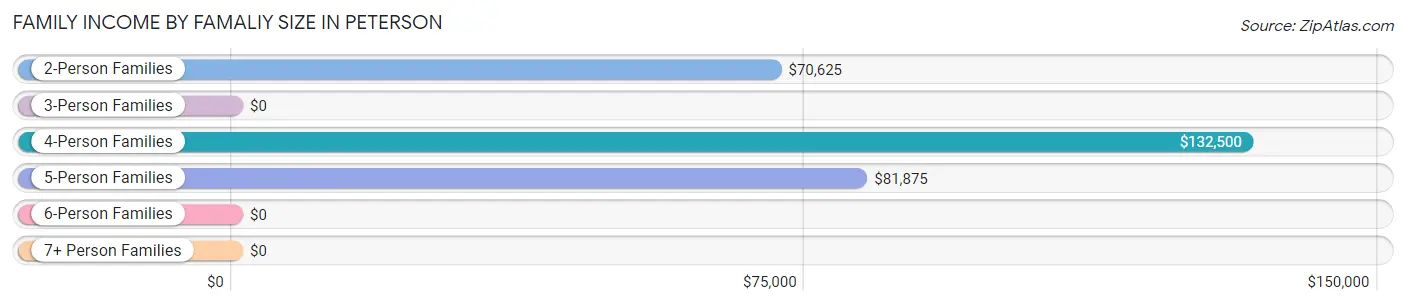
| Income Bracket | # Families | Median Income |
| 2-Person Families | 55 (64.7%) | $70,625 |
| 3-Person Families | 11 (12.9%) | $0 |
| 4-Person Families | 4 (4.7%) | $132,500 |
| 5-Person Families | 8 (9.4%) | $81,875 |
| 6-Person Families | 6 (7.1%) | $0 |
| 7+ Person Families | 1 (1.2%) | $0 |
| Total | 85 (100.0%) | $74,583 |
Family Income by Number of Earners in Peterson
The median family income in Peterson is $74,583, with families comprising 3+ earners (4) having the highest median family income of $92,500, while families with no earners (20) have the lowest median family income of $36,250, accounting for 4.7% and 23.5% of families, respectively.
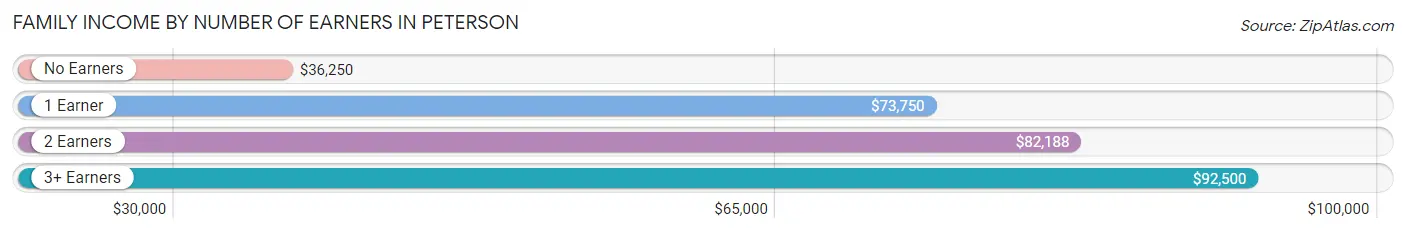
| Number of Earners | # Families | Median Income |
| No Earners | 20 (23.5%) | $36,250 |
| 1 Earner | 8 (9.4%) | $73,750 |
| 2 Earners | 53 (62.4%) | $82,188 |
| 3+ Earners | 4 (4.7%) | $92,500 |
| Total | 85 (100.0%) | $74,583 |
Household Income in Peterson
Household Income Brackets in Peterson
With 43 households falling in the category, the $50,000 to $74,999 income range is the most frequent in Peterson, accounting for 26.9% of all households. In contrast, only 2 households (1.3%) fall into the less than $10,000 income bracket, making it the least populous group.
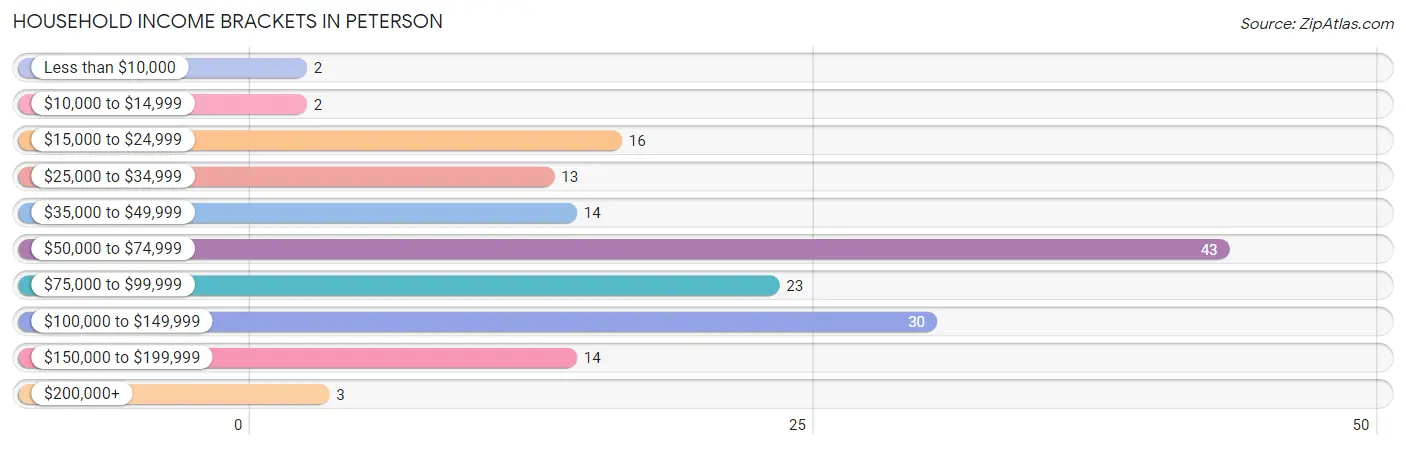
| Income Bracket | # Households | % Households |
| Less than $10,000 | 2 | 1.3% |
| $10,000 to $14,999 | 2 | 1.3% |
| $15,000 to $24,999 | 16 | 10.0% |
| $25,000 to $34,999 | 13 | 8.1% |
| $35,000 to $49,999 | 14 | 8.8% |
| $50,000 to $74,999 | 43 | 26.9% |
| $75,000 to $99,999 | 23 | 14.4% |
| $100,000 to $149,999 | 30 | 18.8% |
| $150,000 to $199,999 | 14 | 8.8% |
| $200,000+ | 3 | 1.9% |
Household Income by Householder Age in Peterson
The median household income in Peterson is $68,750, with the highest median household income of $78,750 found in the 25 to 44 years age bracket for the primary householder. A total of 48 households (30.0%) fall into this category. Meanwhile, the 15 to 24 years age bracket for the primary householder has the lowest median household income of $0, with 3 households (1.9%) in this group.
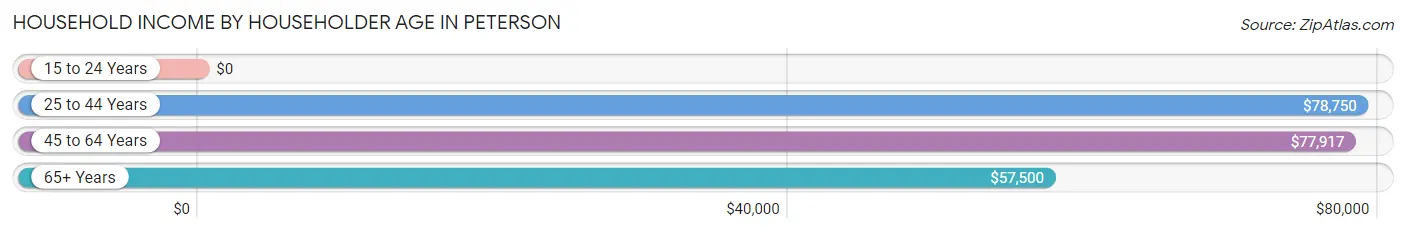
| Income Bracket | # Households | Median Income |
| 15 to 24 Years | 3 (1.9%) | $0 |
| 25 to 44 Years | 48 (30.0%) | $78,750 |
| 45 to 64 Years | 47 (29.4%) | $77,917 |
| 65+ Years | 62 (38.8%) | $57,500 |
| Total | 160 (100.0%) | $68,750 |
Poverty in Peterson
Income Below Poverty by Sex and Age in Peterson
With 2.5% poverty level for males and 8.3% for females among the residents of Peterson, 25 to 34 year old males and 18 to 24 year old females are the most vulnerable to poverty, with 5 males (12.8%) and 3 females (75.0%) in their respective age groups living below the poverty level.
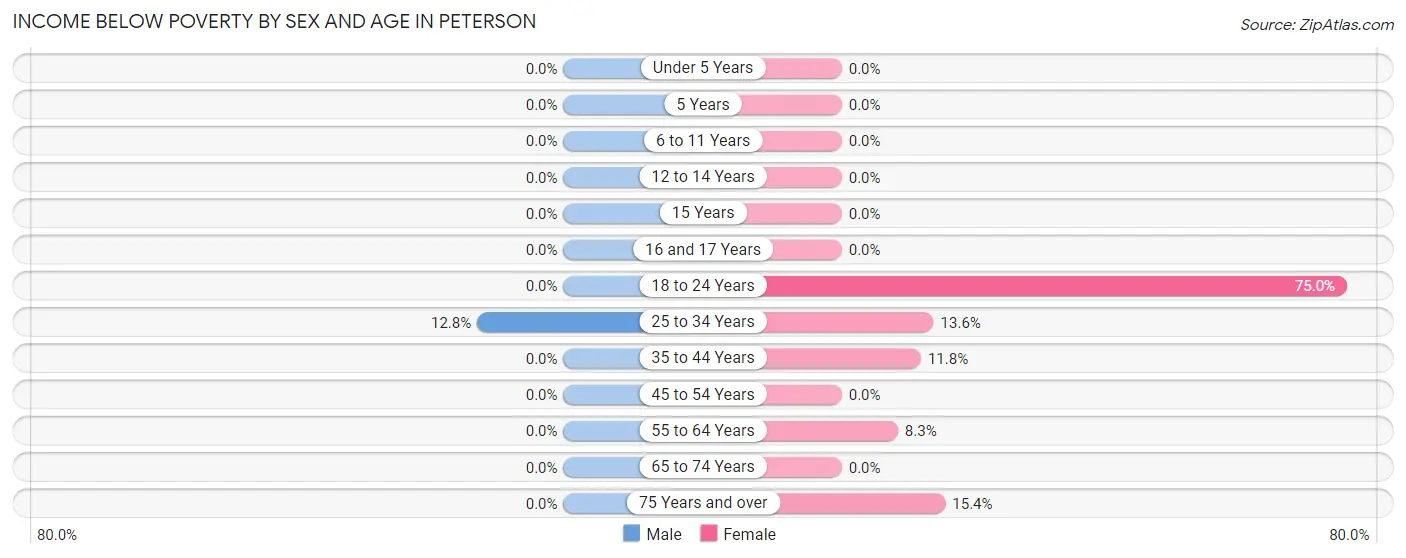
| Age Bracket | Male | Female |
| Under 5 Years | 0 (0.0%) | 0 (0.0%) |
| 5 Years | 0 (0.0%) | 0 (0.0%) |
| 6 to 11 Years | 0 (0.0%) | 0 (0.0%) |
| 12 to 14 Years | 0 (0.0%) | 0 (0.0%) |
| 15 Years | 0 (0.0%) | 0 (0.0%) |
| 16 and 17 Years | 0 (0.0%) | 0 (0.0%) |
| 18 to 24 Years | 0 (0.0%) | 3 (75.0%) |
| 25 to 34 Years | 5 (12.8%) | 3 (13.6%) |
| 35 to 44 Years | 0 (0.0%) | 2 (11.8%) |
| 45 to 54 Years | 0 (0.0%) | 0 (0.0%) |
| 55 to 64 Years | 0 (0.0%) | 3 (8.3%) |
| 65 to 74 Years | 0 (0.0%) | 0 (0.0%) |
| 75 Years and over | 0 (0.0%) | 4 (15.4%) |
| Total | 5 (2.5%) | 15 (8.3%) |
Income Above Poverty by Sex and Age in Peterson
According to the poverty statistics in Peterson, males aged under 5 years and females aged under 5 years are the age groups that are most secure financially, with 100.0% of males and 100.0% of females in these age groups living above the poverty line.
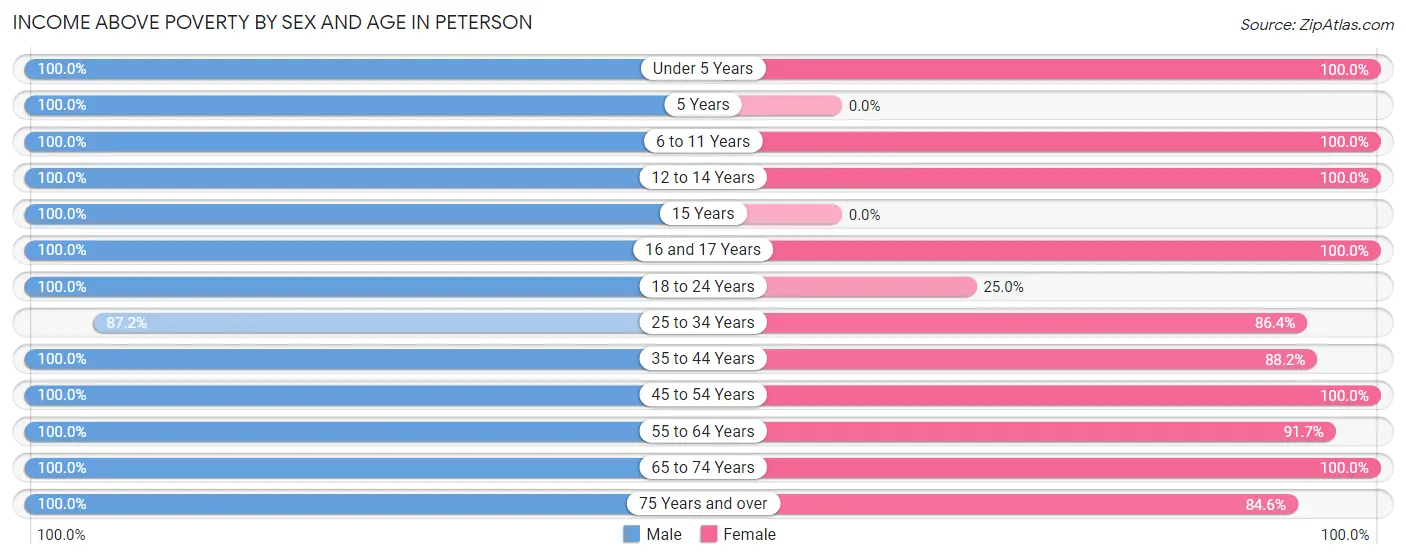
| Age Bracket | Male | Female |
| Under 5 Years | 14 (100.0%) | 18 (100.0%) |
| 5 Years | 2 (100.0%) | 0 (0.0%) |
| 6 to 11 Years | 16 (100.0%) | 15 (100.0%) |
| 12 to 14 Years | 8 (100.0%) | 5 (100.0%) |
| 15 Years | 7 (100.0%) | 0 (0.0%) |
| 16 and 17 Years | 3 (100.0%) | 4 (100.0%) |
| 18 to 24 Years | 8 (100.0%) | 1 (25.0%) |
| 25 to 34 Years | 34 (87.2%) | 19 (86.4%) |
| 35 to 44 Years | 17 (100.0%) | 15 (88.2%) |
| 45 to 54 Years | 7 (100.0%) | 20 (100.0%) |
| 55 to 64 Years | 25 (100.0%) | 33 (91.7%) |
| 65 to 74 Years | 40 (100.0%) | 13 (100.0%) |
| 75 Years and over | 12 (100.0%) | 22 (84.6%) |
| Total | 193 (97.5%) | 165 (91.7%) |
Income Below Poverty Among Married-Couple Families in Peterson
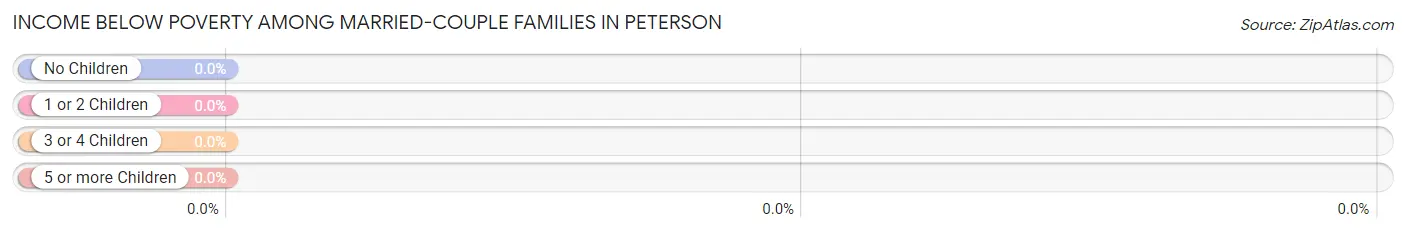
| Children | Above Poverty | Below Poverty |
| No Children | 53 (100.0%) | 0 (0.0%) |
| 1 or 2 Children | 8 (100.0%) | 0 (0.0%) |
| 3 or 4 Children | 15 (100.0%) | 0 (0.0%) |
| 5 or more Children | 0 (0.0%) | 0 (0.0%) |
| Total | 76 (100.0%) | 0 (0.0%) |
Income Below Poverty Among Single-Parent Households in Peterson
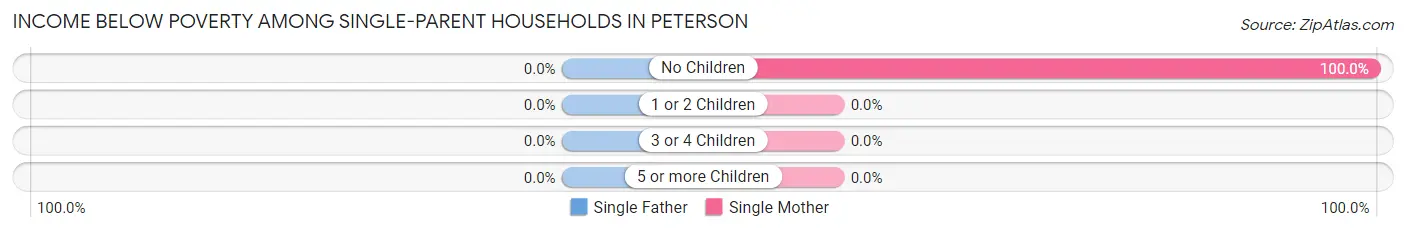
| Children | Single Father | Single Mother |
| No Children | 0 (0.0%) | 1 (100.0%) |
| 1 or 2 Children | 0 (0.0%) | 0 (0.0%) |
| 3 or 4 Children | 0 (0.0%) | 0 (0.0%) |
| 5 or more Children | 0 (0.0%) | 0 (0.0%) |
| Total | 0 (0.0%) | 1 (20.0%) |
Income Below Poverty Among Married-Couple vs Single-Parent Households in Peterson
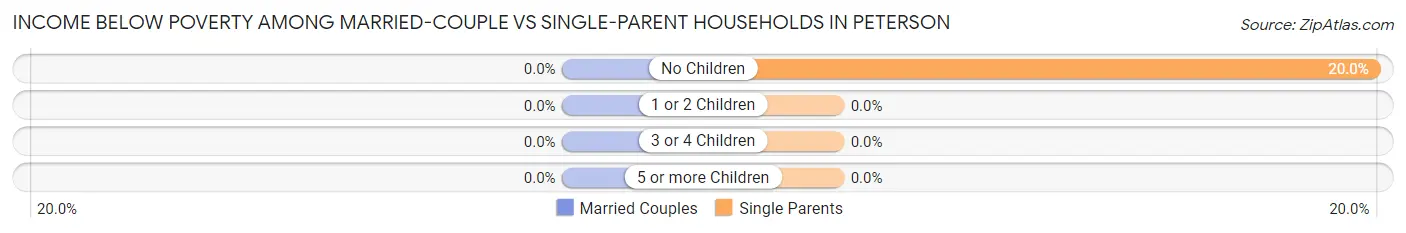
| Children | Married-Couple Families | Single-Parent Households |
| No Children | 0 (0.0%) | 1 (20.0%) |
| 1 or 2 Children | 0 (0.0%) | 0 (0.0%) |
| 3 or 4 Children | 0 (0.0%) | 0 (0.0%) |
| 5 or more Children | 0 (0.0%) | 0 (0.0%) |
| Total | 0 (0.0%) | 1 (11.1%) |
Race in Peterson
The most populous races in Peterson are White / Caucasian (367 | 96.1%), Hispanic or Latino (12 | 3.1%), and Two or more Races (6 | 1.6%).
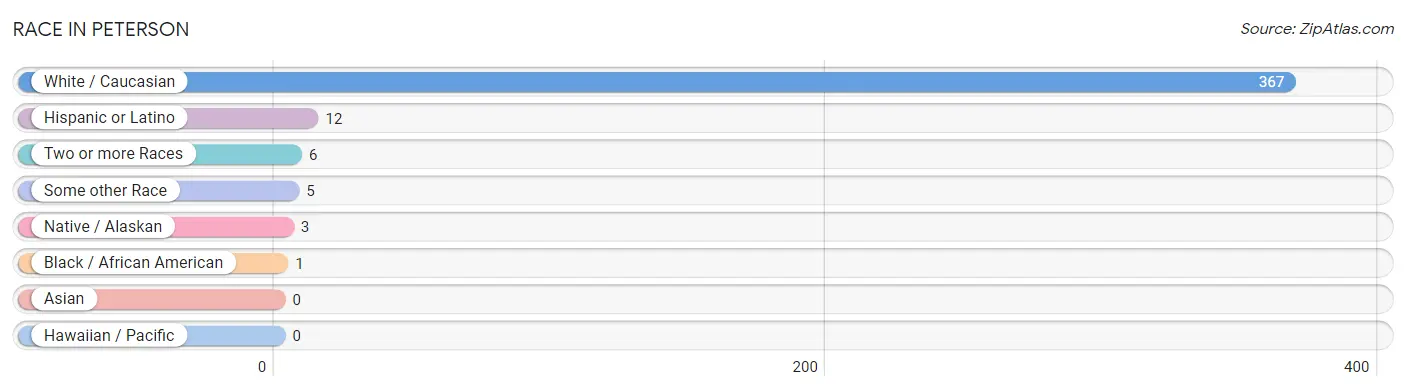
| Race | # Population | % Population |
| Asian | 0 | 0.0% |
| Black / African American | 1 | 0.3% |
| Hawaiian / Pacific | 0 | 0.0% |
| Hispanic or Latino | 12 | 3.1% |
| Native / Alaskan | 3 | 0.8% |
| White / Caucasian | 367 | 96.1% |
| Two or more Races | 6 | 1.6% |
| Some other Race | 5 | 1.3% |
| Total | 382 | 100.0% |
Ancestry in Peterson
The most populous ancestries reported in Peterson are German (138 | 36.1%), English (56 | 14.7%), Norwegian (39 | 10.2%), Swedish (37 | 9.7%), and Irish (29 | 7.6%), together accounting for 78.3% of all Peterson residents.
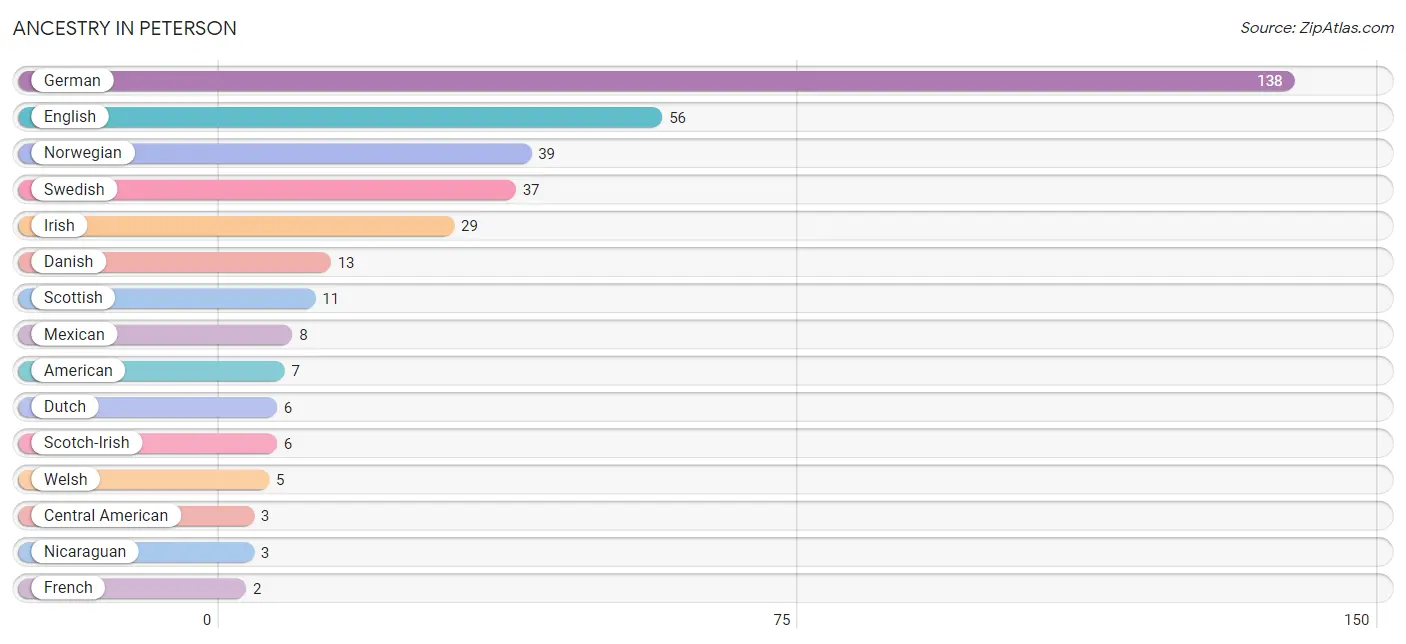
| Ancestry | # Population | % Population |
| American | 7 | 1.8% |
| Central American | 3 | 0.8% |
| Danish | 13 | 3.4% |
| Dutch | 6 | 1.6% |
| English | 56 | 14.7% |
| European | 1 | 0.3% |
| French | 2 | 0.5% |
| German | 138 | 36.1% |
| Irish | 29 | 7.6% |
| Italian | 2 | 0.5% |
| Mexican | 8 | 2.1% |
| Nicaraguan | 3 | 0.8% |
| Norwegian | 39 | 10.2% |
| Puerto Rican | 1 | 0.3% |
| Scandinavian | 2 | 0.5% |
| Scotch-Irish | 6 | 1.6% |
| Scottish | 11 | 2.9% |
| Swedish | 37 | 9.7% |
| Welsh | 5 | 1.3% | View All 19 Rows |
Immigrants in Peterson
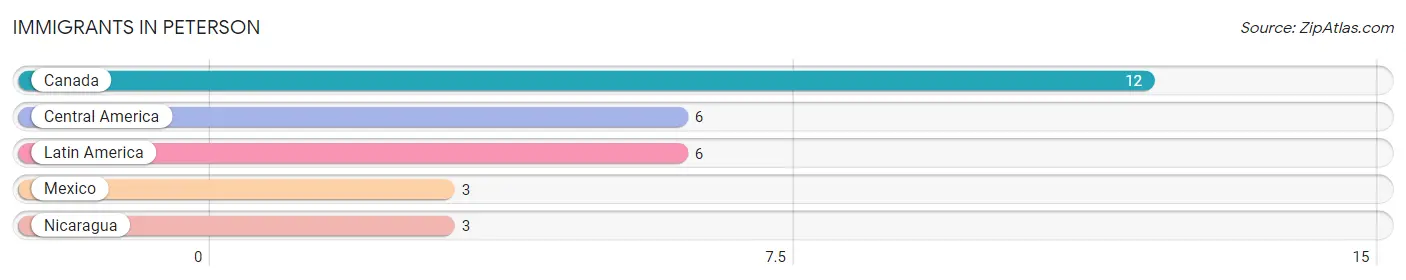
The most numerous immigrant groups reported in Peterson came from Canada (12 | 3.1%), Central America (6 | 1.6%), Latin America (6 | 1.6%), Mexico (3 | 0.8%), and Nicaragua (3 | 0.8%), together accounting for 7.9% of all Peterson residents.
| Immigration Origin | # Population | % Population |
| Canada | 12 | 3.1% |
| Central America | 6 | 1.6% |
| Latin America | 6 | 1.6% |
| Mexico | 3 | 0.8% |
| Nicaragua | 3 | 0.8% | View All 5 Rows |
Sex and Age in Peterson
Sex and Age in Peterson
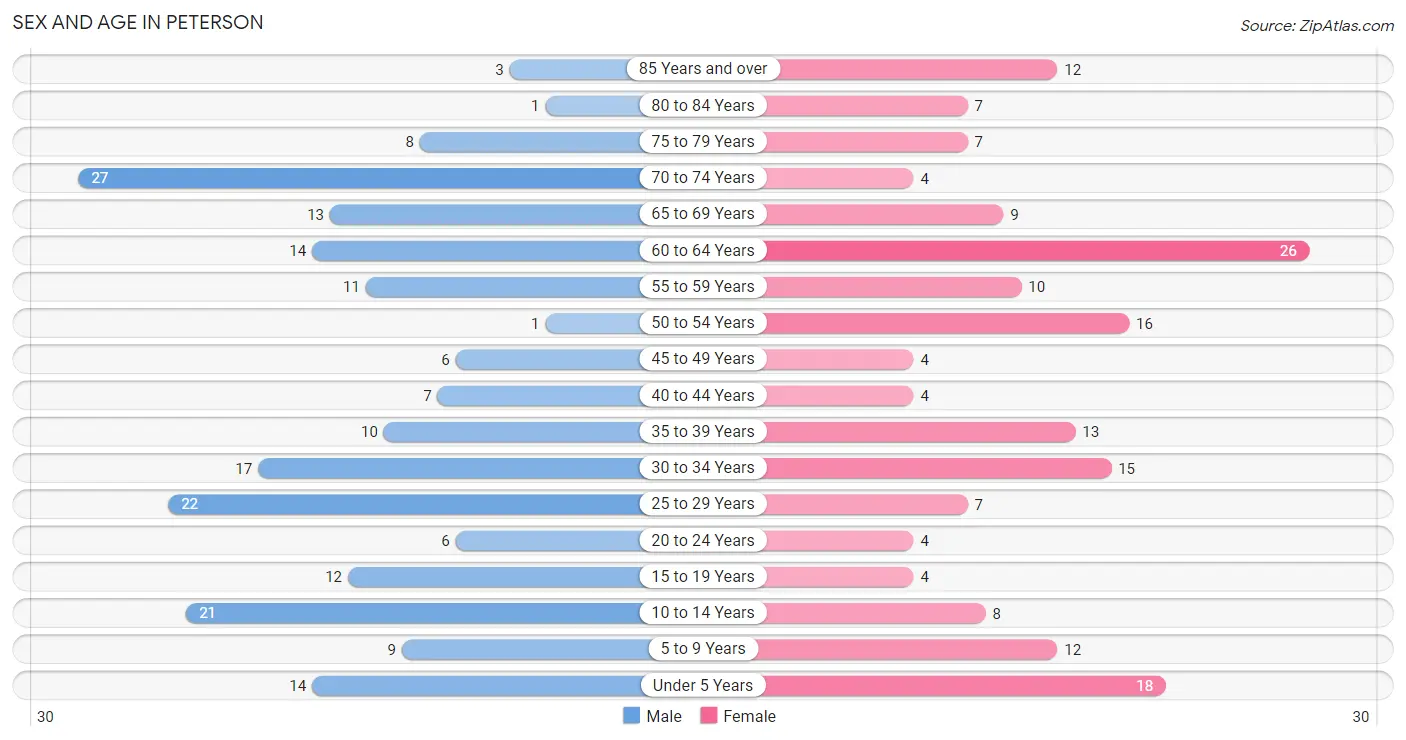
The most populous age groups in Peterson are 70 to 74 Years (27 | 13.4%) for men and 60 to 64 Years (26 | 14.4%) for women.
| Age Bracket | Male | Female |
| Under 5 Years | 14 (6.9%) | 18 (10.0%) |
| 5 to 9 Years | 9 (4.5%) | 12 (6.7%) |
| 10 to 14 Years | 21 (10.4%) | 8 (4.4%) |
| 15 to 19 Years | 12 (5.9%) | 4 (2.2%) |
| 20 to 24 Years | 6 (3.0%) | 4 (2.2%) |
| 25 to 29 Years | 22 (10.9%) | 7 (3.9%) |
| 30 to 34 Years | 17 (8.4%) | 15 (8.3%) |
| 35 to 39 Years | 10 (5.0%) | 13 (7.2%) |
| 40 to 44 Years | 7 (3.5%) | 4 (2.2%) |
| 45 to 49 Years | 6 (3.0%) | 4 (2.2%) |
| 50 to 54 Years | 1 (0.5%) | 16 (8.9%) |
| 55 to 59 Years | 11 (5.4%) | 10 (5.6%) |
| 60 to 64 Years | 14 (6.9%) | 26 (14.4%) |
| 65 to 69 Years | 13 (6.4%) | 9 (5.0%) |
| 70 to 74 Years | 27 (13.4%) | 4 (2.2%) |
| 75 to 79 Years | 8 (4.0%) | 7 (3.9%) |
| 80 to 84 Years | 1 (0.5%) | 7 (3.9%) |
| 85 Years and over | 3 (1.5%) | 12 (6.7%) |
| Total | 202 (100.0%) | 180 (100.0%) |
Families and Households in Peterson
Median Family Size in Peterson
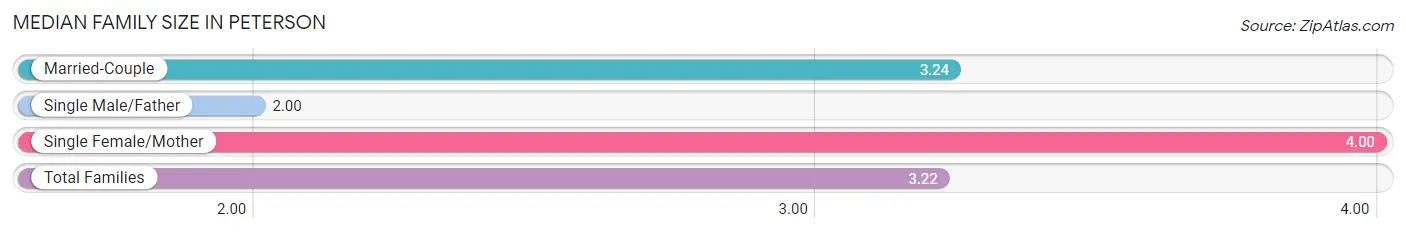
The median family size in Peterson is 3.22 persons per family, with single female/mother families (5 | 5.9%) accounting for the largest median family size of 4 persons per family. On the other hand, single male/father families (4 | 4.7%) represent the smallest median family size with 2.00 persons per family.
| Family Type | # Families | Family Size |
| Married-Couple | 76 (89.4%) | 3.24 |
| Single Male/Father | 4 (4.7%) | 2.00 |
| Single Female/Mother | 5 (5.9%) | 4.00 |
| Total Families | 85 (100.0%) | 3.22 |
Median Household Size in Peterson
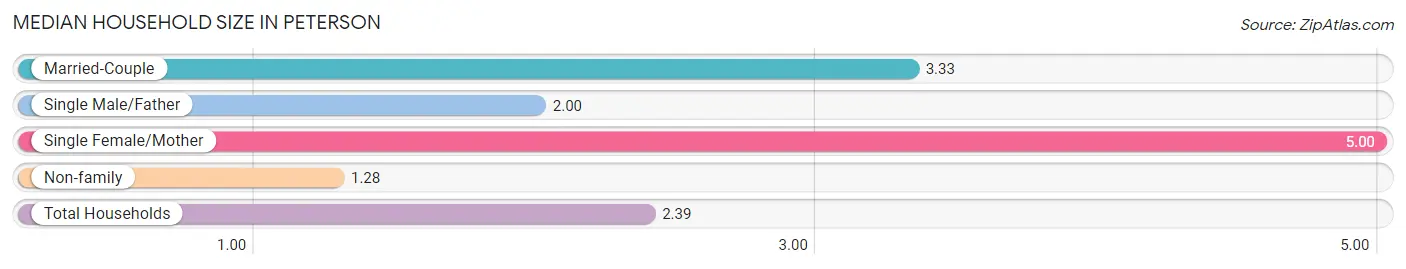
The median household size in Peterson is 2.39 persons per household, with single female/mother households (5 | 3.1%) accounting for the largest median household size of 5 persons per household. non-family households (75 | 46.9%) represent the smallest median household size with 1.28 persons per household.
| Household Type | # Households | Household Size |
| Married-Couple | 76 (47.5%) | 3.33 |
| Single Male/Father | 4 (2.5%) | 2.00 |
| Single Female/Mother | 5 (3.1%) | 5.00 |
| Non-family | 75 (46.9%) | 1.28 |
| Total Households | 160 (100.0%) | 2.39 |
Household Size by Marriage Status in Peterson
Out of a total of 160 households in Peterson, 85 (53.1%) are family households, while 75 (46.9%) are nonfamily households. The most numerous type of family households are 2-person households, comprising 55, and the most common type of nonfamily households are 1-person households, comprising 63.
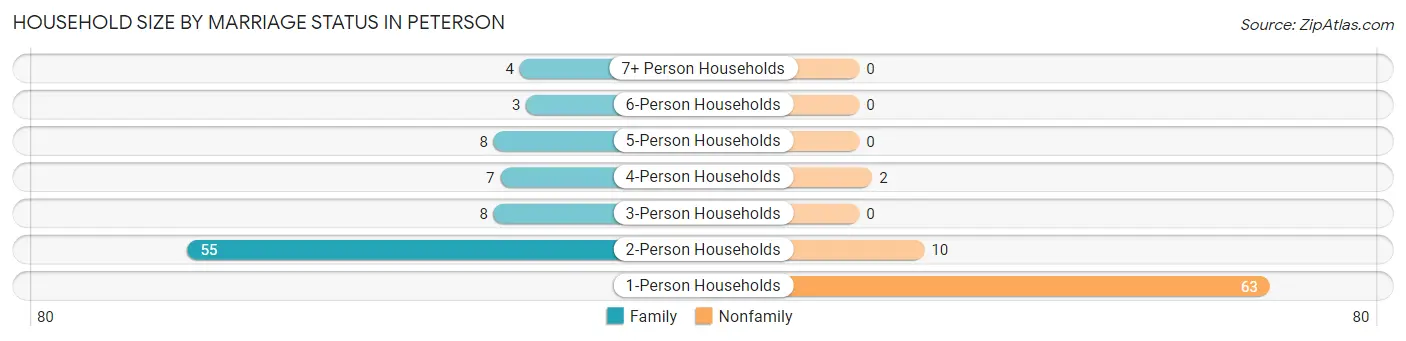
| Household Size | Family Households | Nonfamily Households |
| 1-Person Households | - | 63 (39.4%) |
| 2-Person Households | 55 (34.4%) | 10 (6.2%) |
| 3-Person Households | 8 (5.0%) | 0 (0.0%) |
| 4-Person Households | 7 (4.4%) | 2 (1.3%) |
| 5-Person Households | 8 (5.0%) | 0 (0.0%) |
| 6-Person Households | 3 (1.9%) | 0 (0.0%) |
| 7+ Person Households | 4 (2.5%) | 0 (0.0%) |
| Total | 85 (53.1%) | 75 (46.9%) |
Female Fertility in Peterson
Fertility by Age in Peterson
Average fertility rate in Peterson is 19.0 births per 1,000 women. Women in the age bracket of 20 to 34 years have the highest fertility rate with 38.0 births per 1,000 women. Women in the age bracket of 20 to 34 years acount for 100.0% of all women with births.
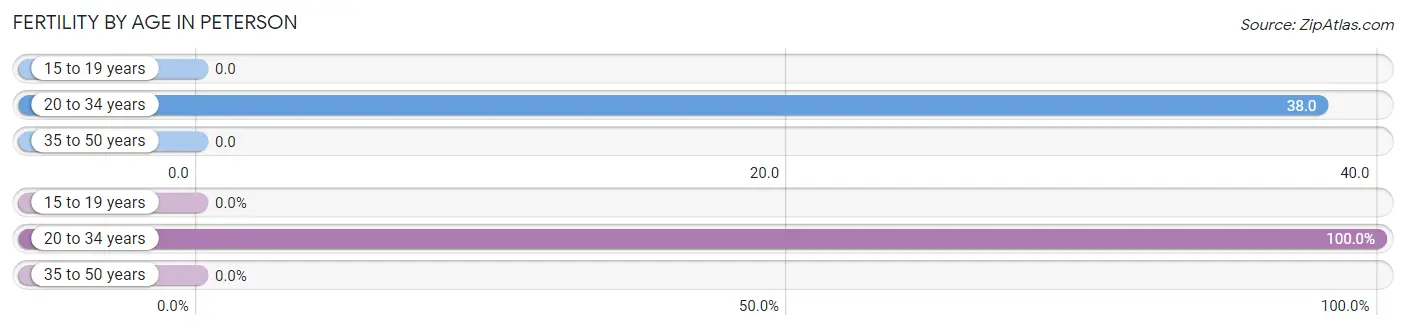
| Age Bracket | Women with Births | Births / 1,000 Women |
| 15 to 19 years | 0 (0.0%) | 0.0 |
| 20 to 34 years | 1 (100.0%) | 38.0 |
| 35 to 50 years | 0 (0.0%) | 0.0 |
| Total | 1 (100.0%) | 19.0 |
Fertility by Age by Marriage Status in Peterson
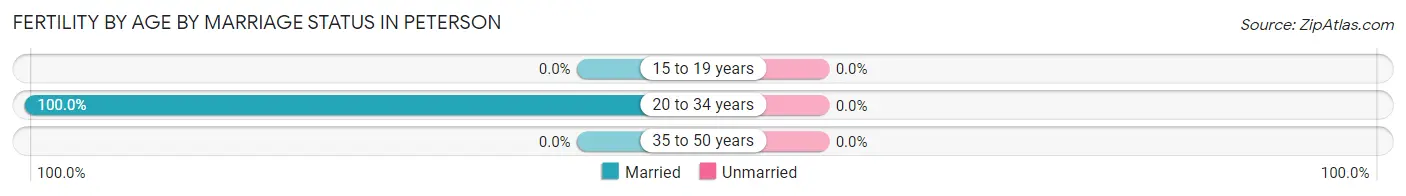
| Age Bracket | Married | Unmarried |
| 15 to 19 years | 0 (0.0%) | 0 (0.0%) |
| 20 to 34 years | 1 (100.0%) | 0 (0.0%) |
| 35 to 50 years | 0 (0.0%) | 0 (0.0%) |
| Total | 1 (100.0%) | 0 (0.0%) |
Fertility by Education in Peterson
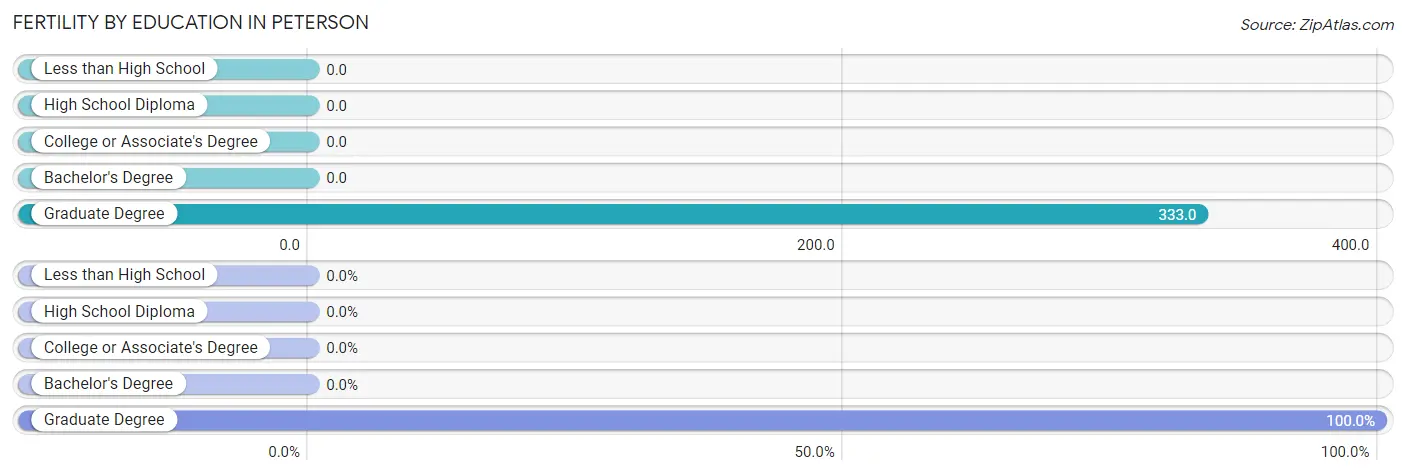
| Educational Attainment | Women with Births | Births / 1,000 Women |
| Less than High School | 0 (0.0%) | 0.0 |
| High School Diploma | 0 (0.0%) | 0.0 |
| College or Associate's Degree | 0 (0.0%) | 0.0 |
| Bachelor's Degree | 0 (0.0%) | 0.0 |
| Graduate Degree | 1 (100.0%) | 333.0 |
| Total | 1 (100.0%) | 19.0 |
Fertility by Education by Marriage Status in Peterson
| Educational Attainment | Married | Unmarried |
| Less than High School | 0 (0.0%) | 0 (0.0%) |
| High School Diploma | 0 (0.0%) | 0 (0.0%) |
| College or Associate's Degree | 0 (0.0%) | 0 (0.0%) |
| Bachelor's Degree | 0 (0.0%) | 0 (0.0%) |
| Graduate Degree | 1 (100.0%) | 0 (0.0%) |
| Total | 1 (100.0%) | 0 (0.0%) |
Employment Characteristics in Peterson
Employment by Class of Employer in Peterson
Among the 193 employed individuals in Peterson, private company employees (116 | 60.1%), state government employees (27 | 14.0%), and local government employees (18 | 9.3%) make up the most common classes of employment.
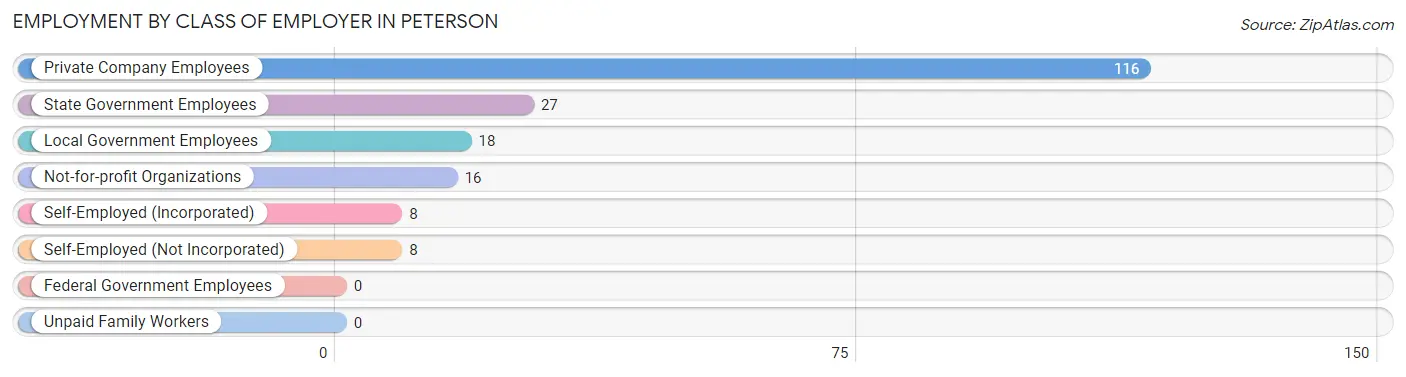
| Employer Class | # Employees | % Employees |
| Private Company Employees | 116 | 60.1% |
| Self-Employed (Incorporated) | 8 | 4.2% |
| Self-Employed (Not Incorporated) | 8 | 4.2% |
| Not-for-profit Organizations | 16 | 8.3% |
| Local Government Employees | 18 | 9.3% |
| State Government Employees | 27 | 14.0% |
| Federal Government Employees | 0 | 0.0% |
| Unpaid Family Workers | 0 | 0.0% |
| Total | 193 | 100.0% |
Employment Status by Age in Peterson
According to the labor force statistics for Peterson, out of the total population over 16 years of age (293), 68.3% or 200 individuals are in the labor force, with 3.0% or 6 of them unemployed. The age group with the highest labor force participation rate is 45 to 54 years, with 100.0% or 27 individuals in the labor force. Within the labor force, the 30 to 34 years age range has the highest percentage of unemployed individuals, with 16.7% or 5 of them being unemployed.
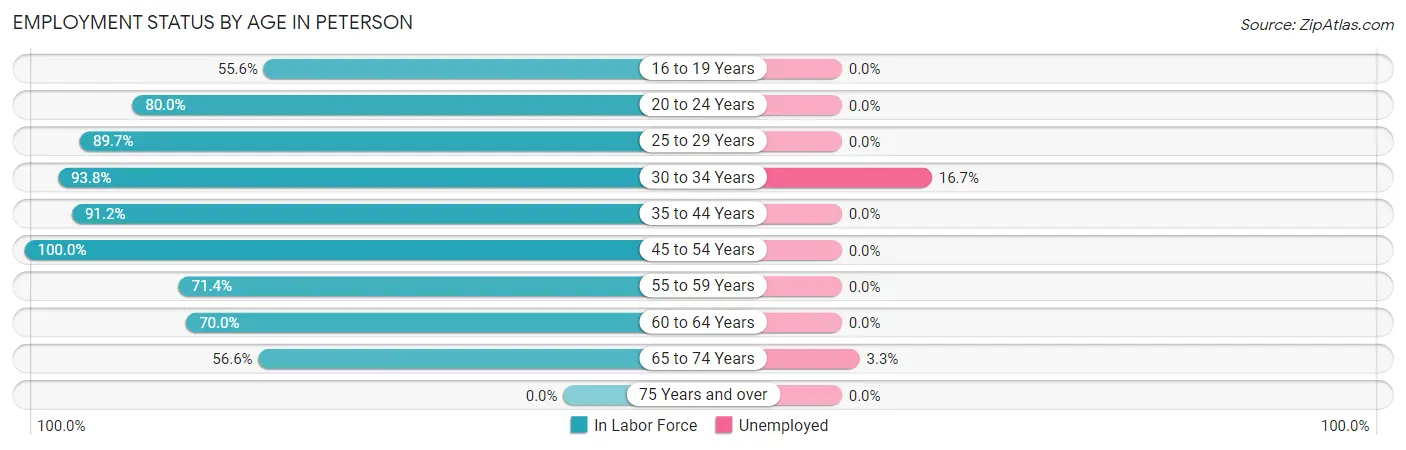
| Age Bracket | In Labor Force | Unemployed |
| 16 to 19 Years | 5 (55.6%) | 0 (0.0%) |
| 20 to 24 Years | 8 (80.0%) | 0 (0.0%) |
| 25 to 29 Years | 26 (89.7%) | 0 (0.0%) |
| 30 to 34 Years | 30 (93.8%) | 5 (16.7%) |
| 35 to 44 Years | 31 (91.2%) | 0 (0.0%) |
| 45 to 54 Years | 27 (100.0%) | 0 (0.0%) |
| 55 to 59 Years | 15 (71.4%) | 0 (0.0%) |
| 60 to 64 Years | 28 (70.0%) | 0 (0.0%) |
| 65 to 74 Years | 30 (56.6%) | 1 (3.3%) |
| 75 Years and over | 0 (0.0%) | 0 (0.0%) |
| Total | 200 (68.3%) | 6 (3.0%) |
Employment Status by Educational Attainment in Peterson
According to labor force statistics for Peterson, 85.8% of individuals (157) out of the total population between 25 and 64 years of age (183) are in the labor force, with 3.2% or 5 of them being unemployed. The group with the highest labor force participation rate are those with the educational attainment of less than high school, with 100.0% or 10 individuals in the labor force. Within the labor force, individuals with bachelor's degree or higher education have the highest percentage of unemployment, with 14.3% or 5 of them being unemployed.
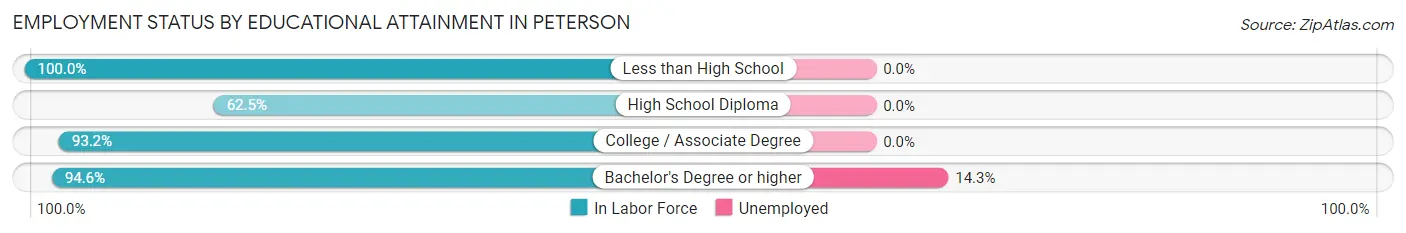
| Educational Attainment | In Labor Force | Unemployed |
| Less than High School | 10 (100.0%) | 0 (0.0%) |
| High School Diploma | 30 (62.5%) | 0 (0.0%) |
| College / Associate Degree | 82 (93.2%) | 0 (0.0%) |
| Bachelor's Degree or higher | 35 (94.6%) | 5 (14.3%) |
| Total | 157 (85.8%) | 6 (3.2%) |
Employment Occupations by Sex in Peterson
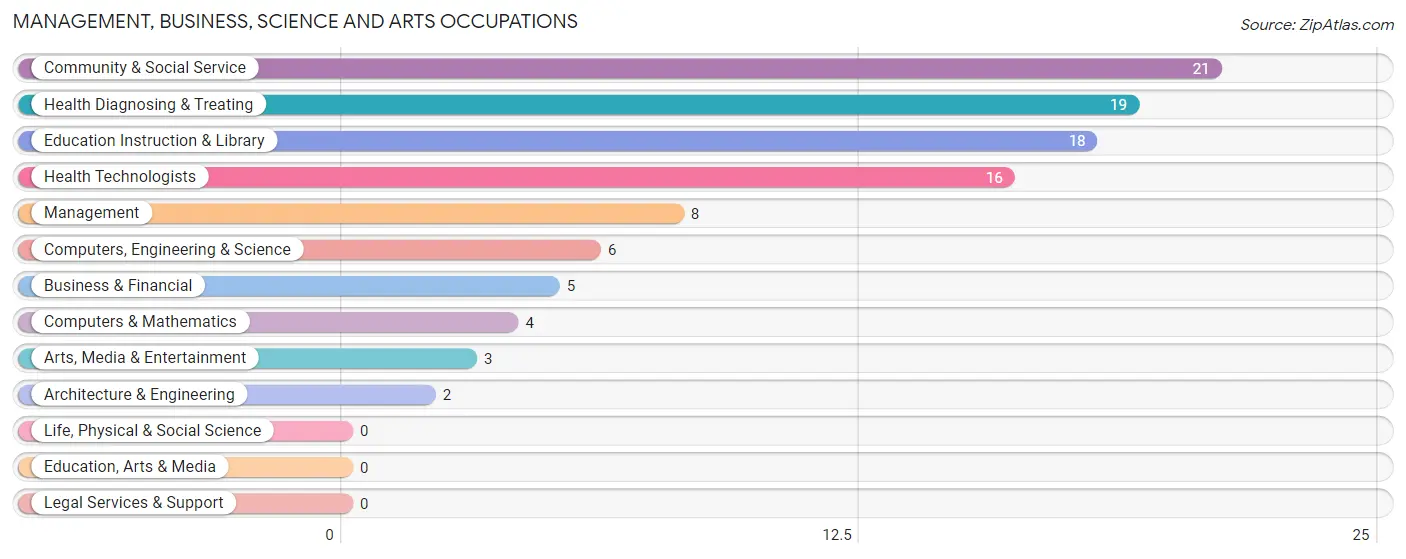
Management, Business, Science and Arts Occupations
The most common Management, Business, Science and Arts occupations in Peterson are Community & Social Service (21 | 10.8%), Health Diagnosing & Treating (19 | 9.8%), Education Instruction & Library (18 | 9.3%), Health Technologists (16 | 8.3%), and Management (8 | 4.1%).
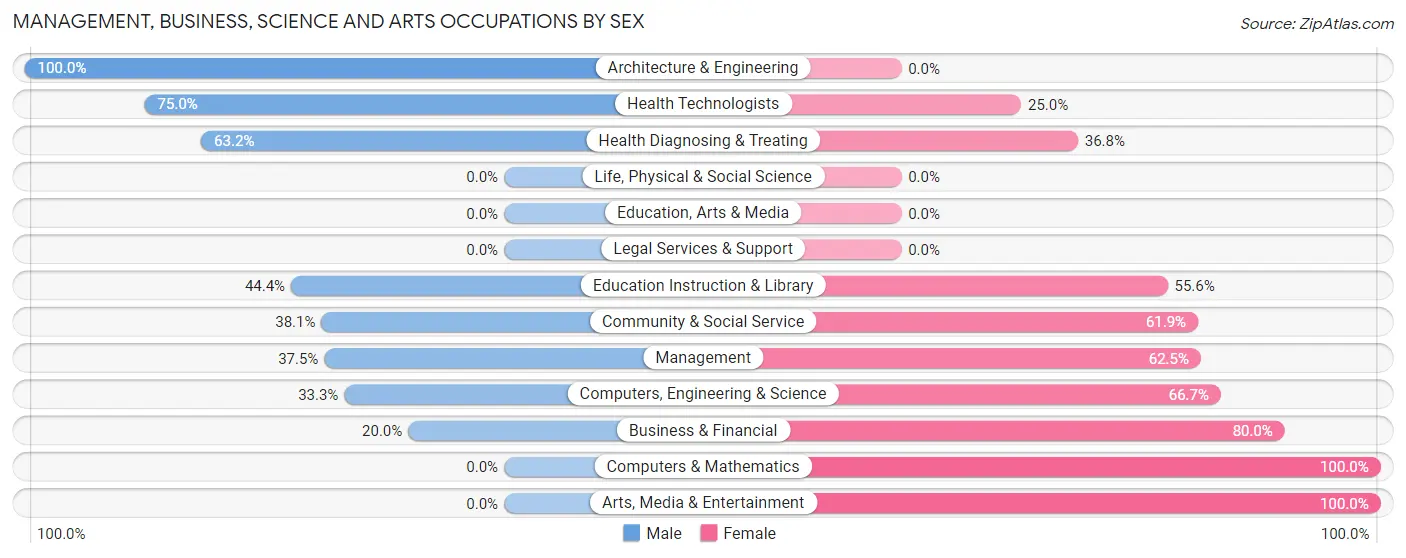
Management, Business, Science and Arts Occupations by Sex
Within the Management, Business, Science and Arts occupations in Peterson, the most male-oriented occupations are Architecture & Engineering (100.0%), Health Technologists (75.0%), and Health Diagnosing & Treating (63.2%), while the most female-oriented occupations are Computers & Mathematics (100.0%), Arts, Media & Entertainment (100.0%), and Business & Financial (80.0%).
| Occupation | Male | Female |
| Management | 3 (37.5%) | 5 (62.5%) |
| Business & Financial | 1 (20.0%) | 4 (80.0%) |
| Computers, Engineering & Science | 2 (33.3%) | 4 (66.7%) |
| Computers & Mathematics | 0 (0.0%) | 4 (100.0%) |
| Architecture & Engineering | 2 (100.0%) | 0 (0.0%) |
| Life, Physical & Social Science | 0 (0.0%) | 0 (0.0%) |
| Community & Social Service | 8 (38.1%) | 13 (61.9%) |
| Education, Arts & Media | 0 (0.0%) | 0 (0.0%) |
| Legal Services & Support | 0 (0.0%) | 0 (0.0%) |
| Education Instruction & Library | 8 (44.4%) | 10 (55.6%) |
| Arts, Media & Entertainment | 0 (0.0%) | 3 (100.0%) |
| Health Diagnosing & Treating | 12 (63.2%) | 7 (36.8%) |
| Health Technologists | 12 (75.0%) | 4 (25.0%) |
| Total (Category) | 26 (44.1%) | 33 (55.9%) |
| Total (Overall) | 115 (59.3%) | 79 (40.7%) |
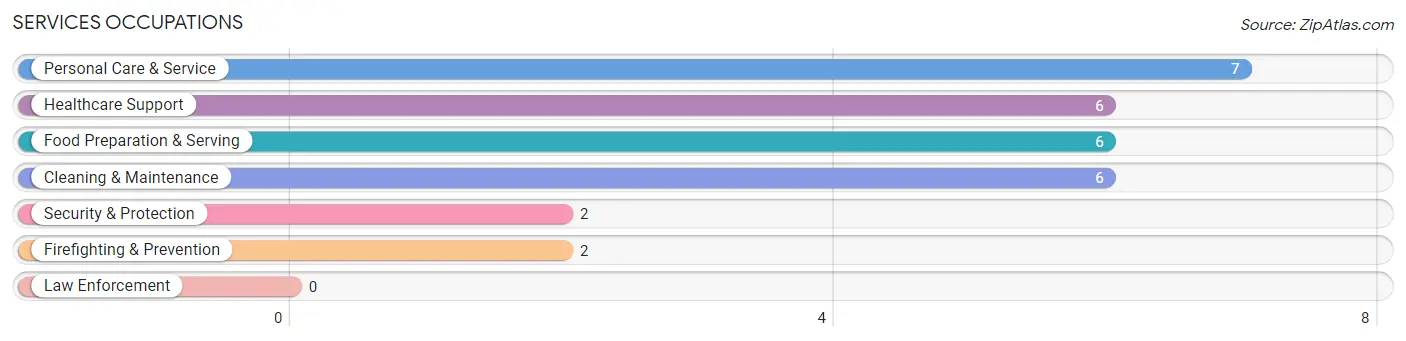
Services Occupations
The most common Services occupations in Peterson are Personal Care & Service (7 | 3.6%), Healthcare Support (6 | 3.1%), Food Preparation & Serving (6 | 3.1%), Cleaning & Maintenance (6 | 3.1%), and Security & Protection (2 | 1.0%).
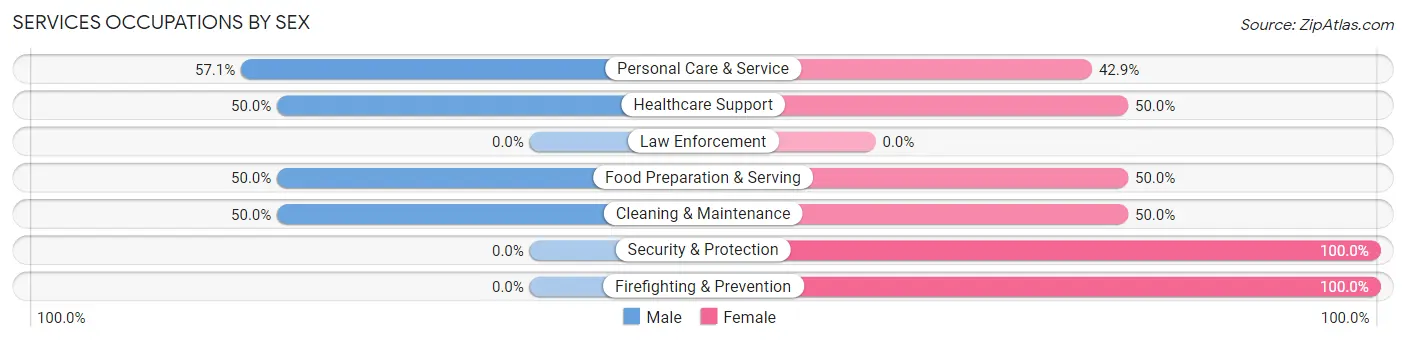
Services Occupations by Sex
Within the Services occupations in Peterson, the most male-oriented occupations are Personal Care & Service (57.1%), Healthcare Support (50.0%), and Food Preparation & Serving (50.0%), while the most female-oriented occupations are Security & Protection (100.0%), Firefighting & Prevention (100.0%), and Healthcare Support (50.0%).
| Occupation | Male | Female |
| Healthcare Support | 3 (50.0%) | 3 (50.0%) |
| Security & Protection | 0 (0.0%) | 2 (100.0%) |
| Firefighting & Prevention | 0 (0.0%) | 2 (100.0%) |
| Law Enforcement | 0 (0.0%) | 0 (0.0%) |
| Food Preparation & Serving | 3 (50.0%) | 3 (50.0%) |
| Cleaning & Maintenance | 3 (50.0%) | 3 (50.0%) |
| Personal Care & Service | 4 (57.1%) | 3 (42.9%) |
| Total (Category) | 13 (48.1%) | 14 (51.8%) |
| Total (Overall) | 115 (59.3%) | 79 (40.7%) |
Sales and Office Occupations
The most common Sales and Office occupations in Peterson are Office & Administration (29 | 14.9%), and Sales & Related (14 | 7.2%).
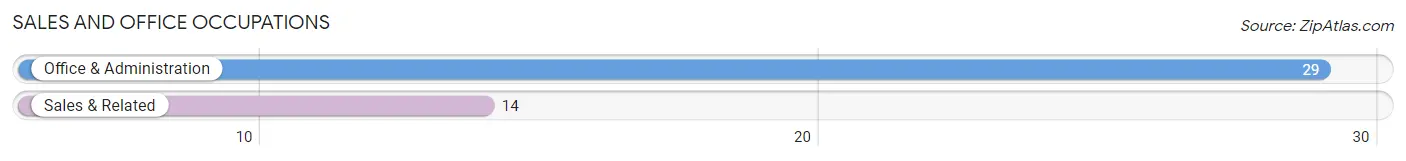
Sales and Office Occupations by Sex
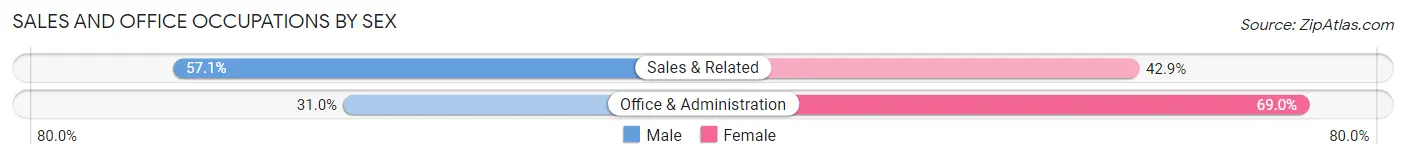
| Occupation | Male | Female |
| Sales & Related | 8 (57.1%) | 6 (42.9%) |
| Office & Administration | 9 (31.0%) | 20 (69.0%) |
| Total (Category) | 17 (39.5%) | 26 (60.5%) |
| Total (Overall) | 115 (59.3%) | 79 (40.7%) |
Natural Resources, Construction and Maintenance Occupations
The most common Natural Resources, Construction and Maintenance occupations in Peterson are Construction & Extraction (16 | 8.3%), Installation, Maintenance & Repair (8 | 4.1%), and Farming, Fishing & Forestry (6 | 3.1%).
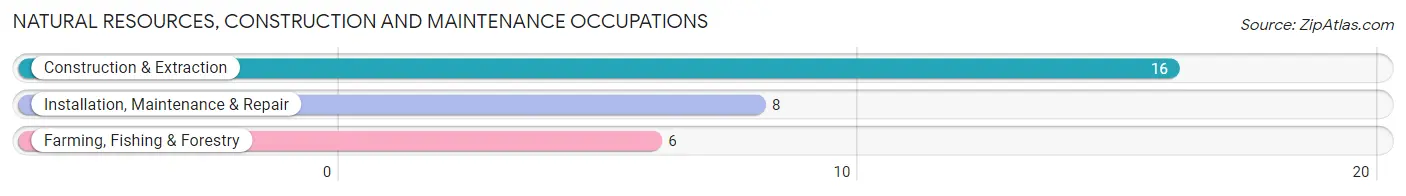
Natural Resources, Construction and Maintenance Occupations by Sex
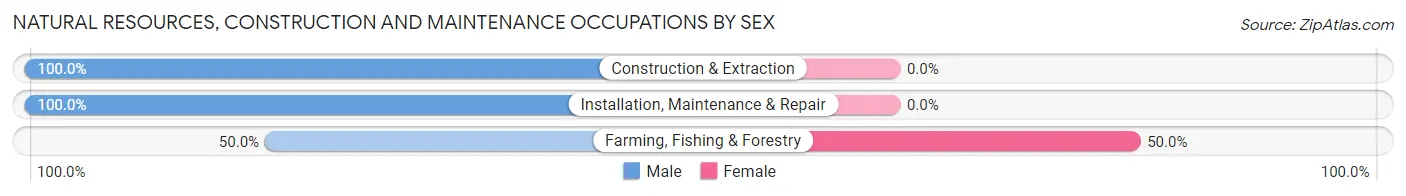
| Occupation | Male | Female |
| Farming, Fishing & Forestry | 3 (50.0%) | 3 (50.0%) |
| Construction & Extraction | 16 (100.0%) | 0 (0.0%) |
| Installation, Maintenance & Repair | 8 (100.0%) | 0 (0.0%) |
| Total (Category) | 27 (90.0%) | 3 (10.0%) |
| Total (Overall) | 115 (59.3%) | 79 (40.7%) |
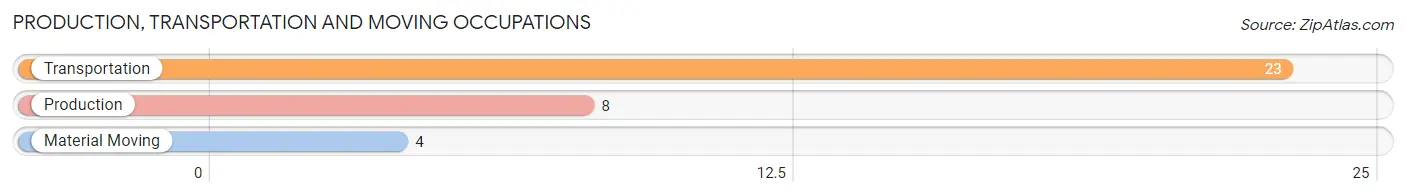
Production, Transportation and Moving Occupations
The most common Production, Transportation and Moving occupations in Peterson are Transportation (23 | 11.9%), Production (8 | 4.1%), and Material Moving (4 | 2.1%).
Production, Transportation and Moving Occupations by Sex
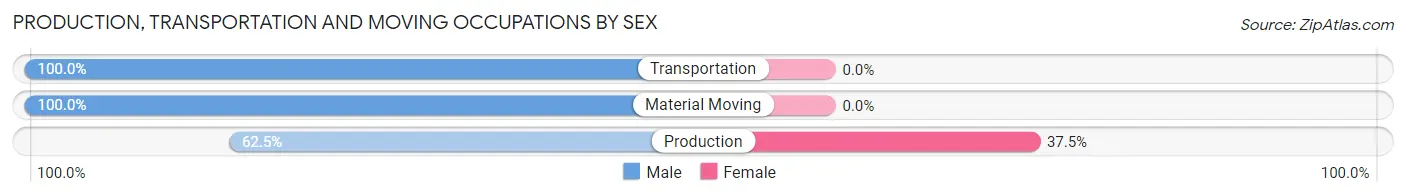
| Occupation | Male | Female |
| Production | 5 (62.5%) | 3 (37.5%) |
| Transportation | 23 (100.0%) | 0 (0.0%) |
| Material Moving | 4 (100.0%) | 0 (0.0%) |
| Total (Category) | 32 (91.4%) | 3 (8.6%) |
| Total (Overall) | 115 (59.3%) | 79 (40.7%) |
Employment Industries by Sex in Peterson
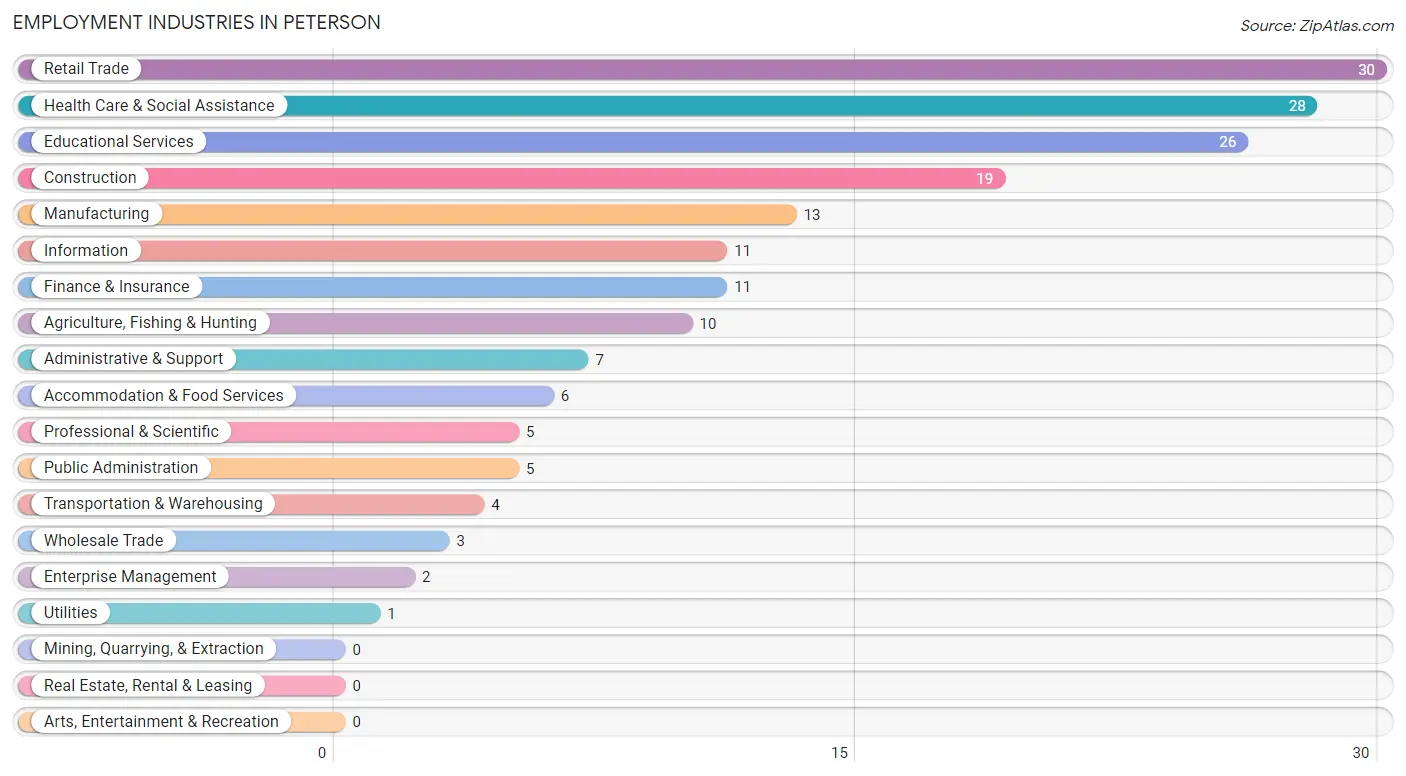
Employment Industries in Peterson
The major employment industries in Peterson include Retail Trade (30 | 15.5%), Health Care & Social Assistance (28 | 14.4%), Educational Services (26 | 13.4%), Construction (19 | 9.8%), and Manufacturing (13 | 6.7%).
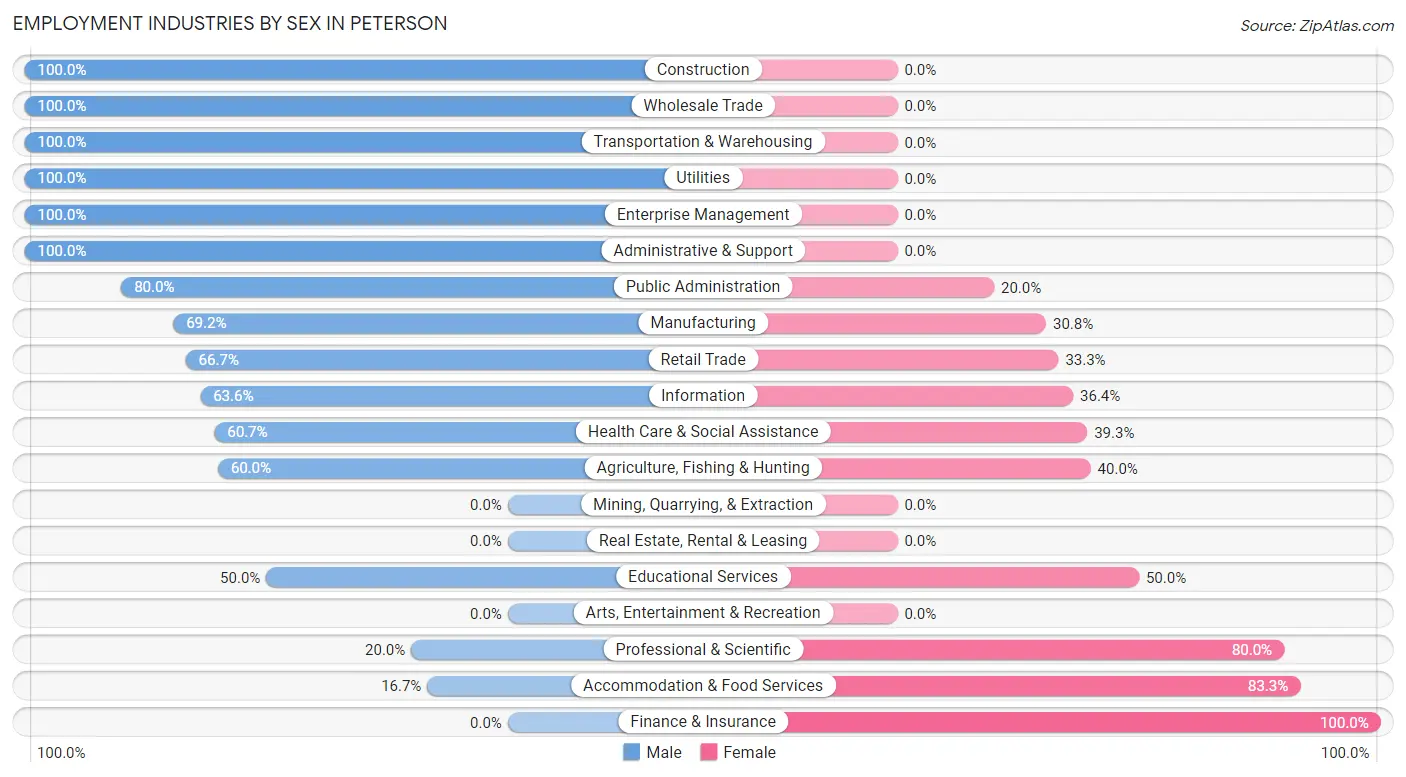
Employment Industries by Sex in Peterson
The Peterson industries that see more men than women are Construction (100.0%), Wholesale Trade (100.0%), and Transportation & Warehousing (100.0%), whereas the industries that tend to have a higher number of women are Finance & Insurance (100.0%), Accommodation & Food Services (83.3%), and Professional & Scientific (80.0%).
| Industry | Male | Female |
| Agriculture, Fishing & Hunting | 6 (60.0%) | 4 (40.0%) |
| Mining, Quarrying, & Extraction | 0 (0.0%) | 0 (0.0%) |
| Construction | 19 (100.0%) | 0 (0.0%) |
| Manufacturing | 9 (69.2%) | 4 (30.8%) |
| Wholesale Trade | 3 (100.0%) | 0 (0.0%) |
| Retail Trade | 20 (66.7%) | 10 (33.3%) |
| Transportation & Warehousing | 4 (100.0%) | 0 (0.0%) |
| Utilities | 1 (100.0%) | 0 (0.0%) |
| Information | 7 (63.6%) | 4 (36.4%) |
| Finance & Insurance | 0 (0.0%) | 11 (100.0%) |
| Real Estate, Rental & Leasing | 0 (0.0%) | 0 (0.0%) |
| Professional & Scientific | 1 (20.0%) | 4 (80.0%) |
| Enterprise Management | 2 (100.0%) | 0 (0.0%) |
| Administrative & Support | 7 (100.0%) | 0 (0.0%) |
| Educational Services | 13 (50.0%) | 13 (50.0%) |
| Health Care & Social Assistance | 17 (60.7%) | 11 (39.3%) |
| Arts, Entertainment & Recreation | 0 (0.0%) | 0 (0.0%) |
| Accommodation & Food Services | 1 (16.7%) | 5 (83.3%) |
| Public Administration | 4 (80.0%) | 1 (20.0%) |
| Total | 115 (59.3%) | 79 (40.7%) |
Education in Peterson
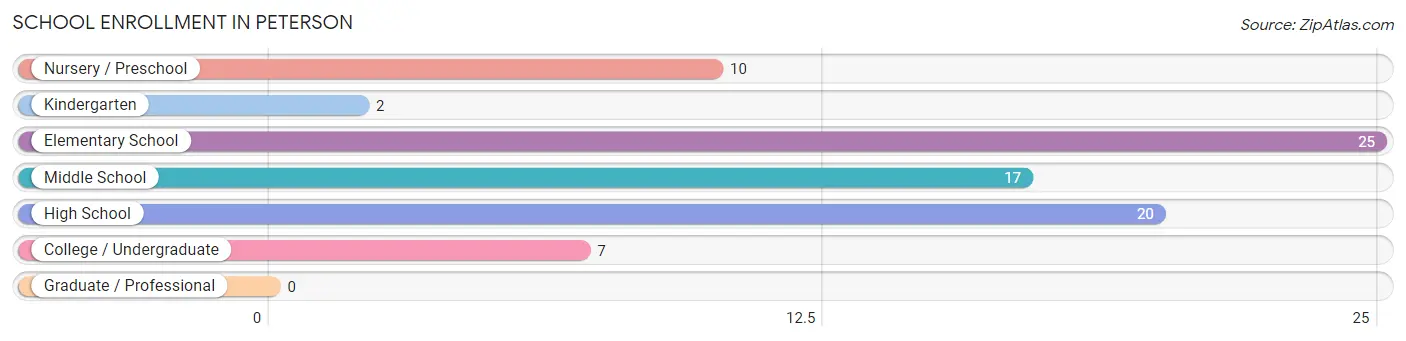
School Enrollment in Peterson
The most common levels of schooling among the 81 students in Peterson are elementary school (25 | 30.9%), high school (20 | 24.7%), and middle school (17 | 21.0%).
| School Level | # Students | % Students |
| Nursery / Preschool | 10 | 12.3% |
| Kindergarten | 2 | 2.5% |
| Elementary School | 25 | 30.9% |
| Middle School | 17 | 21.0% |
| High School | 20 | 24.7% |
| College / Undergraduate | 7 | 8.6% |
| Graduate / Professional | 0 | 0.0% |
| Total | 81 | 100.0% |
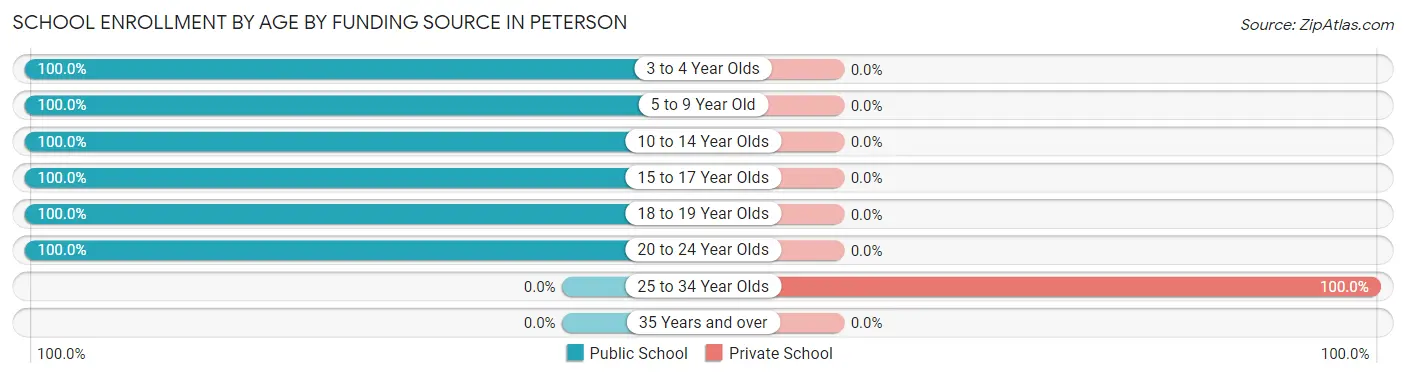
School Enrollment by Age by Funding Source in Peterson
Out of a total of 81 students who are enrolled in schools in Peterson, 3 (3.7%) attend a private institution, while the remaining 78 (96.3%) are enrolled in public schools. The age group of 25 to 34 year olds has the highest likelihood of being enrolled in private schools, with 3 (100.0% in the age bracket) enrolled. Conversely, the age group of 3 to 4 year olds has the lowest likelihood of being enrolled in a private school, with 8 (100.0% in the age bracket) attending a public institution.
| Age Bracket | Public School | Private School |
| 3 to 4 Year Olds | 8 (100.0%) | 0 (0.0%) |
| 5 to 9 Year Old | 21 (100.0%) | 0 (0.0%) |
| 10 to 14 Year Olds | 29 (100.0%) | 0 (0.0%) |
| 15 to 17 Year Olds | 14 (100.0%) | 0 (0.0%) |
| 18 to 19 Year Olds | 2 (100.0%) | 0 (0.0%) |
| 20 to 24 Year Olds | 4 (100.0%) | 0 (0.0%) |
| 25 to 34 Year Olds | 0 (0.0%) | 3 (100.0%) |
| 35 Years and over | 0 (0.0%) | 0 (0.0%) |
| Total | 78 (96.3%) | 3 (3.7%) |
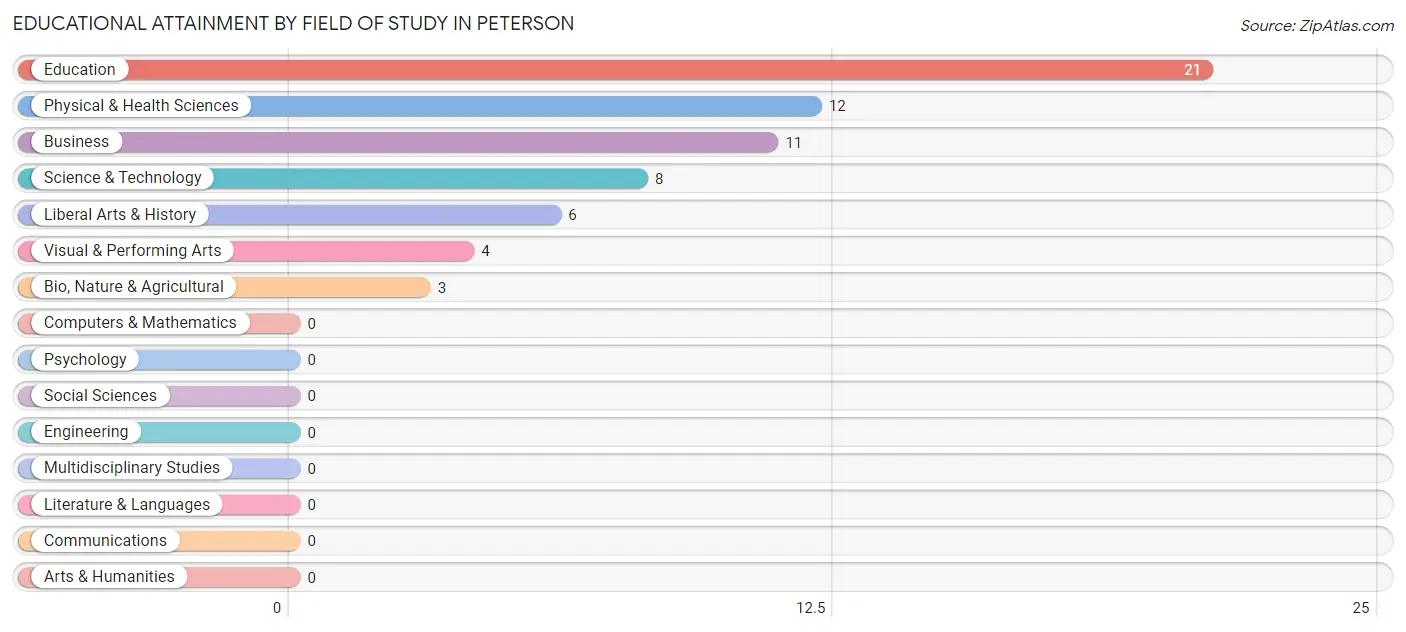
Educational Attainment by Field of Study in Peterson
Education (21 | 32.3%), physical & health sciences (12 | 18.5%), business (11 | 16.9%), science & technology (8 | 12.3%), and liberal arts & history (6 | 9.2%) are the most common fields of study among 65 individuals in Peterson who have obtained a bachelor's degree or higher.
| Field of Study | # Graduates | % Graduates |
| Computers & Mathematics | 0 | 0.0% |
| Bio, Nature & Agricultural | 3 | 4.6% |
| Physical & Health Sciences | 12 | 18.5% |
| Psychology | 0 | 0.0% |
| Social Sciences | 0 | 0.0% |
| Engineering | 0 | 0.0% |
| Multidisciplinary Studies | 0 | 0.0% |
| Science & Technology | 8 | 12.3% |
| Business | 11 | 16.9% |
| Education | 21 | 32.3% |
| Literature & Languages | 0 | 0.0% |
| Liberal Arts & History | 6 | 9.2% |
| Visual & Performing Arts | 4 | 6.1% |
| Communications | 0 | 0.0% |
| Arts & Humanities | 0 | 0.0% |
| Total | 65 | 100.0% |
Transportation & Commute in Peterson
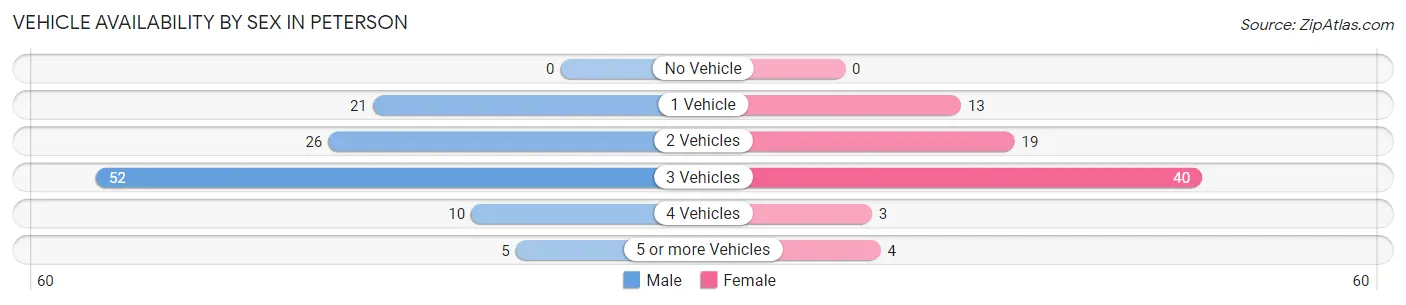
Vehicle Availability by Sex in Peterson
The most prevalent vehicle ownership categories in Peterson are males with 3 vehicles (52, accounting for 45.6%) and females with 3 vehicles (40, making up 65.8%).
| Vehicles Available | Male | Female |
| No Vehicle | 0 (0.0%) | 0 (0.0%) |
| 1 Vehicle | 21 (18.4%) | 13 (16.5%) |
| 2 Vehicles | 26 (22.8%) | 19 (24.0%) |
| 3 Vehicles | 52 (45.6%) | 40 (50.6%) |
| 4 Vehicles | 10 (8.8%) | 3 (3.8%) |
| 5 or more Vehicles | 5 (4.4%) | 4 (5.1%) |
| Total | 114 (100.0%) | 79 (100.0%) |
Commute Time in Peterson
The most frequently occuring commute durations in Peterson are 30 to 34 minutes (91 commuters, 48.9%), 15 to 19 minutes (22 commuters, 11.8%), and 5 to 9 minutes (18 commuters, 9.7%).
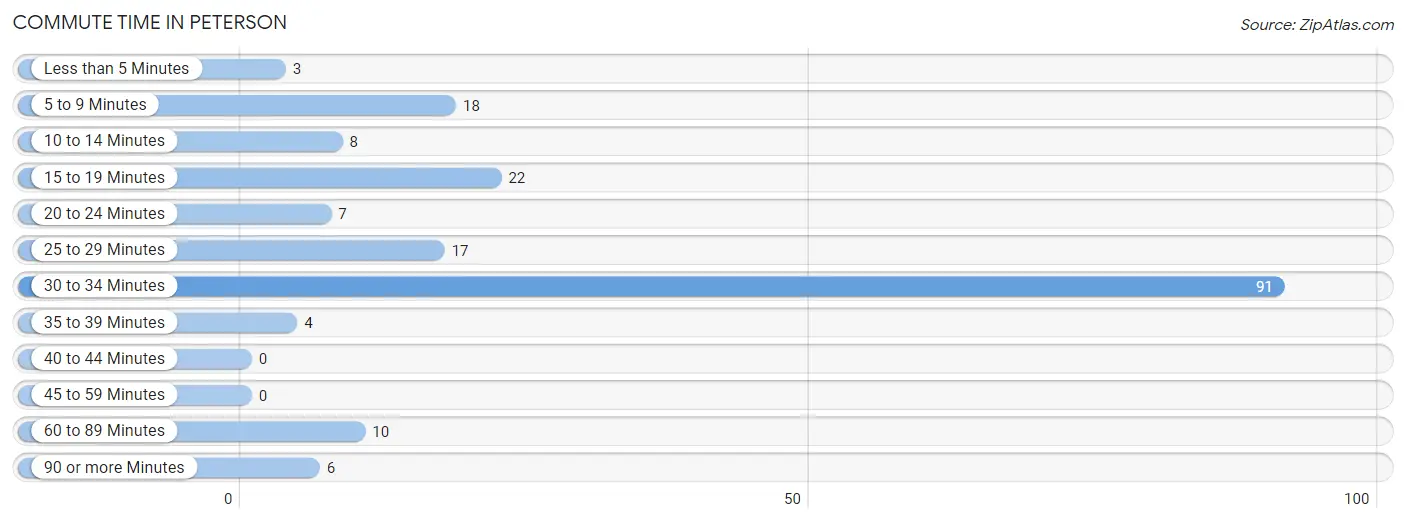
| Commute Time | # Commuters | % Commuters |
| Less than 5 Minutes | 3 | 1.6% |
| 5 to 9 Minutes | 18 | 9.7% |
| 10 to 14 Minutes | 8 | 4.3% |
| 15 to 19 Minutes | 22 | 11.8% |
| 20 to 24 Minutes | 7 | 3.8% |
| 25 to 29 Minutes | 17 | 9.1% |
| 30 to 34 Minutes | 91 | 48.9% |
| 35 to 39 Minutes | 4 | 2.1% |
| 40 to 44 Minutes | 0 | 0.0% |
| 45 to 59 Minutes | 0 | 0.0% |
| 60 to 89 Minutes | 10 | 5.4% |
| 90 or more Minutes | 6 | 3.2% |
Commute Time by Sex in Peterson
The most common commute times in Peterson are 30 to 34 minutes (55 commuters, 48.7%) for males and 30 to 34 minutes (36 commuters, 49.3%) for females.
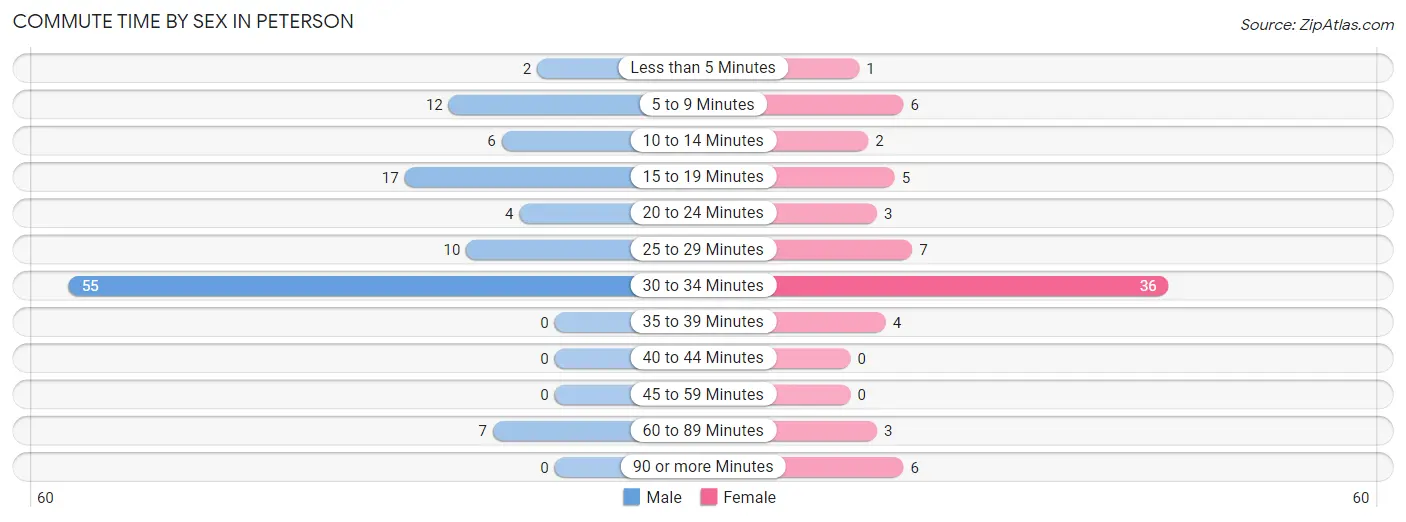
| Commute Time | Male | Female |
| Less than 5 Minutes | 2 (1.8%) | 1 (1.4%) |
| 5 to 9 Minutes | 12 (10.6%) | 6 (8.2%) |
| 10 to 14 Minutes | 6 (5.3%) | 2 (2.7%) |
| 15 to 19 Minutes | 17 (15.0%) | 5 (6.9%) |
| 20 to 24 Minutes | 4 (3.5%) | 3 (4.1%) |
| 25 to 29 Minutes | 10 (8.8%) | 7 (9.6%) |
| 30 to 34 Minutes | 55 (48.7%) | 36 (49.3%) |
| 35 to 39 Minutes | 0 (0.0%) | 4 (5.5%) |
| 40 to 44 Minutes | 0 (0.0%) | 0 (0.0%) |
| 45 to 59 Minutes | 0 (0.0%) | 0 (0.0%) |
| 60 to 89 Minutes | 7 (6.2%) | 3 (4.1%) |
| 90 or more Minutes | 0 (0.0%) | 6 (8.2%) |
Time of Departure to Work by Sex in Peterson
The most frequent times of departure to work in Peterson are 7:00 AM to 7:29 AM (23, 20.3%) for males and 7:30 AM to 7:59 AM (19, 26.0%) for females.
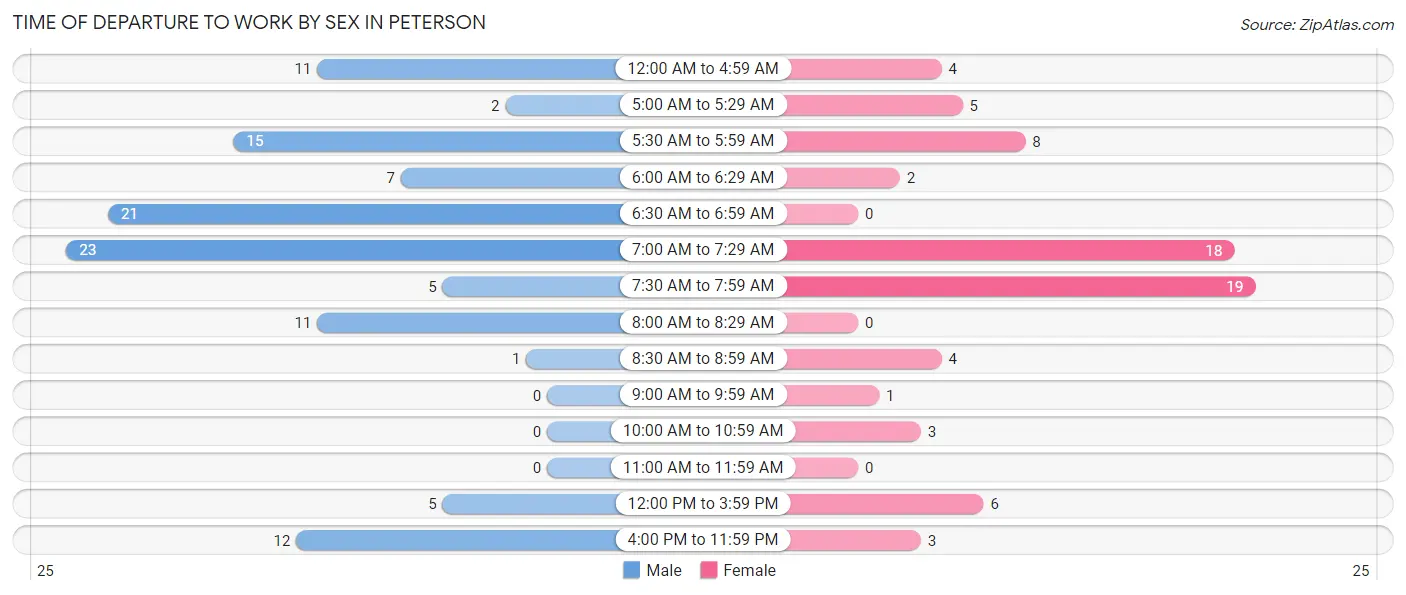
| Time of Departure | Male | Female |
| 12:00 AM to 4:59 AM | 11 (9.7%) | 4 (5.5%) |
| 5:00 AM to 5:29 AM | 2 (1.8%) | 5 (6.9%) |
| 5:30 AM to 5:59 AM | 15 (13.3%) | 8 (11.0%) |
| 6:00 AM to 6:29 AM | 7 (6.2%) | 2 (2.7%) |
| 6:30 AM to 6:59 AM | 21 (18.6%) | 0 (0.0%) |
| 7:00 AM to 7:29 AM | 23 (20.3%) | 18 (24.7%) |
| 7:30 AM to 7:59 AM | 5 (4.4%) | 19 (26.0%) |
| 8:00 AM to 8:29 AM | 11 (9.7%) | 0 (0.0%) |
| 8:30 AM to 8:59 AM | 1 (0.9%) | 4 (5.5%) |
| 9:00 AM to 9:59 AM | 0 (0.0%) | 1 (1.4%) |
| 10:00 AM to 10:59 AM | 0 (0.0%) | 3 (4.1%) |
| 11:00 AM to 11:59 AM | 0 (0.0%) | 0 (0.0%) |
| 12:00 PM to 3:59 PM | 5 (4.4%) | 6 (8.2%) |
| 4:00 PM to 11:59 PM | 12 (10.6%) | 3 (4.1%) |
| Total | 113 (100.0%) | 73 (100.0%) |
Housing Occupancy in Peterson
Occupancy by Ownership in Peterson
Of the total 160 dwellings in Peterson, owner-occupied units account for 136 (85.0%), while renter-occupied units make up 24 (15.0%).
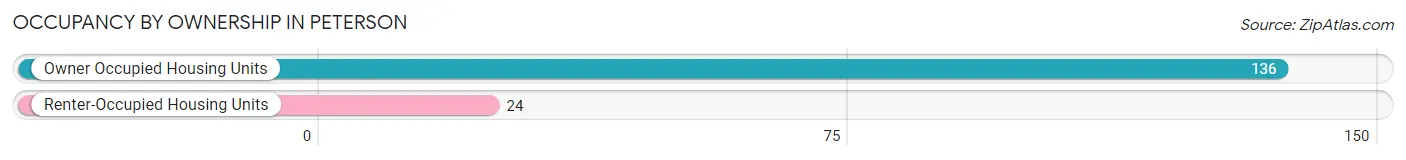
| Occupancy | # Housing Units | % Housing Units |
| Owner Occupied Housing Units | 136 | 85.0% |
| Renter-Occupied Housing Units | 24 | 15.0% |
| Total Occupied Housing Units | 160 | 100.0% |
Occupancy by Household Size in Peterson
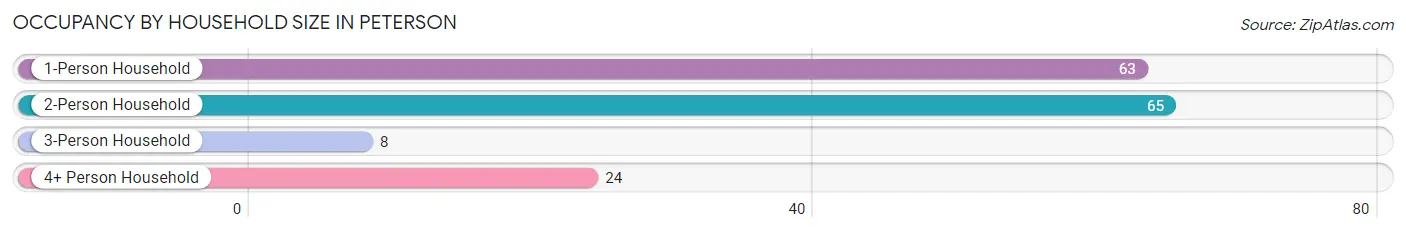
| Household Size | # Housing Units | % Housing Units |
| 1-Person Household | 63 | 39.4% |
| 2-Person Household | 65 | 40.6% |
| 3-Person Household | 8 | 5.0% |
| 4+ Person Household | 24 | 15.0% |
| Total Housing Units | 160 | 100.0% |
Occupancy by Ownership by Household Size in Peterson
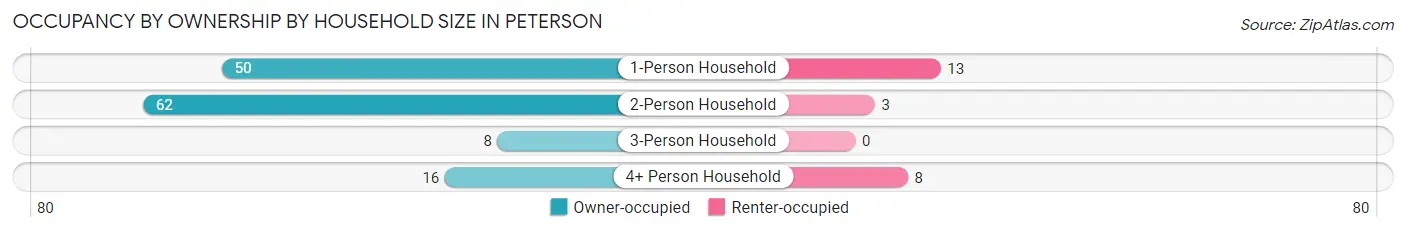
| Household Size | Owner-occupied | Renter-occupied |
| 1-Person Household | 50 (79.4%) | 13 (20.6%) |
| 2-Person Household | 62 (95.4%) | 3 (4.6%) |
| 3-Person Household | 8 (100.0%) | 0 (0.0%) |
| 4+ Person Household | 16 (66.7%) | 8 (33.3%) |
| Total Housing Units | 136 (85.0%) | 24 (15.0%) |
Occupancy by Educational Attainment in Peterson
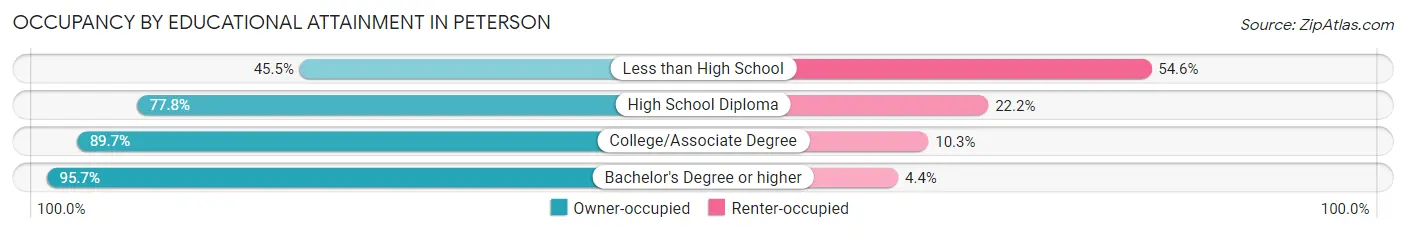
| Household Size | Owner-occupied | Renter-occupied |
| Less than High School | 5 (45.5%) | 6 (54.5%) |
| High School Diploma | 35 (77.8%) | 10 (22.2%) |
| College/Associate Degree | 52 (89.7%) | 6 (10.3%) |
| Bachelor's Degree or higher | 44 (95.7%) | 2 (4.3%) |
Occupancy by Age of Householder in Peterson
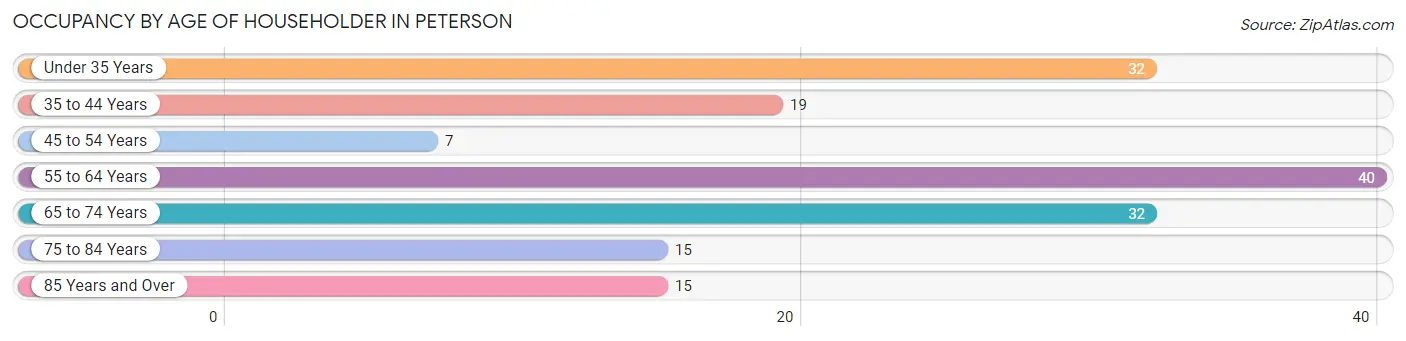
| Age Bracket | # Households | % Households |
| Under 35 Years | 32 | 20.0% |
| 35 to 44 Years | 19 | 11.9% |
| 45 to 54 Years | 7 | 4.4% |
| 55 to 64 Years | 40 | 25.0% |
| 65 to 74 Years | 32 | 20.0% |
| 75 to 84 Years | 15 | 9.4% |
| 85 Years and Over | 15 | 9.4% |
| Total | 160 | 100.0% |
Housing Finances in Peterson
Median Income by Occupancy in Peterson
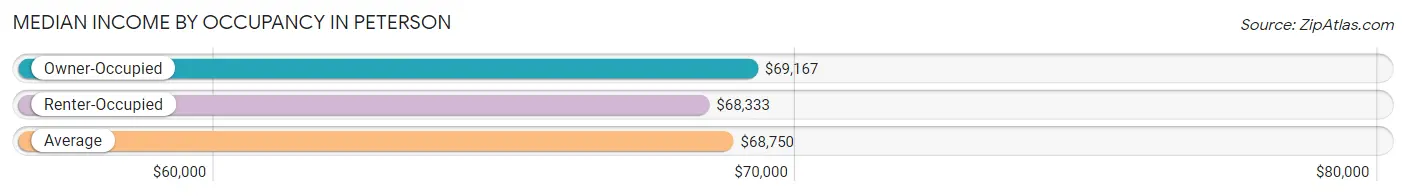
| Occupancy Type | # Households | Median Income |
| Owner-Occupied | 136 (85.0%) | $69,167 |
| Renter-Occupied | 24 (15.0%) | $68,333 |
| Average | 160 (100.0%) | $68,750 |
Occupancy by Householder Income Bracket in Peterson
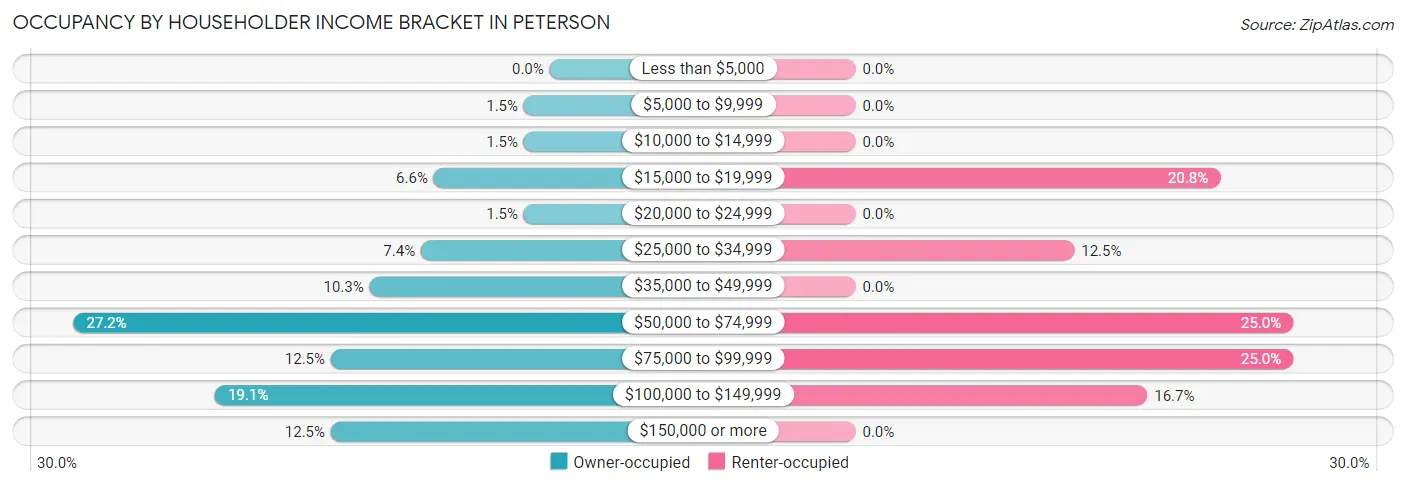
| Income Bracket | Owner-occupied | Renter-occupied |
| Less than $5,000 | 0 (0.0%) | 0 (0.0%) |
| $5,000 to $9,999 | 2 (1.5%) | 0 (0.0%) |
| $10,000 to $14,999 | 2 (1.5%) | 0 (0.0%) |
| $15,000 to $19,999 | 9 (6.6%) | 5 (20.8%) |
| $20,000 to $24,999 | 2 (1.5%) | 0 (0.0%) |
| $25,000 to $34,999 | 10 (7.3%) | 3 (12.5%) |
| $35,000 to $49,999 | 14 (10.3%) | 0 (0.0%) |
| $50,000 to $74,999 | 37 (27.2%) | 6 (25.0%) |
| $75,000 to $99,999 | 17 (12.5%) | 6 (25.0%) |
| $100,000 to $149,999 | 26 (19.1%) | 4 (16.7%) |
| $150,000 or more | 17 (12.5%) | 0 (0.0%) |
| Total | 136 (100.0%) | 24 (100.0%) |
Monthly Housing Cost Tiers in Peterson
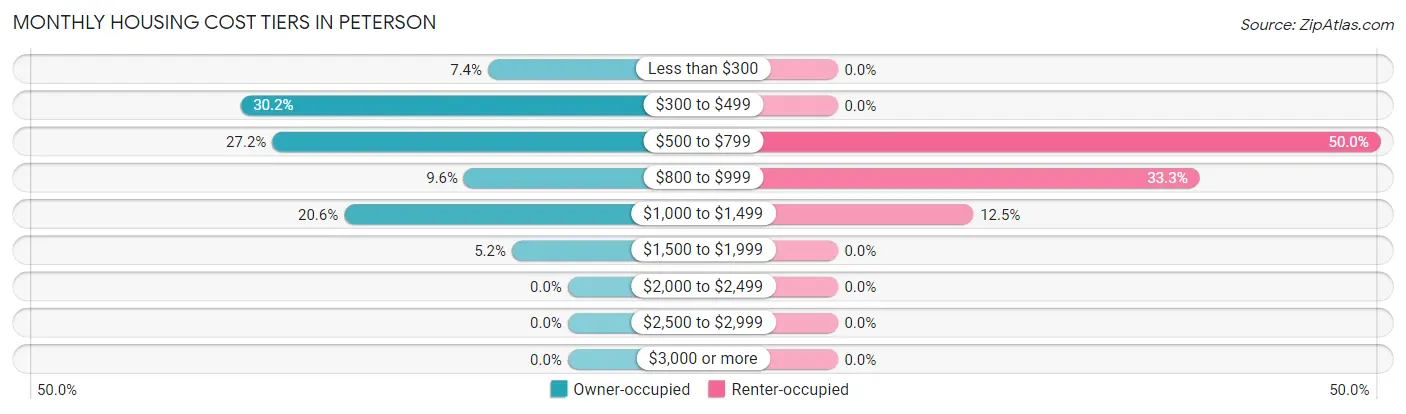
| Monthly Cost | Owner-occupied | Renter-occupied |
| Less than $300 | 10 (7.3%) | 0 (0.0%) |
| $300 to $499 | 41 (30.1%) | 0 (0.0%) |
| $500 to $799 | 37 (27.2%) | 12 (50.0%) |
| $800 to $999 | 13 (9.6%) | 8 (33.3%) |
| $1,000 to $1,499 | 28 (20.6%) | 3 (12.5%) |
| $1,500 to $1,999 | 7 (5.1%) | 0 (0.0%) |
| $2,000 to $2,499 | 0 (0.0%) | 0 (0.0%) |
| $2,500 to $2,999 | 0 (0.0%) | 0 (0.0%) |
| $3,000 or more | 0 (0.0%) | 0 (0.0%) |
| Total | 136 (100.0%) | 24 (100.0%) |
Physical Housing Characteristics in Peterson
Housing Structures in Peterson
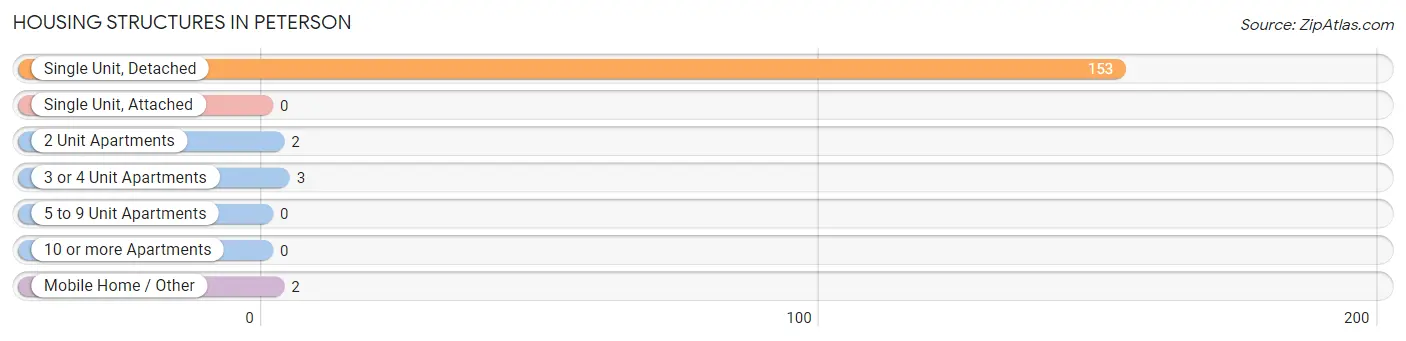
| Structure Type | # Housing Units | % Housing Units |
| Single Unit, Detached | 153 | 95.6% |
| Single Unit, Attached | 0 | 0.0% |
| 2 Unit Apartments | 2 | 1.3% |
| 3 or 4 Unit Apartments | 3 | 1.9% |
| 5 to 9 Unit Apartments | 0 | 0.0% |
| 10 or more Apartments | 0 | 0.0% |
| Mobile Home / Other | 2 | 1.3% |
| Total | 160 | 100.0% |
Housing Structures by Occupancy in Peterson
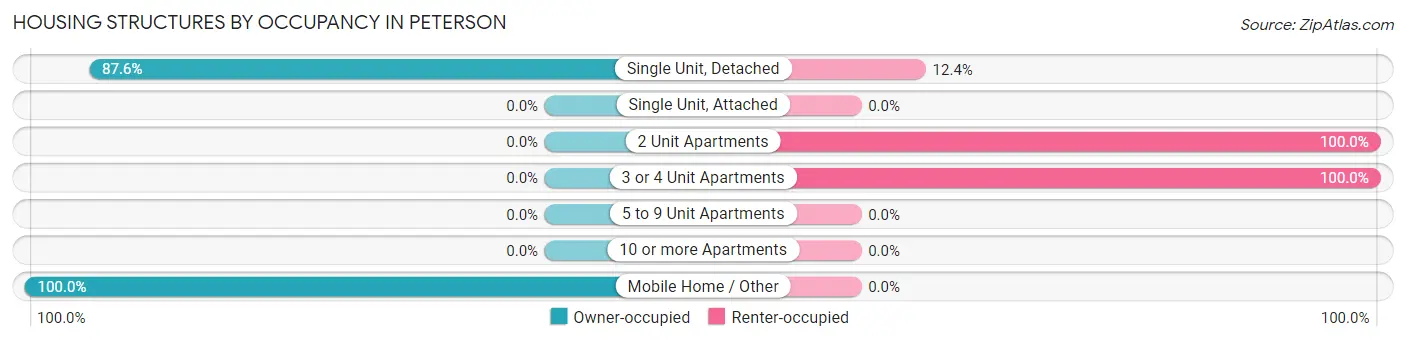
| Structure Type | Owner-occupied | Renter-occupied |
| Single Unit, Detached | 134 (87.6%) | 19 (12.4%) |
| Single Unit, Attached | 0 (0.0%) | 0 (0.0%) |
| 2 Unit Apartments | 0 (0.0%) | 2 (100.0%) |
| 3 or 4 Unit Apartments | 0 (0.0%) | 3 (100.0%) |
| 5 to 9 Unit Apartments | 0 (0.0%) | 0 (0.0%) |
| 10 or more Apartments | 0 (0.0%) | 0 (0.0%) |
| Mobile Home / Other | 2 (100.0%) | 0 (0.0%) |
| Total | 136 (85.0%) | 24 (15.0%) |
Housing Structures by Number of Rooms in Peterson
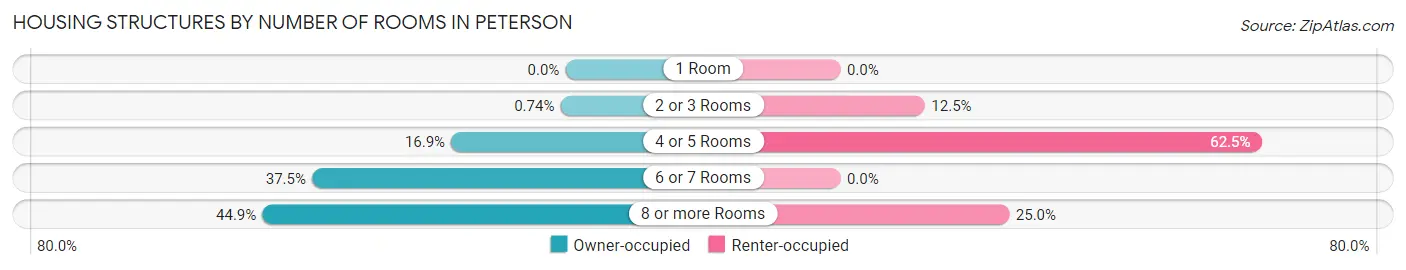
| Number of Rooms | Owner-occupied | Renter-occupied |
| 1 Room | 0 (0.0%) | 0 (0.0%) |
| 2 or 3 Rooms | 1 (0.7%) | 3 (12.5%) |
| 4 or 5 Rooms | 23 (16.9%) | 15 (62.5%) |
| 6 or 7 Rooms | 51 (37.5%) | 0 (0.0%) |
| 8 or more Rooms | 61 (44.9%) | 6 (25.0%) |
| Total | 136 (100.0%) | 24 (100.0%) |
Housing Structure by Heating Type in Peterson
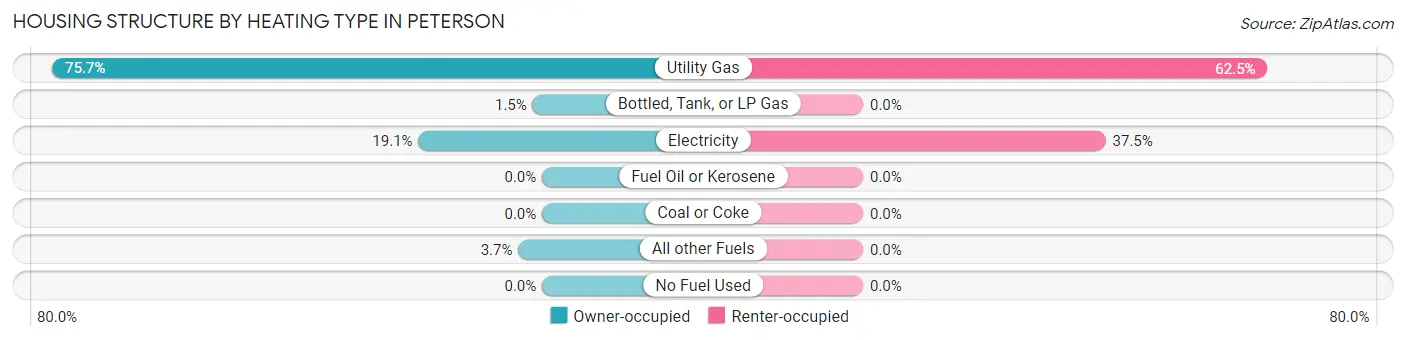
| Heating Type | Owner-occupied | Renter-occupied |
| Utility Gas | 103 (75.7%) | 15 (62.5%) |
| Bottled, Tank, or LP Gas | 2 (1.5%) | 0 (0.0%) |
| Electricity | 26 (19.1%) | 9 (37.5%) |
| Fuel Oil or Kerosene | 0 (0.0%) | 0 (0.0%) |
| Coal or Coke | 0 (0.0%) | 0 (0.0%) |
| All other Fuels | 5 (3.7%) | 0 (0.0%) |
| No Fuel Used | 0 (0.0%) | 0 (0.0%) |
| Total | 136 (100.0%) | 24 (100.0%) |
Household Vehicle Usage in Peterson
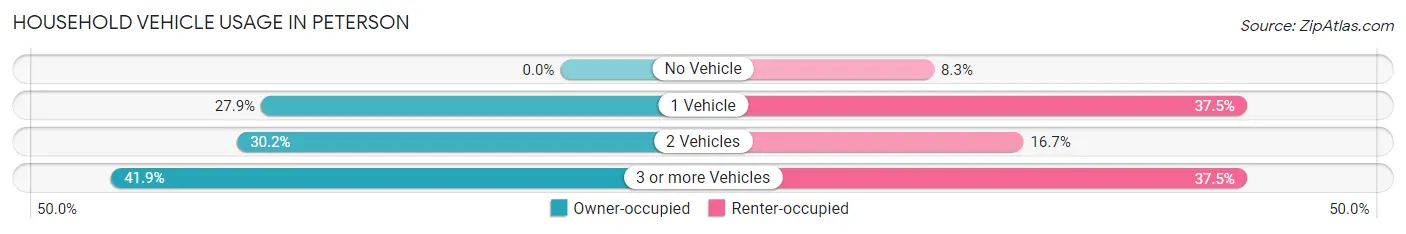
| Vehicles per Household | Owner-occupied | Renter-occupied |
| No Vehicle | 0 (0.0%) | 2 (8.3%) |
| 1 Vehicle | 38 (27.9%) | 9 (37.5%) |
| 2 Vehicles | 41 (30.1%) | 4 (16.7%) |
| 3 or more Vehicles | 57 (41.9%) | 9 (37.5%) |
| Total | 136 (100.0%) | 24 (100.0%) |
Real Estate & Mortgages in Peterson
Real Estate and Mortgage Overview in Peterson
| Characteristic | Without Mortgage | With Mortgage |
| Housing Units | 83 | 53 |
| Median Property Value | $59,700 | $85,000 |
| Median Household Income | $60,250 | $1 |
| Monthly Housing Costs | $457 | $0 |
| Real Estate Taxes | - | - |
Property Value by Mortgage Status in Peterson
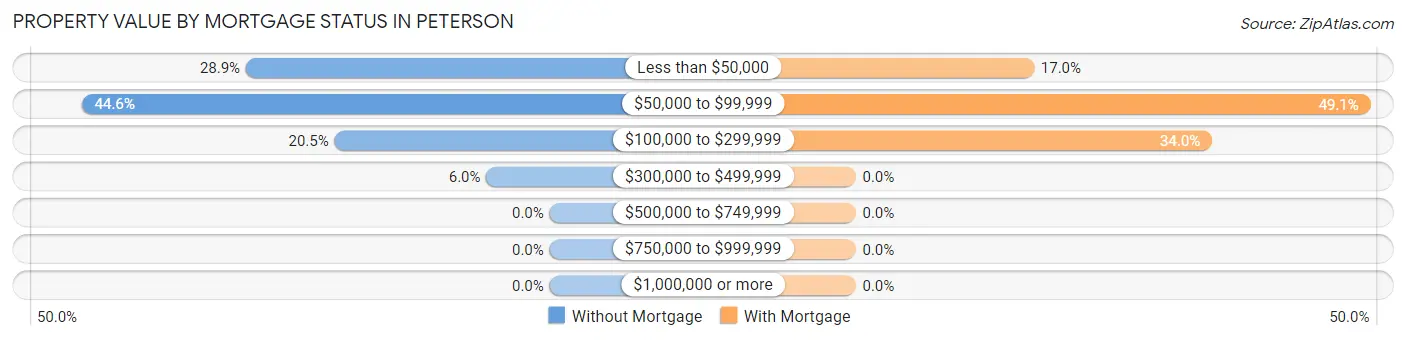
| Property Value | Without Mortgage | With Mortgage |
| Less than $50,000 | 24 (28.9%) | 9 (17.0%) |
| $50,000 to $99,999 | 37 (44.6%) | 26 (49.1%) |
| $100,000 to $299,999 | 17 (20.5%) | 18 (34.0%) |
| $300,000 to $499,999 | 5 (6.0%) | 0 (0.0%) |
| $500,000 to $749,999 | 0 (0.0%) | 0 (0.0%) |
| $750,000 to $999,999 | 0 (0.0%) | 0 (0.0%) |
| $1,000,000 or more | 0 (0.0%) | 0 (0.0%) |
| Total | 83 (100.0%) | 53 (100.0%) |
Household Income by Mortgage Status in Peterson
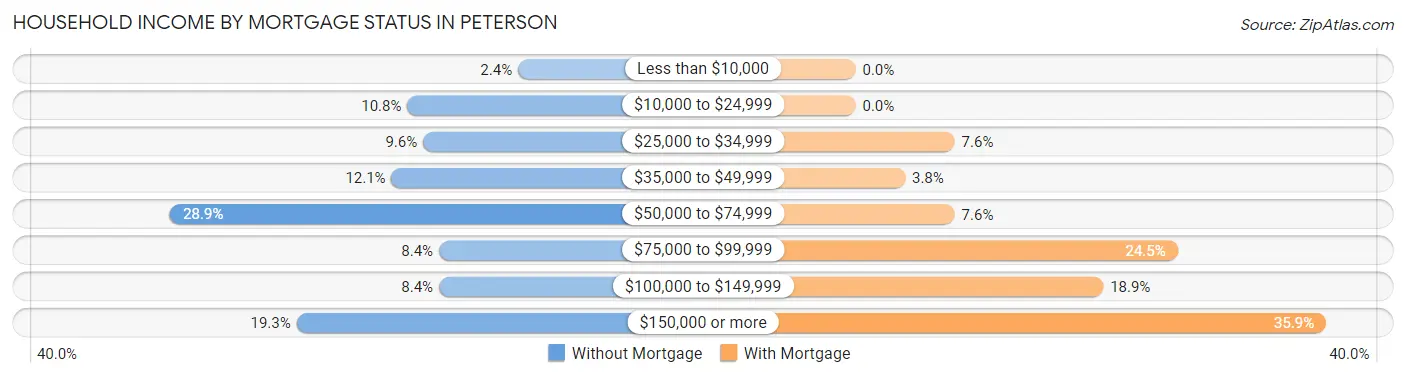
| Household Income | Without Mortgage | With Mortgage |
| Less than $10,000 | 2 (2.4%) | 0 (0.0%) |
| $10,000 to $24,999 | 9 (10.8%) | 0 (0.0%) |
| $25,000 to $34,999 | 8 (9.6%) | 4 (7.5%) |
| $35,000 to $49,999 | 10 (12.0%) | 2 (3.8%) |
| $50,000 to $74,999 | 24 (28.9%) | 4 (7.5%) |
| $75,000 to $99,999 | 7 (8.4%) | 13 (24.5%) |
| $100,000 to $149,999 | 7 (8.4%) | 10 (18.9%) |
| $150,000 or more | 16 (19.3%) | 19 (35.8%) |
| Total | 83 (100.0%) | 53 (100.0%) |
Property Value to Household Income Ratio in Peterson
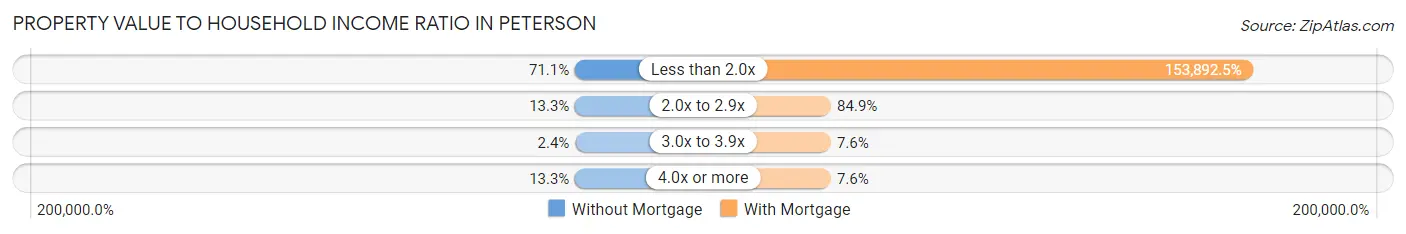
| Value-to-Income Ratio | Without Mortgage | With Mortgage |
| Less than 2.0x | 59 (71.1%) | 81,563 (153,892.5%) |
| 2.0x to 2.9x | 11 (13.3%) | 45 (84.9%) |
| 3.0x to 3.9x | 2 (2.4%) | 4 (7.5%) |
| 4.0x or more | 11 (13.3%) | 4 (7.5%) |
| Total | 83 (100.0%) | 53 (100.0%) |
Real Estate Taxes by Mortgage Status in Peterson
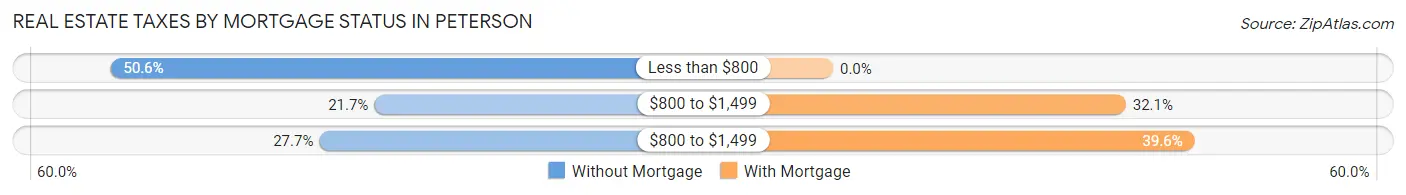
| Property Taxes | Without Mortgage | With Mortgage |
| Less than $800 | 42 (50.6%) | 0 (0.0%) |
| $800 to $1,499 | 18 (21.7%) | 17 (32.1%) |
| $800 to $1,499 | 23 (27.7%) | 21 (39.6%) |
| Total | 83 (100.0%) | 53 (100.0%) |
Health & Disability in Peterson
Health Insurance Coverage by Age in Peterson
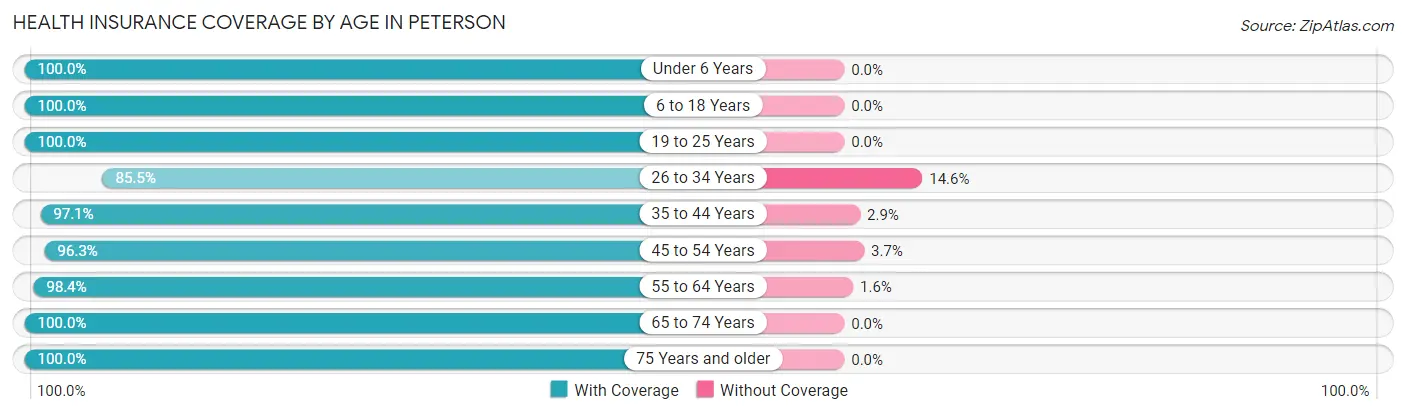
| Age Bracket | With Coverage | Without Coverage |
| Under 6 Years | 34 (100.0%) | 0 (0.0%) |
| 6 to 18 Years | 64 (100.0%) | 0 (0.0%) |
| 19 to 25 Years | 16 (100.0%) | 0 (0.0%) |
| 26 to 34 Years | 47 (85.5%) | 8 (14.5%) |
| 35 to 44 Years | 33 (97.1%) | 1 (2.9%) |
| 45 to 54 Years | 26 (96.3%) | 1 (3.7%) |
| 55 to 64 Years | 60 (98.4%) | 1 (1.6%) |
| 65 to 74 Years | 53 (100.0%) | 0 (0.0%) |
| 75 Years and older | 38 (100.0%) | 0 (0.0%) |
| Total | 371 (97.1%) | 11 (2.9%) |
Health Insurance Coverage by Citizenship Status in Peterson
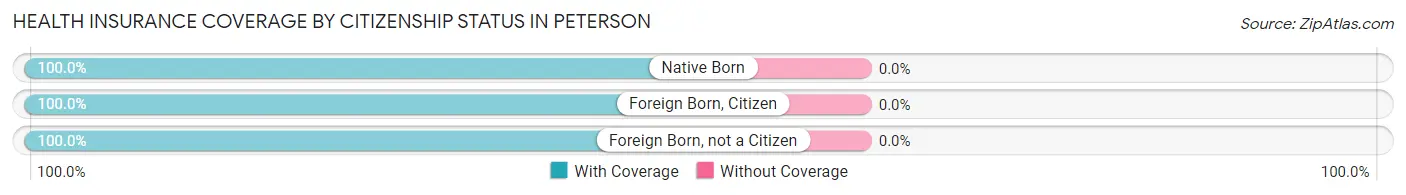
| Citizenship Status | With Coverage | Without Coverage |
| Native Born | 34 (100.0%) | 0 (0.0%) |
| Foreign Born, Citizen | 64 (100.0%) | 0 (0.0%) |
| Foreign Born, not a Citizen | 16 (100.0%) | 0 (0.0%) |
Health Insurance Coverage by Household Income in Peterson
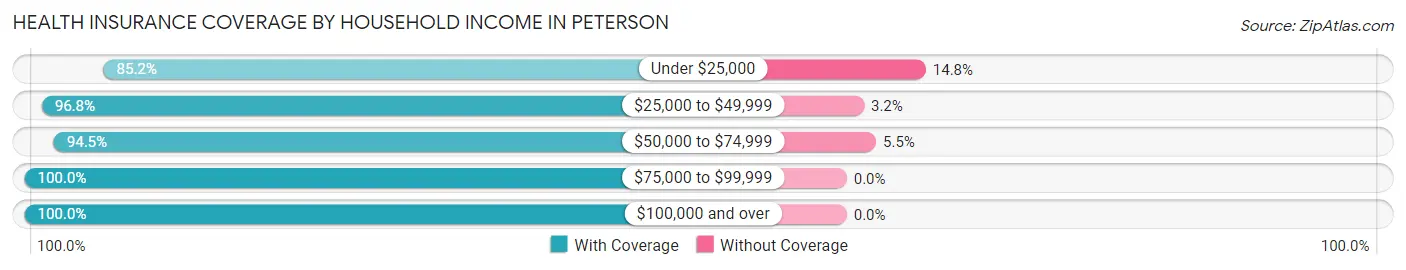
| Household Income | With Coverage | Without Coverage |
| Under $25,000 | 23 (85.2%) | 4 (14.8%) |
| $25,000 to $49,999 | 60 (96.8%) | 2 (3.2%) |
| $50,000 to $74,999 | 86 (94.5%) | 5 (5.5%) |
| $75,000 to $99,999 | 67 (100.0%) | 0 (0.0%) |
| $100,000 and over | 135 (100.0%) | 0 (0.0%) |
Public vs Private Health Insurance Coverage by Age in Peterson
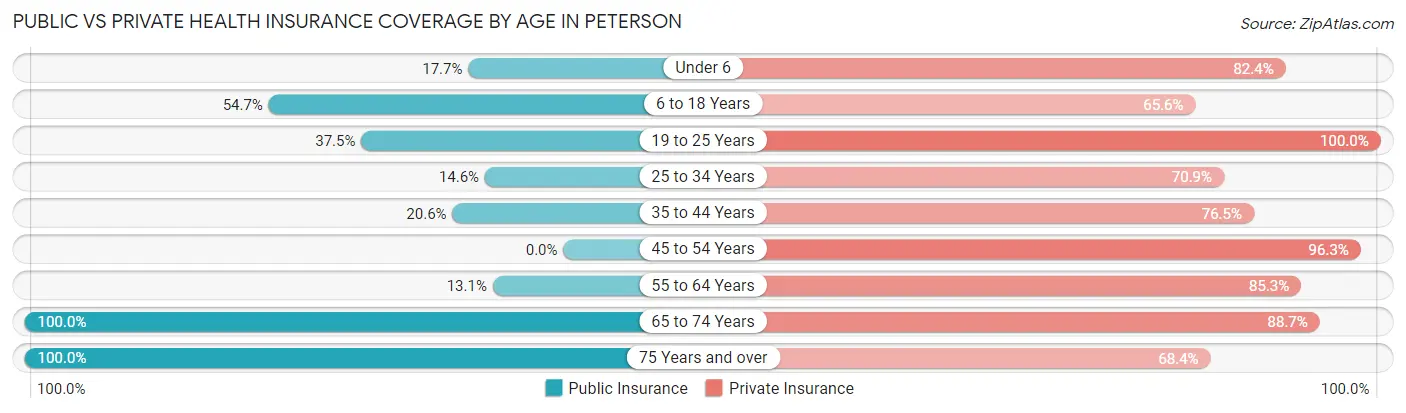
| Age Bracket | Public Insurance | Private Insurance |
| Under 6 | 6 (17.6%) | 28 (82.4%) |
| 6 to 18 Years | 35 (54.7%) | 42 (65.6%) |
| 19 to 25 Years | 6 (37.5%) | 16 (100.0%) |
| 25 to 34 Years | 8 (14.5%) | 39 (70.9%) |
| 35 to 44 Years | 7 (20.6%) | 26 (76.5%) |
| 45 to 54 Years | 0 (0.0%) | 26 (96.3%) |
| 55 to 64 Years | 8 (13.1%) | 52 (85.3%) |
| 65 to 74 Years | 53 (100.0%) | 47 (88.7%) |
| 75 Years and over | 38 (100.0%) | 26 (68.4%) |
| Total | 161 (42.1%) | 302 (79.1%) |
Disability Status by Sex by Age in Peterson
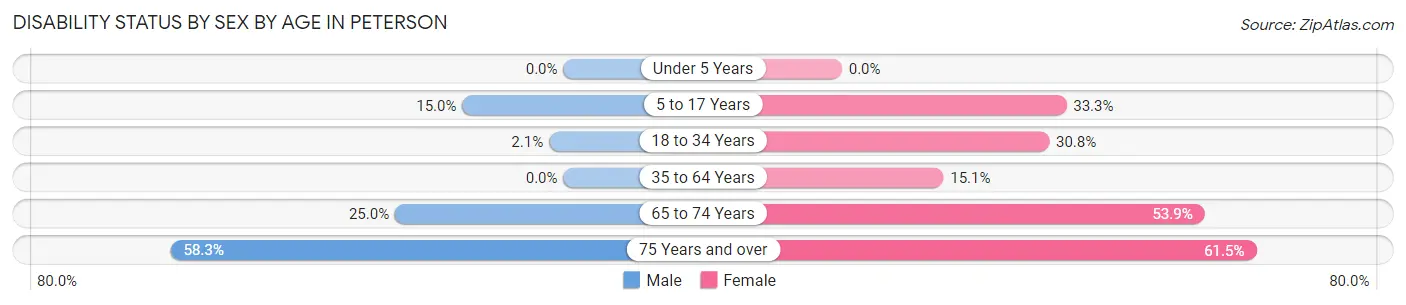
| Age Bracket | Male | Female |
| Under 5 Years | 0 (0.0%) | 0 (0.0%) |
| 5 to 17 Years | 6 (15.0%) | 8 (33.3%) |
| 18 to 34 Years | 1 (2.1%) | 8 (30.8%) |
| 35 to 64 Years | 0 (0.0%) | 11 (15.1%) |
| 65 to 74 Years | 10 (25.0%) | 7 (53.8%) |
| 75 Years and over | 7 (58.3%) | 16 (61.5%) |
Disability Class by Sex by Age in Peterson
Disability Class: Hearing Difficulty
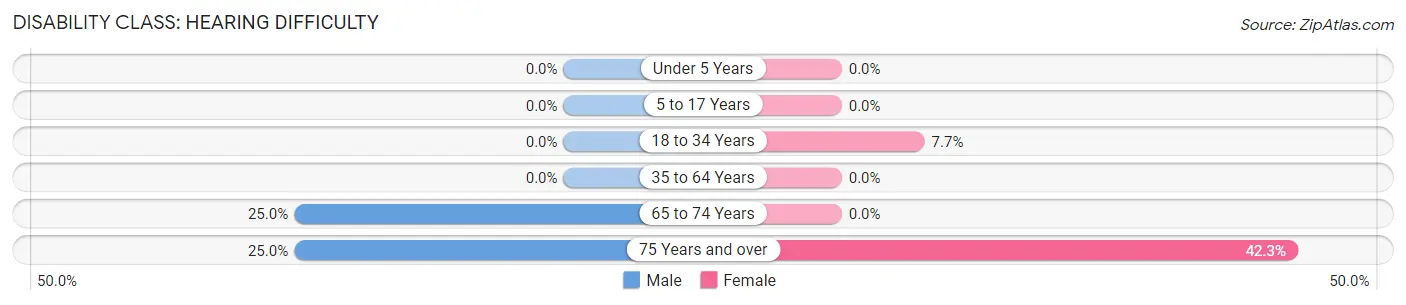
| Age Bracket | Male | Female |
| Under 5 Years | 0 (0.0%) | 0 (0.0%) |
| 5 to 17 Years | 0 (0.0%) | 0 (0.0%) |
| 18 to 34 Years | 0 (0.0%) | 2 (7.7%) |
| 35 to 64 Years | 0 (0.0%) | 0 (0.0%) |
| 65 to 74 Years | 10 (25.0%) | 0 (0.0%) |
| 75 Years and over | 3 (25.0%) | 11 (42.3%) |
Disability Class: Vision Difficulty
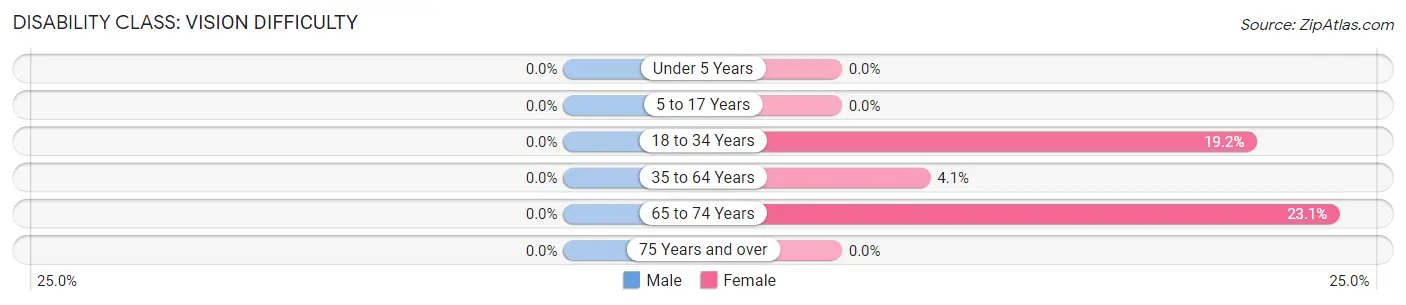
| Age Bracket | Male | Female |
| Under 5 Years | 0 (0.0%) | 0 (0.0%) |
| 5 to 17 Years | 0 (0.0%) | 0 (0.0%) |
| 18 to 34 Years | 0 (0.0%) | 5 (19.2%) |
| 35 to 64 Years | 0 (0.0%) | 3 (4.1%) |
| 65 to 74 Years | 0 (0.0%) | 3 (23.1%) |
| 75 Years and over | 0 (0.0%) | 0 (0.0%) |
Disability Class: Cognitive Difficulty
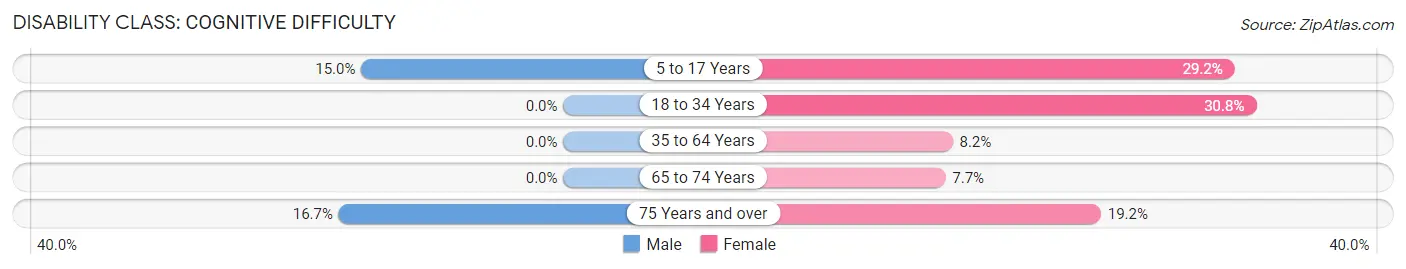
| Age Bracket | Male | Female |
| 5 to 17 Years | 6 (15.0%) | 7 (29.2%) |
| 18 to 34 Years | 0 (0.0%) | 8 (30.8%) |
| 35 to 64 Years | 0 (0.0%) | 6 (8.2%) |
| 65 to 74 Years | 0 (0.0%) | 1 (7.7%) |
| 75 Years and over | 2 (16.7%) | 5 (19.2%) |
Disability Class: Ambulatory Difficulty
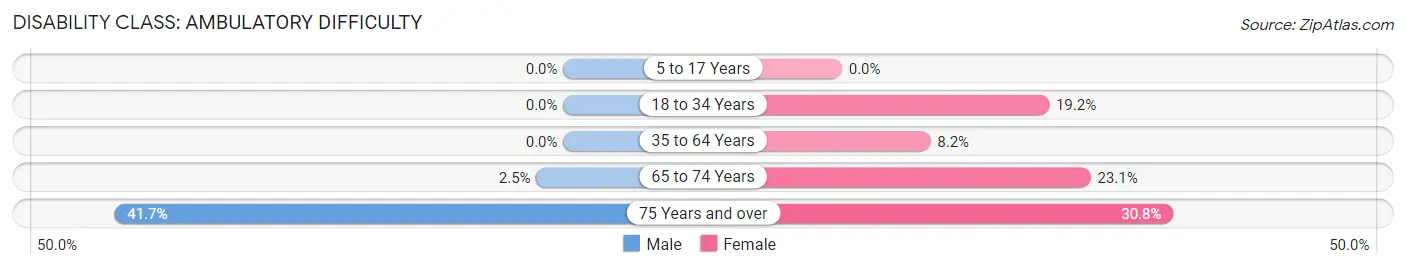
| Age Bracket | Male | Female |
| 5 to 17 Years | 0 (0.0%) | 0 (0.0%) |
| 18 to 34 Years | 0 (0.0%) | 5 (19.2%) |
| 35 to 64 Years | 0 (0.0%) | 6 (8.2%) |
| 65 to 74 Years | 1 (2.5%) | 3 (23.1%) |
| 75 Years and over | 5 (41.7%) | 8 (30.8%) |
Disability Class: Self-Care Difficulty
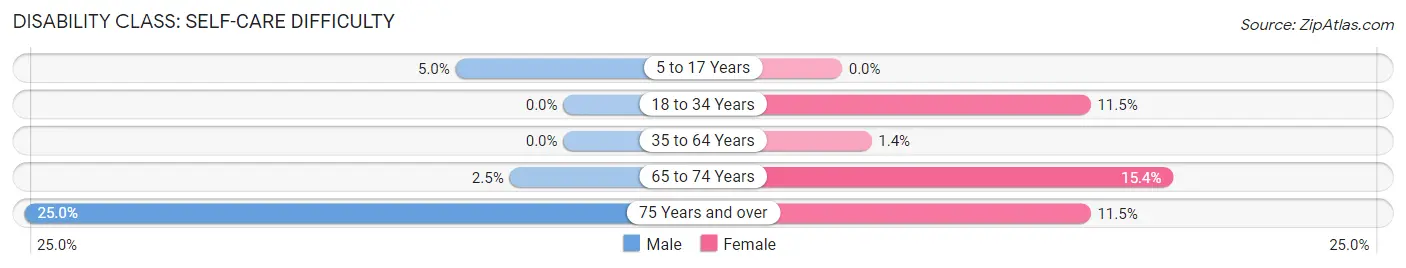
| Age Bracket | Male | Female |
| 5 to 17 Years | 2 (5.0%) | 0 (0.0%) |
| 18 to 34 Years | 0 (0.0%) | 3 (11.5%) |
| 35 to 64 Years | 0 (0.0%) | 1 (1.4%) |
| 65 to 74 Years | 1 (2.5%) | 2 (15.4%) |
| 75 Years and over | 3 (25.0%) | 3 (11.5%) |
Technology Access in Peterson
Computing Device Access in Peterson
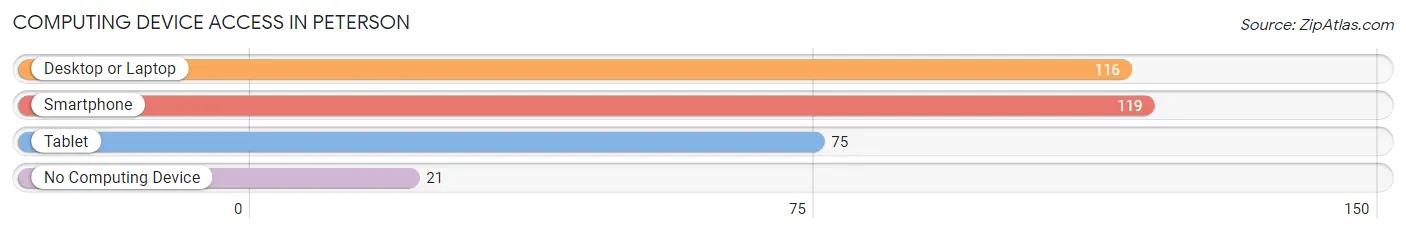
| Device Type | # Households | % Households |
| Desktop or Laptop | 116 | 72.5% |
| Smartphone | 119 | 74.4% |
| Tablet | 75 | 46.9% |
| No Computing Device | 21 | 13.1% |
| Total | 160 | 100.0% |
Internet Access in Peterson
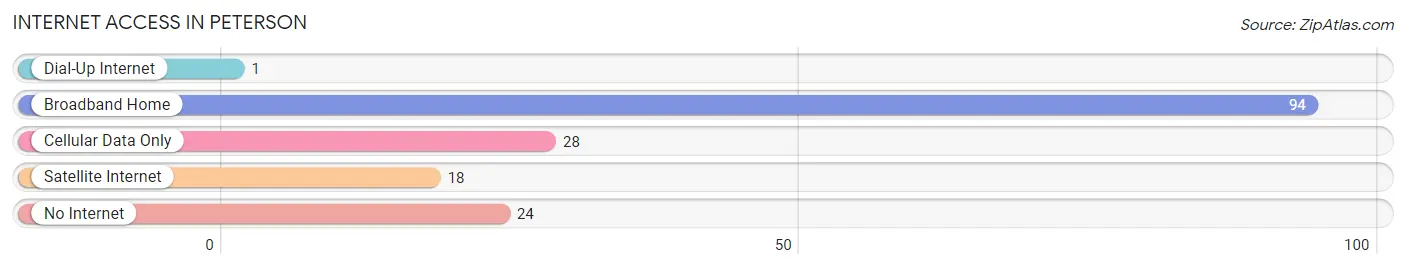
| Internet Type | # Households | % Households |
| Dial-Up Internet | 1 | 0.6% |
| Broadband Home | 94 | 58.8% |
| Cellular Data Only | 28 | 17.5% |
| Satellite Internet | 18 | 11.3% |
| No Internet | 24 | 15.0% |
| Total | 160 | 100.0% |
Peterson Summary
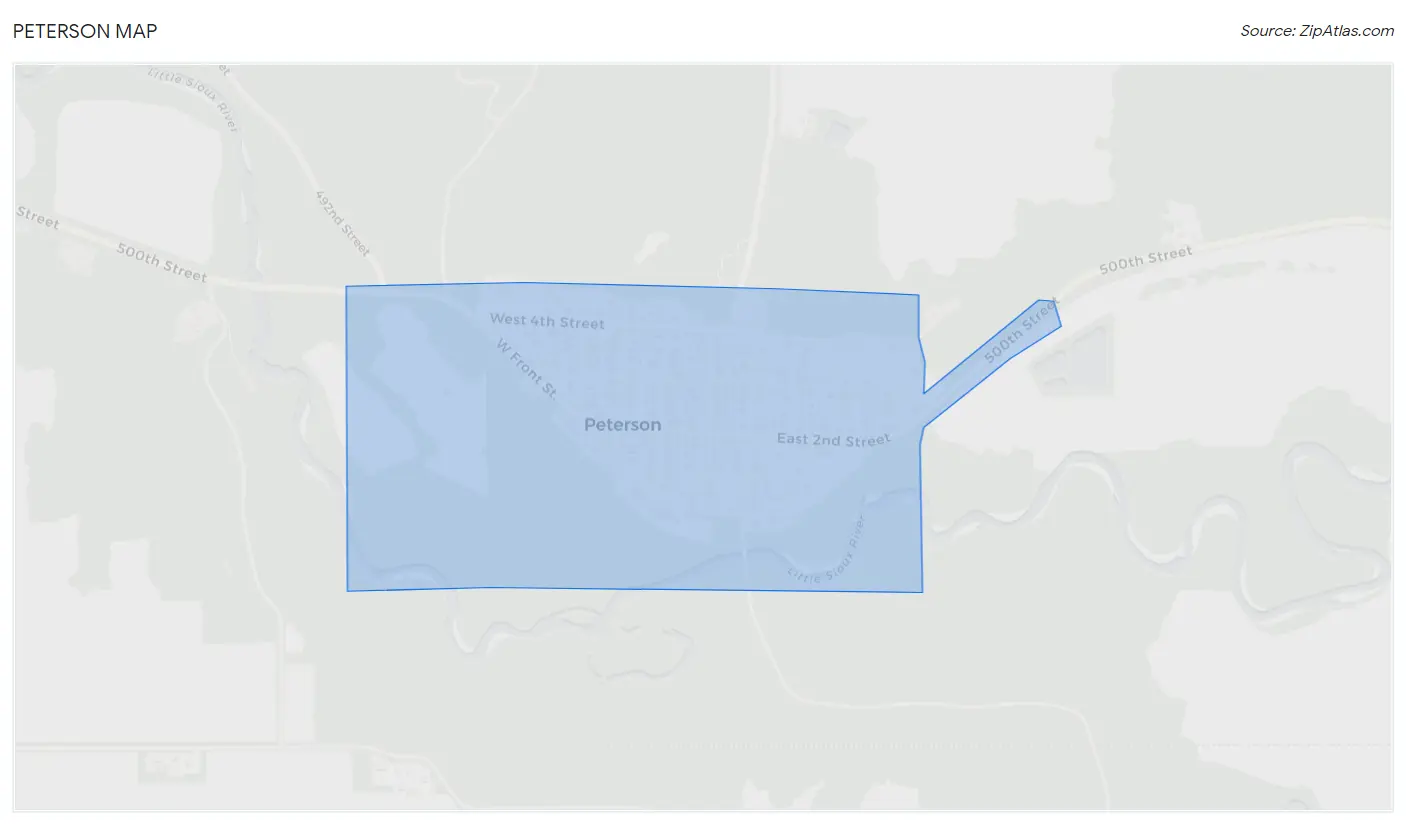
Peterson, Iowa is a small town located in Clay County in the northwest corner of the state. It is situated on the banks of the Little Sioux River and is home to a population of just over 500 people. The town was founded in 1881 and has a rich history of farming, industry, and small-town life.
Geographically, Peterson is located in the Loess Hills region of Iowa. The Loess Hills are a series of rolling hills that were formed by wind-blown silt deposits from the last ice age. The hills are characterized by steep slopes and deep ravines, and they provide a unique landscape for the town. The Little Sioux River runs through the town, providing a source of recreation and a scenic backdrop.
The economy of Peterson is largely based on agriculture. The town is home to several farms, and the surrounding area is known for its production of corn, soybeans, and other crops. In addition, Peterson is home to several small businesses, including a grocery store, a hardware store, and a few restaurants. The town also has a small industrial park, which houses a few manufacturing companies.
The demographics of Peterson are largely homogeneous. The majority of the population is white, with a small percentage of African Americans and Hispanics. The median household income is slightly below the state average, and the poverty rate is slightly higher than the state average. The town is served by the Clay County School District, which provides education for students from kindergarten through twelfth grade.
Peterson is a small town with a rich history and a unique landscape. It is a great place to live and work, and it offers a variety of activities and amenities for its residents. The town is a great place to raise a family, and it is a great place to visit for those looking for a quiet, rural getaway.
Common Questions
What is Per Capita Income in Peterson?
Per Capita income in Peterson is $36,312.
What is the Median Family Income in Peterson?
Median Family Income in Peterson is $74,583.
What is the Median Household income in Peterson?
Median Household Income in Peterson is $68,750.
What is Income or Wage Gap in Peterson?
Income or Wage Gap in Peterson is 48.7%.
Women in Peterson earn 51.3 cents for every dollar earned by a man.
What is Inequality or Gini Index in Peterson?
Inequality or Gini Index in Peterson is 0.38.
What is the Total Population of Peterson?
Total Population of Peterson is 382.
What is the Total Male Population of Peterson?
Total Male Population of Peterson is 202.
What is the Total Female Population of Peterson?
Total Female Population of Peterson is 180.
What is the Ratio of Males per 100 Females in Peterson?
There are 112.22 Males per 100 Females in Peterson.
What is the Ratio of Females per 100 Males in Peterson?
There are 89.11 Females per 100 Males in Peterson.
What is the Median Population Age in Peterson?
Median Population Age in Peterson is 38.8 Years.
What is the Average Family Size in Peterson
Average Family Size in Peterson is 3.2 People.
What is the Average Household Size in Peterson
Average Household Size in Peterson is 2.4 People.
How Large is the Labor Force in Peterson?
There are 200 People in the Labor Forcein in Peterson.
What is the Percentage of People in the Labor Force in Peterson?
68.3% of People are in the Labor Force in Peterson.
What is the Unemployment Rate in Peterson?
Unemployment Rate in Peterson is 3.0%.