Odebolt, IA
Odebolt Map
Odebolt Overview
873
TOTAL POPULATION
439
MALE POPULATION
434
FEMALE POPULATION
101.15
MALES / 100 FEMALES
98.86
FEMALES / 100 MALES
52.0
MEDIAN AGE
2.7
AVG FAMILY SIZE
2.2
AVG HOUSEHOLD SIZE
$37,587
PER CAPITA INCOME
$72,143
AVG FAMILY INCOME
$65,417
AVG HOUSEHOLD INCOME
37.5%
WAGE / INCOME GAP [ % ]
62.5¢/ $1
WAGE / INCOME GAP [ $ ]
0.50
INEQUALITY / GINI INDEX
393
LABOR FORCE [ PEOPLE ]
57.4%
PERCENT IN LABOR FORCE
3.8%
UNEMPLOYMENT RATE
Odebolt Zip Codes
Odebolt Area Codes
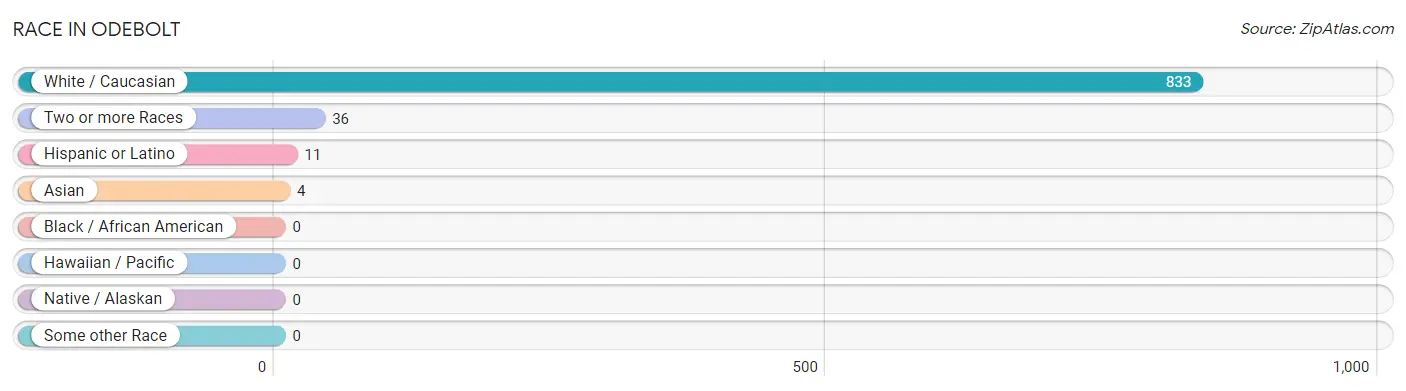
Race in Odebolt
The most populous races in Odebolt are White / Caucasian (833 | 95.4%), Two or more Races (36 | 4.1%), and Hispanic or Latino (11 | 1.3%).
| Race | # Population | % Population |
| Asian | 4 | 0.5% |
| Black / African American | 0 | 0.0% |
| Hawaiian / Pacific | 0 | 0.0% |
| Hispanic or Latino | 11 | 1.3% |
| Native / Alaskan | 0 | 0.0% |
| White / Caucasian | 833 | 95.4% |
| Two or more Races | 36 | 4.1% |
| Some other Race | 0 | 0.0% |
| Total | 873 | 100.0% |
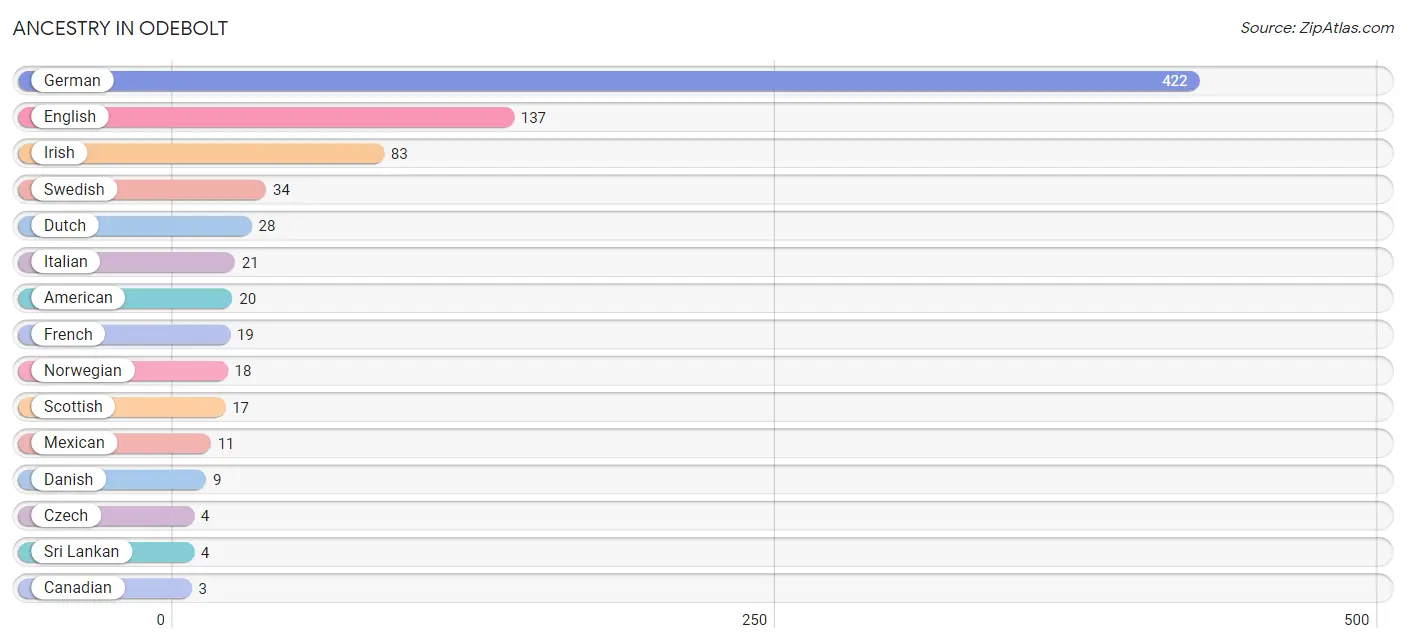
Ancestry in Odebolt
The most populous ancestries reported in Odebolt are German (422 | 48.3%), English (137 | 15.7%), Irish (83 | 9.5%), Swedish (34 | 3.9%), and Dutch (28 | 3.2%), together accounting for 80.6% of all Odebolt residents.
| Ancestry | # Population | % Population |
| American | 20 | 2.3% |
| Canadian | 3 | 0.3% |
| Czech | 4 | 0.5% |
| Danish | 9 | 1.0% |
| Dutch | 28 | 3.2% |
| English | 137 | 15.7% |
| French | 19 | 2.2% |
| German | 422 | 48.3% |
| Greek | 3 | 0.3% |
| Irish | 83 | 9.5% |
| Italian | 21 | 2.4% |
| Mexican | 11 | 1.3% |
| Northern European | 3 | 0.3% |
| Norwegian | 18 | 2.1% |
| Portuguese | 3 | 0.3% |
| Scottish | 17 | 1.9% |
| Slovak | 2 | 0.2% |
| Sri Lankan | 4 | 0.5% |
| Swedish | 34 | 3.9% |
| Swiss | 1 | 0.1% | View All 20 Rows |
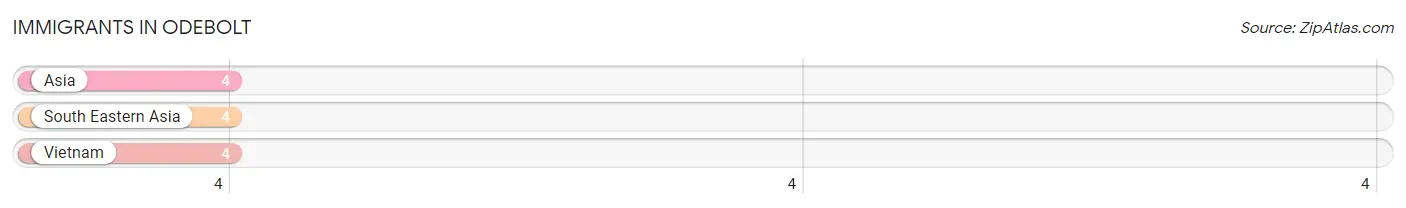
Immigrants in Odebolt
The most numerous immigrant groups reported in Odebolt came from Asia (4 | 0.5%), South Eastern Asia (4 | 0.5%), and Vietnam (4 | 0.5%), together accounting for 1.4% of all Odebolt residents.
| Immigration Origin | # Population | % Population |
| Asia | 4 | 0.5% |
| South Eastern Asia | 4 | 0.5% |
| Vietnam | 4 | 0.5% | View All 3 Rows |
Sex and Age in Odebolt
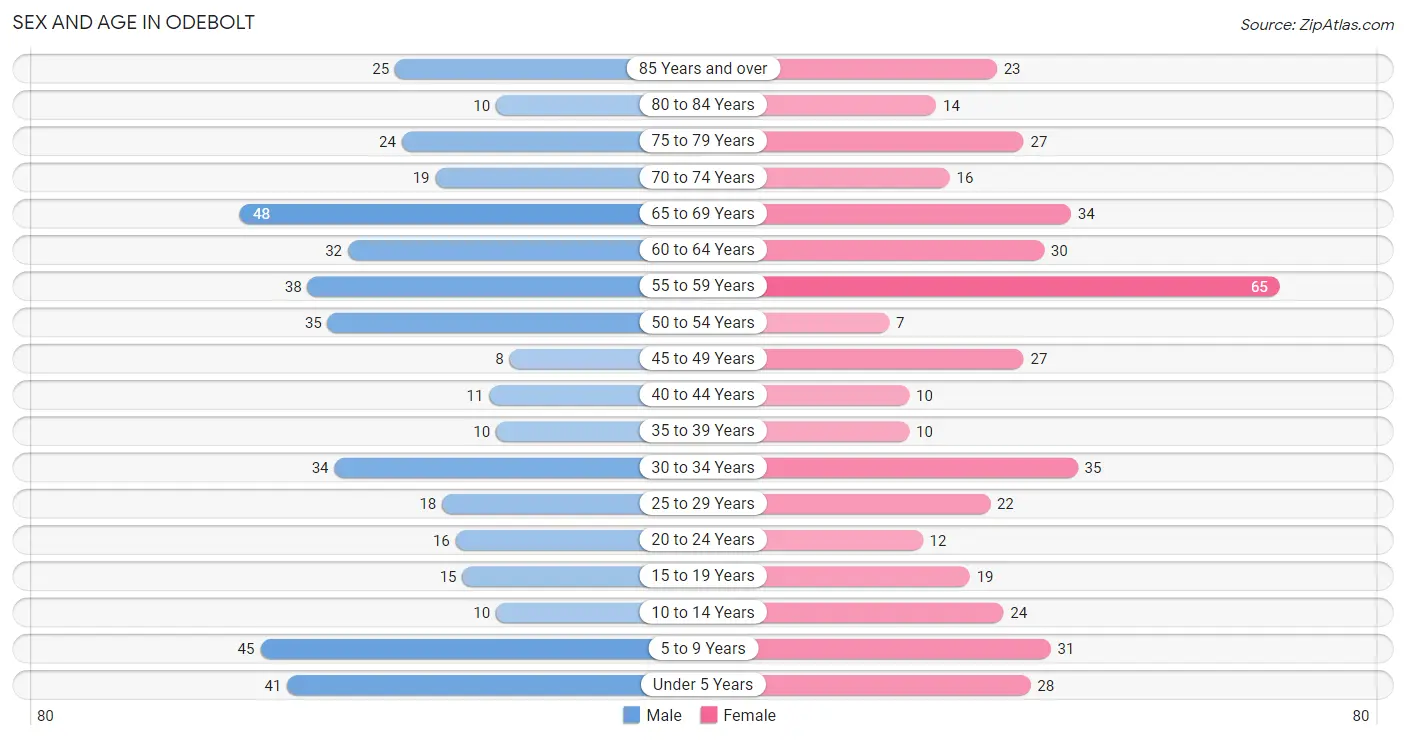
Sex and Age in Odebolt
The most populous age groups in Odebolt are 65 to 69 Years (48 | 10.9%) for men and 55 to 59 Years (65 | 15.0%) for women.
| Age Bracket | Male | Female |
| Under 5 Years | 41 (9.3%) | 28 (6.5%) |
| 5 to 9 Years | 45 (10.2%) | 31 (7.1%) |
| 10 to 14 Years | 10 (2.3%) | 24 (5.5%) |
| 15 to 19 Years | 15 (3.4%) | 19 (4.4%) |
| 20 to 24 Years | 16 (3.6%) | 12 (2.8%) |
| 25 to 29 Years | 18 (4.1%) | 22 (5.1%) |
| 30 to 34 Years | 34 (7.7%) | 35 (8.1%) |
| 35 to 39 Years | 10 (2.3%) | 10 (2.3%) |
| 40 to 44 Years | 11 (2.5%) | 10 (2.3%) |
| 45 to 49 Years | 8 (1.8%) | 27 (6.2%) |
| 50 to 54 Years | 35 (8.0%) | 7 (1.6%) |
| 55 to 59 Years | 38 (8.7%) | 65 (15.0%) |
| 60 to 64 Years | 32 (7.3%) | 30 (6.9%) |
| 65 to 69 Years | 48 (10.9%) | 34 (7.8%) |
| 70 to 74 Years | 19 (4.3%) | 16 (3.7%) |
| 75 to 79 Years | 24 (5.5%) | 27 (6.2%) |
| 80 to 84 Years | 10 (2.3%) | 14 (3.2%) |
| 85 Years and over | 25 (5.7%) | 23 (5.3%) |
| Total | 439 (100.0%) | 434 (100.0%) |
Families and Households in Odebolt
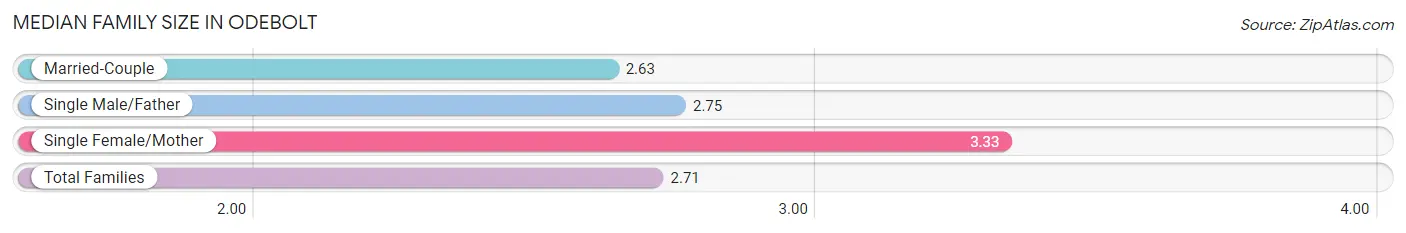
Median Family Size in Odebolt
The median family size in Odebolt is 2.71 persons per family, with single female/mother families (27 | 10.5%) accounting for the largest median family size of 3.33 persons per family. On the other hand, married-couple families (219 | 84.9%) represent the smallest median family size with 2.63 persons per family.
| Family Type | # Families | Family Size |
| Married-Couple | 219 (84.9%) | 2.63 |
| Single Male/Father | 12 (4.6%) | 2.75 |
| Single Female/Mother | 27 (10.5%) | 3.33 |
| Total Families | 258 (100.0%) | 2.71 |
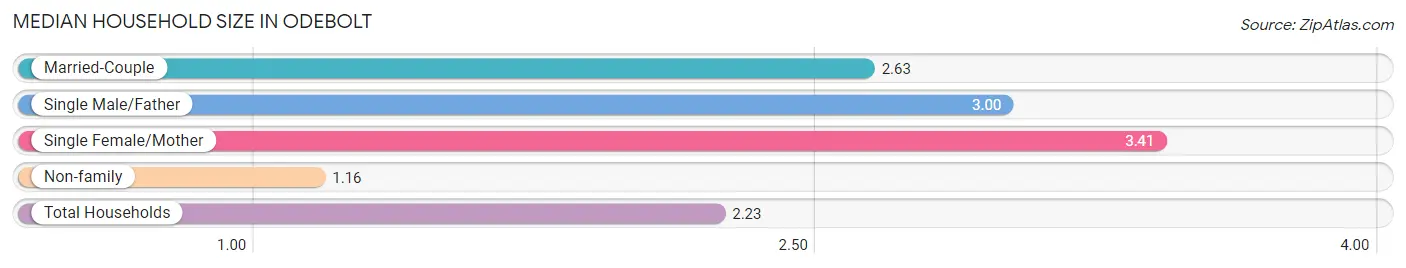
Median Household Size in Odebolt
The median household size in Odebolt is 2.23 persons per household, with single female/mother households (27 | 7.1%) accounting for the largest median household size of 3.41 persons per household. non-family households (120 | 31.8%) represent the smallest median household size with 1.16 persons per household.
| Household Type | # Households | Household Size |
| Married-Couple | 219 (57.9%) | 2.63 |
| Single Male/Father | 12 (3.2%) | 3.00 |
| Single Female/Mother | 27 (7.1%) | 3.41 |
| Non-family | 120 (31.8%) | 1.16 |
| Total Households | 378 (100.0%) | 2.23 |
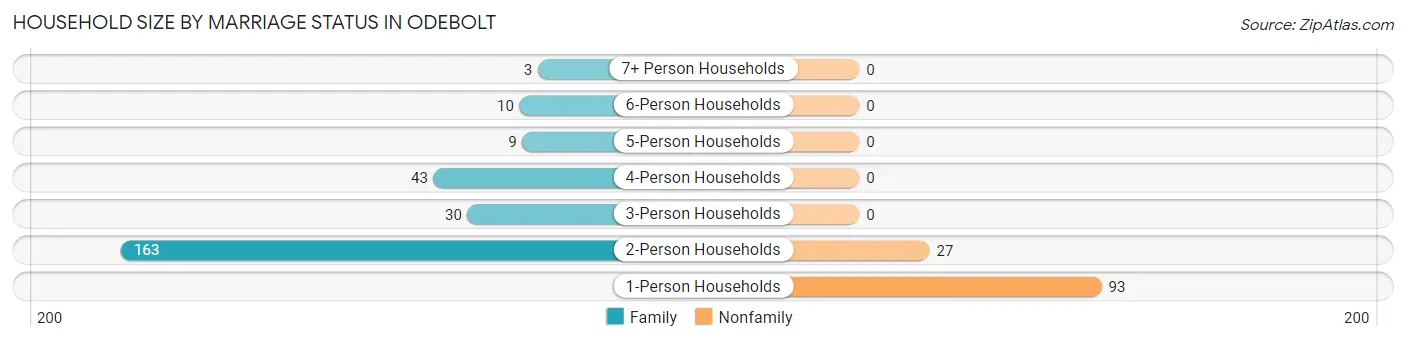
Household Size by Marriage Status in Odebolt
Out of a total of 378 households in Odebolt, 258 (68.2%) are family households, while 120 (31.8%) are nonfamily households. The most numerous type of family households are 2-person households, comprising 163, and the most common type of nonfamily households are 1-person households, comprising 93.
| Household Size | Family Households | Nonfamily Households |
| 1-Person Households | - | 93 (24.6%) |
| 2-Person Households | 163 (43.1%) | 27 (7.1%) |
| 3-Person Households | 30 (7.9%) | 0 (0.0%) |
| 4-Person Households | 43 (11.4%) | 0 (0.0%) |
| 5-Person Households | 9 (2.4%) | 0 (0.0%) |
| 6-Person Households | 10 (2.6%) | 0 (0.0%) |
| 7+ Person Households | 3 (0.8%) | 0 (0.0%) |
| Total | 258 (68.2%) | 120 (31.8%) |
Female Fertility in Odebolt
Fertility by Age in Odebolt
Average fertility rate in Odebolt is 95.0 births per 1,000 women. Women in the age bracket of 20 to 34 years have the highest fertility rate with 145.0 births per 1,000 women. Women in the age bracket of 20 to 34 years acount for 76.9% of all women with births.
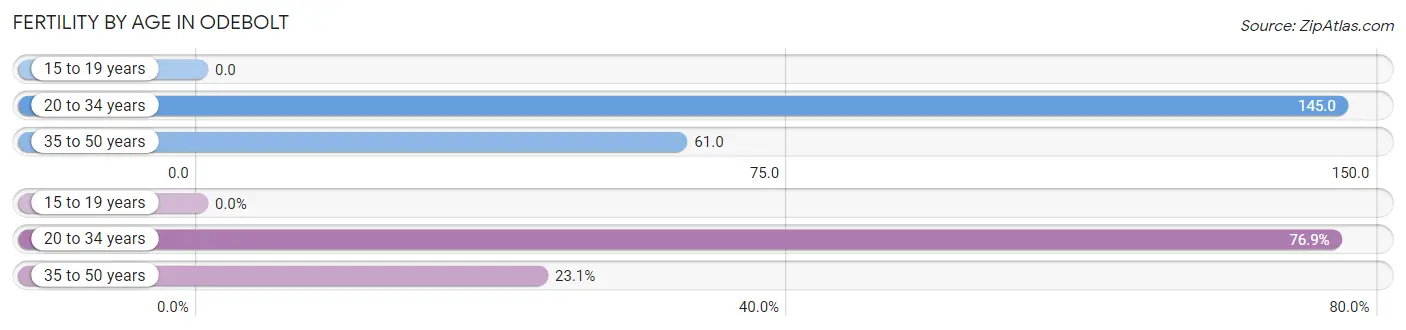
| Age Bracket | Women with Births | Births / 1,000 Women |
| 15 to 19 years | 0 (0.0%) | 0.0 |
| 20 to 34 years | 10 (76.9%) | 145.0 |
| 35 to 50 years | 3 (23.1%) | 61.0 |
| Total | 13 (100.0%) | 95.0 |
Fertility by Age by Marriage Status in Odebolt
76.9% of women with births (13) in Odebolt are married. The highest percentage of unmarried women with births falls into 20 to 34 years age bracket with 30.0% of them unmarried at the time of birth, while the lowest percentage of unmarried women with births belong to 35 to 50 years age bracket with 0.0% of them unmarried.
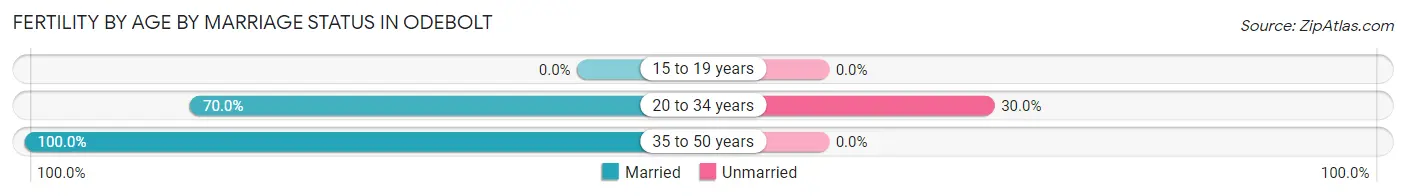
| Age Bracket | Married | Unmarried |
| 15 to 19 years | 0 (0.0%) | 0 (0.0%) |
| 20 to 34 years | 7 (70.0%) | 3 (30.0%) |
| 35 to 50 years | 3 (100.0%) | 0 (0.0%) |
| Total | 10 (76.9%) | 3 (23.1%) |
Fertility by Education in Odebolt
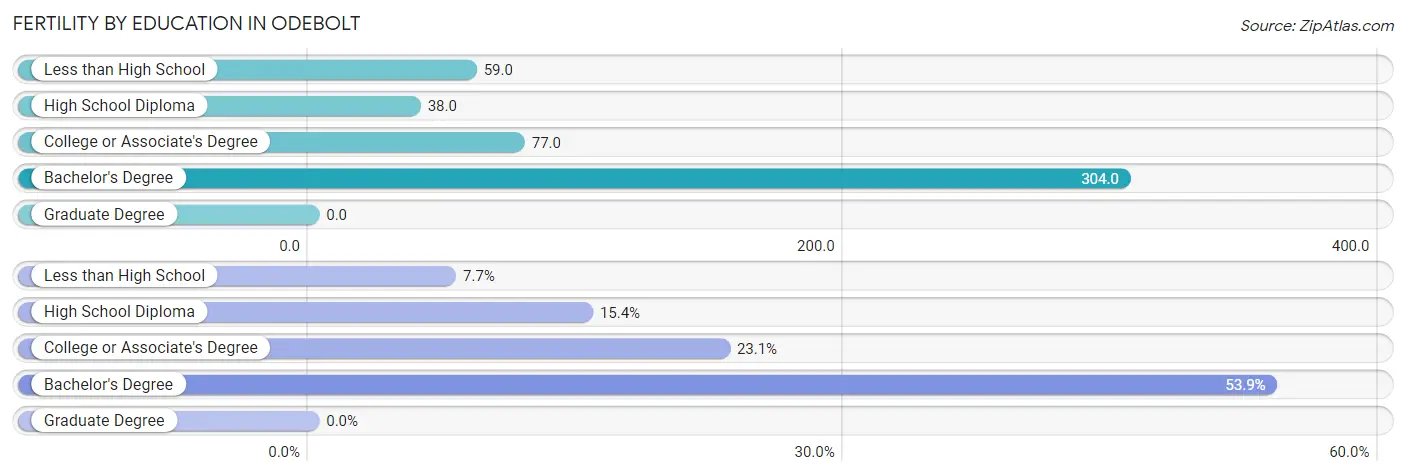
| Educational Attainment | Women with Births | Births / 1,000 Women |
| Less than High School | 1 (7.7%) | 59.0 |
| High School Diploma | 2 (15.4%) | 38.0 |
| College or Associate's Degree | 3 (23.1%) | 77.0 |
| Bachelor's Degree | 7 (53.8%) | 304.0 |
| Graduate Degree | 0 (0.0%) | 0.0 |
| Total | 13 (100.0%) | 95.0 |
Fertility by Education by Marriage Status in Odebolt
23.1% of women with births in Odebolt are unmarried. Women with the educational attainment of college or associate's degree are most likely to be married with 100.0% of them married at childbirth, while women with the educational attainment of less than high school are least likely to be married with 100.0% of them unmarried at childbirth.
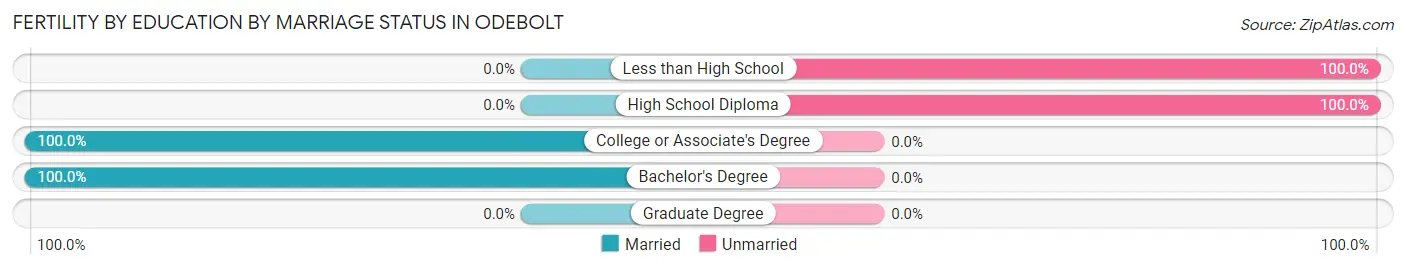
| Educational Attainment | Married | Unmarried |
| Less than High School | 0 (0.0%) | 1 (100.0%) |
| High School Diploma | 0 (0.0%) | 2 (100.0%) |
| College or Associate's Degree | 3 (100.0%) | 0 (0.0%) |
| Bachelor's Degree | 7 (100.0%) | 0 (0.0%) |
| Graduate Degree | 0 (0.0%) | 0 (0.0%) |
| Total | 10 (76.9%) | 3 (23.1%) |
Income in Odebolt
Income Overview in Odebolt
Per Capita Income in Odebolt is $37,587, while median incomes of families and households are $72,143 and $65,417 respectively.
| Characteristic | Number | Measure |
| Per Capita Income | 873 | $37,587 |
| Median Family Income | 258 | $72,143 |
| Mean Family Income | 258 | $102,352 |
| Median Household Income | 378 | $65,417 |
| Mean Household Income | 378 | $86,264 |
| Income Deficit | 258 | $0 |
| Wage / Income Gap (%) | 873 | 37.50% |
| Wage / Income Gap ($) | 873 | 62.50¢ per $1 |
| Gini / Inequality Index | 873 | 0.50 |
Earnings by Sex in Odebolt
Average Earnings in Odebolt are $40,667, $53,750 for men and $33,594 for women, a difference of 37.5%.
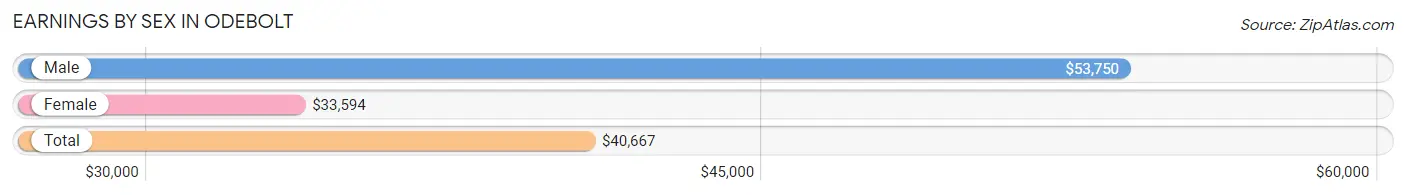
| Sex | Number | Average Earnings |
| Male | 217 (50.9%) | $53,750 |
| Female | 209 (49.1%) | $33,594 |
| Total | 426 (100.0%) | $40,667 |
Earnings by Sex by Income Bracket in Odebolt
The most common earnings brackets in Odebolt are $75,000 to $99,999 for men (31 | 14.3%) and $35,000 to $39,999 for women (34 | 16.3%).
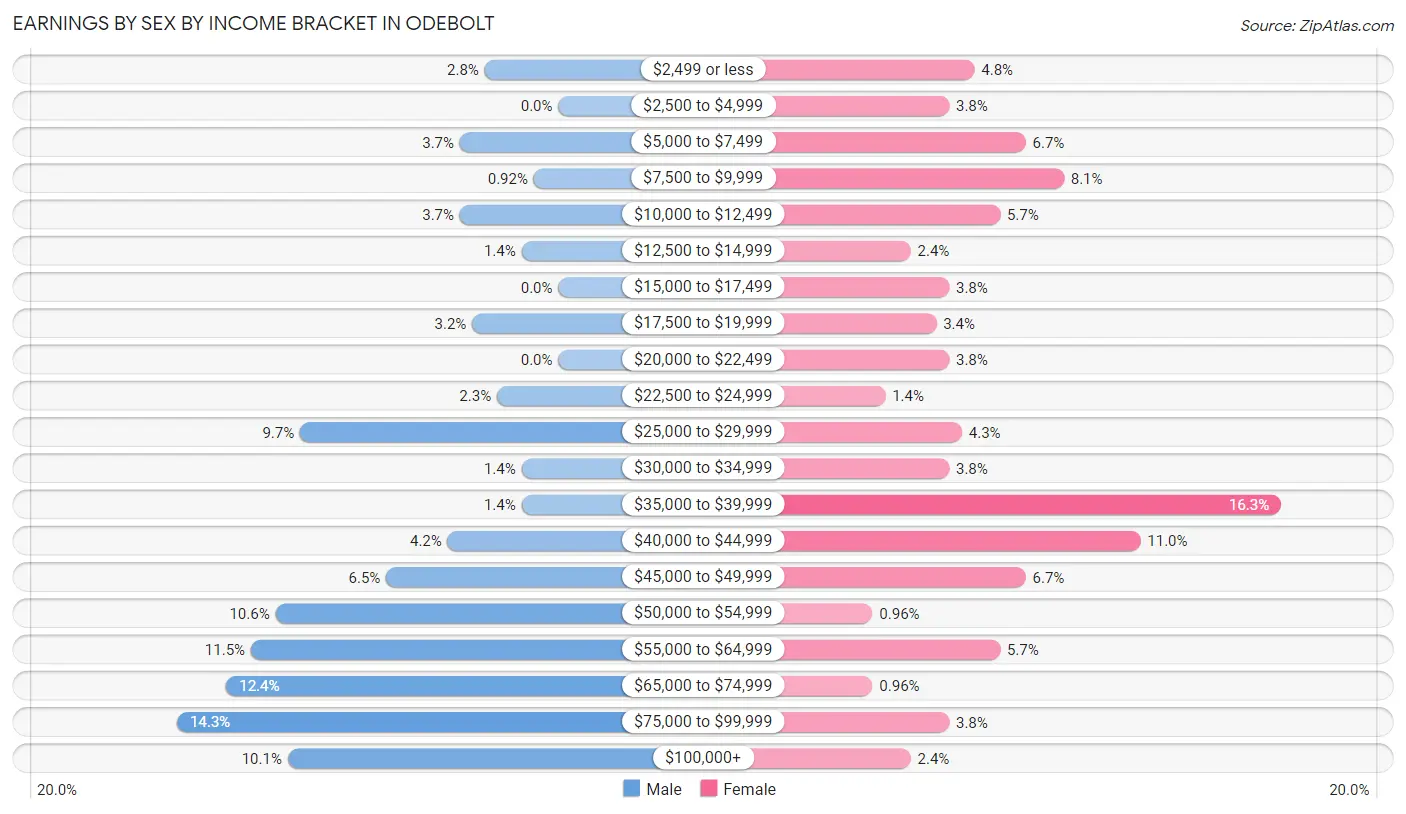
| Income | Male | Female |
| $2,499 or less | 6 (2.8%) | 10 (4.8%) |
| $2,500 to $4,999 | 0 (0.0%) | 8 (3.8%) |
| $5,000 to $7,499 | 8 (3.7%) | 14 (6.7%) |
| $7,500 to $9,999 | 2 (0.9%) | 17 (8.1%) |
| $10,000 to $12,499 | 8 (3.7%) | 12 (5.7%) |
| $12,500 to $14,999 | 3 (1.4%) | 5 (2.4%) |
| $15,000 to $17,499 | 0 (0.0%) | 8 (3.8%) |
| $17,500 to $19,999 | 7 (3.2%) | 7 (3.4%) |
| $20,000 to $22,499 | 0 (0.0%) | 8 (3.8%) |
| $22,500 to $24,999 | 5 (2.3%) | 3 (1.4%) |
| $25,000 to $29,999 | 21 (9.7%) | 9 (4.3%) |
| $30,000 to $34,999 | 3 (1.4%) | 8 (3.8%) |
| $35,000 to $39,999 | 3 (1.4%) | 34 (16.3%) |
| $40,000 to $44,999 | 9 (4.2%) | 23 (11.0%) |
| $45,000 to $49,999 | 14 (6.5%) | 14 (6.7%) |
| $50,000 to $54,999 | 23 (10.6%) | 2 (1.0%) |
| $55,000 to $64,999 | 25 (11.5%) | 12 (5.7%) |
| $65,000 to $74,999 | 27 (12.4%) | 2 (1.0%) |
| $75,000 to $99,999 | 31 (14.3%) | 8 (3.8%) |
| $100,000+ | 22 (10.1%) | 5 (2.4%) |
| Total | 217 (100.0%) | 209 (100.0%) |
Earnings by Sex by Educational Attainment in Odebolt
Average earnings in Odebolt are $52,857 for men and $35,543 for women, a difference of 32.8%. Men with an educational attainment of high school diploma enjoy the highest average annual earnings of $62,813, while those with less than high school education earn the least with $18,125. Women with an educational attainment of graduate degree earn the most with the average annual earnings of $65,625, while those with high school diploma education have the smallest earnings of $28,750.
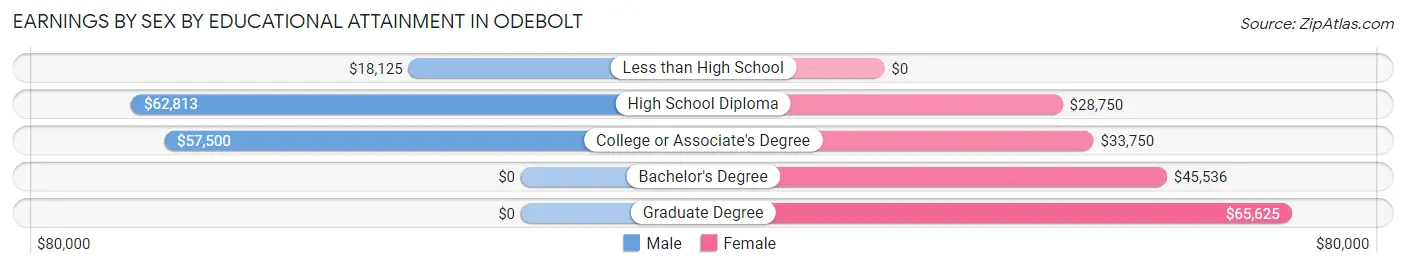
| Educational Attainment | Male Income | Female Income |
| Less than High School | $18,125 | $0 |
| High School Diploma | $62,813 | $28,750 |
| College or Associate's Degree | $57,500 | $33,750 |
| Bachelor's Degree | - | - |
| Graduate Degree | - | - |
| Total | $52,857 | $35,543 |
Family Income in Odebolt
Family Income Brackets in Odebolt
According to the Odebolt family income data, there are 65 families falling into the $50,000 to $74,999 income range, which is the most common income bracket and makes up 25.2% of all families. Conversely, the $10,000 to $14,999 income bracket is the least frequent group with only 2 families (0.8%) belonging to this category.
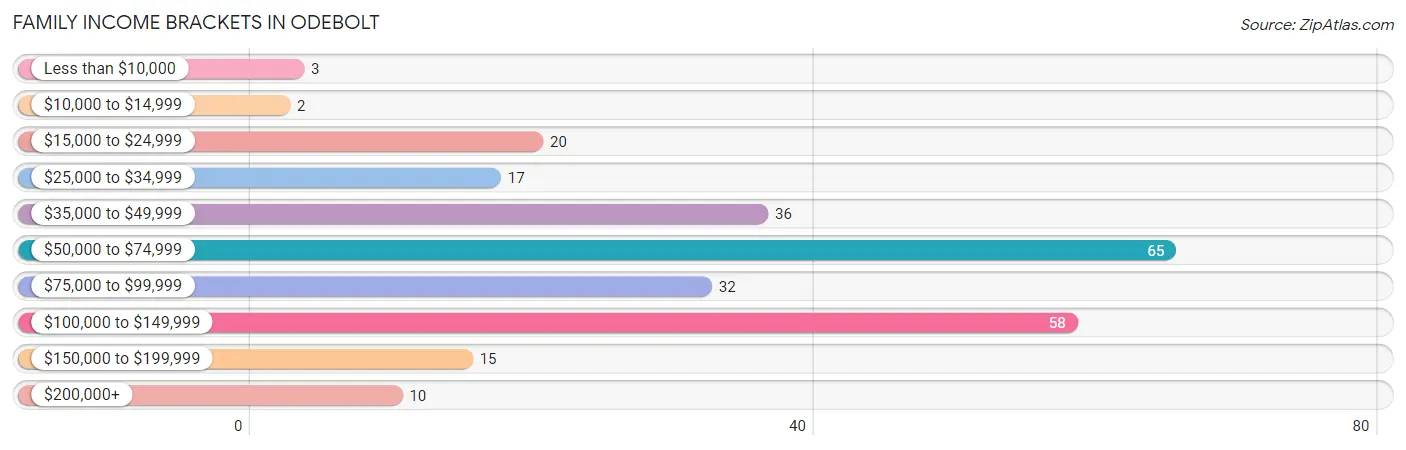
| Income Bracket | # Families | % Families |
| Less than $10,000 | 3 | 1.2% |
| $10,000 to $14,999 | 2 | 0.8% |
| $15,000 to $24,999 | 20 | 7.8% |
| $25,000 to $34,999 | 17 | 6.6% |
| $35,000 to $49,999 | 36 | 14.0% |
| $50,000 to $74,999 | 65 | 25.2% |
| $75,000 to $99,999 | 32 | 12.4% |
| $100,000 to $149,999 | 58 | 22.5% |
| $150,000 to $199,999 | 15 | 5.8% |
| $200,000+ | 10 | 3.9% |
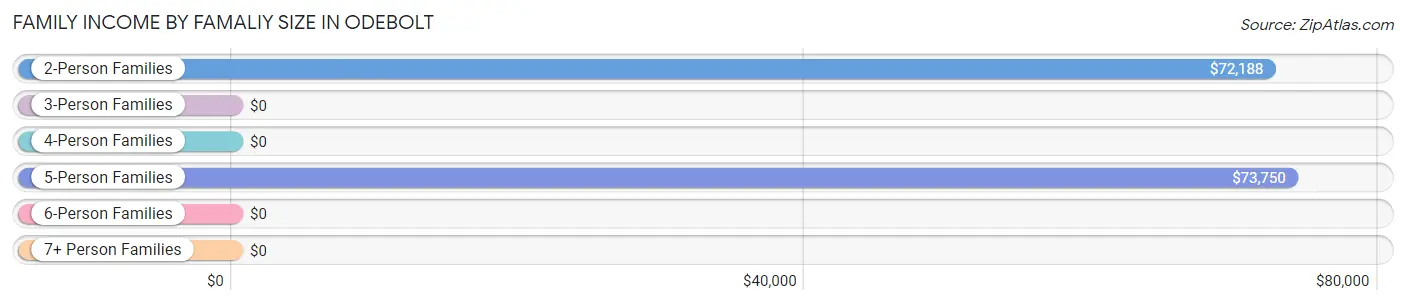
Family Income by Famaliy Size in Odebolt
5-person families (9 | 3.5%) account for the highest median family income in Odebolt with $73,750 per family, while 2-person families (163 | 63.2%) have the highest median income of $36,094 per family member.
| Income Bracket | # Families | Median Income |
| 2-Person Families | 163 (63.2%) | $72,188 |
| 3-Person Families | 35 (13.6%) | $0 |
| 4-Person Families | 38 (14.7%) | $0 |
| 5-Person Families | 9 (3.5%) | $73,750 |
| 6-Person Families | 10 (3.9%) | $0 |
| 7+ Person Families | 3 (1.2%) | $0 |
| Total | 258 (100.0%) | $72,143 |
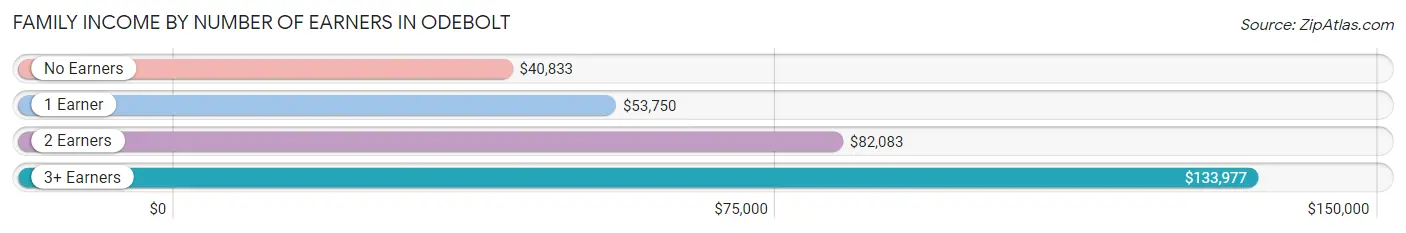
Family Income by Number of Earners in Odebolt
The median family income in Odebolt is $72,143, with families comprising 3+ earners (19) having the highest median family income of $133,977, while families with no earners (64) have the lowest median family income of $40,833, accounting for 7.4% and 24.8% of families, respectively.
| Number of Earners | # Families | Median Income |
| No Earners | 64 (24.8%) | $40,833 |
| 1 Earner | 62 (24.0%) | $53,750 |
| 2 Earners | 113 (43.8%) | $82,083 |
| 3+ Earners | 19 (7.4%) | $133,977 |
| Total | 258 (100.0%) | $72,143 |
Household Income in Odebolt
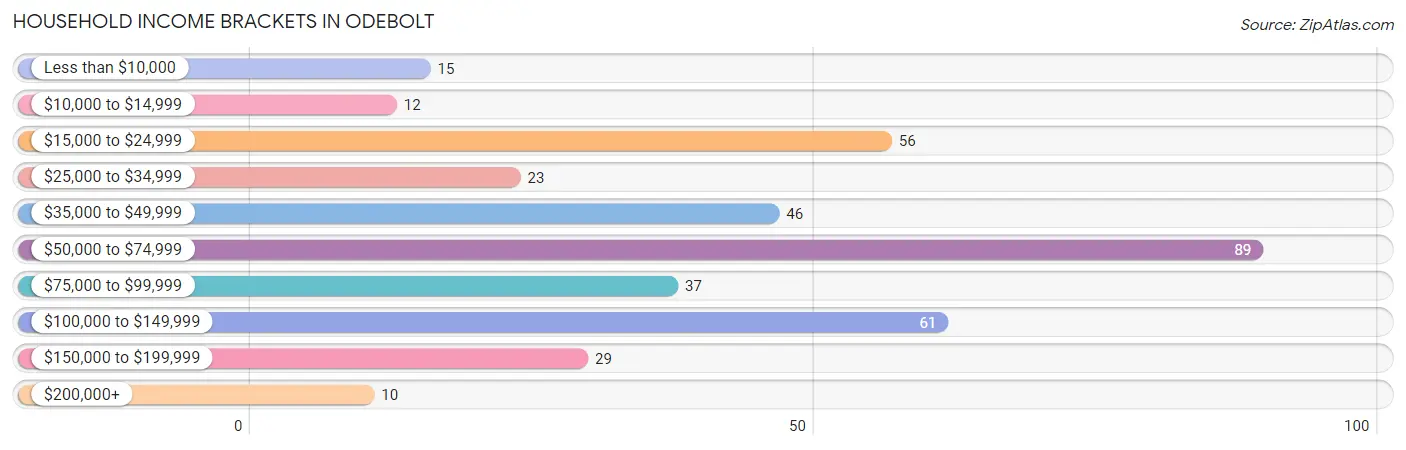
Household Income Brackets in Odebolt
With 89 households falling in the category, the $50,000 to $74,999 income range is the most frequent in Odebolt, accounting for 23.5% of all households. In contrast, only 10 households (2.6%) fall into the $200,000+ income bracket, making it the least populous group.
| Income Bracket | # Households | % Households |
| Less than $10,000 | 15 | 4.0% |
| $10,000 to $14,999 | 12 | 3.2% |
| $15,000 to $24,999 | 56 | 14.8% |
| $25,000 to $34,999 | 23 | 6.1% |
| $35,000 to $49,999 | 46 | 12.2% |
| $50,000 to $74,999 | 89 | 23.5% |
| $75,000 to $99,999 | 37 | 9.8% |
| $100,000 to $149,999 | 61 | 16.1% |
| $150,000 to $199,999 | 29 | 7.7% |
| $200,000+ | 10 | 2.6% |
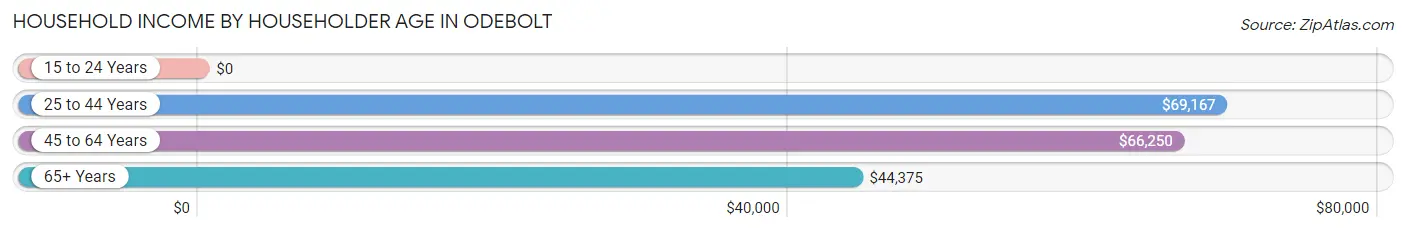
Household Income by Householder Age in Odebolt
The median household income in Odebolt is $65,417, with the highest median household income of $69,167 found in the 25 to 44 years age bracket for the primary householder. A total of 90 households (23.8%) fall into this category. Meanwhile, the 15 to 24 years age bracket for the primary householder has the lowest median household income of $0, with 13 households (3.4%) in this group.
| Income Bracket | # Households | Median Income |
| 15 to 24 Years | 13 (3.4%) | $0 |
| 25 to 44 Years | 90 (23.8%) | $69,167 |
| 45 to 64 Years | 142 (37.6%) | $66,250 |
| 65+ Years | 133 (35.2%) | $44,375 |
| Total | 378 (100.0%) | $65,417 |
Poverty in Odebolt
Income Below Poverty by Sex and Age in Odebolt
With 9.2% poverty level for males and 15.0% for females among the residents of Odebolt, 55 to 64 year old males and 5 year old females are the most vulnerable to poverty, with 17 males (24.3%) and 2 females (100.0%) in their respective age groups living below the poverty level.
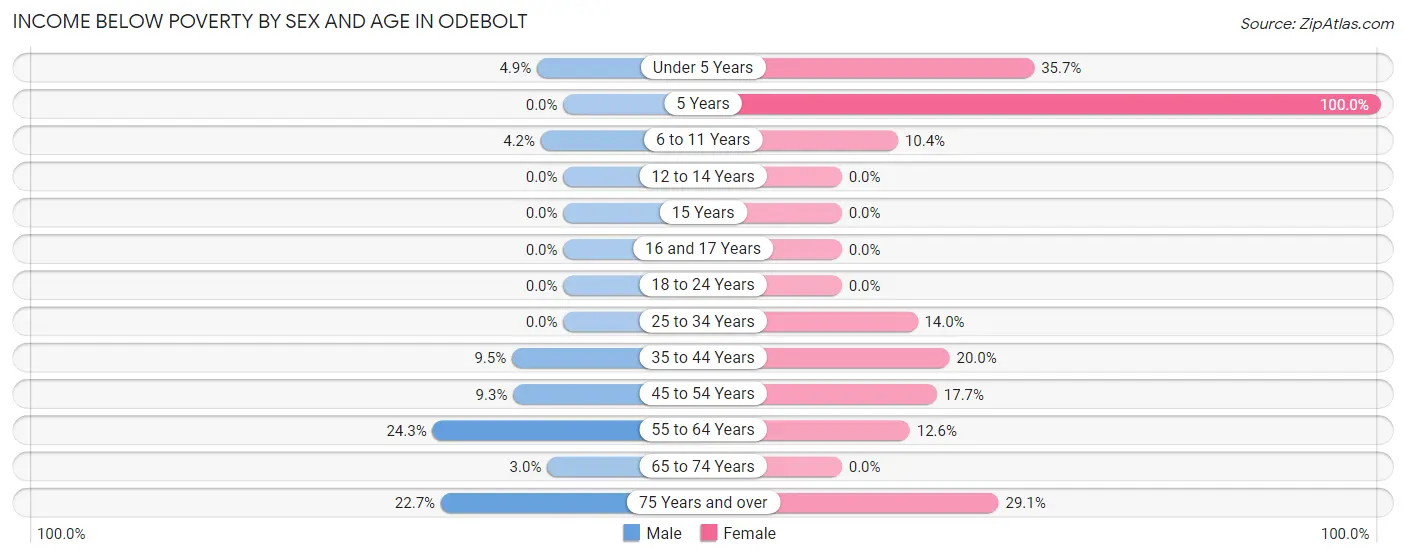
| Age Bracket | Male | Female |
| Under 5 Years | 2 (4.9%) | 10 (35.7%) |
| 5 Years | 0 (0.0%) | 2 (100.0%) |
| 6 to 11 Years | 2 (4.2%) | 5 (10.4%) |
| 12 to 14 Years | 0 (0.0%) | 0 (0.0%) |
| 15 Years | 0 (0.0%) | 0 (0.0%) |
| 16 and 17 Years | 0 (0.0%) | 0 (0.0%) |
| 18 to 24 Years | 0 (0.0%) | 0 (0.0%) |
| 25 to 34 Years | 0 (0.0%) | 8 (14.0%) |
| 35 to 44 Years | 2 (9.5%) | 4 (20.0%) |
| 45 to 54 Years | 4 (9.3%) | 6 (17.6%) |
| 55 to 64 Years | 17 (24.3%) | 12 (12.6%) |
| 65 to 74 Years | 2 (3.0%) | 0 (0.0%) |
| 75 Years and over | 10 (22.7%) | 16 (29.1%) |
| Total | 39 (9.2%) | 63 (15.0%) |
Income Above Poverty by Sex and Age in Odebolt
According to the poverty statistics in Odebolt, males aged 12 to 14 years and females aged 12 to 14 years are the age groups that are most secure financially, with 100.0% of males and 100.0% of females in these age groups living above the poverty line.
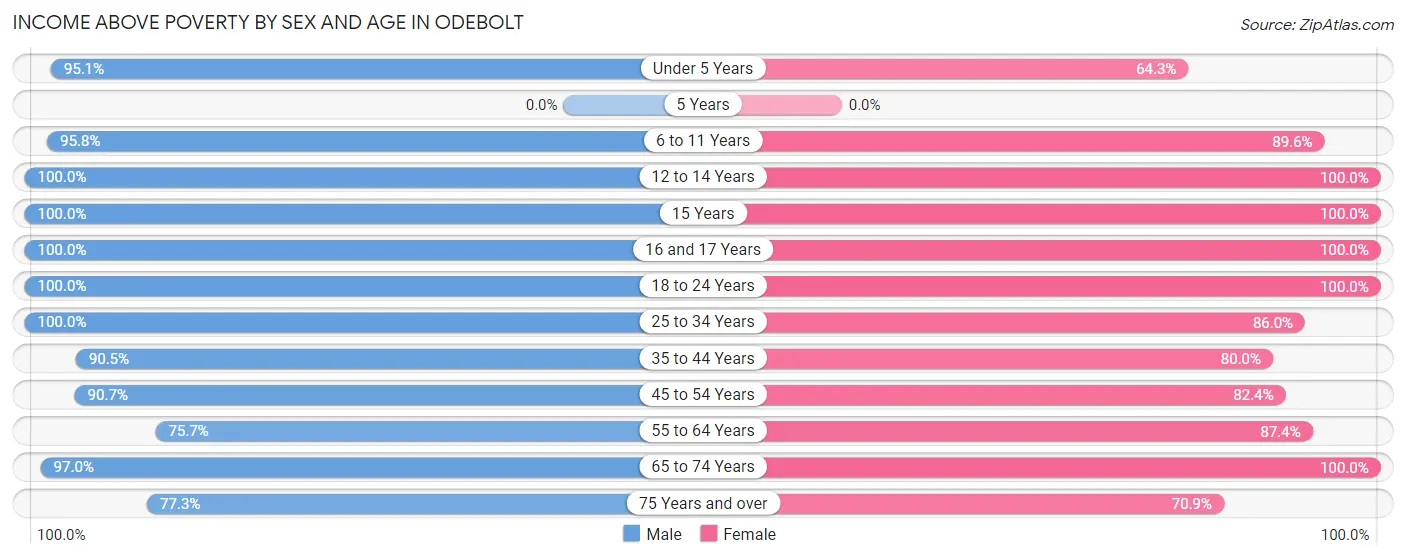
| Age Bracket | Male | Female |
| Under 5 Years | 39 (95.1%) | 18 (64.3%) |
| 5 Years | 0 (0.0%) | 0 (0.0%) |
| 6 to 11 Years | 46 (95.8%) | 43 (89.6%) |
| 12 to 14 Years | 7 (100.0%) | 5 (100.0%) |
| 15 Years | 7 (100.0%) | 2 (100.0%) |
| 16 and 17 Years | 8 (100.0%) | 4 (100.0%) |
| 18 to 24 Years | 16 (100.0%) | 25 (100.0%) |
| 25 to 34 Years | 52 (100.0%) | 49 (86.0%) |
| 35 to 44 Years | 19 (90.5%) | 16 (80.0%) |
| 45 to 54 Years | 39 (90.7%) | 28 (82.4%) |
| 55 to 64 Years | 53 (75.7%) | 83 (87.4%) |
| 65 to 74 Years | 65 (97.0%) | 45 (100.0%) |
| 75 Years and over | 34 (77.3%) | 39 (70.9%) |
| Total | 385 (90.8%) | 357 (85.0%) |
Income Below Poverty Among Married-Couple Families in Odebolt
The poverty statistics for married-couple families in Odebolt show that 8.2% or 18 of the total 219 families live below the poverty line. Families with no children have the highest poverty rate of 9.4%, comprising of 16 families. On the other hand, families with 3 or 4 children have the lowest poverty rate of 0.0%, which includes 0 families.
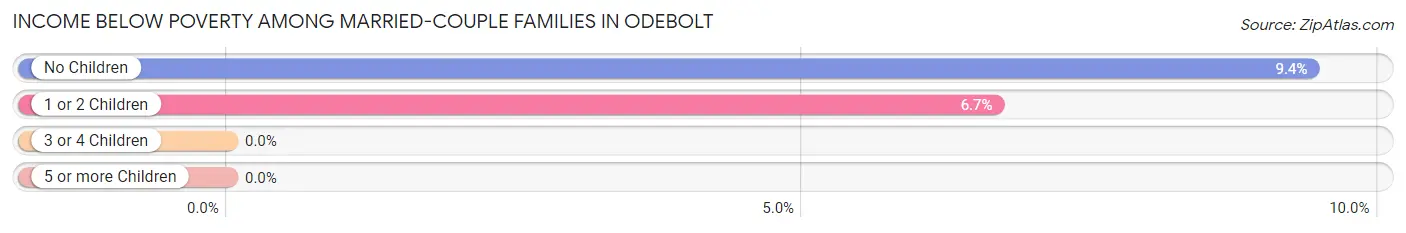
| Children | Above Poverty | Below Poverty |
| No Children | 154 (90.6%) | 16 (9.4%) |
| 1 or 2 Children | 28 (93.3%) | 2 (6.7%) |
| 3 or 4 Children | 19 (100.0%) | 0 (0.0%) |
| 5 or more Children | 0 (0.0%) | 0 (0.0%) |
| Total | 201 (91.8%) | 18 (8.2%) |
Income Below Poverty Among Single-Parent Households in Odebolt
According to the poverty data in Odebolt, 16.7% or 2 single-father households and 18.5% or 5 single-mother households are living below the poverty line. Among single-father households, those with 1 or 2 children have the highest poverty rate, with 2 households (22.2%) experiencing poverty. Likewise, among single-mother households, those with 1 or 2 children have the highest poverty rate, with 5 households (50.0%) falling below the poverty line.
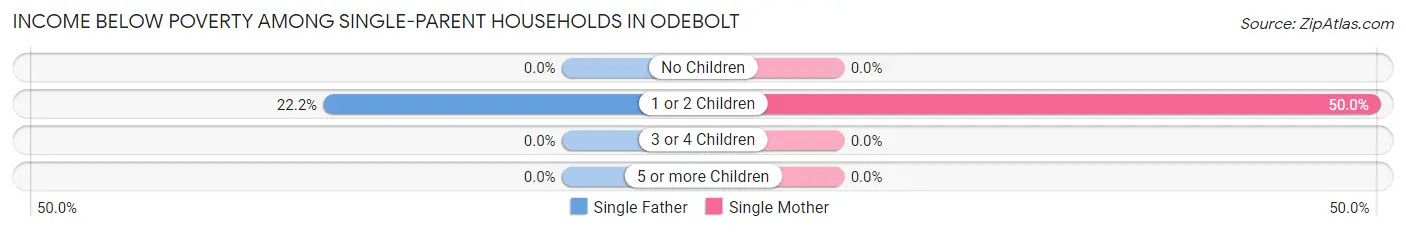
| Children | Single Father | Single Mother |
| No Children | 0 (0.0%) | 0 (0.0%) |
| 1 or 2 Children | 2 (22.2%) | 5 (50.0%) |
| 3 or 4 Children | 0 (0.0%) | 0 (0.0%) |
| 5 or more Children | 0 (0.0%) | 0 (0.0%) |
| Total | 2 (16.7%) | 5 (18.5%) |
Income Below Poverty Among Married-Couple vs Single-Parent Households in Odebolt
The poverty data for Odebolt shows that 18 of the married-couple family households (8.2%) and 7 of the single-parent households (17.9%) are living below the poverty level. Within the married-couple family households, those with no children have the highest poverty rate, with 16 households (9.4%) falling below the poverty line. Among the single-parent households, those with 1 or 2 children have the highest poverty rate, with 7 household (36.8%) living below poverty.
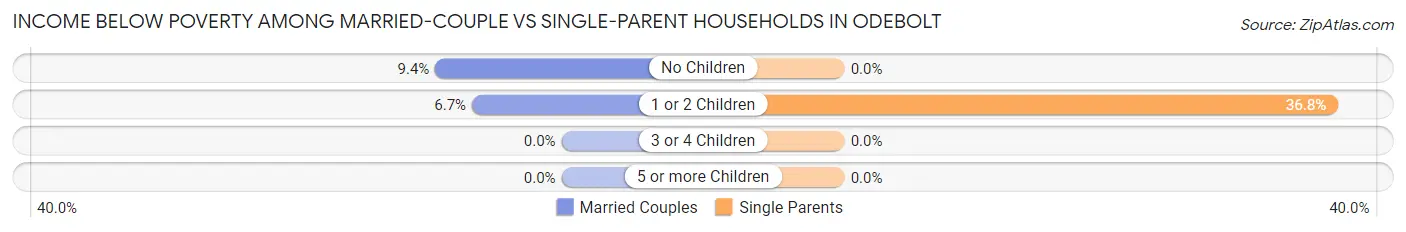
| Children | Married-Couple Families | Single-Parent Households |
| No Children | 16 (9.4%) | 0 (0.0%) |
| 1 or 2 Children | 2 (6.7%) | 7 (36.8%) |
| 3 or 4 Children | 0 (0.0%) | 0 (0.0%) |
| 5 or more Children | 0 (0.0%) | 0 (0.0%) |
| Total | 18 (8.2%) | 7 (17.9%) |
Employment Characteristics in Odebolt
Employment by Class of Employer in Odebolt
Among the 374 employed individuals in Odebolt, private company employees (229 | 61.2%), self-employed (not incorporated) (39 | 10.4%), and not-for-profit organizations (36 | 9.6%) make up the most common classes of employment.
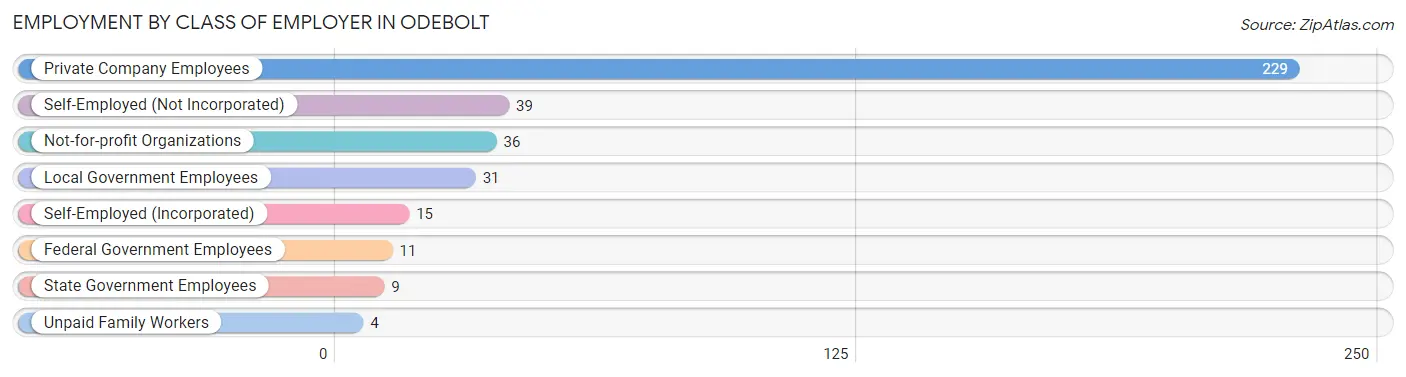
| Employer Class | # Employees | % Employees |
| Private Company Employees | 229 | 61.2% |
| Self-Employed (Incorporated) | 15 | 4.0% |
| Self-Employed (Not Incorporated) | 39 | 10.4% |
| Not-for-profit Organizations | 36 | 9.6% |
| Local Government Employees | 31 | 8.3% |
| State Government Employees | 9 | 2.4% |
| Federal Government Employees | 11 | 2.9% |
| Unpaid Family Workers | 4 | 1.1% |
| Total | 374 | 100.0% |
Employment Status by Age in Odebolt
According to the labor force statistics for Odebolt, out of the total population over 16 years of age (685), 57.4% or 393 individuals are in the labor force, with 3.8% or 15 of them unemployed. The age group with the highest labor force participation rate is 20 to 24 years, with 100.0% or 28 individuals in the labor force. Within the labor force, the 25 to 29 years age range has the highest percentage of unemployed individuals, with 22.5% or 9 of them being unemployed.
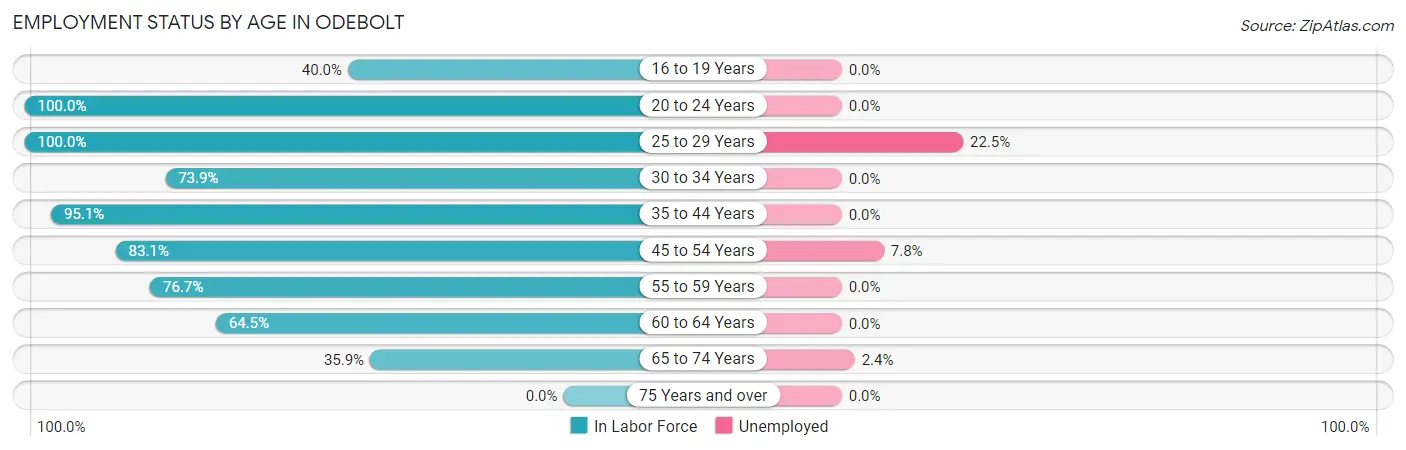
| Age Bracket | In Labor Force | Unemployed |
| 16 to 19 Years | 10 (40.0%) | 0 (0.0%) |
| 20 to 24 Years | 28 (100.0%) | 0 (0.0%) |
| 25 to 29 Years | 40 (100.0%) | 9 (22.5%) |
| 30 to 34 Years | 51 (73.9%) | 0 (0.0%) |
| 35 to 44 Years | 39 (95.1%) | 0 (0.0%) |
| 45 to 54 Years | 64 (83.1%) | 5 (7.8%) |
| 55 to 59 Years | 79 (76.7%) | 0 (0.0%) |
| 60 to 64 Years | 40 (64.5%) | 0 (0.0%) |
| 65 to 74 Years | 42 (35.9%) | 1 (2.4%) |
| 75 Years and over | 0 (0.0%) | 0 (0.0%) |
| Total | 393 (57.4%) | 15 (3.8%) |
Employment Status by Educational Attainment in Odebolt
According to labor force statistics for Odebolt, 79.8% of individuals (313) out of the total population between 25 and 64 years of age (392) are in the labor force, with 4.5% or 14 of them being unemployed. The group with the highest labor force participation rate are those with the educational attainment of college / associate degree, with 88.8% or 135 individuals in the labor force. Within the labor force, individuals with less than high school education have the highest percentage of unemployment, with 9.1% or 1 of them being unemployed.
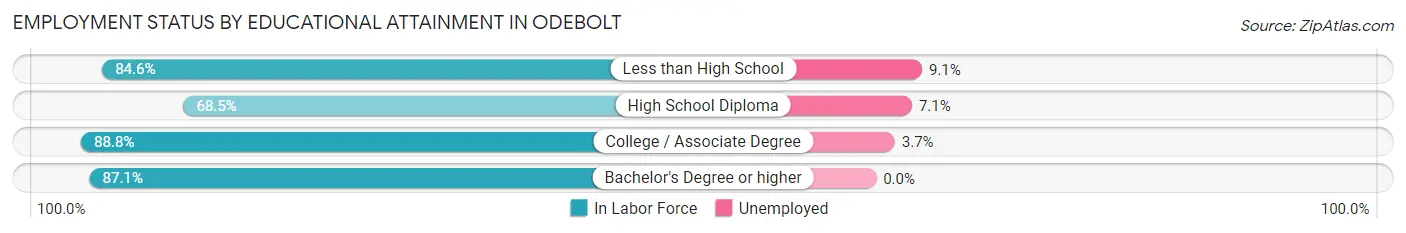
| Educational Attainment | In Labor Force | Unemployed |
| Less than High School | 11 (84.6%) | 1 (9.1%) |
| High School Diploma | 113 (68.5%) | 12 (7.1%) |
| College / Associate Degree | 135 (88.8%) | 6 (3.7%) |
| Bachelor's Degree or higher | 54 (87.1%) | 0 (0.0%) |
| Total | 313 (79.8%) | 18 (4.5%) |
Employment Occupations by Sex in Odebolt
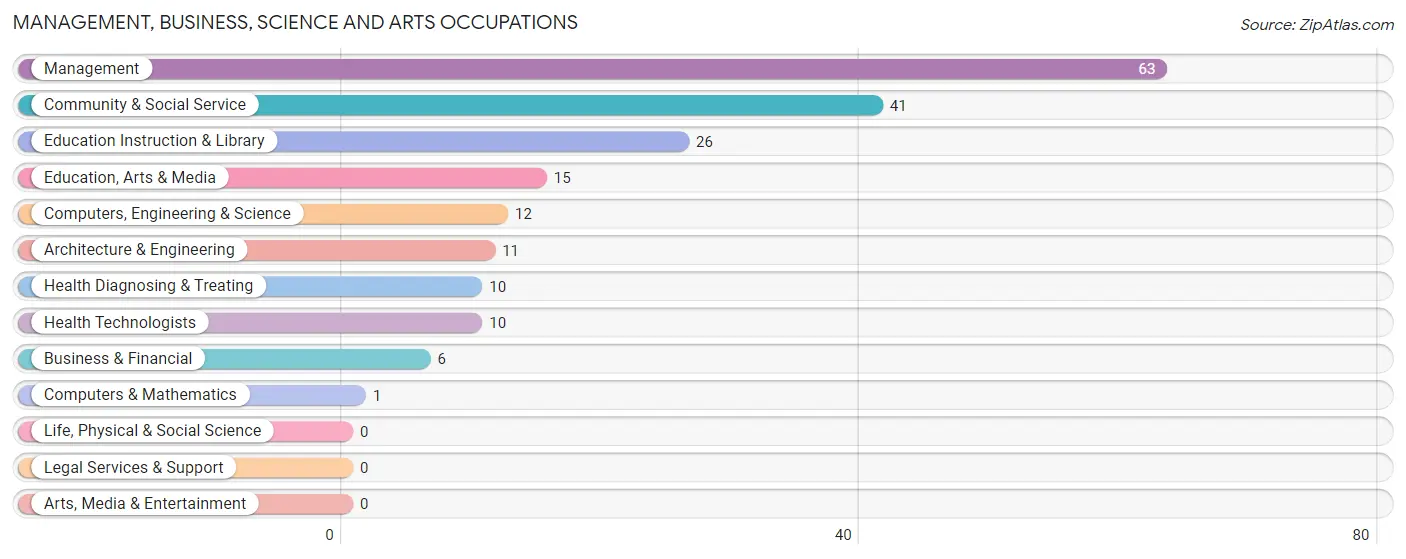
Management, Business, Science and Arts Occupations
The most common Management, Business, Science and Arts occupations in Odebolt are Management (63 | 16.7%), Community & Social Service (41 | 10.8%), Education Instruction & Library (26 | 6.9%), Education, Arts & Media (15 | 4.0%), and Computers, Engineering & Science (12 | 3.2%).
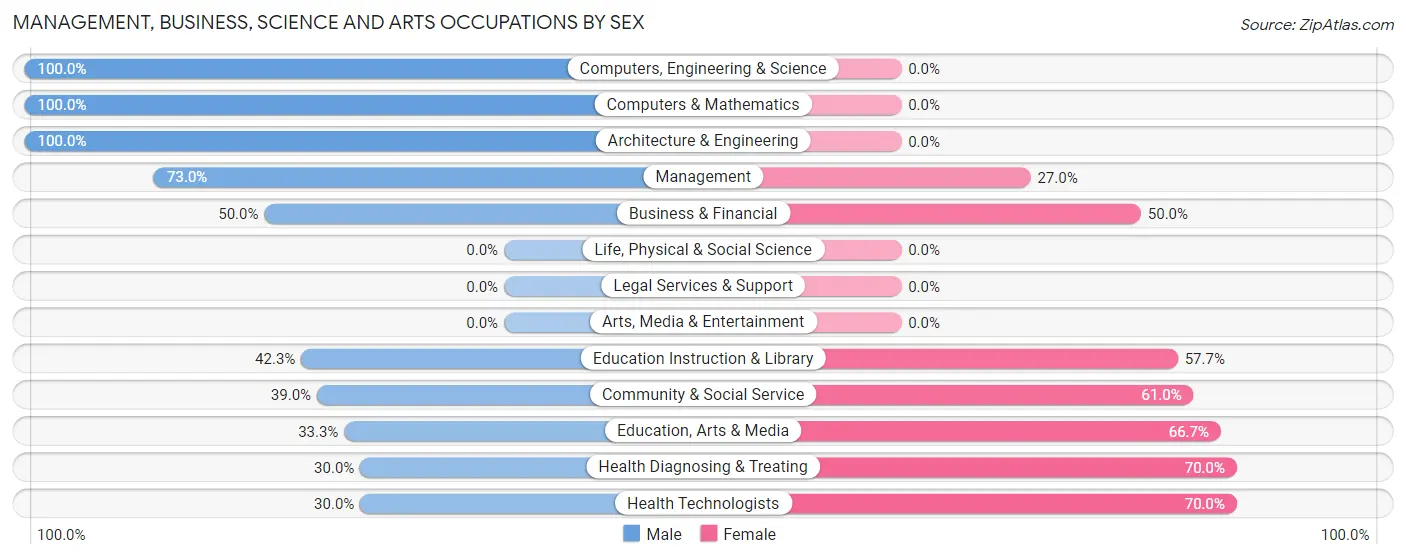
Management, Business, Science and Arts Occupations by Sex
Within the Management, Business, Science and Arts occupations in Odebolt, the most male-oriented occupations are Computers, Engineering & Science (100.0%), Computers & Mathematics (100.0%), and Architecture & Engineering (100.0%), while the most female-oriented occupations are Health Diagnosing & Treating (70.0%), Health Technologists (70.0%), and Education, Arts & Media (66.7%).
| Occupation | Male | Female |
| Management | 46 (73.0%) | 17 (27.0%) |
| Business & Financial | 3 (50.0%) | 3 (50.0%) |
| Computers, Engineering & Science | 12 (100.0%) | 0 (0.0%) |
| Computers & Mathematics | 1 (100.0%) | 0 (0.0%) |
| Architecture & Engineering | 11 (100.0%) | 0 (0.0%) |
| Life, Physical & Social Science | 0 (0.0%) | 0 (0.0%) |
| Community & Social Service | 16 (39.0%) | 25 (61.0%) |
| Education, Arts & Media | 5 (33.3%) | 10 (66.7%) |
| Legal Services & Support | 0 (0.0%) | 0 (0.0%) |
| Education Instruction & Library | 11 (42.3%) | 15 (57.7%) |
| Arts, Media & Entertainment | 0 (0.0%) | 0 (0.0%) |
| Health Diagnosing & Treating | 3 (30.0%) | 7 (70.0%) |
| Health Technologists | 3 (30.0%) | 7 (70.0%) |
| Total (Category) | 80 (60.6%) | 52 (39.4%) |
| Total (Overall) | 206 (54.5%) | 172 (45.5%) |
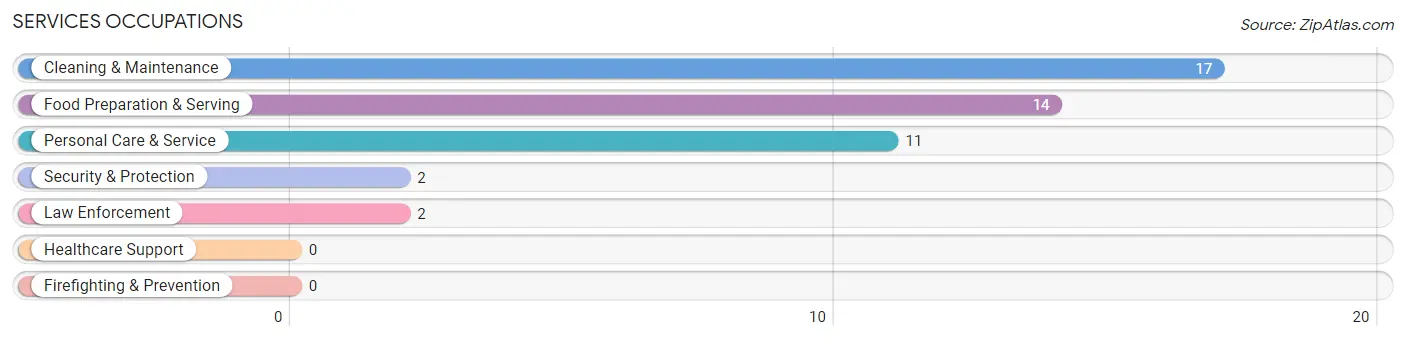
Services Occupations
The most common Services occupations in Odebolt are Cleaning & Maintenance (17 | 4.5%), Food Preparation & Serving (14 | 3.7%), Personal Care & Service (11 | 2.9%), Security & Protection (2 | 0.5%), and Law Enforcement (2 | 0.5%).
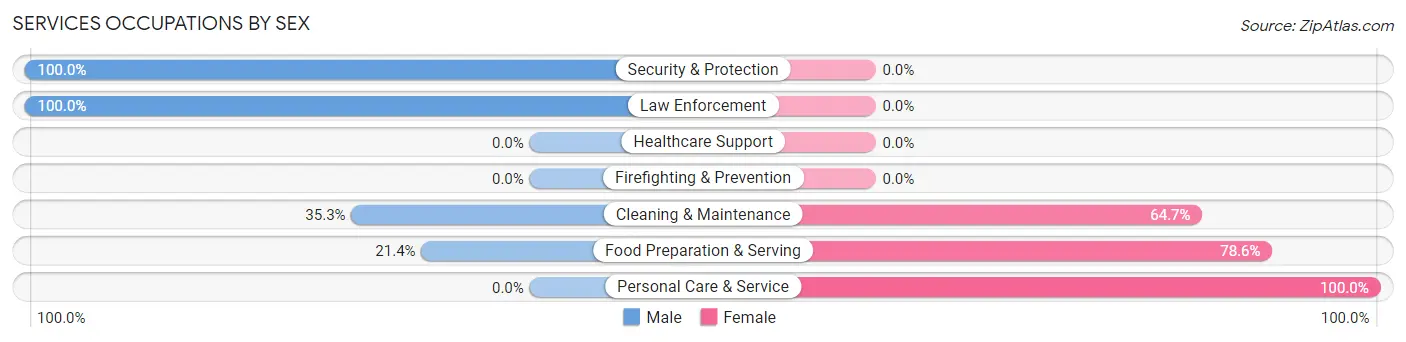
Services Occupations by Sex
Within the Services occupations in Odebolt, the most male-oriented occupations are Security & Protection (100.0%), Law Enforcement (100.0%), and Cleaning & Maintenance (35.3%), while the most female-oriented occupations are Personal Care & Service (100.0%), Food Preparation & Serving (78.6%), and Cleaning & Maintenance (64.7%).
| Occupation | Male | Female |
| Healthcare Support | 0 (0.0%) | 0 (0.0%) |
| Security & Protection | 2 (100.0%) | 0 (0.0%) |
| Firefighting & Prevention | 0 (0.0%) | 0 (0.0%) |
| Law Enforcement | 2 (100.0%) | 0 (0.0%) |
| Food Preparation & Serving | 3 (21.4%) | 11 (78.6%) |
| Cleaning & Maintenance | 6 (35.3%) | 11 (64.7%) |
| Personal Care & Service | 0 (0.0%) | 11 (100.0%) |
| Total (Category) | 11 (25.0%) | 33 (75.0%) |
| Total (Overall) | 206 (54.5%) | 172 (45.5%) |
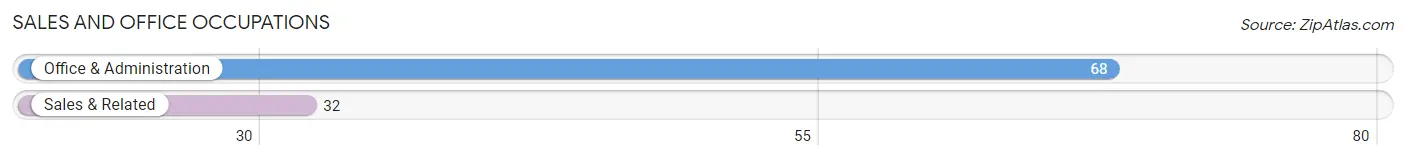
Sales and Office Occupations
The most common Sales and Office occupations in Odebolt are Office & Administration (68 | 18.0%), and Sales & Related (32 | 8.5%).
Sales and Office Occupations by Sex
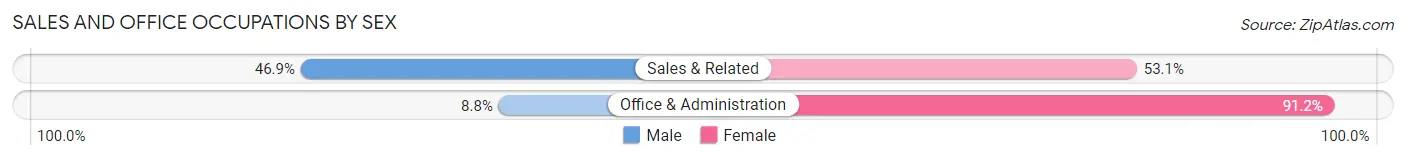
| Occupation | Male | Female |
| Sales & Related | 15 (46.9%) | 17 (53.1%) |
| Office & Administration | 6 (8.8%) | 62 (91.2%) |
| Total (Category) | 21 (21.0%) | 79 (79.0%) |
| Total (Overall) | 206 (54.5%) | 172 (45.5%) |
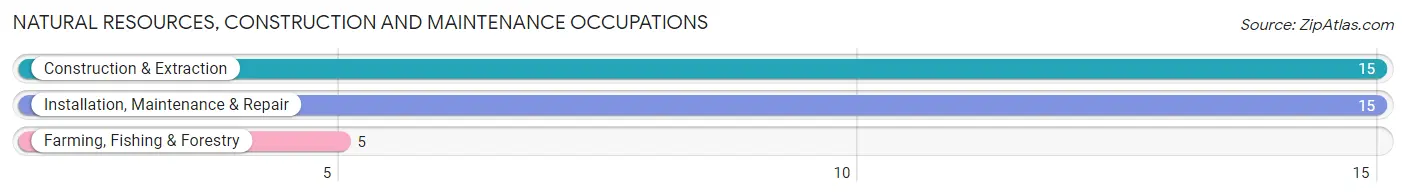
Natural Resources, Construction and Maintenance Occupations
The most common Natural Resources, Construction and Maintenance occupations in Odebolt are Construction & Extraction (15 | 4.0%), Installation, Maintenance & Repair (15 | 4.0%), and Farming, Fishing & Forestry (5 | 1.3%).
Natural Resources, Construction and Maintenance Occupations by Sex
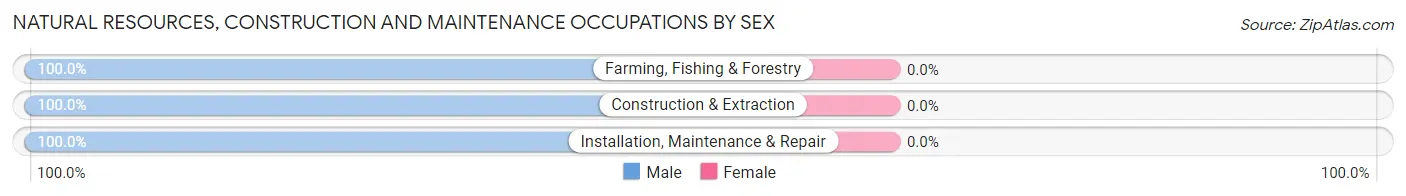
| Occupation | Male | Female |
| Farming, Fishing & Forestry | 5 (100.0%) | 0 (0.0%) |
| Construction & Extraction | 15 (100.0%) | 0 (0.0%) |
| Installation, Maintenance & Repair | 15 (100.0%) | 0 (0.0%) |
| Total (Category) | 35 (100.0%) | 0 (0.0%) |
| Total (Overall) | 206 (54.5%) | 172 (45.5%) |
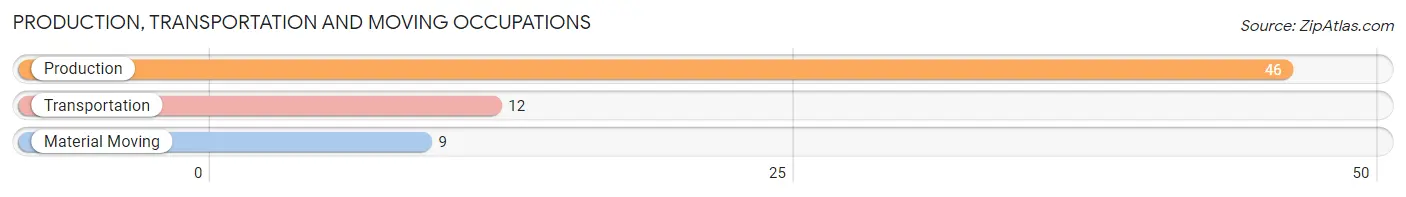
Production, Transportation and Moving Occupations
The most common Production, Transportation and Moving occupations in Odebolt are Production (46 | 12.2%), Transportation (12 | 3.2%), and Material Moving (9 | 2.4%).
Production, Transportation and Moving Occupations by Sex
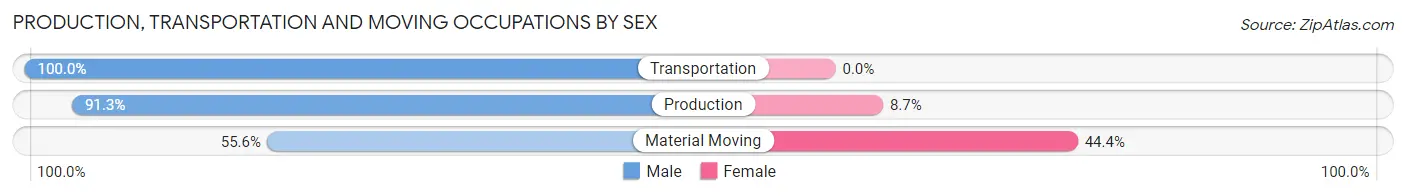
| Occupation | Male | Female |
| Production | 42 (91.3%) | 4 (8.7%) |
| Transportation | 12 (100.0%) | 0 (0.0%) |
| Material Moving | 5 (55.6%) | 4 (44.4%) |
| Total (Category) | 59 (88.1%) | 8 (11.9%) |
| Total (Overall) | 206 (54.5%) | 172 (45.5%) |
Employment Industries by Sex in Odebolt
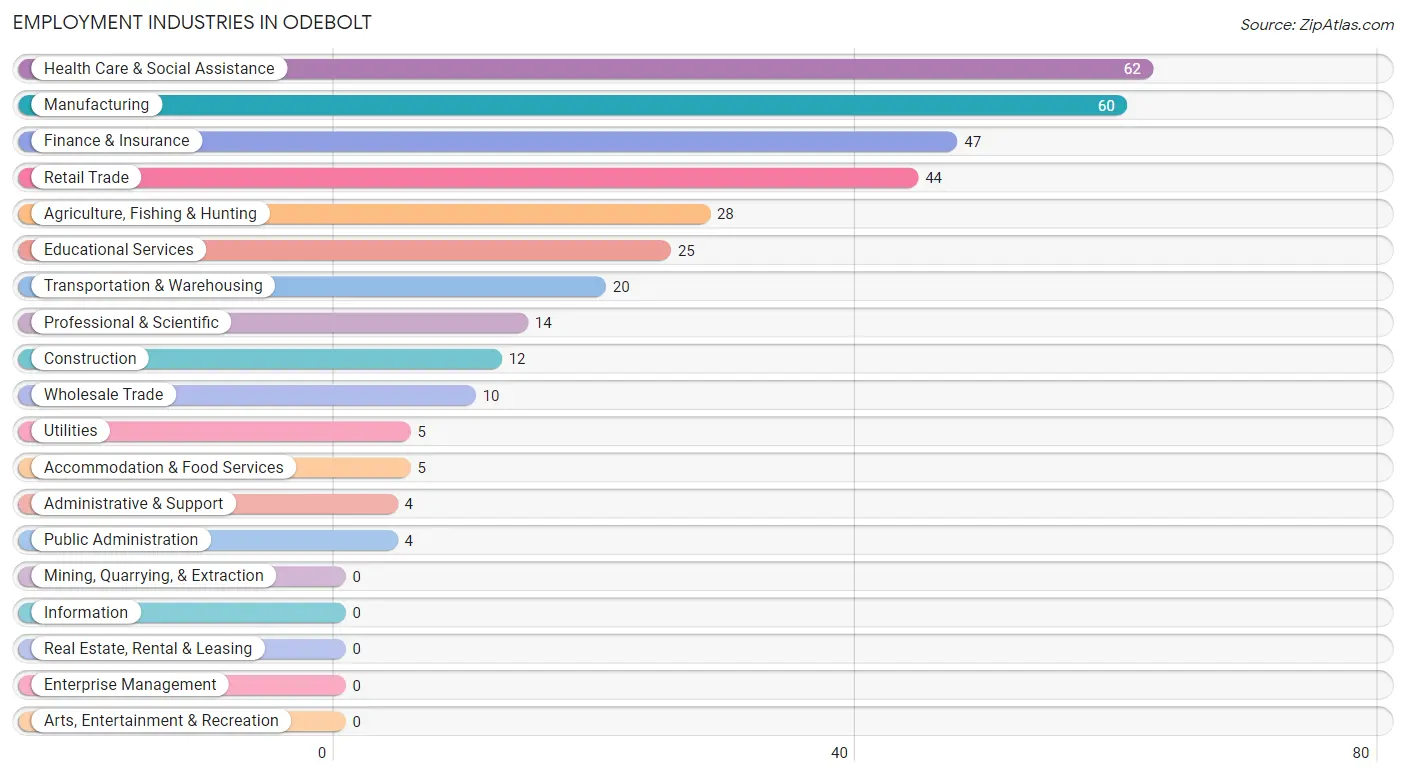
Employment Industries in Odebolt
The major employment industries in Odebolt include Health Care & Social Assistance (62 | 16.4%), Manufacturing (60 | 15.9%), Finance & Insurance (47 | 12.4%), Retail Trade (44 | 11.6%), and Agriculture, Fishing & Hunting (28 | 7.4%).
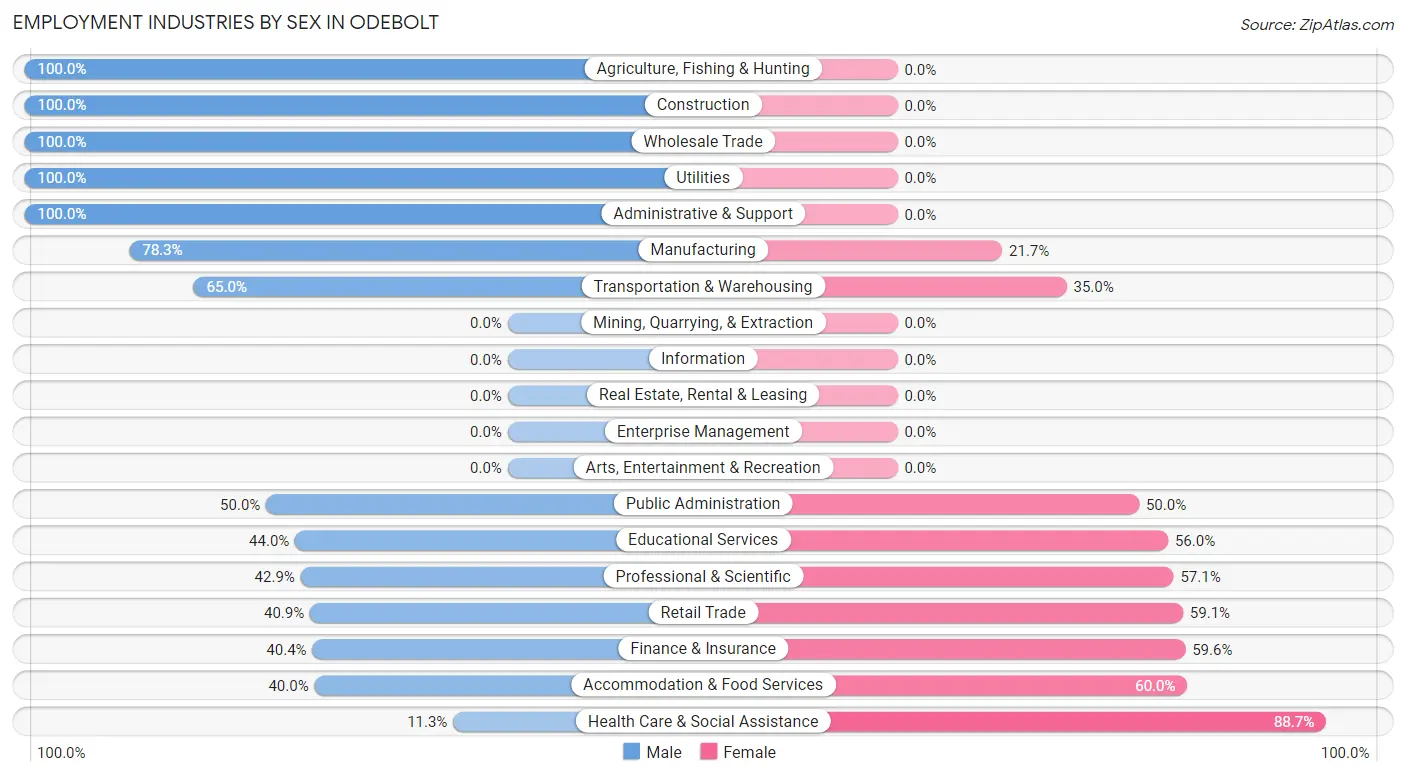
Employment Industries by Sex in Odebolt
The Odebolt industries that see more men than women are Agriculture, Fishing & Hunting (100.0%), Construction (100.0%), and Wholesale Trade (100.0%), whereas the industries that tend to have a higher number of women are Health Care & Social Assistance (88.7%), Accommodation & Food Services (60.0%), and Finance & Insurance (59.6%).
| Industry | Male | Female |
| Agriculture, Fishing & Hunting | 28 (100.0%) | 0 (0.0%) |
| Mining, Quarrying, & Extraction | 0 (0.0%) | 0 (0.0%) |
| Construction | 12 (100.0%) | 0 (0.0%) |
| Manufacturing | 47 (78.3%) | 13 (21.7%) |
| Wholesale Trade | 10 (100.0%) | 0 (0.0%) |
| Retail Trade | 18 (40.9%) | 26 (59.1%) |
| Transportation & Warehousing | 13 (65.0%) | 7 (35.0%) |
| Utilities | 5 (100.0%) | 0 (0.0%) |
| Information | 0 (0.0%) | 0 (0.0%) |
| Finance & Insurance | 19 (40.4%) | 28 (59.6%) |
| Real Estate, Rental & Leasing | 0 (0.0%) | 0 (0.0%) |
| Professional & Scientific | 6 (42.9%) | 8 (57.1%) |
| Enterprise Management | 0 (0.0%) | 0 (0.0%) |
| Administrative & Support | 4 (100.0%) | 0 (0.0%) |
| Educational Services | 11 (44.0%) | 14 (56.0%) |
| Health Care & Social Assistance | 7 (11.3%) | 55 (88.7%) |
| Arts, Entertainment & Recreation | 0 (0.0%) | 0 (0.0%) |
| Accommodation & Food Services | 2 (40.0%) | 3 (60.0%) |
| Public Administration | 2 (50.0%) | 2 (50.0%) |
| Total | 206 (54.5%) | 172 (45.5%) |
Education in Odebolt
School Enrollment in Odebolt
The most common levels of schooling among the 158 students in Odebolt are elementary school (66 | 41.8%), high school (34 | 21.5%), and middle school (28 | 17.7%).
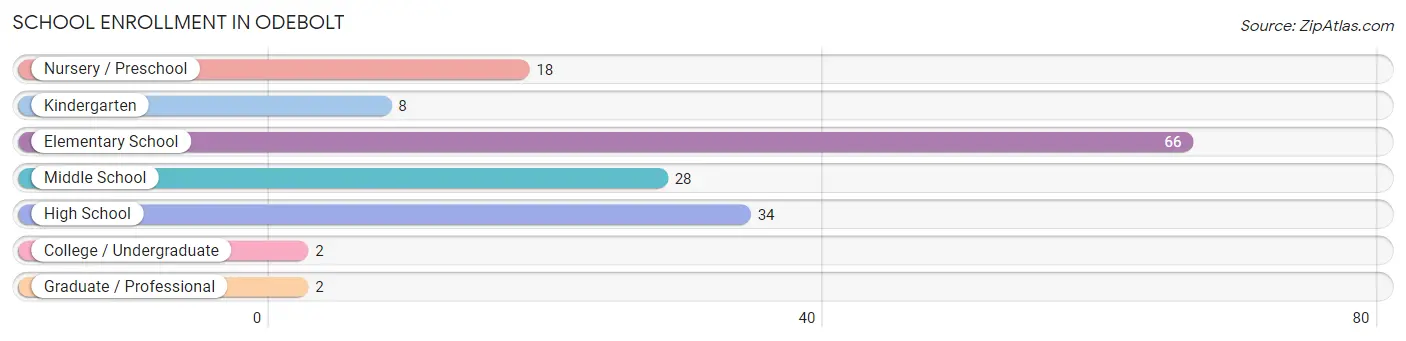
| School Level | # Students | % Students |
| Nursery / Preschool | 18 | 11.4% |
| Kindergarten | 8 | 5.1% |
| Elementary School | 66 | 41.8% |
| Middle School | 28 | 17.7% |
| High School | 34 | 21.5% |
| College / Undergraduate | 2 | 1.3% |
| Graduate / Professional | 2 | 1.3% |
| Total | 158 | 100.0% |
School Enrollment by Age by Funding Source in Odebolt
Out of a total of 158 students who are enrolled in schools in Odebolt, 5 (3.2%) attend a private institution, while the remaining 153 (96.8%) are enrolled in public schools. The age group of 35 years and over has the highest likelihood of being enrolled in private schools, with 2 (50.0% in the age bracket) enrolled. Conversely, the age group of 3 to 4 year olds has the lowest likelihood of being enrolled in a private school, with 18 (100.0% in the age bracket) attending a public institution.
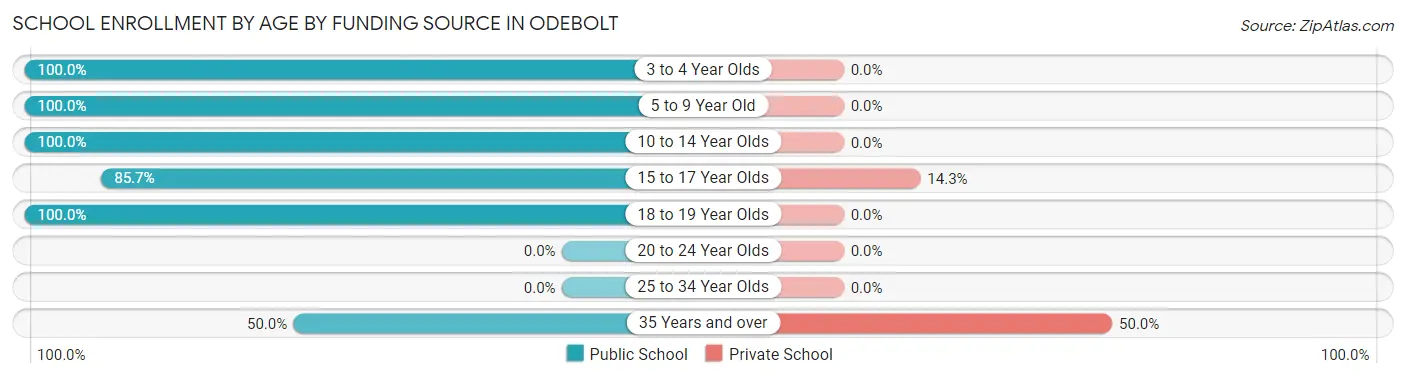
| Age Bracket | Public School | Private School |
| 3 to 4 Year Olds | 18 (100.0%) | 0 (0.0%) |
| 5 to 9 Year Old | 71 (100.0%) | 0 (0.0%) |
| 10 to 14 Year Olds | 34 (100.0%) | 0 (0.0%) |
| 15 to 17 Year Olds | 18 (85.7%) | 3 (14.3%) |
| 18 to 19 Year Olds | 10 (100.0%) | 0 (0.0%) |
| 20 to 24 Year Olds | 0 (0.0%) | 0 (0.0%) |
| 25 to 34 Year Olds | 0 (0.0%) | 0 (0.0%) |
| 35 Years and over | 2 (50.0%) | 2 (50.0%) |
| Total | 153 (96.8%) | 5 (3.2%) |
Educational Attainment by Field of Study in Odebolt
Education (38 | 32.2%), arts & humanities (25 | 21.2%), business (22 | 18.6%), visual & performing arts (8 | 6.8%), and bio, nature & agricultural (7 | 5.9%) are the most common fields of study among 118 individuals in Odebolt who have obtained a bachelor's degree or higher.
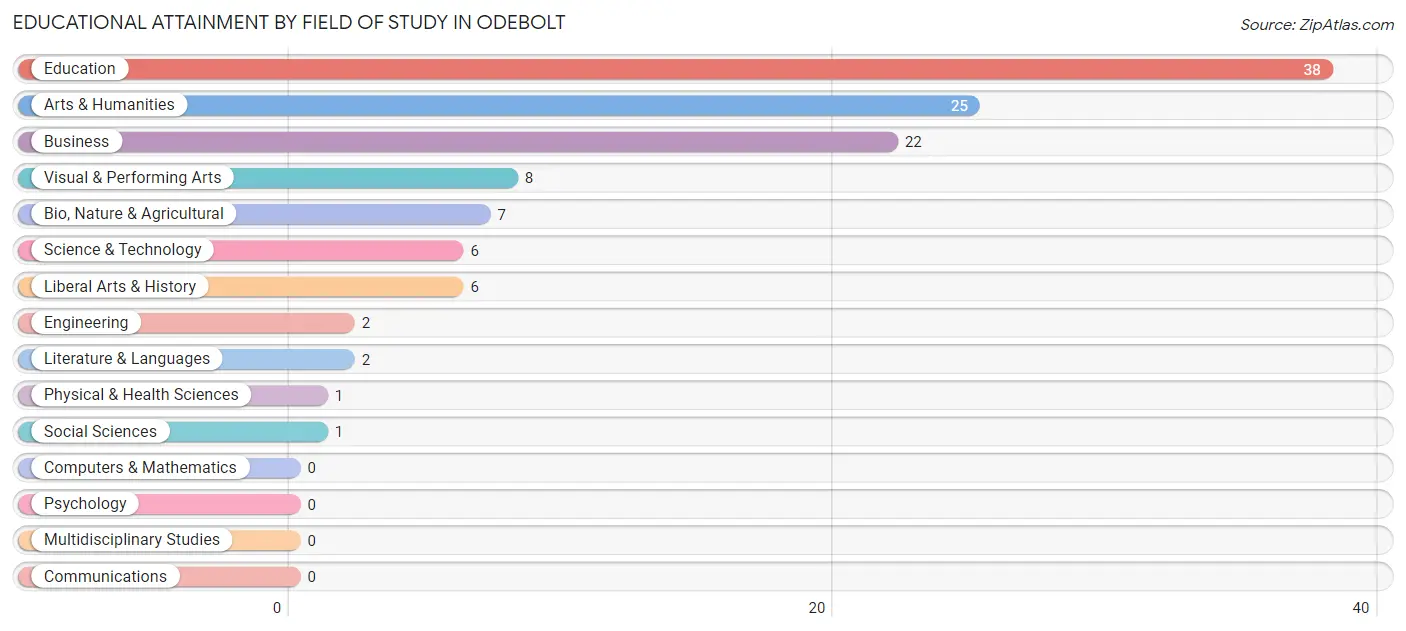
| Field of Study | # Graduates | % Graduates |
| Computers & Mathematics | 0 | 0.0% |
| Bio, Nature & Agricultural | 7 | 5.9% |
| Physical & Health Sciences | 1 | 0.9% |
| Psychology | 0 | 0.0% |
| Social Sciences | 1 | 0.9% |
| Engineering | 2 | 1.7% |
| Multidisciplinary Studies | 0 | 0.0% |
| Science & Technology | 6 | 5.1% |
| Business | 22 | 18.6% |
| Education | 38 | 32.2% |
| Literature & Languages | 2 | 1.7% |
| Liberal Arts & History | 6 | 5.1% |
| Visual & Performing Arts | 8 | 6.8% |
| Communications | 0 | 0.0% |
| Arts & Humanities | 25 | 21.2% |
| Total | 118 | 100.0% |
Transportation & Commute in Odebolt
Vehicle Availability by Sex in Odebolt
The most prevalent vehicle ownership categories in Odebolt are males with 2 vehicles (86, accounting for 41.7%) and females with 2 vehicles (68, making up 51.2%).
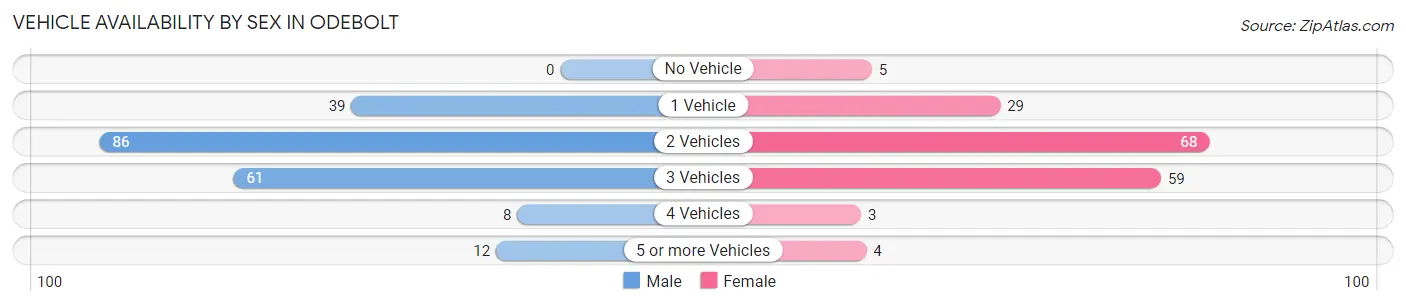
| Vehicles Available | Male | Female |
| No Vehicle | 0 (0.0%) | 5 (3.0%) |
| 1 Vehicle | 39 (18.9%) | 29 (17.3%) |
| 2 Vehicles | 86 (41.7%) | 68 (40.5%) |
| 3 Vehicles | 61 (29.6%) | 59 (35.1%) |
| 4 Vehicles | 8 (3.9%) | 3 (1.8%) |
| 5 or more Vehicles | 12 (5.8%) | 4 (2.4%) |
| Total | 206 (100.0%) | 168 (100.0%) |
Commute Time in Odebolt
The most frequently occuring commute durations in Odebolt are 5 to 9 minutes (77 commuters, 20.9%), 15 to 19 minutes (69 commuters, 18.8%), and less than 5 minutes (61 commuters, 16.6%).
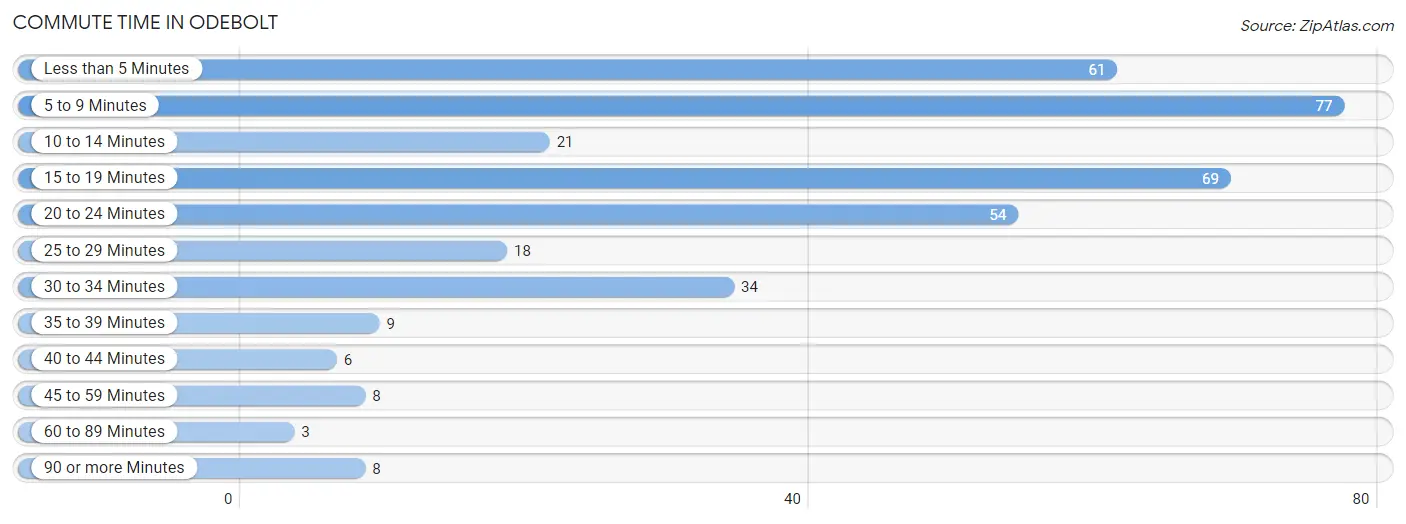
| Commute Time | # Commuters | % Commuters |
| Less than 5 Minutes | 61 | 16.6% |
| 5 to 9 Minutes | 77 | 20.9% |
| 10 to 14 Minutes | 21 | 5.7% |
| 15 to 19 Minutes | 69 | 18.8% |
| 20 to 24 Minutes | 54 | 14.7% |
| 25 to 29 Minutes | 18 | 4.9% |
| 30 to 34 Minutes | 34 | 9.2% |
| 35 to 39 Minutes | 9 | 2.5% |
| 40 to 44 Minutes | 6 | 1.6% |
| 45 to 59 Minutes | 8 | 2.2% |
| 60 to 89 Minutes | 3 | 0.8% |
| 90 or more Minutes | 8 | 2.2% |
Commute Time by Sex in Odebolt
The most common commute times in Odebolt are 5 to 9 minutes (46 commuters, 22.4%) for males and 5 to 9 minutes (31 commuters, 19.0%) for females.
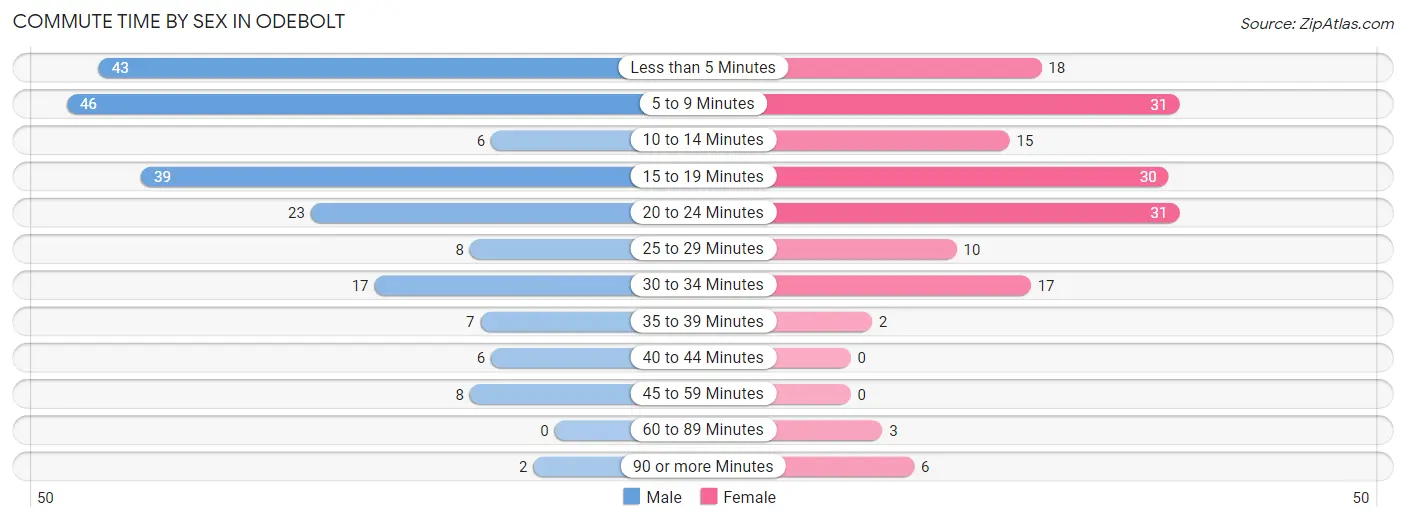
| Commute Time | Male | Female |
| Less than 5 Minutes | 43 (21.0%) | 18 (11.0%) |
| 5 to 9 Minutes | 46 (22.4%) | 31 (19.0%) |
| 10 to 14 Minutes | 6 (2.9%) | 15 (9.2%) |
| 15 to 19 Minutes | 39 (19.0%) | 30 (18.4%) |
| 20 to 24 Minutes | 23 (11.2%) | 31 (19.0%) |
| 25 to 29 Minutes | 8 (3.9%) | 10 (6.1%) |
| 30 to 34 Minutes | 17 (8.3%) | 17 (10.4%) |
| 35 to 39 Minutes | 7 (3.4%) | 2 (1.2%) |
| 40 to 44 Minutes | 6 (2.9%) | 0 (0.0%) |
| 45 to 59 Minutes | 8 (3.9%) | 0 (0.0%) |
| 60 to 89 Minutes | 0 (0.0%) | 3 (1.8%) |
| 90 or more Minutes | 2 (1.0%) | 6 (3.7%) |
Time of Departure to Work by Sex in Odebolt
The most frequent times of departure to work in Odebolt are 7:00 AM to 7:29 AM (47, 22.9%) for males and 7:30 AM to 7:59 AM (60, 36.8%) for females.
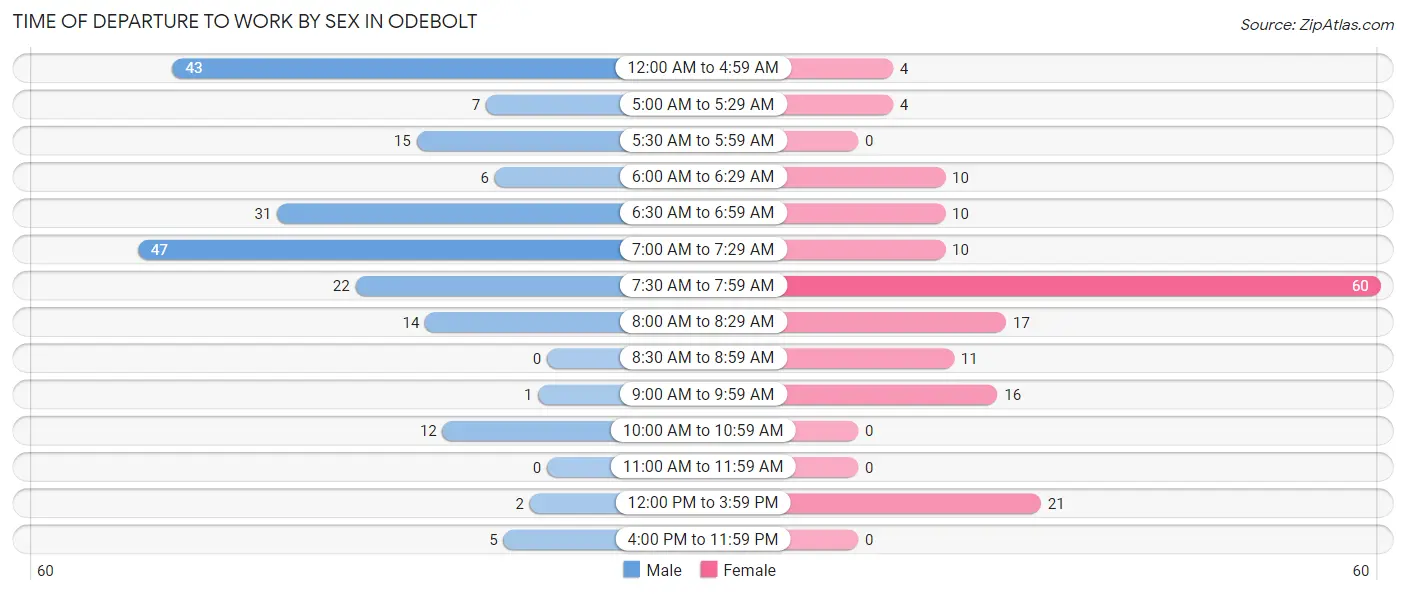
| Time of Departure | Male | Female |
| 12:00 AM to 4:59 AM | 43 (21.0%) | 4 (2.5%) |
| 5:00 AM to 5:29 AM | 7 (3.4%) | 4 (2.5%) |
| 5:30 AM to 5:59 AM | 15 (7.3%) | 0 (0.0%) |
| 6:00 AM to 6:29 AM | 6 (2.9%) | 10 (6.1%) |
| 6:30 AM to 6:59 AM | 31 (15.1%) | 10 (6.1%) |
| 7:00 AM to 7:29 AM | 47 (22.9%) | 10 (6.1%) |
| 7:30 AM to 7:59 AM | 22 (10.7%) | 60 (36.8%) |
| 8:00 AM to 8:29 AM | 14 (6.8%) | 17 (10.4%) |
| 8:30 AM to 8:59 AM | 0 (0.0%) | 11 (6.8%) |
| 9:00 AM to 9:59 AM | 1 (0.5%) | 16 (9.8%) |
| 10:00 AM to 10:59 AM | 12 (5.9%) | 0 (0.0%) |
| 11:00 AM to 11:59 AM | 0 (0.0%) | 0 (0.0%) |
| 12:00 PM to 3:59 PM | 2 (1.0%) | 21 (12.9%) |
| 4:00 PM to 11:59 PM | 5 (2.4%) | 0 (0.0%) |
| Total | 205 (100.0%) | 163 (100.0%) |
Housing Occupancy in Odebolt
Occupancy by Ownership in Odebolt
Of the total 378 dwellings in Odebolt, owner-occupied units account for 302 (79.9%), while renter-occupied units make up 76 (20.1%).
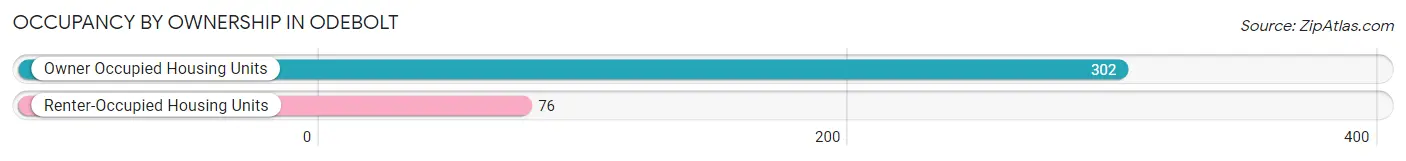
| Occupancy | # Housing Units | % Housing Units |
| Owner Occupied Housing Units | 302 | 79.9% |
| Renter-Occupied Housing Units | 76 | 20.1% |
| Total Occupied Housing Units | 378 | 100.0% |
Occupancy by Household Size in Odebolt
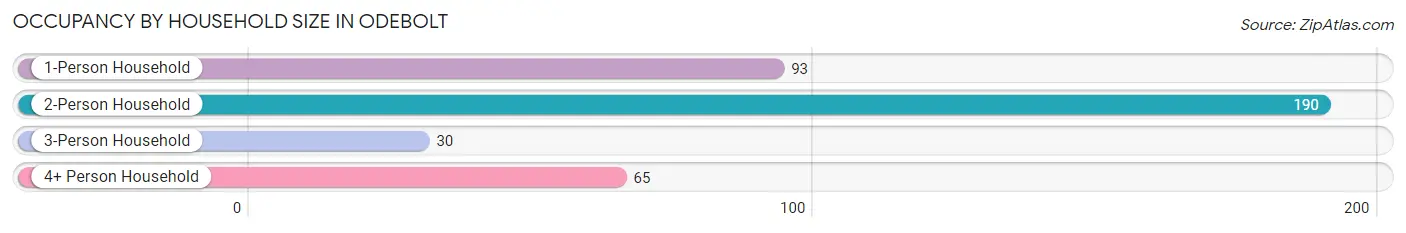
| Household Size | # Housing Units | % Housing Units |
| 1-Person Household | 93 | 24.6% |
| 2-Person Household | 190 | 50.3% |
| 3-Person Household | 30 | 7.9% |
| 4+ Person Household | 65 | 17.2% |
| Total Housing Units | 378 | 100.0% |
Occupancy by Ownership by Household Size in Odebolt
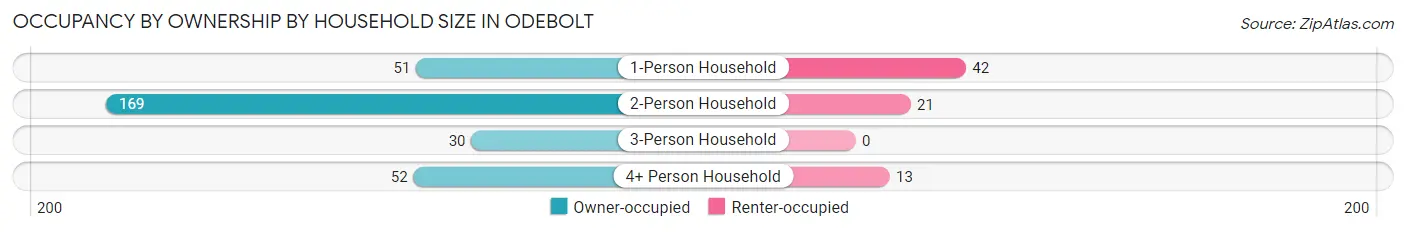
| Household Size | Owner-occupied | Renter-occupied |
| 1-Person Household | 51 (54.8%) | 42 (45.2%) |
| 2-Person Household | 169 (88.9%) | 21 (11.1%) |
| 3-Person Household | 30 (100.0%) | 0 (0.0%) |
| 4+ Person Household | 52 (80.0%) | 13 (20.0%) |
| Total Housing Units | 302 (79.9%) | 76 (20.1%) |
Occupancy by Educational Attainment in Odebolt
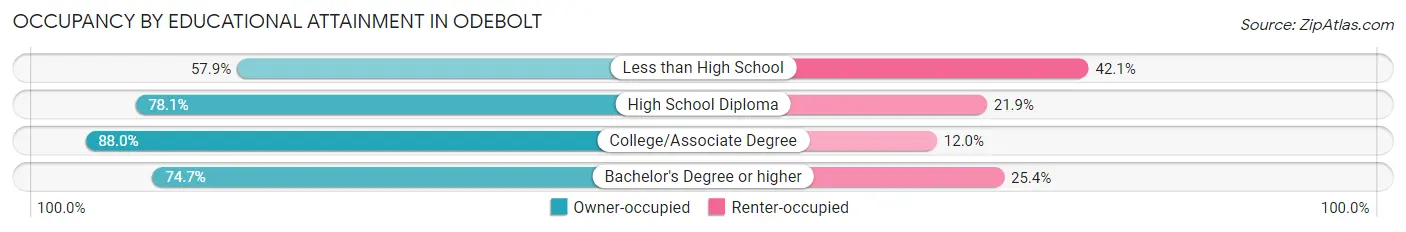
| Household Size | Owner-occupied | Renter-occupied |
| Less than High School | 11 (57.9%) | 8 (42.1%) |
| High School Diploma | 121 (78.1%) | 34 (21.9%) |
| College/Associate Degree | 117 (88.0%) | 16 (12.0%) |
| Bachelor's Degree or higher | 53 (74.7%) | 18 (25.4%) |
Occupancy by Age of Householder in Odebolt
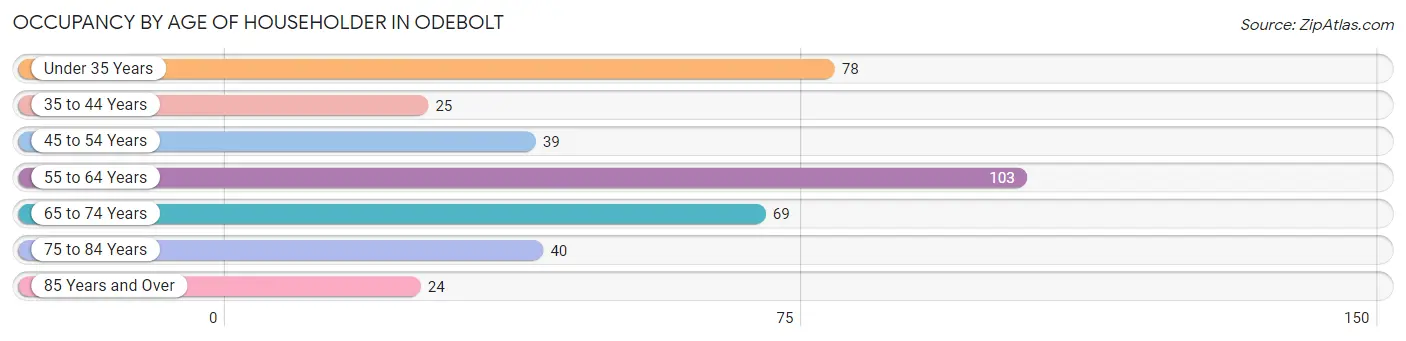
| Age Bracket | # Households | % Households |
| Under 35 Years | 78 | 20.6% |
| 35 to 44 Years | 25 | 6.6% |
| 45 to 54 Years | 39 | 10.3% |
| 55 to 64 Years | 103 | 27.3% |
| 65 to 74 Years | 69 | 18.2% |
| 75 to 84 Years | 40 | 10.6% |
| 85 Years and Over | 24 | 6.4% |
| Total | 378 | 100.0% |
Housing Finances in Odebolt
Median Income by Occupancy in Odebolt
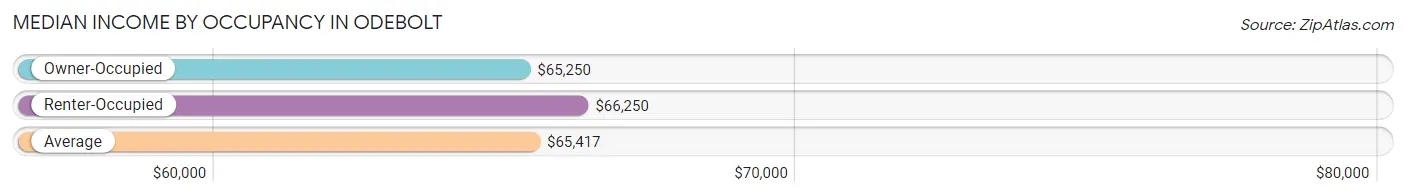
| Occupancy Type | # Households | Median Income |
| Owner-Occupied | 302 (79.9%) | $65,250 |
| Renter-Occupied | 76 (20.1%) | $66,250 |
| Average | 378 (100.0%) | $65,417 |
Occupancy by Householder Income Bracket in Odebolt
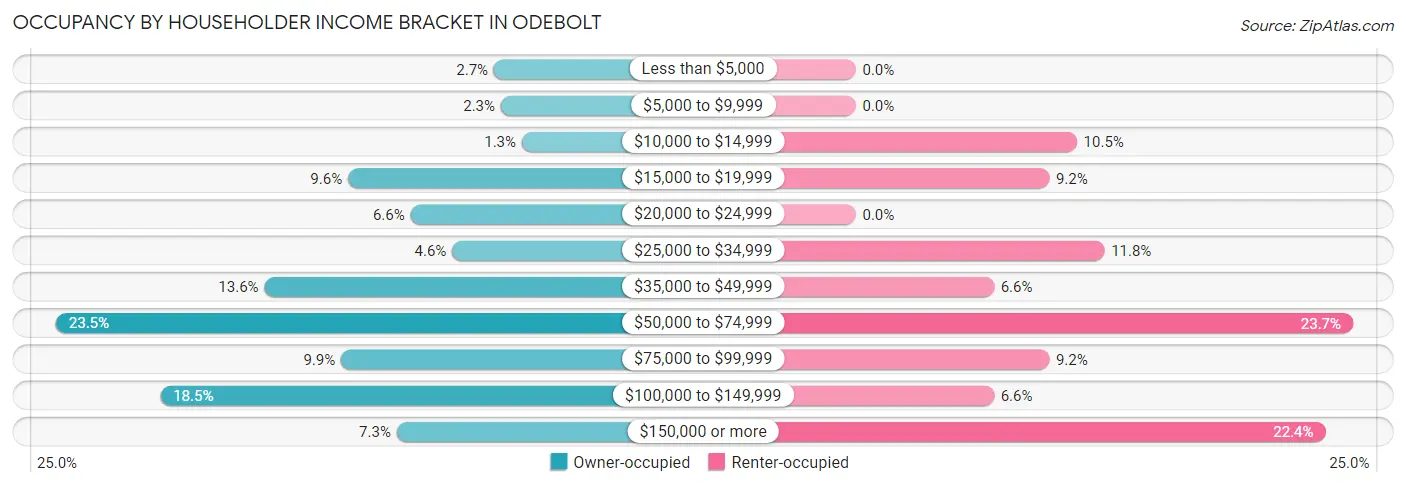
| Income Bracket | Owner-occupied | Renter-occupied |
| Less than $5,000 | 8 (2.6%) | 0 (0.0%) |
| $5,000 to $9,999 | 7 (2.3%) | 0 (0.0%) |
| $10,000 to $14,999 | 4 (1.3%) | 8 (10.5%) |
| $15,000 to $19,999 | 29 (9.6%) | 7 (9.2%) |
| $20,000 to $24,999 | 20 (6.6%) | 0 (0.0%) |
| $25,000 to $34,999 | 14 (4.6%) | 9 (11.8%) |
| $35,000 to $49,999 | 41 (13.6%) | 5 (6.6%) |
| $50,000 to $74,999 | 71 (23.5%) | 18 (23.7%) |
| $75,000 to $99,999 | 30 (9.9%) | 7 (9.2%) |
| $100,000 to $149,999 | 56 (18.5%) | 5 (6.6%) |
| $150,000 or more | 22 (7.3%) | 17 (22.4%) |
| Total | 302 (100.0%) | 76 (100.0%) |
Monthly Housing Cost Tiers in Odebolt
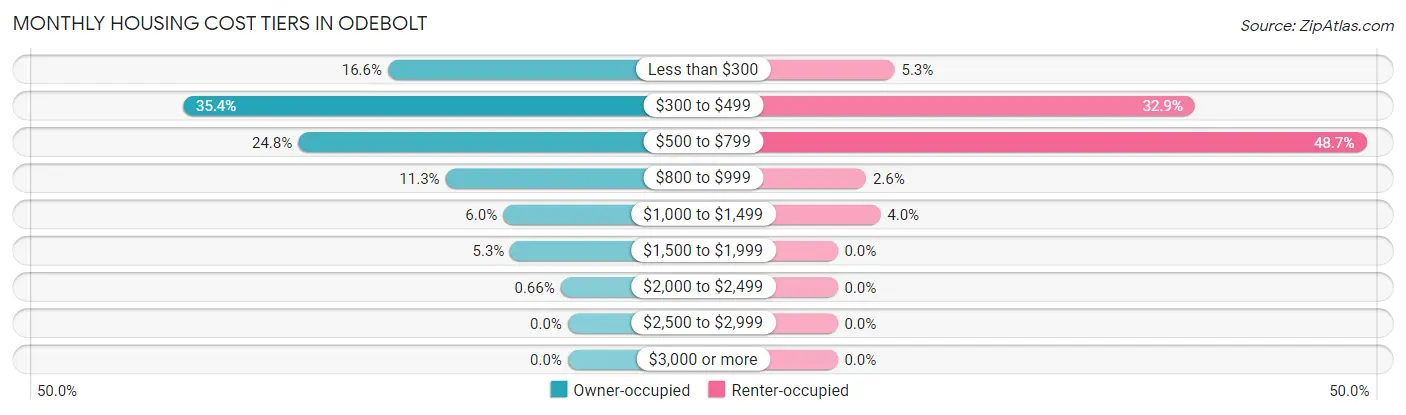
| Monthly Cost | Owner-occupied | Renter-occupied |
| Less than $300 | 50 (16.6%) | 4 (5.3%) |
| $300 to $499 | 107 (35.4%) | 25 (32.9%) |
| $500 to $799 | 75 (24.8%) | 37 (48.7%) |
| $800 to $999 | 34 (11.3%) | 2 (2.6%) |
| $1,000 to $1,499 | 18 (6.0%) | 3 (4.0%) |
| $1,500 to $1,999 | 16 (5.3%) | 0 (0.0%) |
| $2,000 to $2,499 | 2 (0.7%) | 0 (0.0%) |
| $2,500 to $2,999 | 0 (0.0%) | 0 (0.0%) |
| $3,000 or more | 0 (0.0%) | 0 (0.0%) |
| Total | 302 (100.0%) | 76 (100.0%) |
Physical Housing Characteristics in Odebolt
Housing Structures in Odebolt
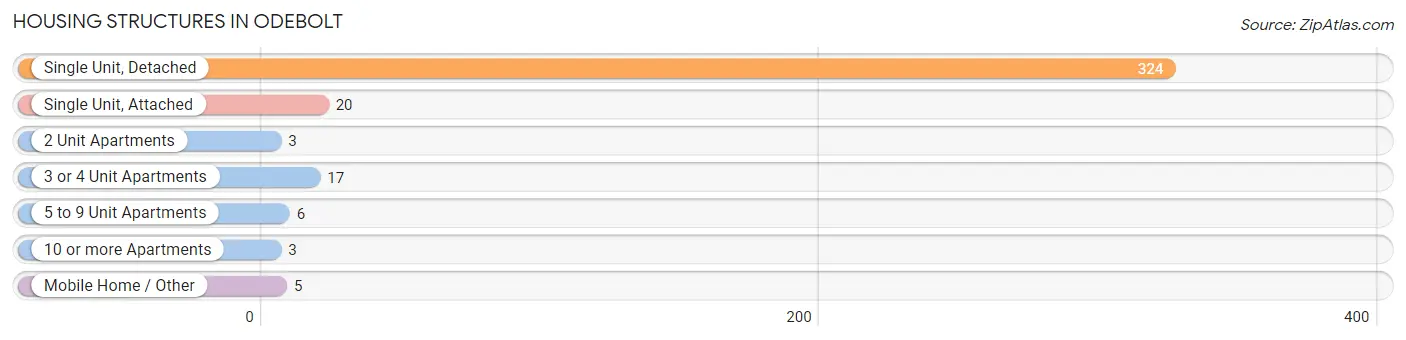
| Structure Type | # Housing Units | % Housing Units |
| Single Unit, Detached | 324 | 85.7% |
| Single Unit, Attached | 20 | 5.3% |
| 2 Unit Apartments | 3 | 0.8% |
| 3 or 4 Unit Apartments | 17 | 4.5% |
| 5 to 9 Unit Apartments | 6 | 1.6% |
| 10 or more Apartments | 3 | 0.8% |
| Mobile Home / Other | 5 | 1.3% |
| Total | 378 | 100.0% |
Housing Structures by Occupancy in Odebolt
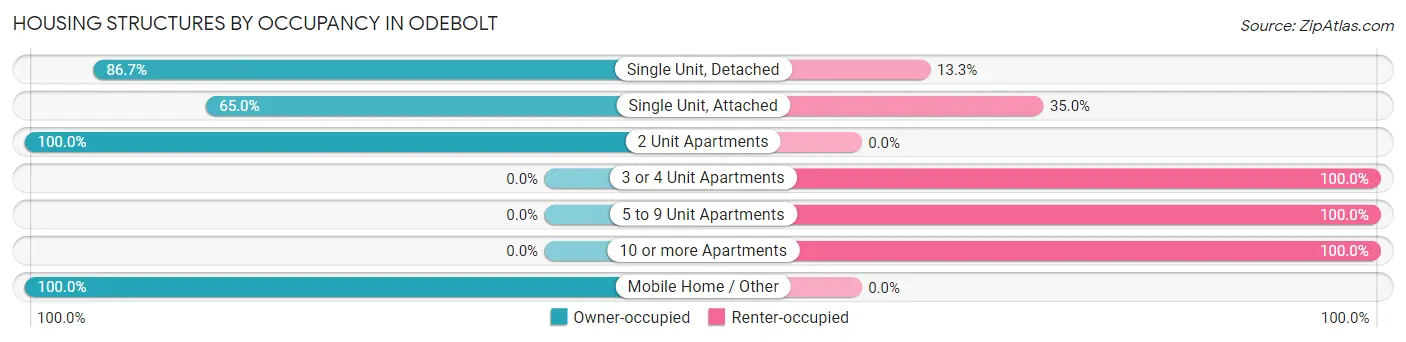
| Structure Type | Owner-occupied | Renter-occupied |
| Single Unit, Detached | 281 (86.7%) | 43 (13.3%) |
| Single Unit, Attached | 13 (65.0%) | 7 (35.0%) |
| 2 Unit Apartments | 3 (100.0%) | 0 (0.0%) |
| 3 or 4 Unit Apartments | 0 (0.0%) | 17 (100.0%) |
| 5 to 9 Unit Apartments | 0 (0.0%) | 6 (100.0%) |
| 10 or more Apartments | 0 (0.0%) | 3 (100.0%) |
| Mobile Home / Other | 5 (100.0%) | 0 (0.0%) |
| Total | 302 (79.9%) | 76 (20.1%) |
Housing Structures by Number of Rooms in Odebolt
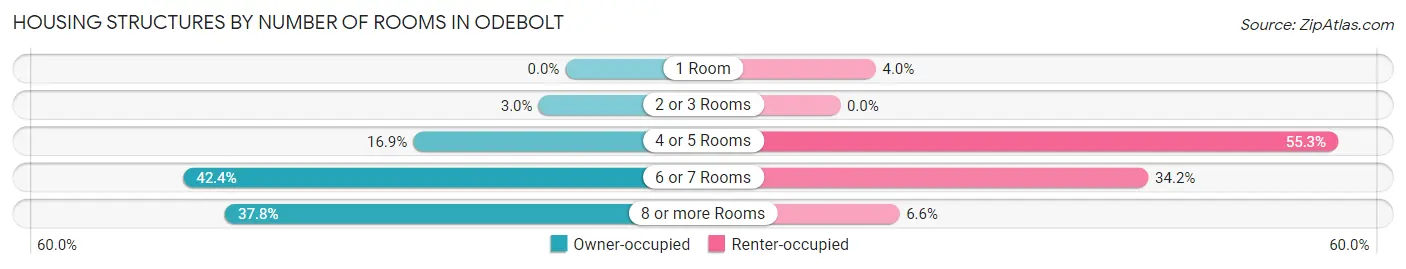
| Number of Rooms | Owner-occupied | Renter-occupied |
| 1 Room | 0 (0.0%) | 3 (4.0%) |
| 2 or 3 Rooms | 9 (3.0%) | 0 (0.0%) |
| 4 or 5 Rooms | 51 (16.9%) | 42 (55.3%) |
| 6 or 7 Rooms | 128 (42.4%) | 26 (34.2%) |
| 8 or more Rooms | 114 (37.8%) | 5 (6.6%) |
| Total | 302 (100.0%) | 76 (100.0%) |
Housing Structure by Heating Type in Odebolt
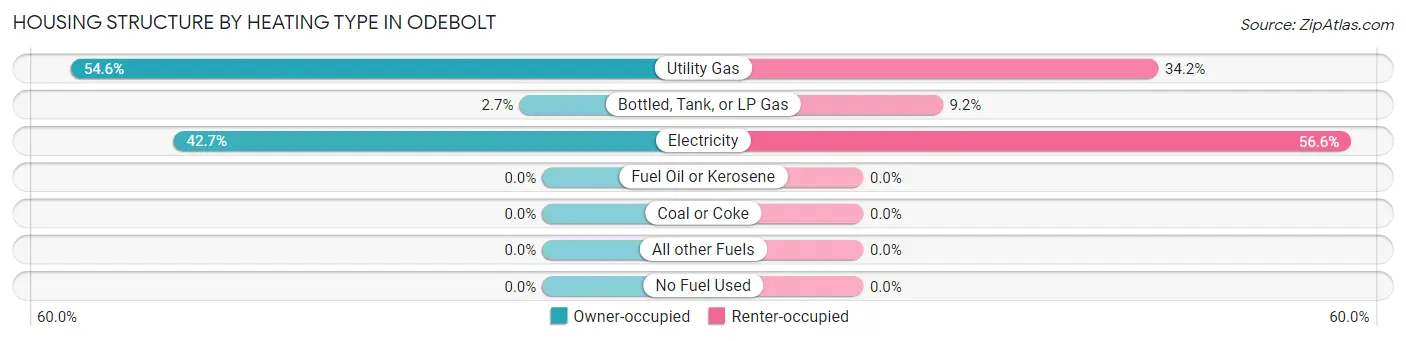
| Heating Type | Owner-occupied | Renter-occupied |
| Utility Gas | 165 (54.6%) | 26 (34.2%) |
| Bottled, Tank, or LP Gas | 8 (2.6%) | 7 (9.2%) |
| Electricity | 129 (42.7%) | 43 (56.6%) |
| Fuel Oil or Kerosene | 0 (0.0%) | 0 (0.0%) |
| Coal or Coke | 0 (0.0%) | 0 (0.0%) |
| All other Fuels | 0 (0.0%) | 0 (0.0%) |
| No Fuel Used | 0 (0.0%) | 0 (0.0%) |
| Total | 302 (100.0%) | 76 (100.0%) |
Household Vehicle Usage in Odebolt
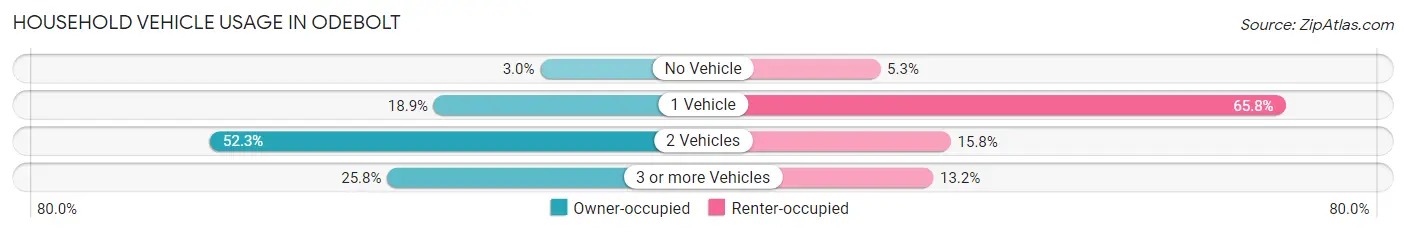
| Vehicles per Household | Owner-occupied | Renter-occupied |
| No Vehicle | 9 (3.0%) | 4 (5.3%) |
| 1 Vehicle | 57 (18.9%) | 50 (65.8%) |
| 2 Vehicles | 158 (52.3%) | 12 (15.8%) |
| 3 or more Vehicles | 78 (25.8%) | 10 (13.2%) |
| Total | 302 (100.0%) | 76 (100.0%) |
Real Estate & Mortgages in Odebolt
Real Estate and Mortgage Overview in Odebolt
| Characteristic | Without Mortgage | With Mortgage |
| Housing Units | 233 | 69 |
| Median Property Value | $85,000 | $101,600 |
| Median Household Income | $52,232 | $4 |
| Monthly Housing Costs | $404 | $0 |
| Real Estate Taxes | $1,080 | $0 |
Property Value by Mortgage Status in Odebolt
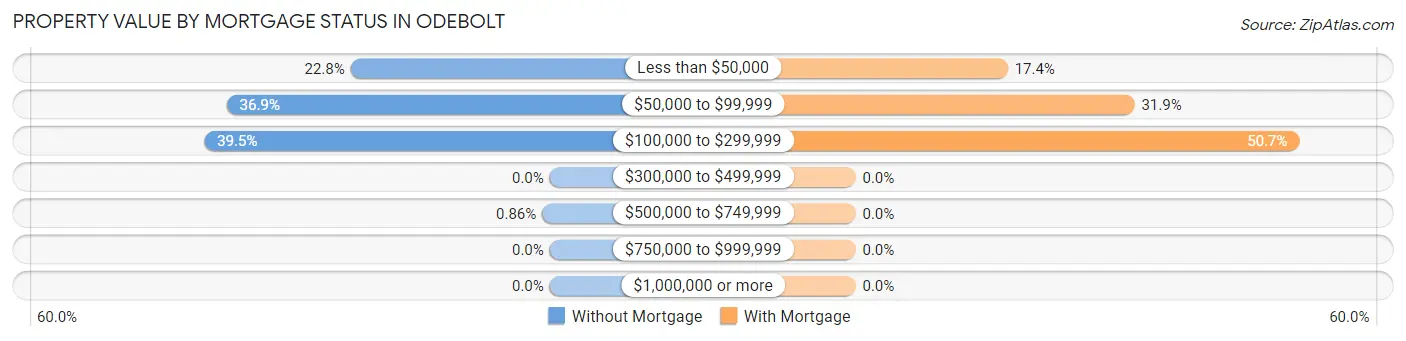
| Property Value | Without Mortgage | With Mortgage |
| Less than $50,000 | 53 (22.8%) | 12 (17.4%) |
| $50,000 to $99,999 | 86 (36.9%) | 22 (31.9%) |
| $100,000 to $299,999 | 92 (39.5%) | 35 (50.7%) |
| $300,000 to $499,999 | 0 (0.0%) | 0 (0.0%) |
| $500,000 to $749,999 | 2 (0.9%) | 0 (0.0%) |
| $750,000 to $999,999 | 0 (0.0%) | 0 (0.0%) |
| $1,000,000 or more | 0 (0.0%) | 0 (0.0%) |
| Total | 233 (100.0%) | 69 (100.0%) |
Household Income by Mortgage Status in Odebolt
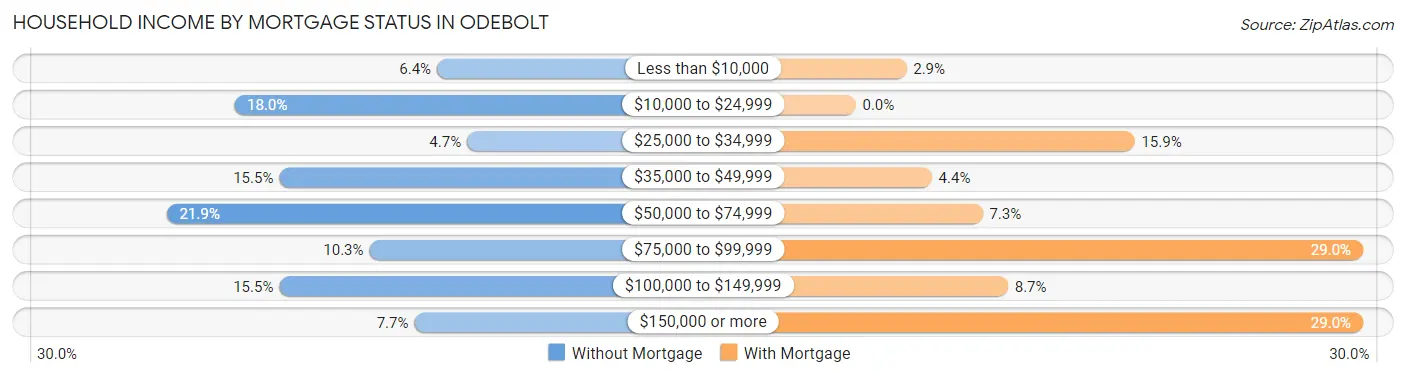
| Household Income | Without Mortgage | With Mortgage |
| Less than $10,000 | 15 (6.4%) | 2 (2.9%) |
| $10,000 to $24,999 | 42 (18.0%) | 0 (0.0%) |
| $25,000 to $34,999 | 11 (4.7%) | 11 (15.9%) |
| $35,000 to $49,999 | 36 (15.4%) | 3 (4.3%) |
| $50,000 to $74,999 | 51 (21.9%) | 5 (7.2%) |
| $75,000 to $99,999 | 24 (10.3%) | 20 (29.0%) |
| $100,000 to $149,999 | 36 (15.4%) | 6 (8.7%) |
| $150,000 or more | 18 (7.7%) | 20 (29.0%) |
| Total | 233 (100.0%) | 69 (100.0%) |
Property Value to Household Income Ratio in Odebolt
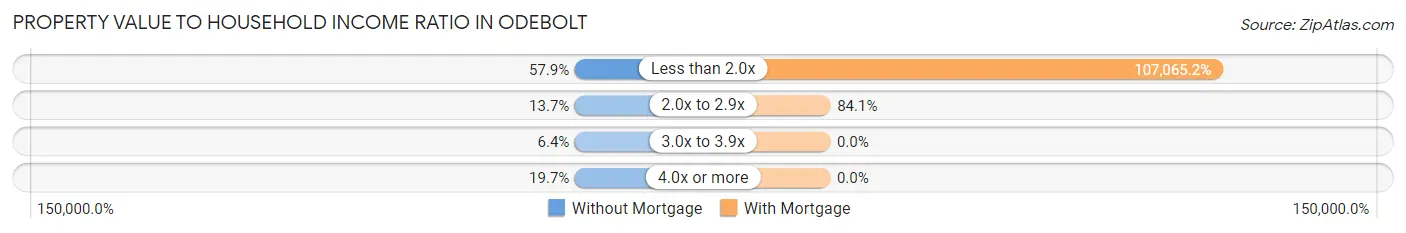
| Value-to-Income Ratio | Without Mortgage | With Mortgage |
| Less than 2.0x | 135 (57.9%) | 73,875 (107,065.2%) |
| 2.0x to 2.9x | 32 (13.7%) | 58 (84.1%) |
| 3.0x to 3.9x | 15 (6.4%) | 0 (0.0%) |
| 4.0x or more | 46 (19.7%) | 0 (0.0%) |
| Total | 233 (100.0%) | 69 (100.0%) |
Real Estate Taxes by Mortgage Status in Odebolt
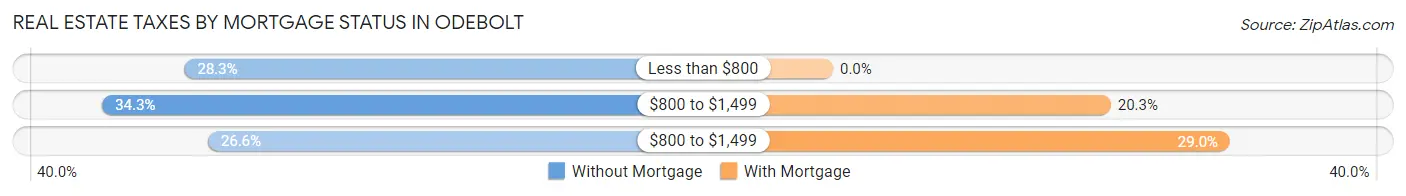
| Property Taxes | Without Mortgage | With Mortgage |
| Less than $800 | 66 (28.3%) | 0 (0.0%) |
| $800 to $1,499 | 80 (34.3%) | 14 (20.3%) |
| $800 to $1,499 | 62 (26.6%) | 20 (29.0%) |
| Total | 233 (100.0%) | 69 (100.0%) |
Health & Disability in Odebolt
Health Insurance Coverage by Age in Odebolt
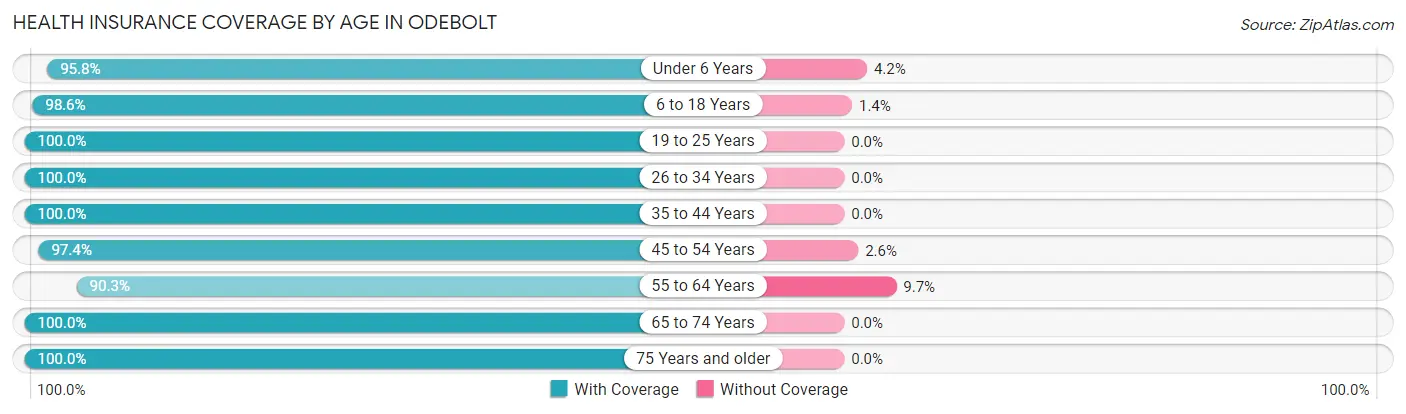
| Age Bracket | With Coverage | Without Coverage |
| Under 6 Years | 68 (95.8%) | 3 (4.2%) |
| 6 to 18 Years | 137 (98.6%) | 2 (1.4%) |
| 19 to 25 Years | 35 (100.0%) | 0 (0.0%) |
| 26 to 34 Years | 105 (100.0%) | 0 (0.0%) |
| 35 to 44 Years | 41 (100.0%) | 0 (0.0%) |
| 45 to 54 Years | 75 (97.4%) | 2 (2.6%) |
| 55 to 64 Years | 149 (90.3%) | 16 (9.7%) |
| 65 to 74 Years | 112 (100.0%) | 0 (0.0%) |
| 75 Years and older | 99 (100.0%) | 0 (0.0%) |
| Total | 821 (97.3%) | 23 (2.7%) |
Health Insurance Coverage by Citizenship Status in Odebolt
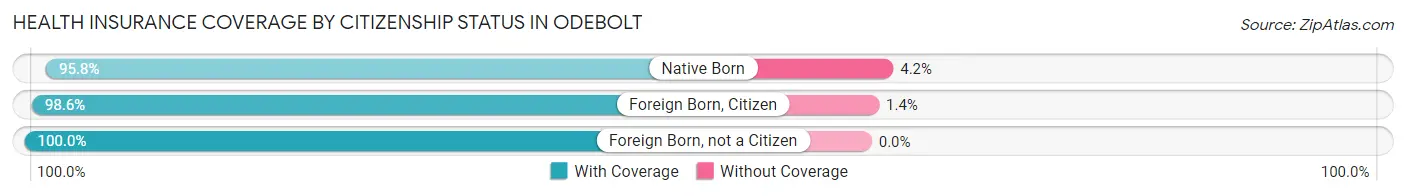
| Citizenship Status | With Coverage | Without Coverage |
| Native Born | 68 (95.8%) | 3 (4.2%) |
| Foreign Born, Citizen | 137 (98.6%) | 2 (1.4%) |
| Foreign Born, not a Citizen | 35 (100.0%) | 0 (0.0%) |
Health Insurance Coverage by Household Income in Odebolt
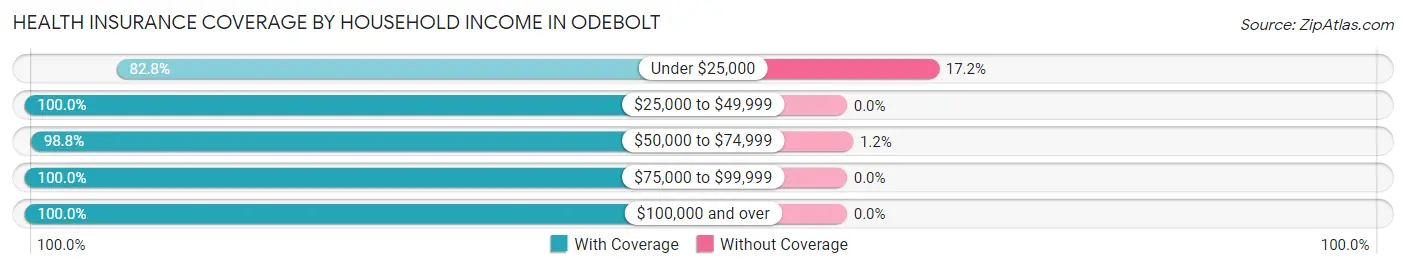
| Household Income | With Coverage | Without Coverage |
| Under $25,000 | 96 (82.8%) | 20 (17.2%) |
| $25,000 to $49,999 | 143 (100.0%) | 0 (0.0%) |
| $50,000 to $74,999 | 255 (98.8%) | 3 (1.2%) |
| $75,000 to $99,999 | 91 (100.0%) | 0 (0.0%) |
| $100,000 and over | 236 (100.0%) | 0 (0.0%) |
Public vs Private Health Insurance Coverage by Age in Odebolt
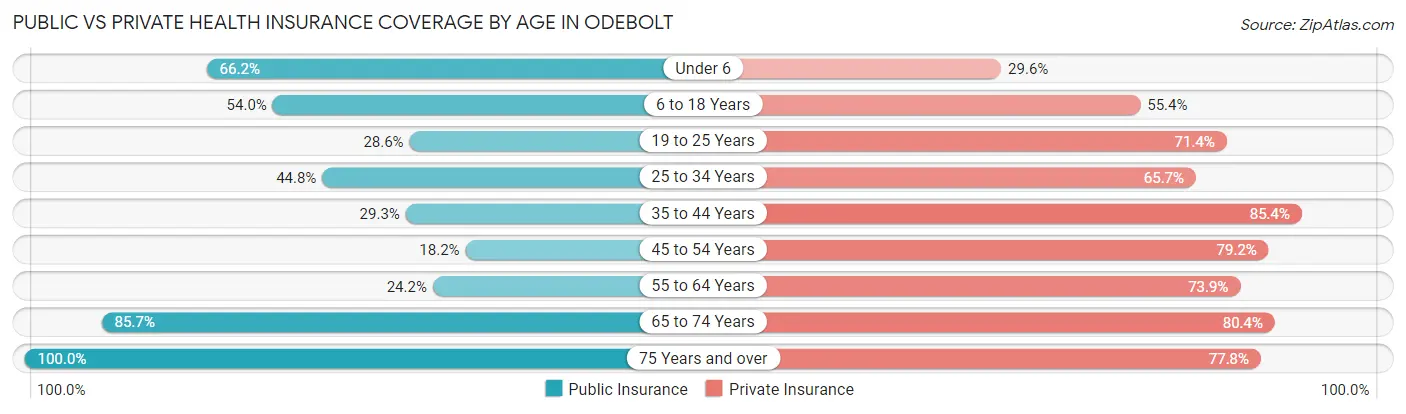
| Age Bracket | Public Insurance | Private Insurance |
| Under 6 | 47 (66.2%) | 21 (29.6%) |
| 6 to 18 Years | 75 (54.0%) | 77 (55.4%) |
| 19 to 25 Years | 10 (28.6%) | 25 (71.4%) |
| 25 to 34 Years | 47 (44.8%) | 69 (65.7%) |
| 35 to 44 Years | 12 (29.3%) | 35 (85.4%) |
| 45 to 54 Years | 14 (18.2%) | 61 (79.2%) |
| 55 to 64 Years | 40 (24.2%) | 122 (73.9%) |
| 65 to 74 Years | 96 (85.7%) | 90 (80.4%) |
| 75 Years and over | 99 (100.0%) | 77 (77.8%) |
| Total | 440 (52.1%) | 577 (68.4%) |
Disability Status by Sex by Age in Odebolt
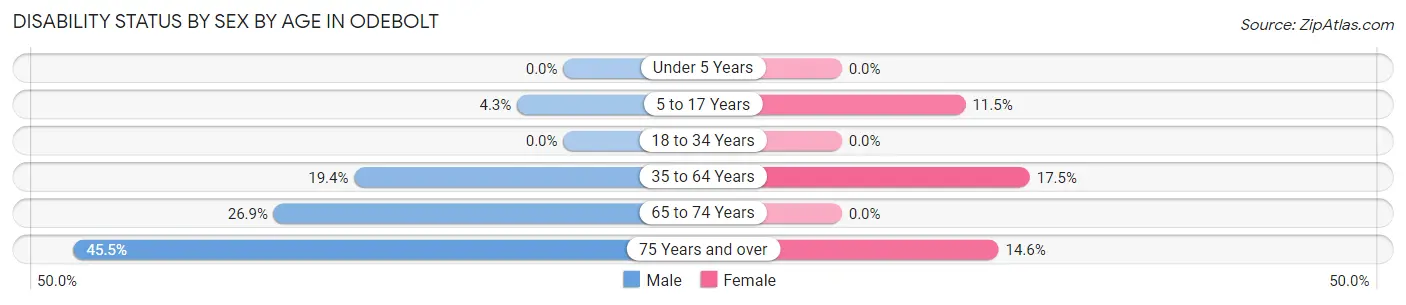
| Age Bracket | Male | Female |
| Under 5 Years | 0 (0.0%) | 0 (0.0%) |
| 5 to 17 Years | 3 (4.3%) | 7 (11.5%) |
| 18 to 34 Years | 0 (0.0%) | 0 (0.0%) |
| 35 to 64 Years | 26 (19.4%) | 26 (17.4%) |
| 65 to 74 Years | 18 (26.9%) | 0 (0.0%) |
| 75 Years and over | 20 (45.5%) | 8 (14.5%) |
Disability Class by Sex by Age in Odebolt
Disability Class: Hearing Difficulty
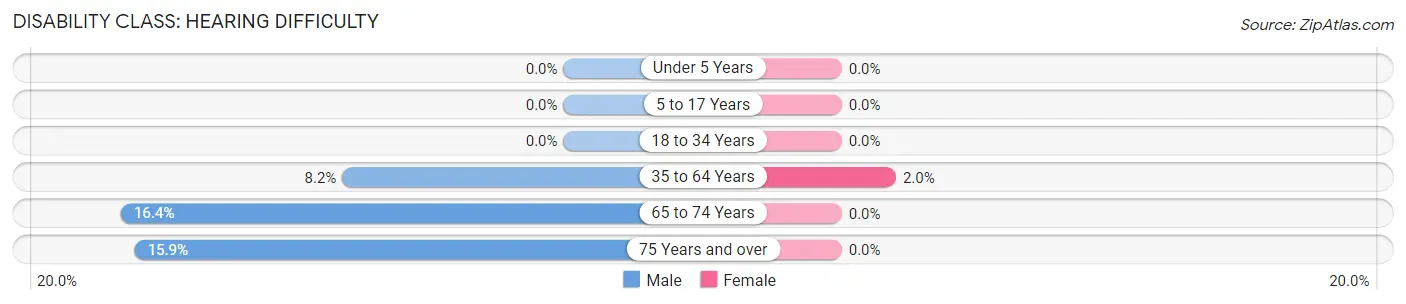
| Age Bracket | Male | Female |
| Under 5 Years | 0 (0.0%) | 0 (0.0%) |
| 5 to 17 Years | 0 (0.0%) | 0 (0.0%) |
| 18 to 34 Years | 0 (0.0%) | 0 (0.0%) |
| 35 to 64 Years | 11 (8.2%) | 3 (2.0%) |
| 65 to 74 Years | 11 (16.4%) | 0 (0.0%) |
| 75 Years and over | 7 (15.9%) | 0 (0.0%) |
Disability Class: Vision Difficulty
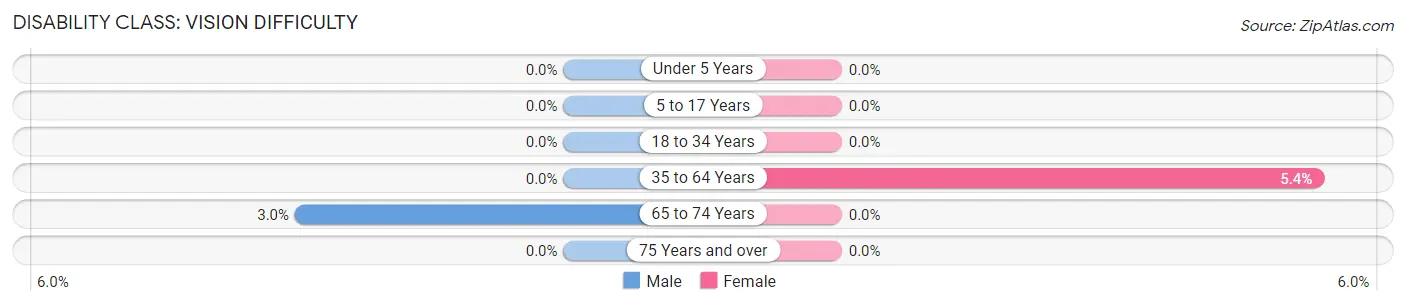
| Age Bracket | Male | Female |
| Under 5 Years | 0 (0.0%) | 0 (0.0%) |
| 5 to 17 Years | 0 (0.0%) | 0 (0.0%) |
| 18 to 34 Years | 0 (0.0%) | 0 (0.0%) |
| 35 to 64 Years | 0 (0.0%) | 8 (5.4%) |
| 65 to 74 Years | 2 (3.0%) | 0 (0.0%) |
| 75 Years and over | 0 (0.0%) | 0 (0.0%) |
Disability Class: Cognitive Difficulty
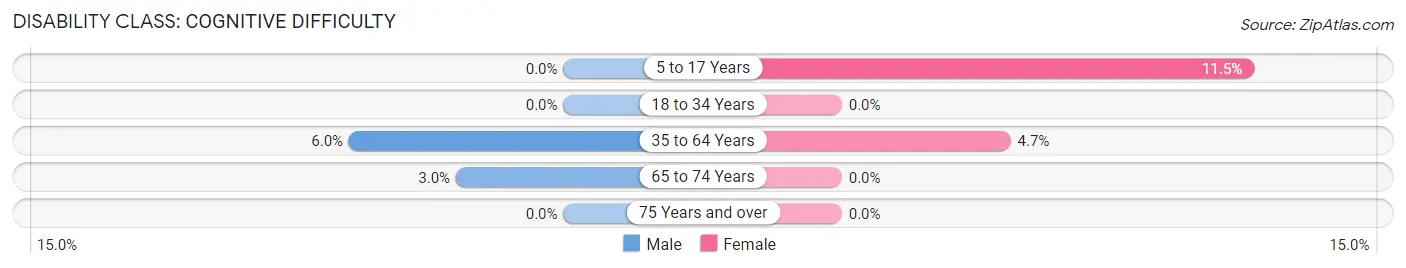
| Age Bracket | Male | Female |
| 5 to 17 Years | 0 (0.0%) | 7 (11.5%) |
| 18 to 34 Years | 0 (0.0%) | 0 (0.0%) |
| 35 to 64 Years | 8 (6.0%) | 7 (4.7%) |
| 65 to 74 Years | 2 (3.0%) | 0 (0.0%) |
| 75 Years and over | 0 (0.0%) | 0 (0.0%) |
Disability Class: Ambulatory Difficulty
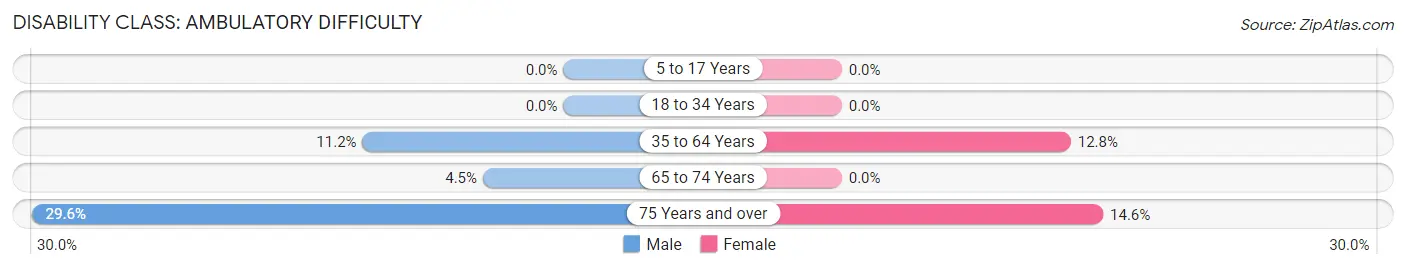
| Age Bracket | Male | Female |
| 5 to 17 Years | 0 (0.0%) | 0 (0.0%) |
| 18 to 34 Years | 0 (0.0%) | 0 (0.0%) |
| 35 to 64 Years | 15 (11.2%) | 19 (12.8%) |
| 65 to 74 Years | 3 (4.5%) | 0 (0.0%) |
| 75 Years and over | 13 (29.5%) | 8 (14.5%) |
Disability Class: Self-Care Difficulty
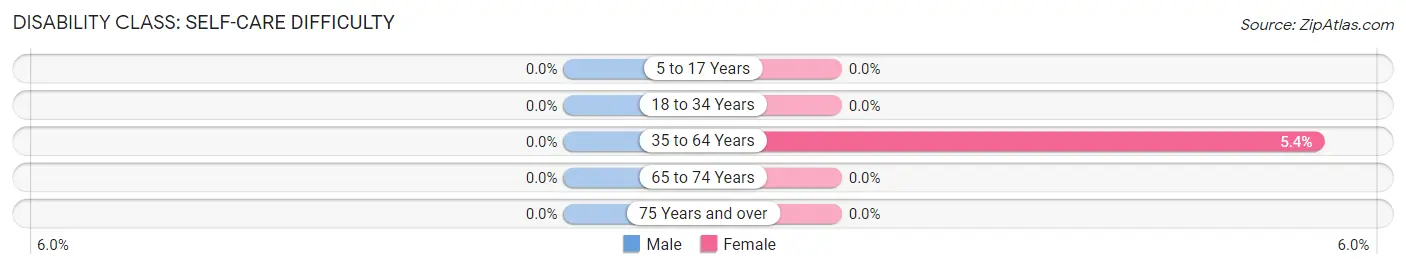
| Age Bracket | Male | Female |
| 5 to 17 Years | 0 (0.0%) | 0 (0.0%) |
| 18 to 34 Years | 0 (0.0%) | 0 (0.0%) |
| 35 to 64 Years | 0 (0.0%) | 8 (5.4%) |
| 65 to 74 Years | 0 (0.0%) | 0 (0.0%) |
| 75 Years and over | 0 (0.0%) | 0 (0.0%) |
Technology Access in Odebolt
Computing Device Access in Odebolt
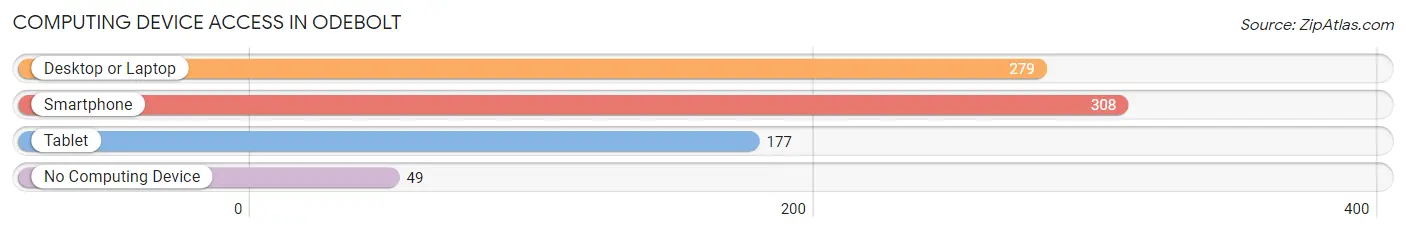
| Device Type | # Households | % Households |
| Desktop or Laptop | 279 | 73.8% |
| Smartphone | 308 | 81.5% |
| Tablet | 177 | 46.8% |
| No Computing Device | 49 | 13.0% |
| Total | 378 | 100.0% |
Internet Access in Odebolt
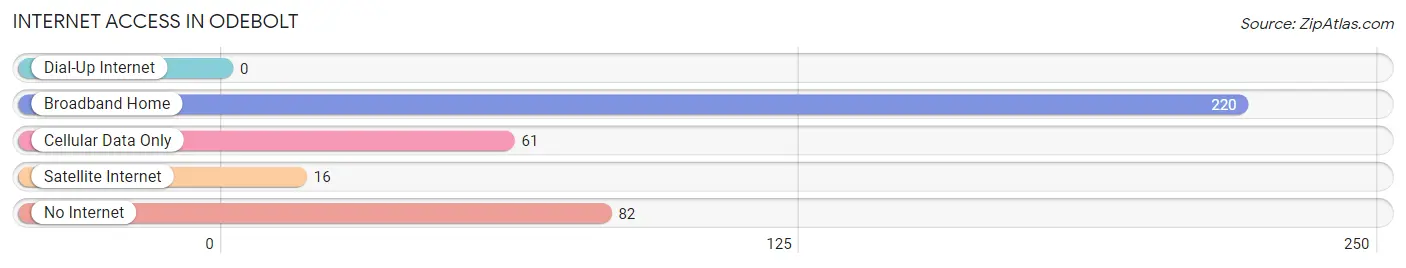
| Internet Type | # Households | % Households |
| Dial-Up Internet | 0 | 0.0% |
| Broadband Home | 220 | 58.2% |
| Cellular Data Only | 61 | 16.1% |
| Satellite Internet | 16 | 4.2% |
| No Internet | 82 | 21.7% |
| Total | 378 | 100.0% |
Odebolt Summary
Odebolt, Iowa is a small town located in Sac County, Iowa. It is situated in the rolling hills of the Loess Hills region of the state, and is home to a population of just over 1,000 people. The town was founded in 1881 and has a rich history of agriculture, industry, and community.
Geography
Odebolt is located in the Loess Hills region of Iowa, which is characterized by rolling hills and deep ravines. The town is situated on the banks of the Little Sioux River, which flows through the center of town. The town is surrounded by farmland, and is located approximately 20 miles south of the city of Sioux City.
Economy
Odebolt’s economy is largely based on agriculture. The town is home to several large farms, and the surrounding area is known for its production of corn, soybeans, and hogs. In addition to agriculture, the town is also home to several small businesses, including a grocery store, a hardware store, and a few restaurants.
Demographics
As of the 2010 census, the population of Odebolt was 1,039. The racial makeup of the town was 97.3% White, 0.3% African American, 0.2% Native American, 0.2% Asian, 0.1% Pacific Islander, 0.7% from other races, and 1.2% from two or more races. Hispanic or Latino of any race were 1.7% of the population.
The median income for a household in Odebolt was $41,250, and the median income for a family was $48,750. The per capita income for the town was $19,945. About 8.2% of families and 10.2% of the population were below the poverty line, including 13.2% of those under age 18 and 8.3% of those age 65 or over.
History
Odebolt was founded in 1881 by a group of settlers from Germany. The town was named after a German nobleman, Count Odebolt, who had donated money to the settlers to help them establish the town. The town quickly grew, and by the early 1900s, it had become a thriving agricultural center.
In the early 1900s, Odebolt was home to several businesses, including a flour mill, a creamery, a lumber yard, and a blacksmith shop. The town also had a railroad station, which connected it to the larger cities of Sioux City and Des Moines.
In the 1950s, Odebolt began to experience a decline in population as many of its residents moved away in search of better economic opportunities. However, the town has since experienced a resurgence, and today it is home to a vibrant community of farmers, business owners, and families.
Conclusion
Odebolt, Iowa is a small town with a rich history and a vibrant community. The town is situated in the rolling hills of the Loess Hills region of the state, and is home to a population of just over 1,000 people. The town’s economy is largely based on agriculture, and it is home to several small businesses. Odebolt is a great place to live, work, and raise a family.
Common Questions
What is the Total Population of Odebolt?
Total Population of Odebolt is 873.
What is the Total Male Population of Odebolt?
Total Male Population of Odebolt is 439.
What is the Total Female Population of Odebolt?
Total Female Population of Odebolt is 434.
What is the Ratio of Males per 100 Females in Odebolt?
There are 101.15 Males per 100 Females in Odebolt.
What is the Ratio of Females per 100 Males in Odebolt?
There are 98.86 Females per 100 Males in Odebolt.
What is the Median Population Age in Odebolt?
Median Population Age in Odebolt is 52.0 Years.
What is the Average Family Size in Odebolt
Average Family Size in Odebolt is 2.7 People.
What is the Average Household Size in Odebolt
Average Household Size in Odebolt is 2.2 People.
What is Per Capita Income in Odebolt?
Per Capita income in Odebolt is $37,587.
What is the Median Family Income in Odebolt?
Median Family Income in Odebolt is $72,143.
What is the Median Household income in Odebolt?
Median Household Income in Odebolt is $65,417.
What is Income or Wage Gap in Odebolt?
Income or Wage Gap in Odebolt is 37.5%.
Women in Odebolt earn 62.5 cents for every dollar earned by a man.
What is Inequality or Gini Index in Odebolt?
Inequality or Gini Index in Odebolt is 0.50.
How Large is the Labor Force in Odebolt?
There are 393 People in the Labor Forcein in Odebolt.
What is the Percentage of People in the Labor Force in Odebolt?
57.4% of People are in the Labor Force in Odebolt.
What is the Unemployment Rate in Odebolt?
Unemployment Rate in Odebolt is 3.8%.