Mondamin, IA Map & Demographics
Mondamin Map
Mondamin Overview
$33,370
PER CAPITA INCOME
$75,000
AVG FAMILY INCOME
$71,354
AVG HOUSEHOLD INCOME
24.7%
WAGE / INCOME GAP [ % ]
75.3¢/ $1
WAGE / INCOME GAP [ $ ]
0.37
INEQUALITY / GINI INDEX
389
TOTAL POPULATION
188
MALE POPULATION
201
FEMALE POPULATION
93.53
MALES / 100 FEMALES
106.91
FEMALES / 100 MALES
40.4
MEDIAN AGE
2.8
AVG FAMILY SIZE
2.3
AVG HOUSEHOLD SIZE
233
LABOR FORCE [ PEOPLE ]
68.7%
PERCENT IN LABOR FORCE
6.4%
UNEMPLOYMENT RATE
Mondamin Zip Codes
Mondamin Area Codes
Income in Mondamin
Income Overview in Mondamin
Per Capita Income in Mondamin is $33,370, while median incomes of families and households are $75,000 and $71,354 respectively.
| Characteristic | Number | Measure |
| Per Capita Income | 389 | $33,370 |
| Median Family Income | 112 | $75,000 |
| Mean Family Income | 112 | $87,438 |
| Median Household Income | 171 | $71,354 |
| Mean Household Income | 171 | $75,905 |
| Income Deficit | 112 | $0 |
| Wage / Income Gap (%) | 389 | 24.65% |
| Wage / Income Gap ($) | 389 | 75.35¢ per $1 |
| Gini / Inequality Index | 389 | 0.37 |
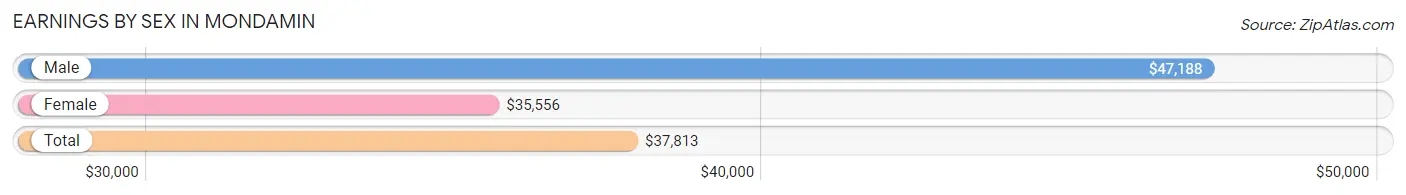
Earnings by Sex in Mondamin
Average Earnings in Mondamin are $37,813, $47,188 for men and $35,556 for women, a difference of 24.6%.
| Sex | Number | Average Earnings |
| Male | 139 (58.2%) | $47,188 |
| Female | 100 (41.8%) | $35,556 |
| Total | 239 (100.0%) | $37,813 |
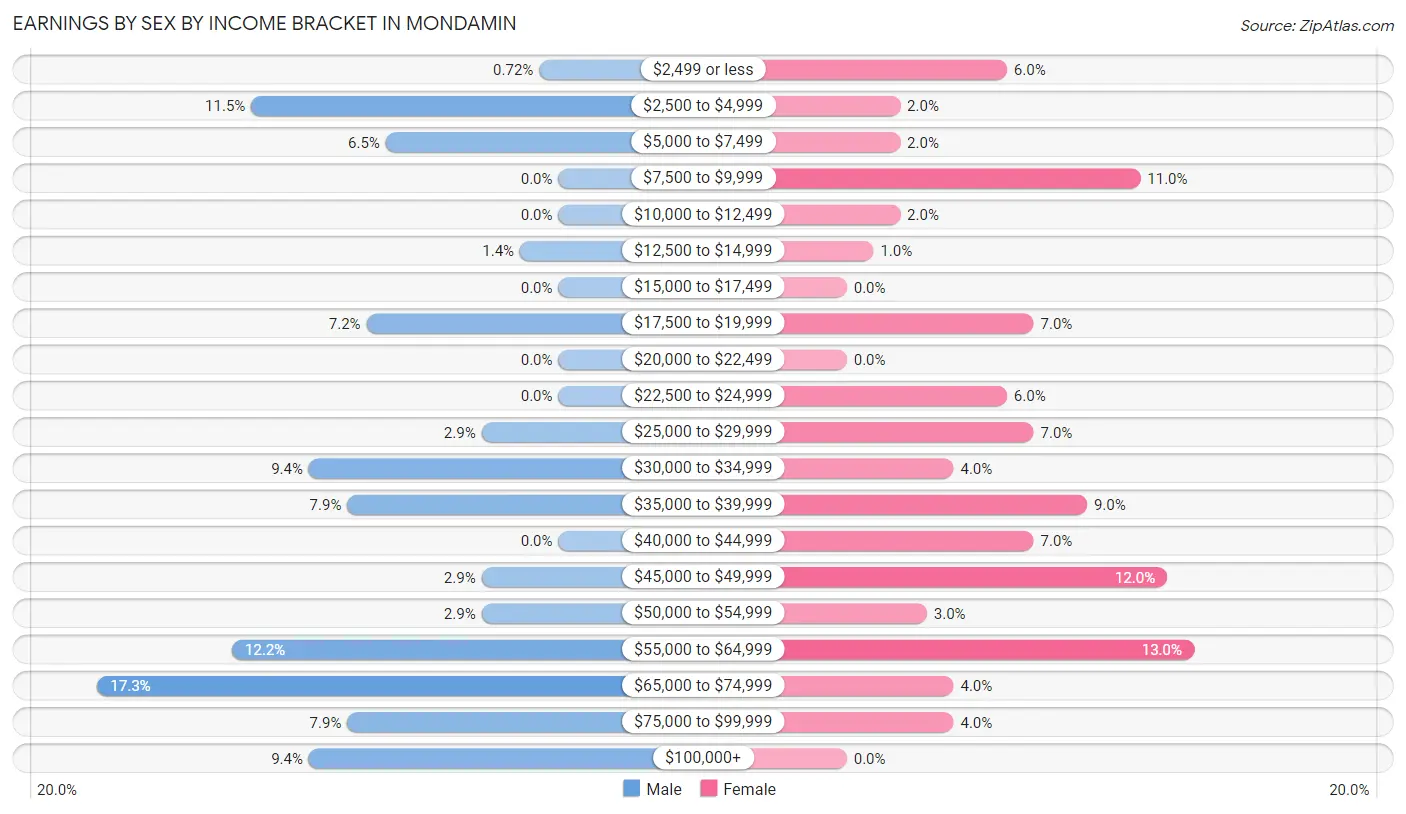
Earnings by Sex by Income Bracket in Mondamin
The most common earnings brackets in Mondamin are $65,000 to $74,999 for men (24 | 17.3%) and $55,000 to $64,999 for women (13 | 13.0%).
| Income | Male | Female |
| $2,499 or less | 1 (0.7%) | 6 (6.0%) |
| $2,500 to $4,999 | 16 (11.5%) | 2 (2.0%) |
| $5,000 to $7,499 | 9 (6.5%) | 2 (2.0%) |
| $7,500 to $9,999 | 0 (0.0%) | 11 (11.0%) |
| $10,000 to $12,499 | 0 (0.0%) | 2 (2.0%) |
| $12,500 to $14,999 | 2 (1.4%) | 1 (1.0%) |
| $15,000 to $17,499 | 0 (0.0%) | 0 (0.0%) |
| $17,500 to $19,999 | 10 (7.2%) | 7 (7.0%) |
| $20,000 to $22,499 | 0 (0.0%) | 0 (0.0%) |
| $22,500 to $24,999 | 0 (0.0%) | 6 (6.0%) |
| $25,000 to $29,999 | 4 (2.9%) | 7 (7.0%) |
| $30,000 to $34,999 | 13 (9.3%) | 4 (4.0%) |
| $35,000 to $39,999 | 11 (7.9%) | 9 (9.0%) |
| $40,000 to $44,999 | 0 (0.0%) | 7 (7.0%) |
| $45,000 to $49,999 | 4 (2.9%) | 12 (12.0%) |
| $50,000 to $54,999 | 4 (2.9%) | 3 (3.0%) |
| $55,000 to $64,999 | 17 (12.2%) | 13 (13.0%) |
| $65,000 to $74,999 | 24 (17.3%) | 4 (4.0%) |
| $75,000 to $99,999 | 11 (7.9%) | 4 (4.0%) |
| $100,000+ | 13 (9.3%) | 0 (0.0%) |
| Total | 139 (100.0%) | 100 (100.0%) |
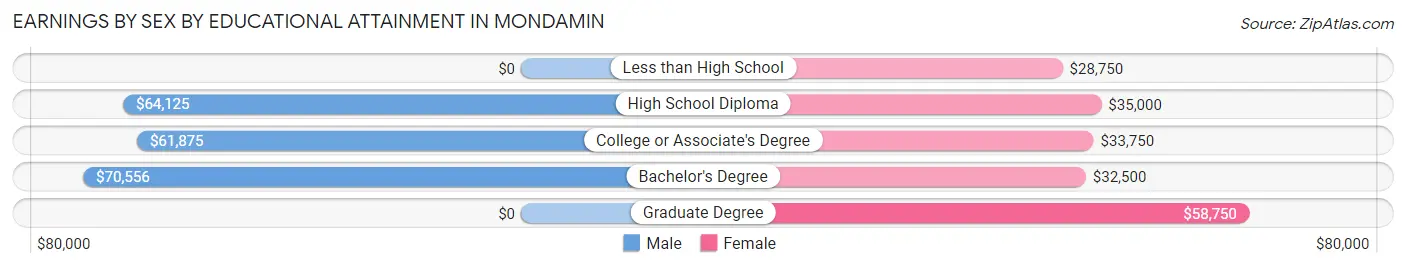
Earnings by Sex by Educational Attainment in Mondamin
Average earnings in Mondamin are $64,205 for men and $35,139 for women, a difference of 45.3%. Men with an educational attainment of bachelor's degree enjoy the highest average annual earnings of $70,556, while those with college or associate's degree education earn the least with $61,875. Women with an educational attainment of graduate degree earn the most with the average annual earnings of $58,750, while those with less than high school education have the smallest earnings of $28,750.
| Educational Attainment | Male Income | Female Income |
| Less than High School | - | - |
| High School Diploma | $64,125 | $35,000 |
| College or Associate's Degree | $61,875 | $33,750 |
| Bachelor's Degree | $70,556 | $32,500 |
| Graduate Degree | - | - |
| Total | $64,205 | $35,139 |
Family Income in Mondamin
Family Income Brackets in Mondamin
According to the Mondamin family income data, there are 29 families falling into the $50,000 to $74,999 income range, which is the most common income bracket and makes up 25.9% of all families. Conversely, the $25,000 to $34,999 income bracket is the least frequent group with only 1 families (0.9%) belonging to this category.
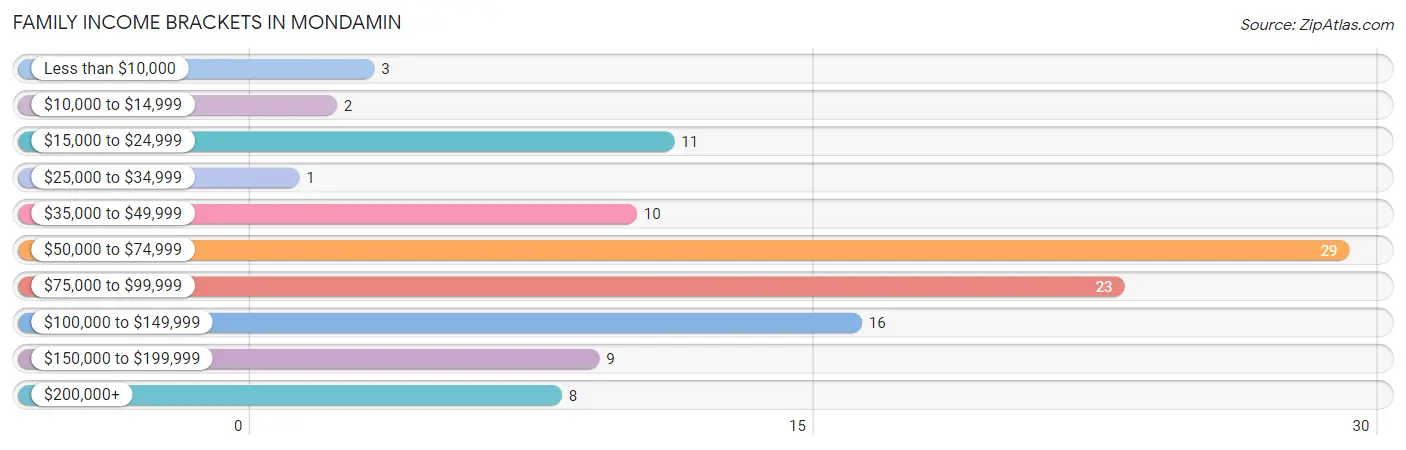
| Income Bracket | # Families | % Families |
| Less than $10,000 | 3 | 2.7% |
| $10,000 to $14,999 | 2 | 1.8% |
| $15,000 to $24,999 | 11 | 9.8% |
| $25,000 to $34,999 | 1 | 0.9% |
| $35,000 to $49,999 | 10 | 8.9% |
| $50,000 to $74,999 | 29 | 25.9% |
| $75,000 to $99,999 | 23 | 20.5% |
| $100,000 to $149,999 | 16 | 14.3% |
| $150,000 to $199,999 | 9 | 8.0% |
| $200,000+ | 8 | 7.1% |
Family Income by Famaliy Size in Mondamin
3-person families (34 | 30.4%) account for the highest median family income in Mondamin with $80,714 per family, while 2-person families (53 | 47.3%) have the highest median income of $37,344 per family member.
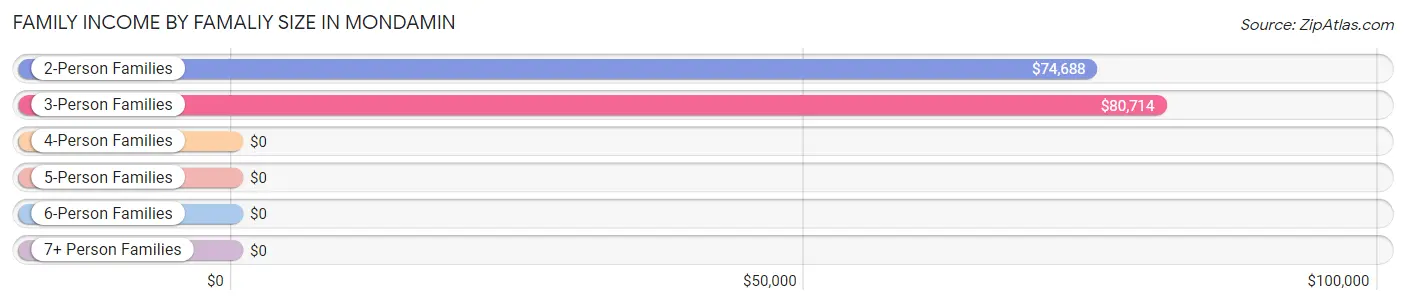
| Income Bracket | # Families | Median Income |
| 2-Person Families | 53 (47.3%) | $74,688 |
| 3-Person Families | 34 (30.4%) | $80,714 |
| 4-Person Families | 22 (19.6%) | $0 |
| 5-Person Families | 1 (0.9%) | $0 |
| 6-Person Families | 0 (0.0%) | $0 |
| 7+ Person Families | 2 (1.8%) | $0 |
| Total | 112 (100.0%) | $75,000 |
Family Income by Number of Earners in Mondamin
The median family income in Mondamin is $75,000, with families comprising 3+ earners (19) having the highest median family income of $168,750, while families with no earners (8) have the lowest median family income of $62,500, accounting for 17.0% and 7.1% of families, respectively.
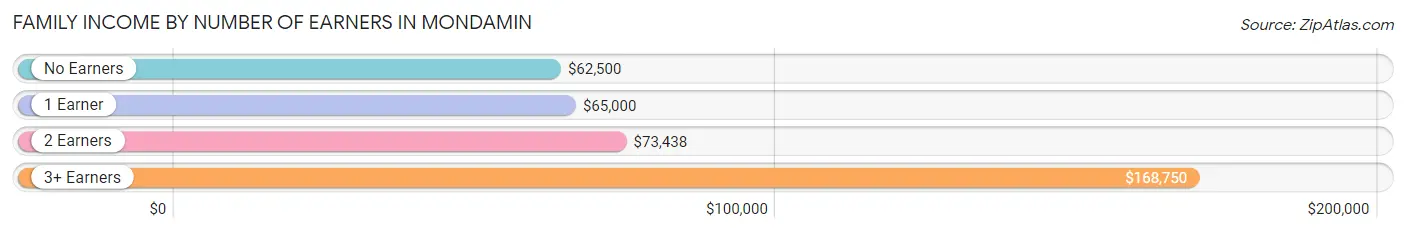
| Number of Earners | # Families | Median Income |
| No Earners | 8 (7.1%) | $62,500 |
| 1 Earner | 44 (39.3%) | $65,000 |
| 2 Earners | 41 (36.6%) | $73,438 |
| 3+ Earners | 19 (17.0%) | $168,750 |
| Total | 112 (100.0%) | $75,000 |
Household Income in Mondamin
Household Income Brackets in Mondamin
With 39 households falling in the category, the $75,000 to $99,999 income range is the most frequent in Mondamin, accounting for 22.8% of all households. In contrast, only 4 households (2.3%) fall into the $10,000 to $14,999 income bracket, making it the least populous group.
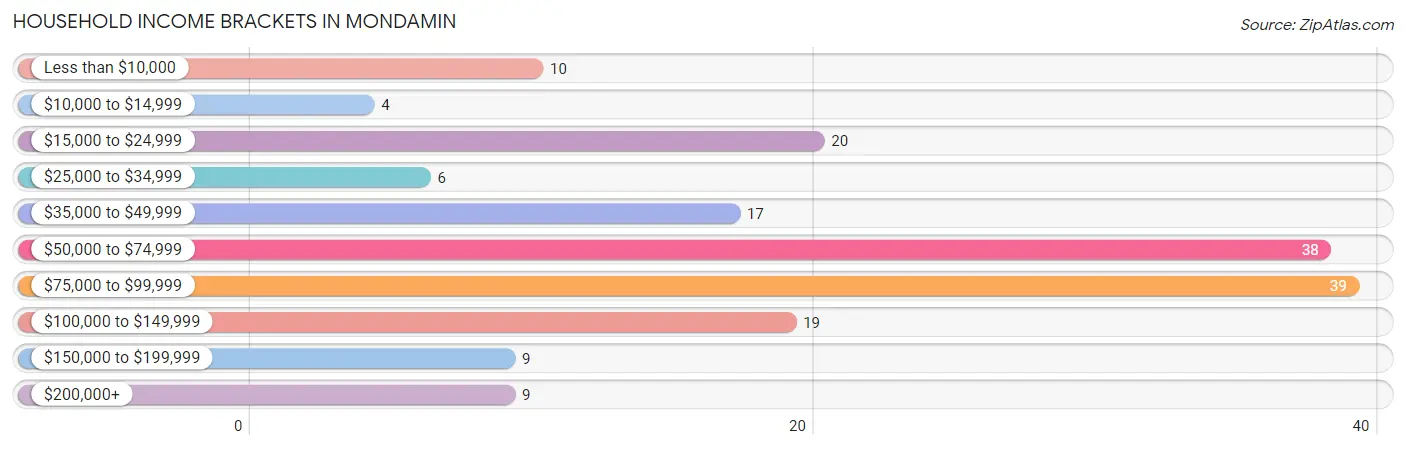
| Income Bracket | # Households | % Households |
| Less than $10,000 | 10 | 5.8% |
| $10,000 to $14,999 | 4 | 2.3% |
| $15,000 to $24,999 | 20 | 11.7% |
| $25,000 to $34,999 | 6 | 3.5% |
| $35,000 to $49,999 | 17 | 9.9% |
| $50,000 to $74,999 | 38 | 22.2% |
| $75,000 to $99,999 | 39 | 22.8% |
| $100,000 to $149,999 | 19 | 11.1% |
| $150,000 to $199,999 | 9 | 5.3% |
| $200,000+ | 9 | 5.3% |
Household Income by Householder Age in Mondamin
The median household income in Mondamin is $71,354, with the highest median household income of $75,000 found in the 45 to 64 years age bracket for the primary householder. A total of 72 households (42.1%) fall into this category. Meanwhile, the 15 to 24 years age bracket for the primary householder has the lowest median household income of $0, with 3 households (1.8%) in this group.
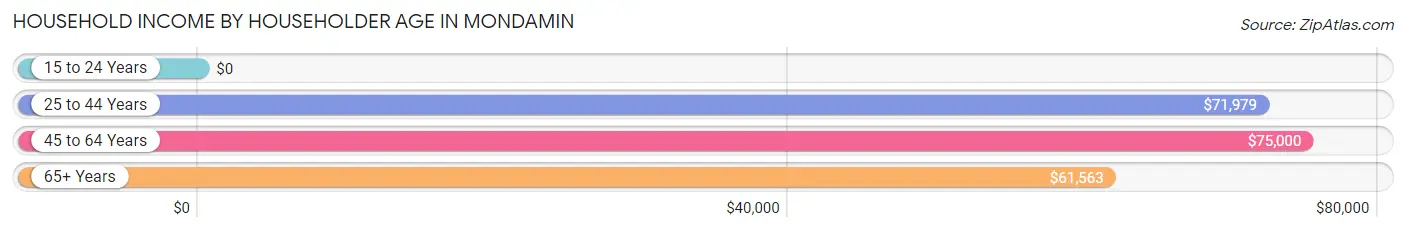
| Income Bracket | # Households | Median Income |
| 15 to 24 Years | 3 (1.8%) | $0 |
| 25 to 44 Years | 59 (34.5%) | $71,979 |
| 45 to 64 Years | 72 (42.1%) | $75,000 |
| 65+ Years | 37 (21.6%) | $61,563 |
| Total | 171 (100.0%) | $71,354 |
Poverty in Mondamin
Income Below Poverty by Sex and Age in Mondamin
With 3.7% poverty level for males and 16.9% for females among the residents of Mondamin, 6 to 11 year old males and 5 year old females are the most vulnerable to poverty, with 4 males (66.7%) and 5 females (83.3%) in their respective age groups living below the poverty level.
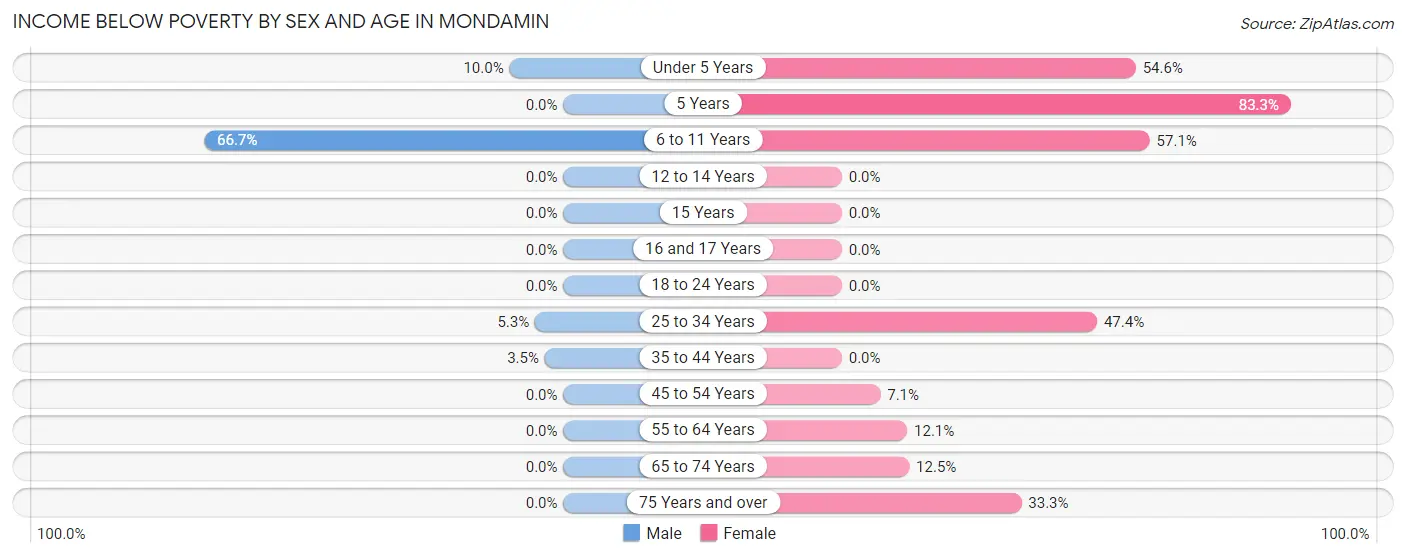
| Age Bracket | Male | Female |
| Under 5 Years | 1 (10.0%) | 6 (54.5%) |
| 5 Years | 0 (0.0%) | 5 (83.3%) |
| 6 to 11 Years | 4 (66.7%) | 4 (57.1%) |
| 12 to 14 Years | 0 (0.0%) | 0 (0.0%) |
| 15 Years | 0 (0.0%) | 0 (0.0%) |
| 16 and 17 Years | 0 (0.0%) | 0 (0.0%) |
| 18 to 24 Years | 0 (0.0%) | 0 (0.0%) |
| 25 to 34 Years | 1 (5.3%) | 9 (47.4%) |
| 35 to 44 Years | 1 (3.5%) | 0 (0.0%) |
| 45 to 54 Years | 0 (0.0%) | 2 (7.1%) |
| 55 to 64 Years | 0 (0.0%) | 4 (12.1%) |
| 65 to 74 Years | 0 (0.0%) | 2 (12.5%) |
| 75 Years and over | 0 (0.0%) | 2 (33.3%) |
| Total | 7 (3.7%) | 34 (16.9%) |
Income Above Poverty by Sex and Age in Mondamin
According to the poverty statistics in Mondamin, males aged 5 years and females aged 12 to 14 years are the age groups that are most secure financially, with 100.0% of males and 100.0% of females in these age groups living above the poverty line.
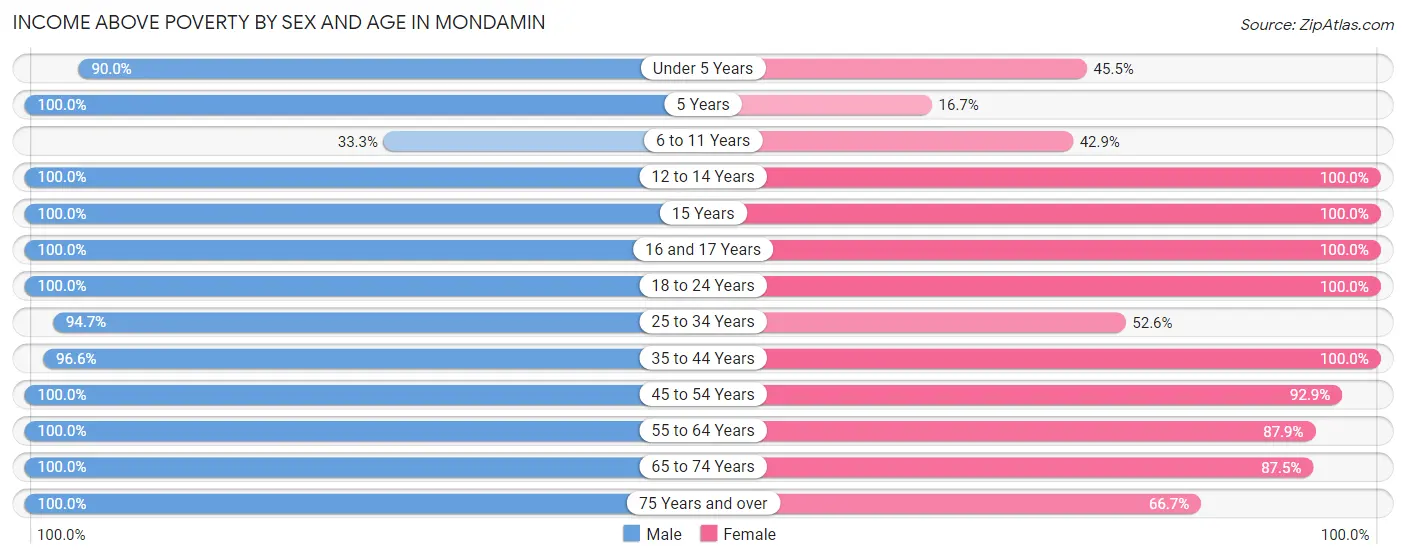
| Age Bracket | Male | Female |
| Under 5 Years | 9 (90.0%) | 5 (45.5%) |
| 5 Years | 2 (100.0%) | 1 (16.7%) |
| 6 to 11 Years | 2 (33.3%) | 3 (42.9%) |
| 12 to 14 Years | 2 (100.0%) | 3 (100.0%) |
| 15 Years | 2 (100.0%) | 1 (100.0%) |
| 16 and 17 Years | 11 (100.0%) | 20 (100.0%) |
| 18 to 24 Years | 25 (100.0%) | 22 (100.0%) |
| 25 to 34 Years | 18 (94.7%) | 10 (52.6%) |
| 35 to 44 Years | 28 (96.6%) | 29 (100.0%) |
| 45 to 54 Years | 30 (100.0%) | 26 (92.9%) |
| 55 to 64 Years | 25 (100.0%) | 29 (87.9%) |
| 65 to 74 Years | 13 (100.0%) | 14 (87.5%) |
| 75 Years and over | 14 (100.0%) | 4 (66.7%) |
| Total | 181 (96.3%) | 167 (83.1%) |
Income Below Poverty Among Married-Couple Families in Mondamin
The poverty statistics for married-couple families in Mondamin show that 2.4% or 2 of the total 85 families live below the poverty line. Families with 5 or more children have the highest poverty rate of 100.0%, comprising of 2 families. On the other hand, families with no children have the lowest poverty rate of 0.0%, which includes 0 families.
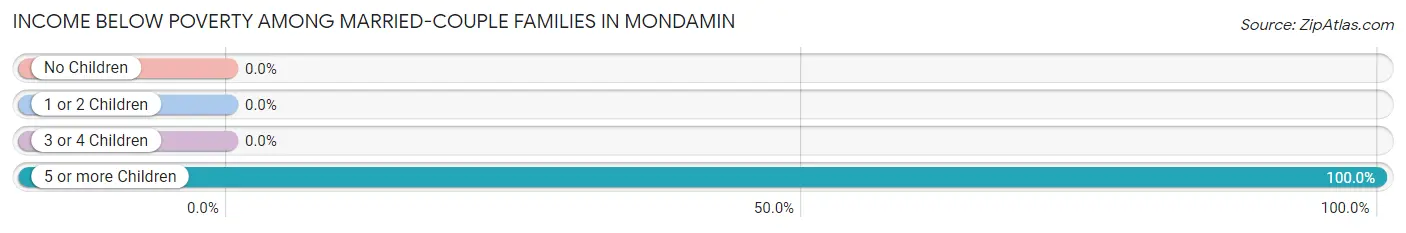
| Children | Above Poverty | Below Poverty |
| No Children | 59 (100.0%) | 0 (0.0%) |
| 1 or 2 Children | 23 (100.0%) | 0 (0.0%) |
| 3 or 4 Children | 1 (100.0%) | 0 (0.0%) |
| 5 or more Children | 0 (0.0%) | 2 (100.0%) |
| Total | 83 (97.7%) | 2 (2.4%) |
Income Below Poverty Among Single-Parent Households in Mondamin
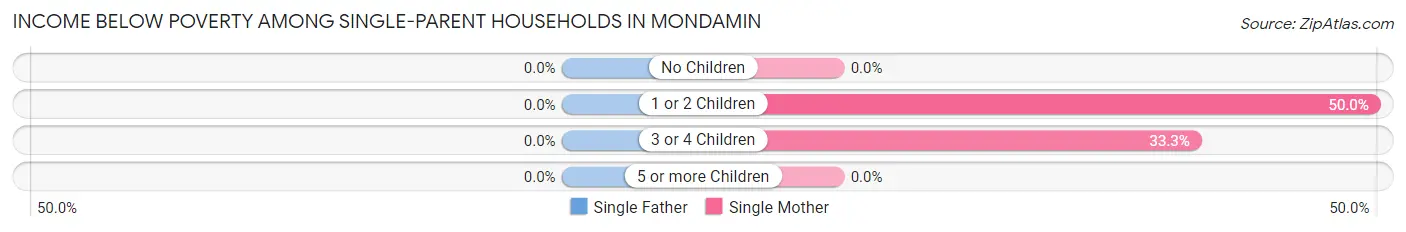
| Children | Single Father | Single Mother |
| No Children | 0 (0.0%) | 0 (0.0%) |
| 1 or 2 Children | 0 (0.0%) | 3 (50.0%) |
| 3 or 4 Children | 0 (0.0%) | 2 (33.3%) |
| 5 or more Children | 0 (0.0%) | 0 (0.0%) |
| Total | 0 (0.0%) | 5 (29.4%) |
Income Below Poverty Among Married-Couple vs Single-Parent Households in Mondamin
The poverty data for Mondamin shows that 2 of the married-couple family households (2.4%) and 5 of the single-parent households (18.5%) are living below the poverty level. Within the married-couple family households, those with 5 or more children have the highest poverty rate, with 2 households (100.0%) falling below the poverty line. Among the single-parent households, those with 3 or 4 children have the highest poverty rate, with 2 household (33.3%) living below poverty.
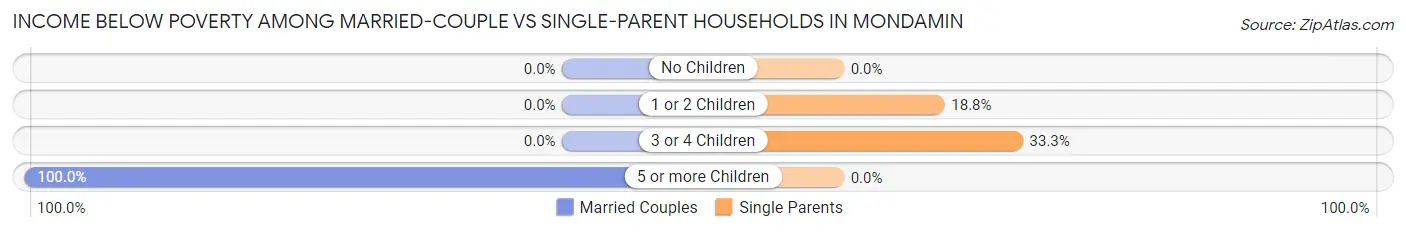
| Children | Married-Couple Families | Single-Parent Households |
| No Children | 0 (0.0%) | 0 (0.0%) |
| 1 or 2 Children | 0 (0.0%) | 3 (18.8%) |
| 3 or 4 Children | 0 (0.0%) | 2 (33.3%) |
| 5 or more Children | 2 (100.0%) | 0 (0.0%) |
| Total | 2 (2.4%) | 5 (18.5%) |
Race in Mondamin
The most populous races in Mondamin are White / Caucasian (378 | 97.2%), Two or more Races (9 | 2.3%), and Hispanic or Latino (5 | 1.3%).
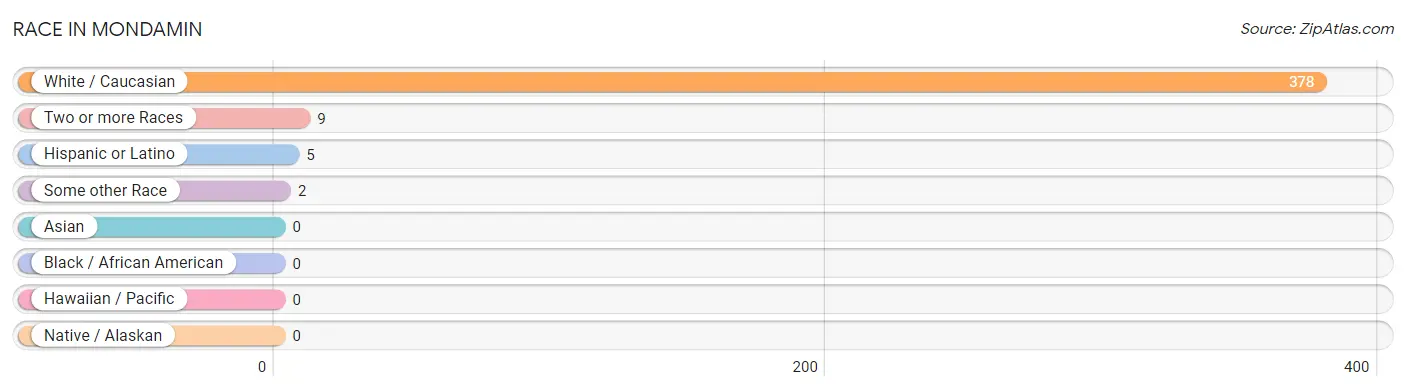
| Race | # Population | % Population |
| Asian | 0 | 0.0% |
| Black / African American | 0 | 0.0% |
| Hawaiian / Pacific | 0 | 0.0% |
| Hispanic or Latino | 5 | 1.3% |
| Native / Alaskan | 0 | 0.0% |
| White / Caucasian | 378 | 97.2% |
| Two or more Races | 9 | 2.3% |
| Some other Race | 2 | 0.5% |
| Total | 389 | 100.0% |
Ancestry in Mondamin
The most populous ancestries reported in Mondamin are German (152 | 39.1%), English (38 | 9.8%), Danish (31 | 8.0%), Irish (26 | 6.7%), and Norwegian (20 | 5.1%), together accounting for 68.6% of all Mondamin residents.
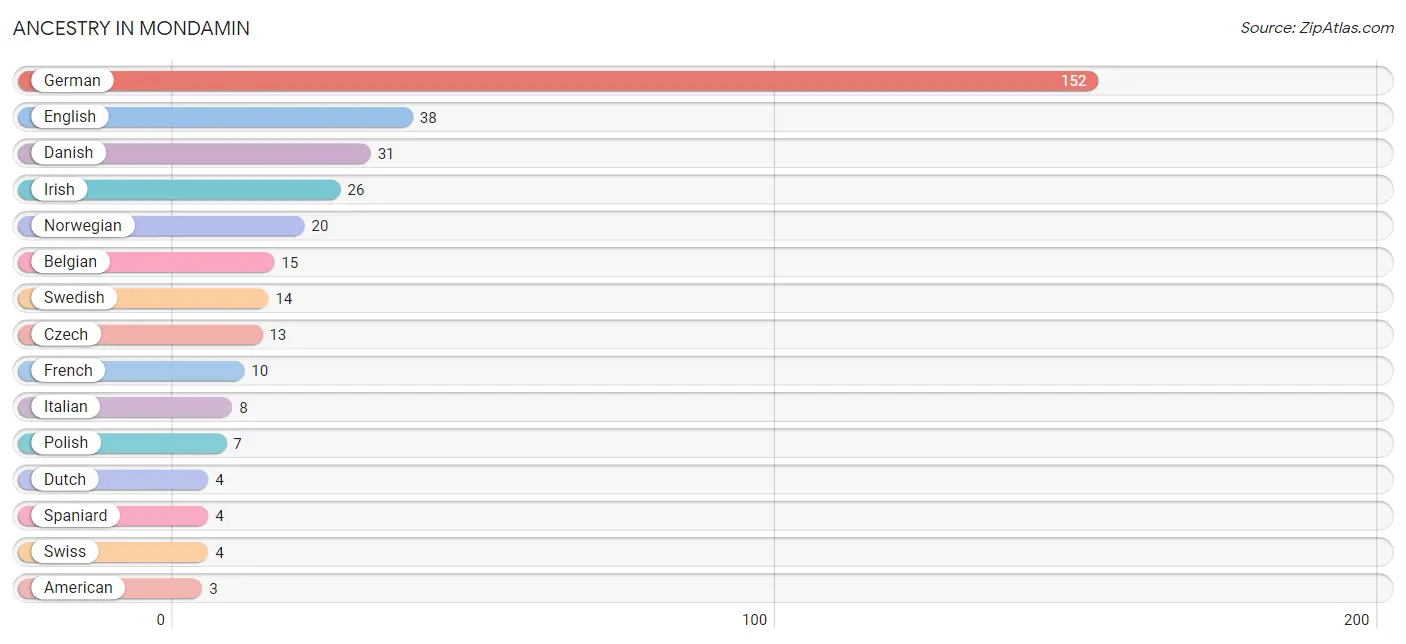
| Ancestry | # Population | % Population |
| American | 3 | 0.8% |
| Belgian | 15 | 3.9% |
| Czech | 13 | 3.3% |
| Danish | 31 | 8.0% |
| Dutch | 4 | 1.0% |
| English | 38 | 9.8% |
| French | 10 | 2.6% |
| French Canadian | 1 | 0.3% |
| German | 152 | 39.1% |
| Irish | 26 | 6.7% |
| Italian | 8 | 2.1% |
| Mexican | 1 | 0.3% |
| Norwegian | 20 | 5.1% |
| Polish | 7 | 1.8% |
| Scottish | 1 | 0.3% |
| Sioux | 3 | 0.8% |
| Spaniard | 4 | 1.0% |
| Swedish | 14 | 3.6% |
| Swiss | 4 | 1.0% |
| Welsh | 3 | 0.8% | View All 20 Rows |
Immigrants in Mondamin
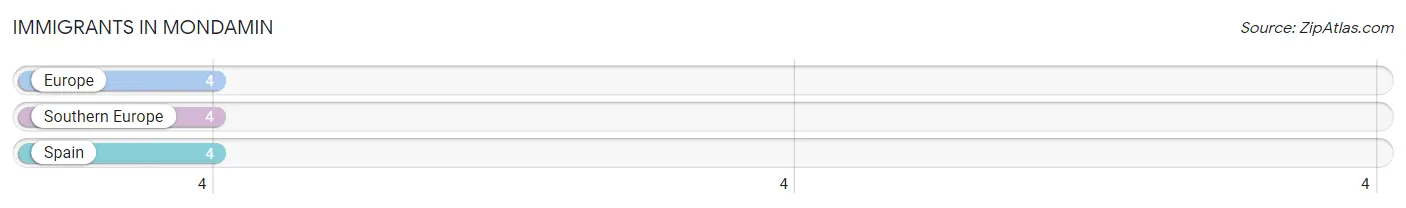
The most numerous immigrant groups reported in Mondamin came from Europe (4 | 1.0%), Southern Europe (4 | 1.0%), and Spain (4 | 1.0%), together accounting for 3.1% of all Mondamin residents.
| Immigration Origin | # Population | % Population |
| Europe | 4 | 1.0% |
| Southern Europe | 4 | 1.0% |
| Spain | 4 | 1.0% | View All 3 Rows |
Sex and Age in Mondamin
Sex and Age in Mondamin
The most populous age groups in Mondamin are 40 to 44 Years (24 | 12.8%) for men and 20 to 24 Years (22 | 11.0%) for women.
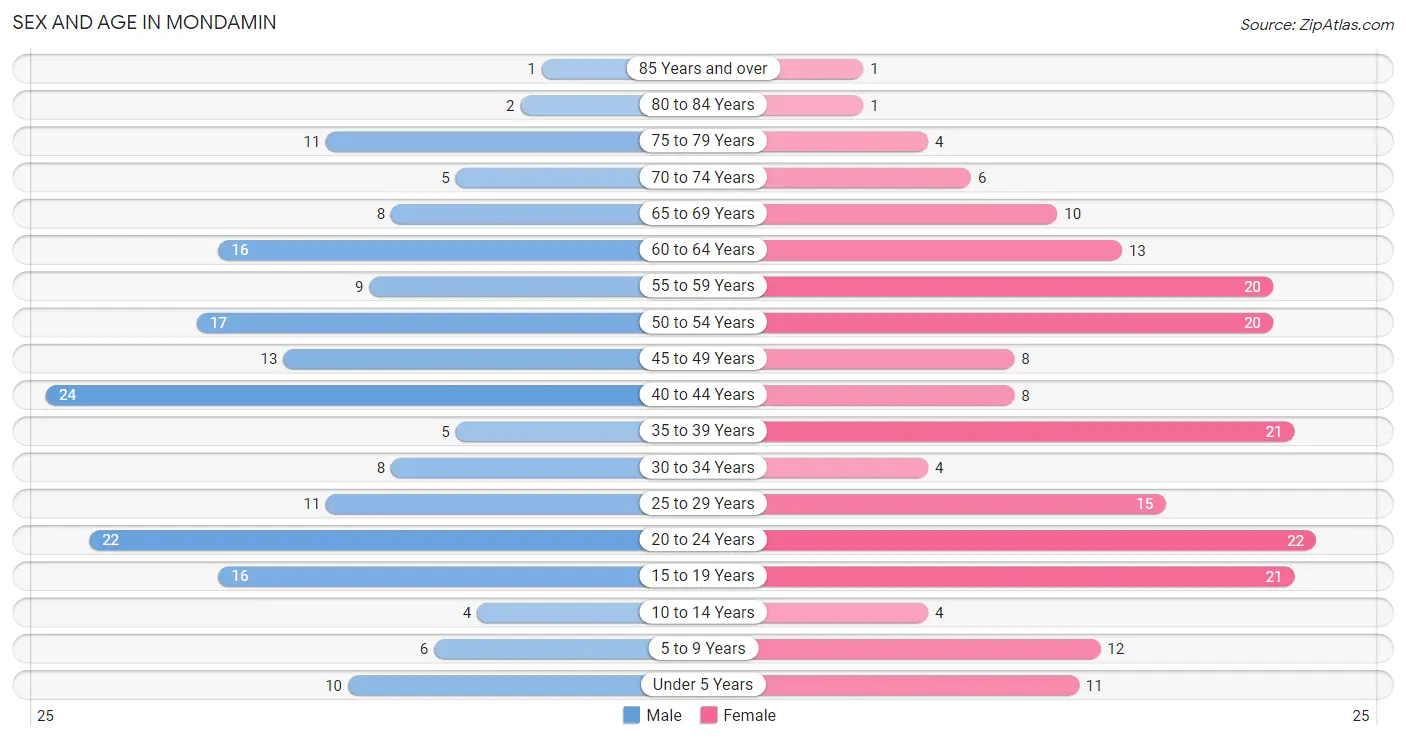
| Age Bracket | Male | Female |
| Under 5 Years | 10 (5.3%) | 11 (5.5%) |
| 5 to 9 Years | 6 (3.2%) | 12 (6.0%) |
| 10 to 14 Years | 4 (2.1%) | 4 (2.0%) |
| 15 to 19 Years | 16 (8.5%) | 21 (10.4%) |
| 20 to 24 Years | 22 (11.7%) | 22 (11.0%) |
| 25 to 29 Years | 11 (5.9%) | 15 (7.5%) |
| 30 to 34 Years | 8 (4.3%) | 4 (2.0%) |
| 35 to 39 Years | 5 (2.7%) | 21 (10.4%) |
| 40 to 44 Years | 24 (12.8%) | 8 (4.0%) |
| 45 to 49 Years | 13 (6.9%) | 8 (4.0%) |
| 50 to 54 Years | 17 (9.0%) | 20 (10.0%) |
| 55 to 59 Years | 9 (4.8%) | 20 (10.0%) |
| 60 to 64 Years | 16 (8.5%) | 13 (6.5%) |
| 65 to 69 Years | 8 (4.3%) | 10 (5.0%) |
| 70 to 74 Years | 5 (2.7%) | 6 (3.0%) |
| 75 to 79 Years | 11 (5.9%) | 4 (2.0%) |
| 80 to 84 Years | 2 (1.1%) | 1 (0.5%) |
| 85 Years and over | 1 (0.5%) | 1 (0.5%) |
| Total | 188 (100.0%) | 201 (100.0%) |
Families and Households in Mondamin
Median Family Size in Mondamin
The median family size in Mondamin is 2.84 persons per family, with married-couple families (85 | 75.9%) accounting for the largest median family size of 2.93 persons per family. On the other hand, single male/father families (10 | 8.9%) represent the smallest median family size with 2.20 persons per family.
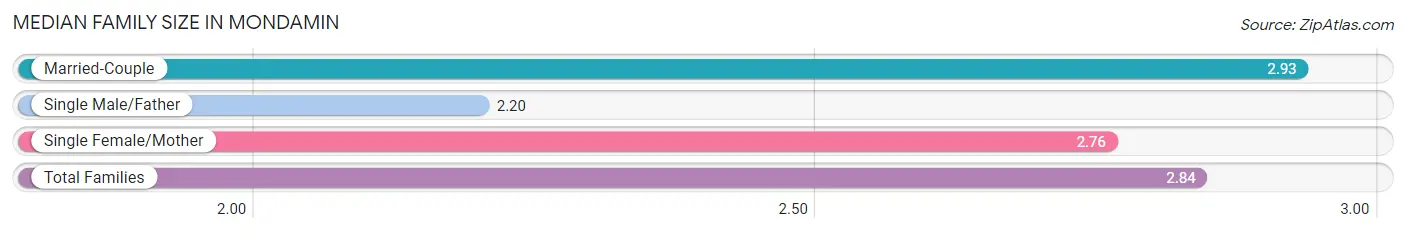
| Family Type | # Families | Family Size |
| Married-Couple | 85 (75.9%) | 2.93 |
| Single Male/Father | 10 (8.9%) | 2.20 |
| Single Female/Mother | 17 (15.2%) | 2.76 |
| Total Families | 112 (100.0%) | 2.84 |
Median Household Size in Mondamin
The median household size in Mondamin is 2.27 persons per household, with single female/mother households (17 | 9.9%) accounting for the largest median household size of 2.94 persons per household. non-family households (59 | 34.5%) represent the smallest median household size with 1.12 persons per household.
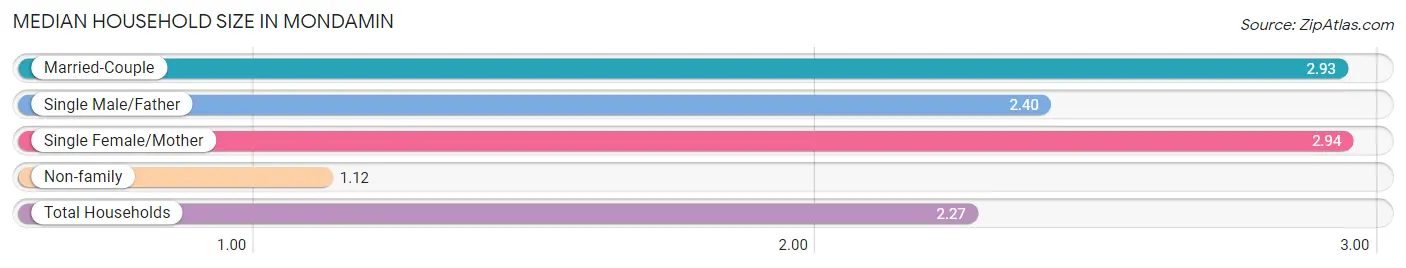
| Household Type | # Households | Household Size |
| Married-Couple | 85 (49.7%) | 2.93 |
| Single Male/Father | 10 (5.9%) | 2.40 |
| Single Female/Mother | 17 (9.9%) | 2.94 |
| Non-family | 59 (34.5%) | 1.12 |
| Total Households | 171 (100.0%) | 2.27 |
Household Size by Marriage Status in Mondamin
Out of a total of 171 households in Mondamin, 112 (65.5%) are family households, while 59 (34.5%) are nonfamily households. The most numerous type of family households are 2-person households, comprising 51, and the most common type of nonfamily households are 1-person households, comprising 52.
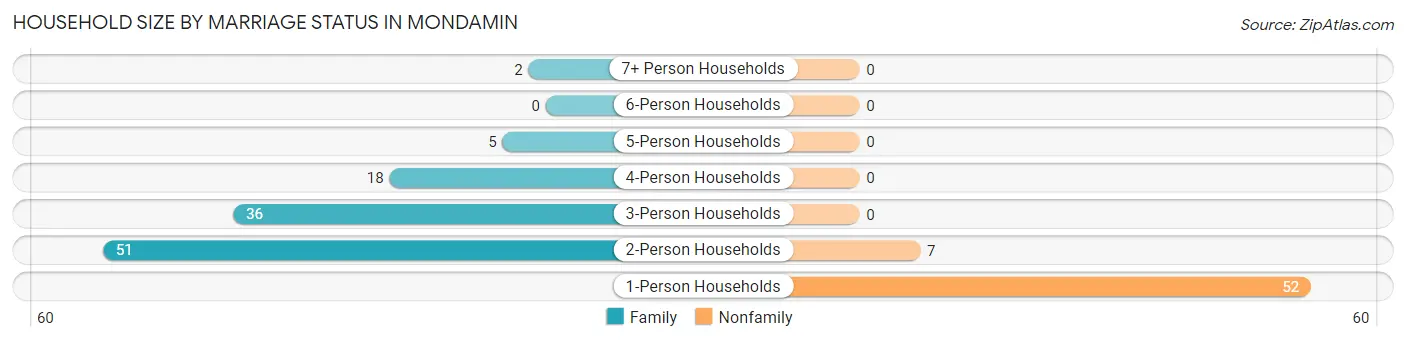
| Household Size | Family Households | Nonfamily Households |
| 1-Person Households | - | 52 (30.4%) |
| 2-Person Households | 51 (29.8%) | 7 (4.1%) |
| 3-Person Households | 36 (21.0%) | 0 (0.0%) |
| 4-Person Households | 18 (10.5%) | 0 (0.0%) |
| 5-Person Households | 5 (2.9%) | 0 (0.0%) |
| 6-Person Households | 0 (0.0%) | 0 (0.0%) |
| 7+ Person Households | 2 (1.2%) | 0 (0.0%) |
| Total | 112 (65.5%) | 59 (34.5%) |
Female Fertility in Mondamin
Fertility by Age in Mondamin
Average fertility rate in Mondamin is 58.0 births per 1,000 women. Women in the age bracket of 20 to 34 years have the highest fertility rate with 146.0 births per 1,000 women. Women in the age bracket of 20 to 34 years acount for 100.0% of all women with births.
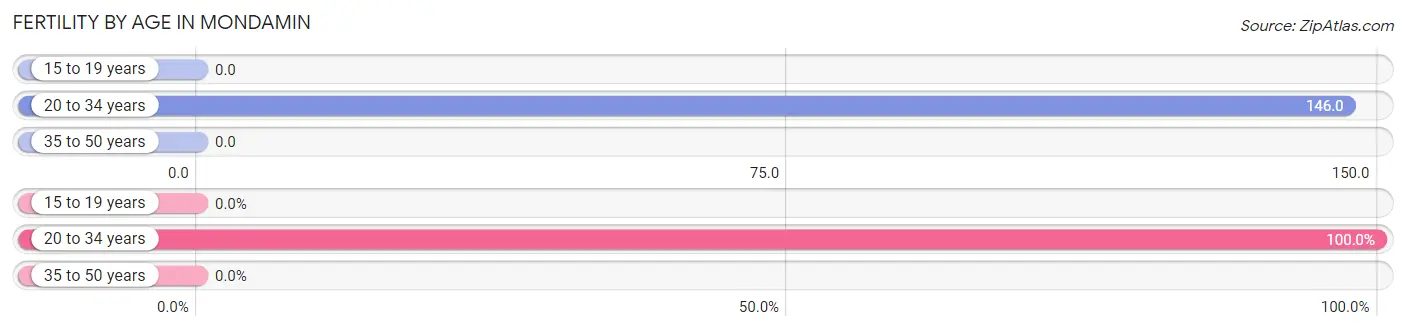
| Age Bracket | Women with Births | Births / 1,000 Women |
| 15 to 19 years | 0 (0.0%) | 0.0 |
| 20 to 34 years | 6 (100.0%) | 146.0 |
| 35 to 50 years | 0 (0.0%) | 0.0 |
| Total | 6 (100.0%) | 58.0 |
Fertility by Age by Marriage Status in Mondamin
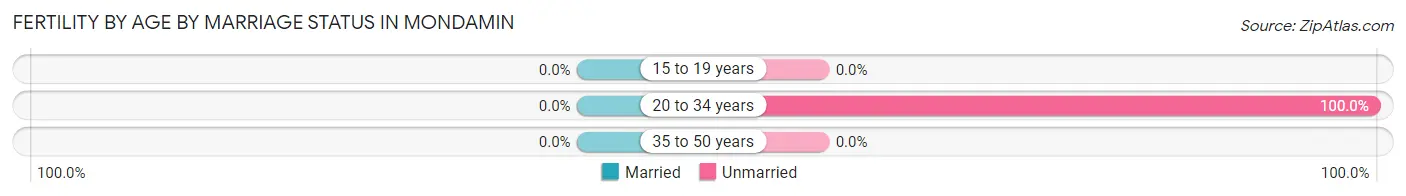
| Age Bracket | Married | Unmarried |
| 15 to 19 years | 0 (0.0%) | 0 (0.0%) |
| 20 to 34 years | 0 (0.0%) | 6 (100.0%) |
| 35 to 50 years | 0 (0.0%) | 0 (0.0%) |
| Total | 0 (0.0%) | 6 (100.0%) |
Fertility by Education in Mondamin
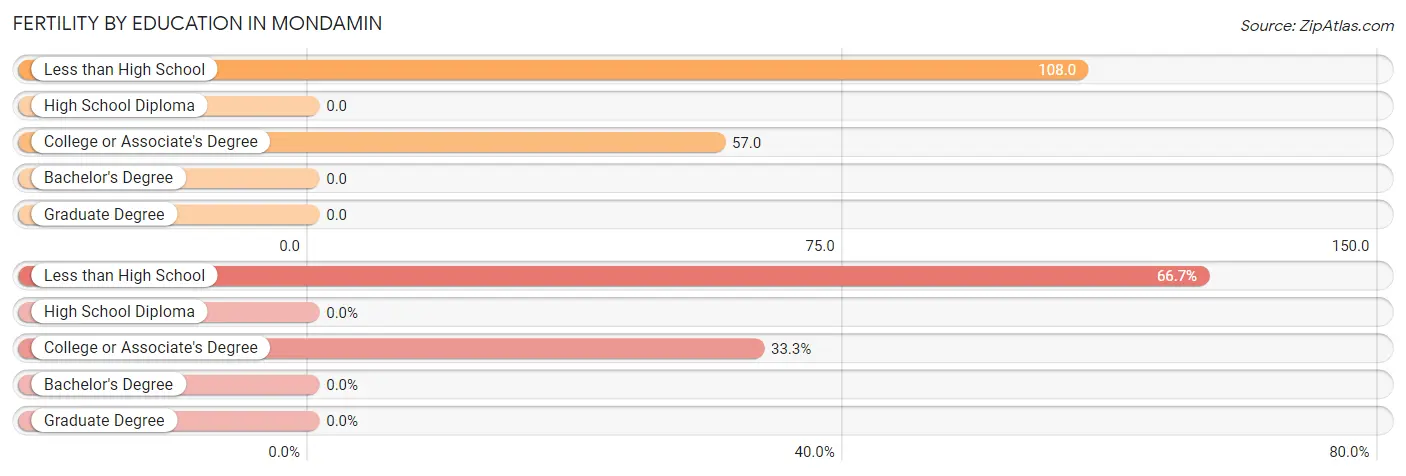
| Educational Attainment | Women with Births | Births / 1,000 Women |
| Less than High School | 4 (66.7%) | 108.0 |
| High School Diploma | 0 (0.0%) | 0.0 |
| College or Associate's Degree | 2 (33.3%) | 57.0 |
| Bachelor's Degree | 0 (0.0%) | 0.0 |
| Graduate Degree | 0 (0.0%) | 0.0 |
| Total | 6 (100.0%) | 58.0 |
Fertility by Education by Marriage Status in Mondamin
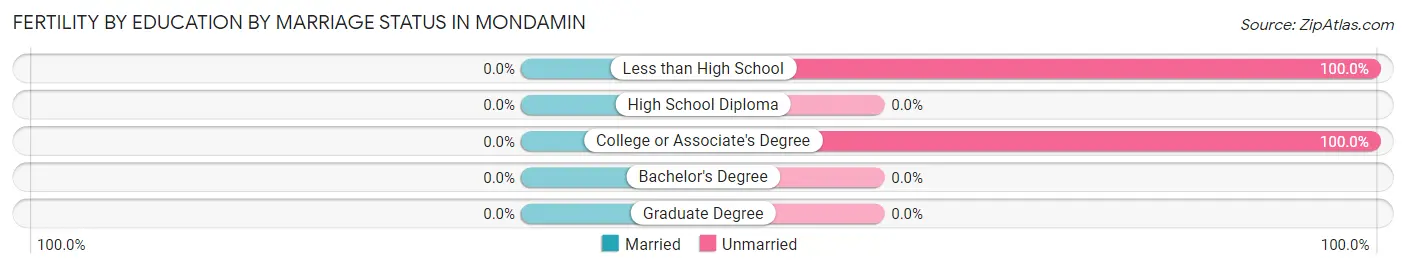
| Educational Attainment | Married | Unmarried |
| Less than High School | 0 (0.0%) | 4 (100.0%) |
| High School Diploma | 0 (0.0%) | 0 (0.0%) |
| College or Associate's Degree | 0 (0.0%) | 2 (100.0%) |
| Bachelor's Degree | 0 (0.0%) | 0 (0.0%) |
| Graduate Degree | 0 (0.0%) | 0 (0.0%) |
| Total | 0 (0.0%) | 6 (100.0%) |
Employment Characteristics in Mondamin
Employment by Class of Employer in Mondamin
Among the 207 employed individuals in Mondamin, private company employees (156 | 75.4%), not-for-profit organizations (16 | 7.7%), and state government employees (12 | 5.8%) make up the most common classes of employment.
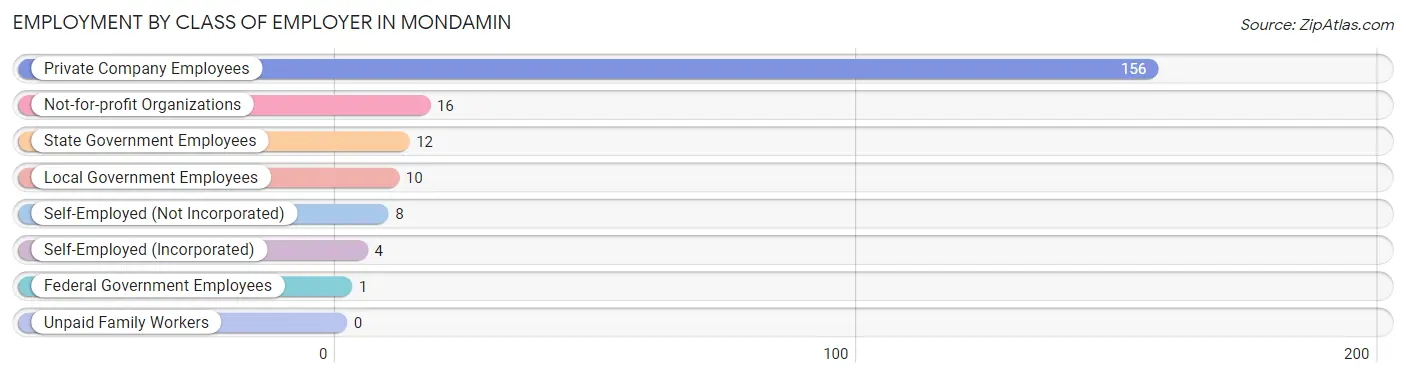
| Employer Class | # Employees | % Employees |
| Private Company Employees | 156 | 75.4% |
| Self-Employed (Incorporated) | 4 | 1.9% |
| Self-Employed (Not Incorporated) | 8 | 3.9% |
| Not-for-profit Organizations | 16 | 7.7% |
| Local Government Employees | 10 | 4.8% |
| State Government Employees | 12 | 5.8% |
| Federal Government Employees | 1 | 0.5% |
| Unpaid Family Workers | 0 | 0.0% |
| Total | 207 | 100.0% |
Employment Status by Age in Mondamin
According to the labor force statistics for Mondamin, out of the total population over 16 years of age (339), 68.7% or 233 individuals are in the labor force, with 6.4% or 15 of them unemployed. The age group with the highest labor force participation rate is 30 to 34 years, with 100.0% or 12 individuals in the labor force. Within the labor force, the 35 to 44 years age range has the highest percentage of unemployed individuals, with 18.9% or 10 of them being unemployed.
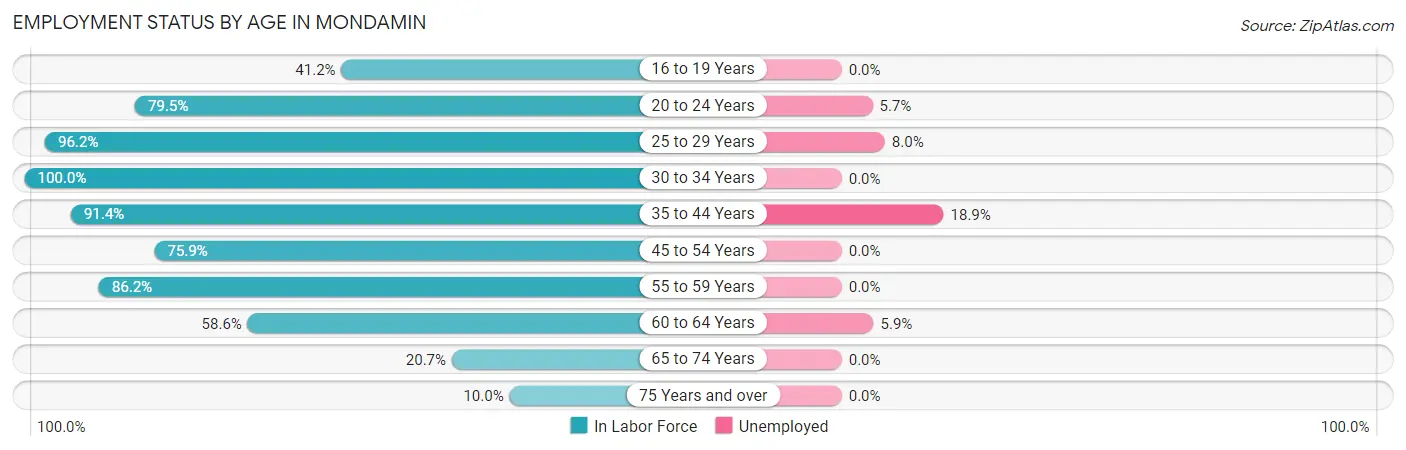
| Age Bracket | In Labor Force | Unemployed |
| 16 to 19 Years | 14 (41.2%) | 0 (0.0%) |
| 20 to 24 Years | 35 (79.5%) | 2 (5.7%) |
| 25 to 29 Years | 25 (96.2%) | 2 (8.0%) |
| 30 to 34 Years | 12 (100.0%) | 0 (0.0%) |
| 35 to 44 Years | 53 (91.4%) | 10 (18.9%) |
| 45 to 54 Years | 44 (75.9%) | 0 (0.0%) |
| 55 to 59 Years | 25 (86.2%) | 0 (0.0%) |
| 60 to 64 Years | 17 (58.6%) | 1 (5.9%) |
| 65 to 74 Years | 6 (20.7%) | 0 (0.0%) |
| 75 Years and over | 2 (10.0%) | 0 (0.0%) |
| Total | 233 (68.7%) | 15 (6.4%) |
Employment Status by Educational Attainment in Mondamin
According to labor force statistics for Mondamin, 83.0% of individuals (176) out of the total population between 25 and 64 years of age (212) are in the labor force, with 7.4% or 13 of them being unemployed. The group with the highest labor force participation rate are those with the educational attainment of bachelor's degree or higher, with 100.0% or 34 individuals in the labor force. Within the labor force, individuals with bachelor's degree or higher education have the highest percentage of unemployment, with 14.7% or 5 of them being unemployed.
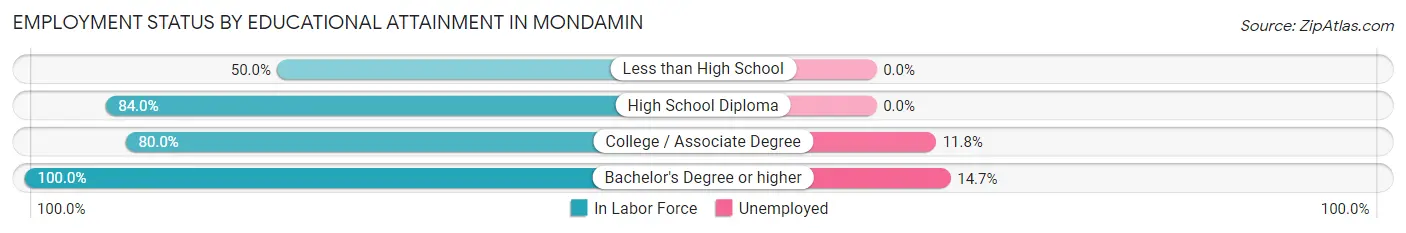
| Educational Attainment | In Labor Force | Unemployed |
| Less than High School | 6 (50.0%) | 0 (0.0%) |
| High School Diploma | 68 (84.0%) | 0 (0.0%) |
| College / Associate Degree | 68 (80.0%) | 10 (11.8%) |
| Bachelor's Degree or higher | 34 (100.0%) | 5 (14.7%) |
| Total | 176 (83.0%) | 16 (7.4%) |
Employment Occupations by Sex in Mondamin
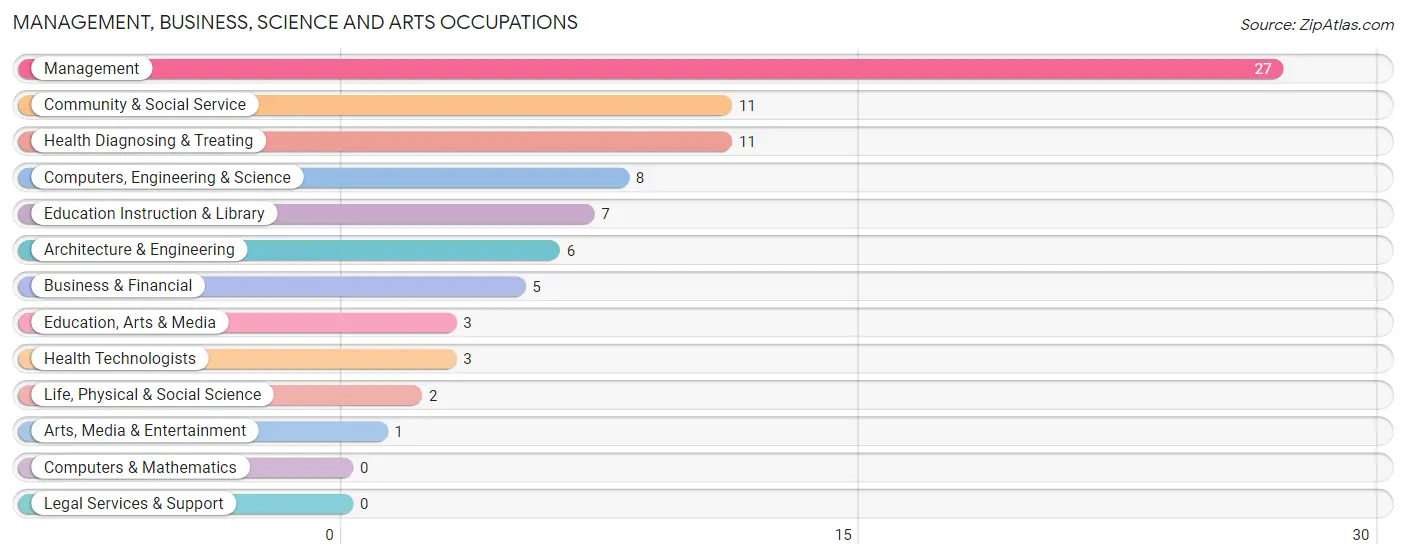
Management, Business, Science and Arts Occupations
The most common Management, Business, Science and Arts occupations in Mondamin are Management (27 | 12.4%), Community & Social Service (11 | 5.1%), Health Diagnosing & Treating (11 | 5.1%), Computers, Engineering & Science (8 | 3.7%), and Education Instruction & Library (7 | 3.2%).
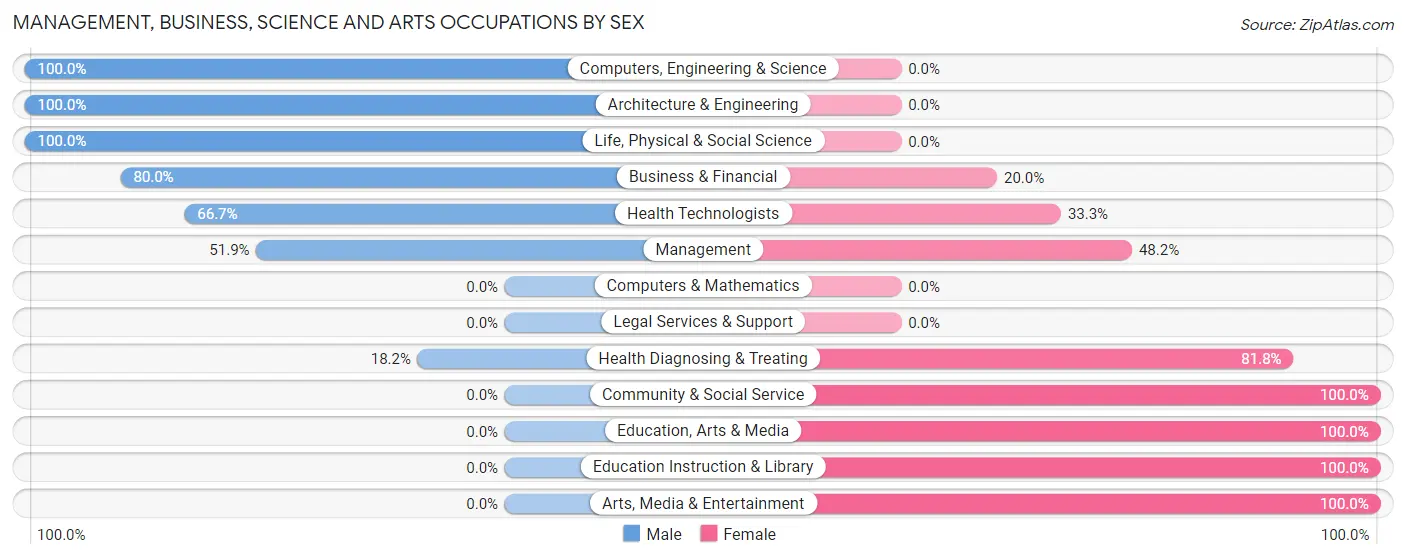
Management, Business, Science and Arts Occupations by Sex
Within the Management, Business, Science and Arts occupations in Mondamin, the most male-oriented occupations are Computers, Engineering & Science (100.0%), Architecture & Engineering (100.0%), and Life, Physical & Social Science (100.0%), while the most female-oriented occupations are Community & Social Service (100.0%), Education, Arts & Media (100.0%), and Education Instruction & Library (100.0%).
| Occupation | Male | Female |
| Management | 14 (51.8%) | 13 (48.1%) |
| Business & Financial | 4 (80.0%) | 1 (20.0%) |
| Computers, Engineering & Science | 8 (100.0%) | 0 (0.0%) |
| Computers & Mathematics | 0 (0.0%) | 0 (0.0%) |
| Architecture & Engineering | 6 (100.0%) | 0 (0.0%) |
| Life, Physical & Social Science | 2 (100.0%) | 0 (0.0%) |
| Community & Social Service | 0 (0.0%) | 11 (100.0%) |
| Education, Arts & Media | 0 (0.0%) | 3 (100.0%) |
| Legal Services & Support | 0 (0.0%) | 0 (0.0%) |
| Education Instruction & Library | 0 (0.0%) | 7 (100.0%) |
| Arts, Media & Entertainment | 0 (0.0%) | 1 (100.0%) |
| Health Diagnosing & Treating | 2 (18.2%) | 9 (81.8%) |
| Health Technologists | 2 (66.7%) | 1 (33.3%) |
| Total (Category) | 28 (45.2%) | 34 (54.8%) |
| Total (Overall) | 130 (59.6%) | 88 (40.4%) |
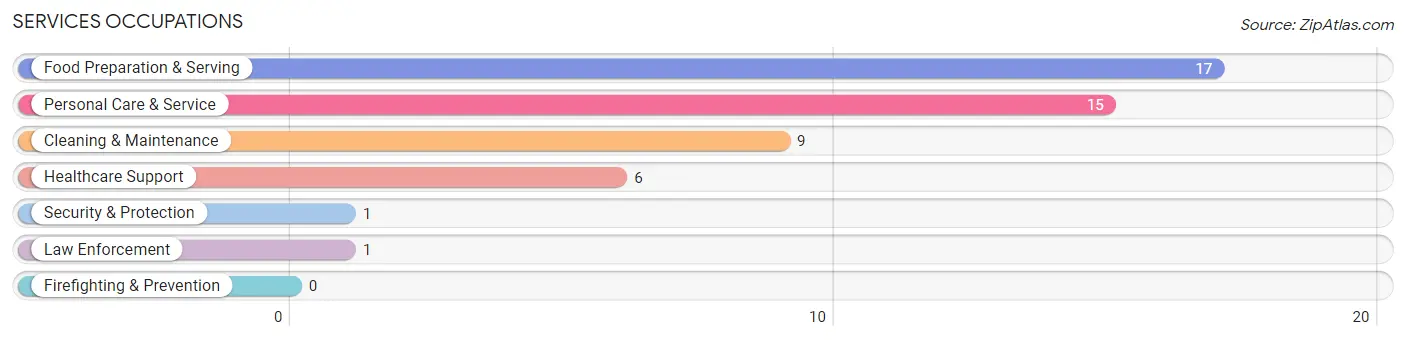
Services Occupations
The most common Services occupations in Mondamin are Food Preparation & Serving (17 | 7.8%), Personal Care & Service (15 | 6.9%), Cleaning & Maintenance (9 | 4.1%), Healthcare Support (6 | 2.8%), and Security & Protection (1 | 0.5%).
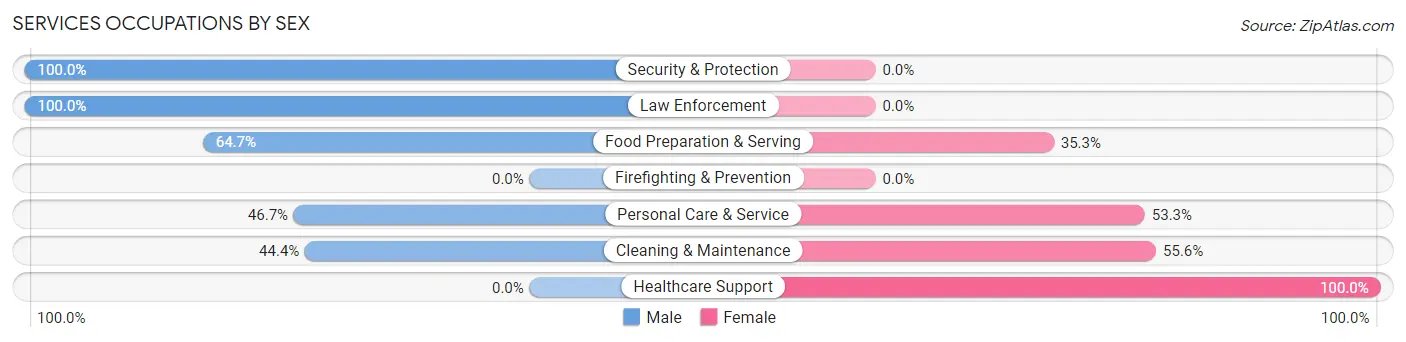
Services Occupations by Sex
Within the Services occupations in Mondamin, the most male-oriented occupations are Security & Protection (100.0%), Law Enforcement (100.0%), and Food Preparation & Serving (64.7%), while the most female-oriented occupations are Healthcare Support (100.0%), Cleaning & Maintenance (55.6%), and Personal Care & Service (53.3%).
| Occupation | Male | Female |
| Healthcare Support | 0 (0.0%) | 6 (100.0%) |
| Security & Protection | 1 (100.0%) | 0 (0.0%) |
| Firefighting & Prevention | 0 (0.0%) | 0 (0.0%) |
| Law Enforcement | 1 (100.0%) | 0 (0.0%) |
| Food Preparation & Serving | 11 (64.7%) | 6 (35.3%) |
| Cleaning & Maintenance | 4 (44.4%) | 5 (55.6%) |
| Personal Care & Service | 7 (46.7%) | 8 (53.3%) |
| Total (Category) | 23 (47.9%) | 25 (52.1%) |
| Total (Overall) | 130 (59.6%) | 88 (40.4%) |
Sales and Office Occupations
The most common Sales and Office occupations in Mondamin are Office & Administration (25 | 11.5%), and Sales & Related (8 | 3.7%).
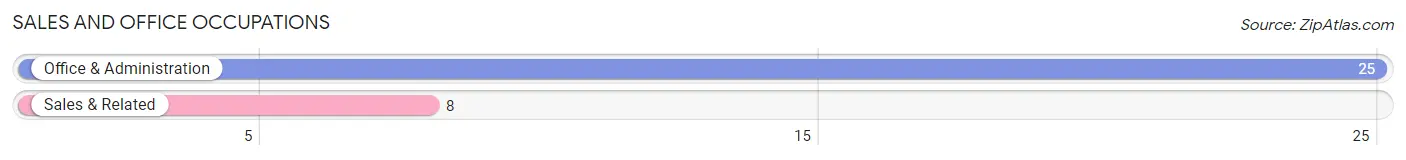
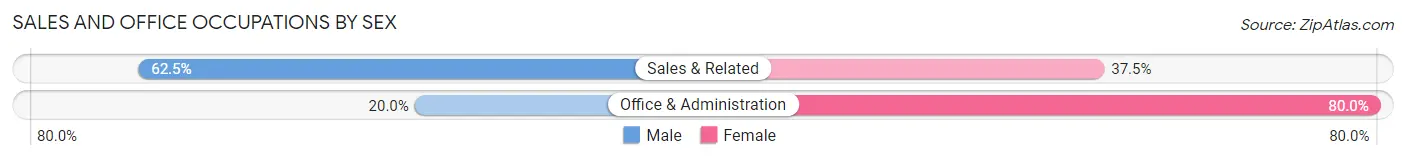
Sales and Office Occupations by Sex
| Occupation | Male | Female |
| Sales & Related | 5 (62.5%) | 3 (37.5%) |
| Office & Administration | 5 (20.0%) | 20 (80.0%) |
| Total (Category) | 10 (30.3%) | 23 (69.7%) |
| Total (Overall) | 130 (59.6%) | 88 (40.4%) |
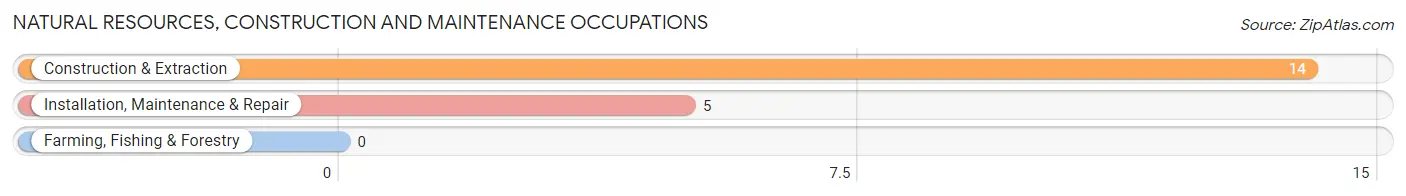
Natural Resources, Construction and Maintenance Occupations
The most common Natural Resources, Construction and Maintenance occupations in Mondamin are Construction & Extraction (14 | 6.4%), and Installation, Maintenance & Repair (5 | 2.3%).
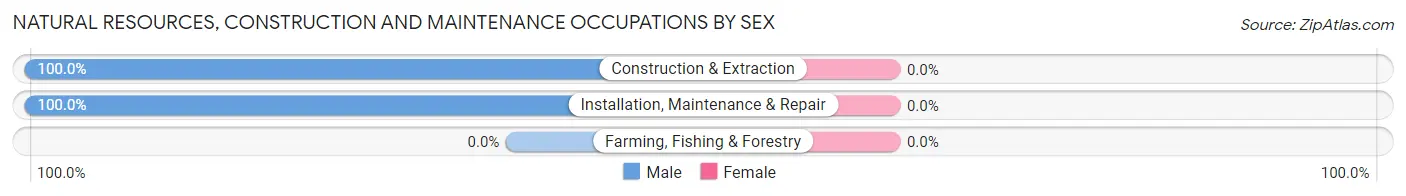
Natural Resources, Construction and Maintenance Occupations by Sex
| Occupation | Male | Female |
| Farming, Fishing & Forestry | 0 (0.0%) | 0 (0.0%) |
| Construction & Extraction | 14 (100.0%) | 0 (0.0%) |
| Installation, Maintenance & Repair | 5 (100.0%) | 0 (0.0%) |
| Total (Category) | 19 (100.0%) | 0 (0.0%) |
| Total (Overall) | 130 (59.6%) | 88 (40.4%) |
Production, Transportation and Moving Occupations
The most common Production, Transportation and Moving occupations in Mondamin are Transportation (29 | 13.3%), Production (22 | 10.1%), and Material Moving (5 | 2.3%).
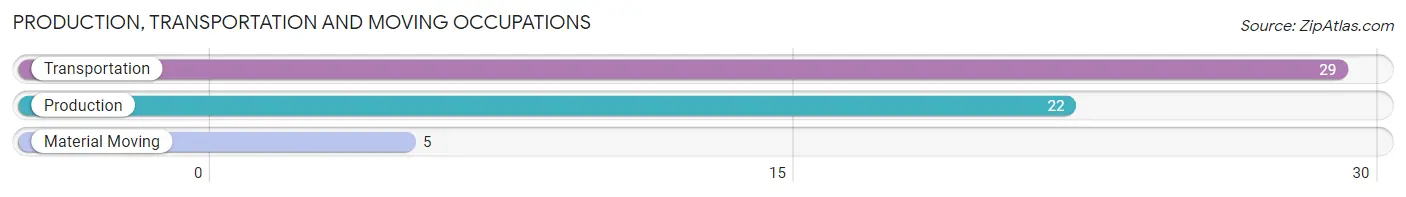
Production, Transportation and Moving Occupations by Sex
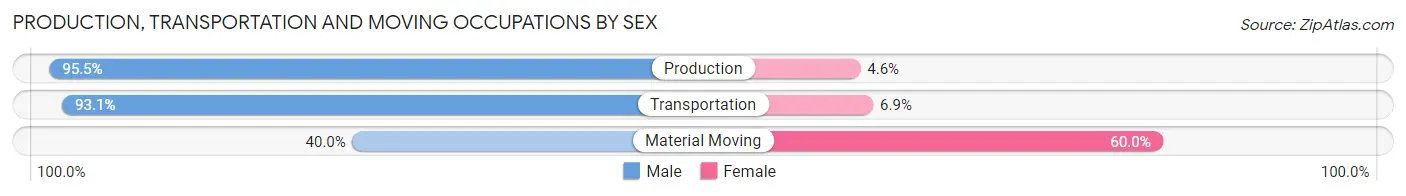
| Occupation | Male | Female |
| Production | 21 (95.5%) | 1 (4.5%) |
| Transportation | 27 (93.1%) | 2 (6.9%) |
| Material Moving | 2 (40.0%) | 3 (60.0%) |
| Total (Category) | 50 (89.3%) | 6 (10.7%) |
| Total (Overall) | 130 (59.6%) | 88 (40.4%) |
Employment Industries by Sex in Mondamin
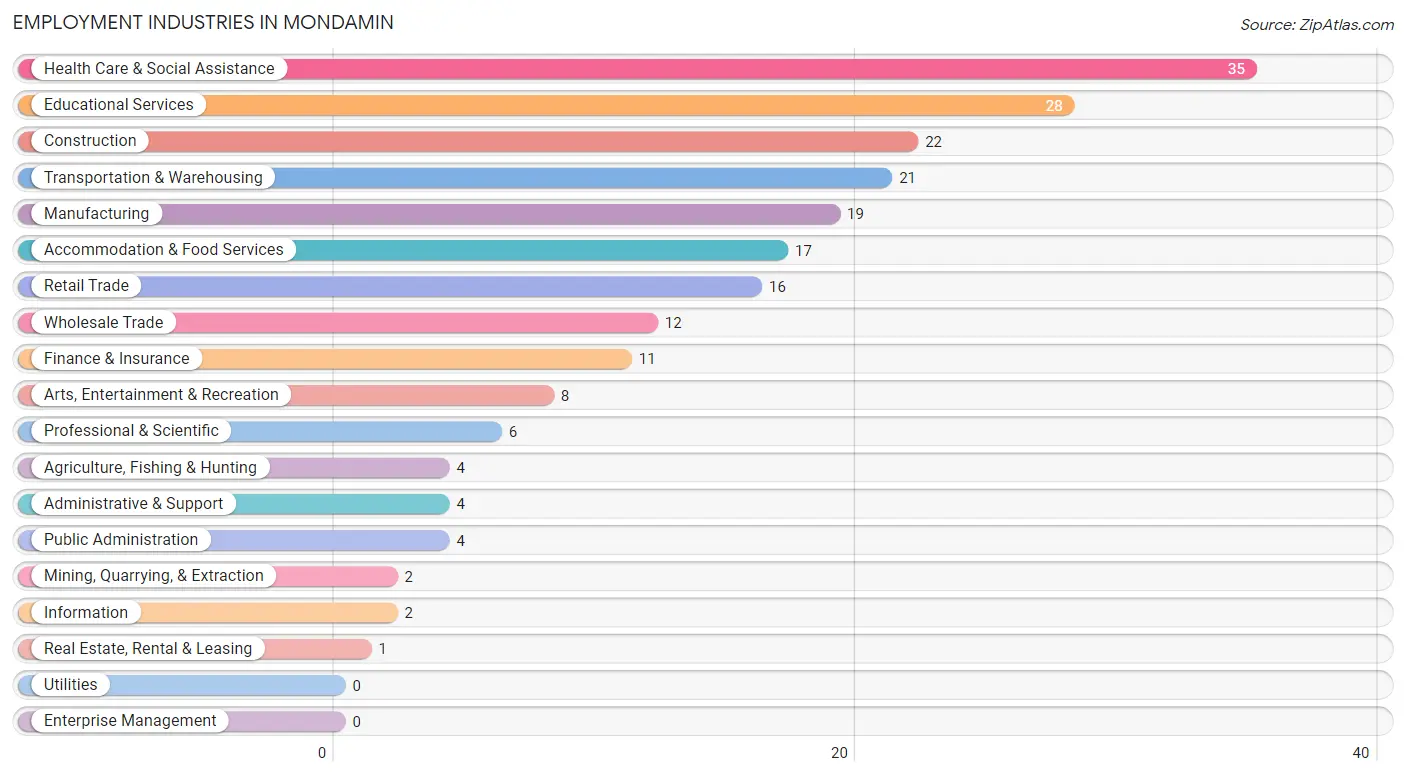
Employment Industries in Mondamin
The major employment industries in Mondamin include Health Care & Social Assistance (35 | 16.1%), Educational Services (28 | 12.8%), Construction (22 | 10.1%), Transportation & Warehousing (21 | 9.6%), and Manufacturing (19 | 8.7%).
Employment Industries by Sex in Mondamin
The Mondamin industries that see more men than women are Agriculture, Fishing & Hunting (100.0%), Mining, Quarrying, & Extraction (100.0%), and Construction (100.0%), whereas the industries that tend to have a higher number of women are Information (100.0%), Administrative & Support (100.0%), and Health Care & Social Assistance (88.6%).
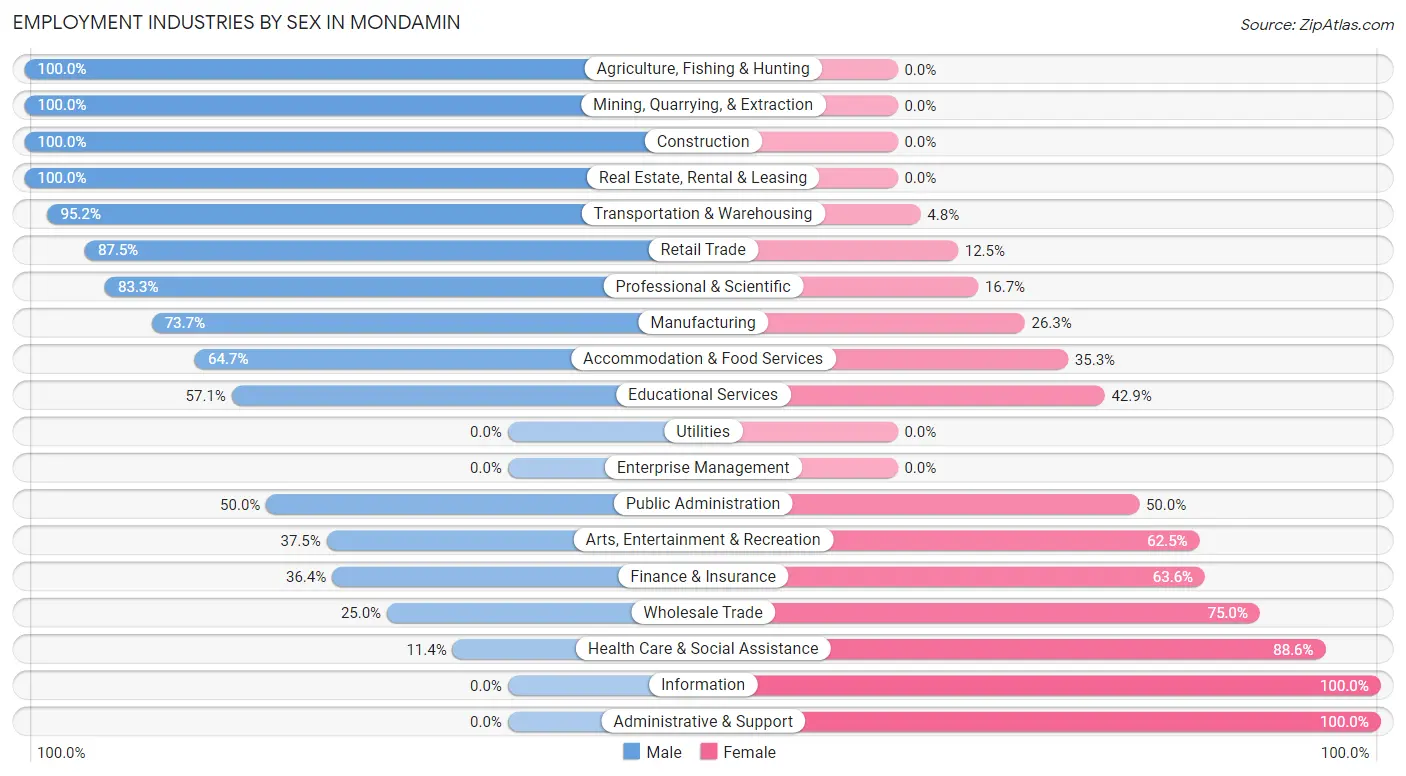
| Industry | Male | Female |
| Agriculture, Fishing & Hunting | 4 (100.0%) | 0 (0.0%) |
| Mining, Quarrying, & Extraction | 2 (100.0%) | 0 (0.0%) |
| Construction | 22 (100.0%) | 0 (0.0%) |
| Manufacturing | 14 (73.7%) | 5 (26.3%) |
| Wholesale Trade | 3 (25.0%) | 9 (75.0%) |
| Retail Trade | 14 (87.5%) | 2 (12.5%) |
| Transportation & Warehousing | 20 (95.2%) | 1 (4.8%) |
| Utilities | 0 (0.0%) | 0 (0.0%) |
| Information | 0 (0.0%) | 2 (100.0%) |
| Finance & Insurance | 4 (36.4%) | 7 (63.6%) |
| Real Estate, Rental & Leasing | 1 (100.0%) | 0 (0.0%) |
| Professional & Scientific | 5 (83.3%) | 1 (16.7%) |
| Enterprise Management | 0 (0.0%) | 0 (0.0%) |
| Administrative & Support | 0 (0.0%) | 4 (100.0%) |
| Educational Services | 16 (57.1%) | 12 (42.9%) |
| Health Care & Social Assistance | 4 (11.4%) | 31 (88.6%) |
| Arts, Entertainment & Recreation | 3 (37.5%) | 5 (62.5%) |
| Accommodation & Food Services | 11 (64.7%) | 6 (35.3%) |
| Public Administration | 2 (50.0%) | 2 (50.0%) |
| Total | 130 (59.6%) | 88 (40.4%) |
Education in Mondamin
School Enrollment in Mondamin
The most common levels of schooling among the 75 students in Mondamin are high school (34 | 45.3%), college / undergraduate (11 | 14.7%), and elementary school (8 | 10.7%).
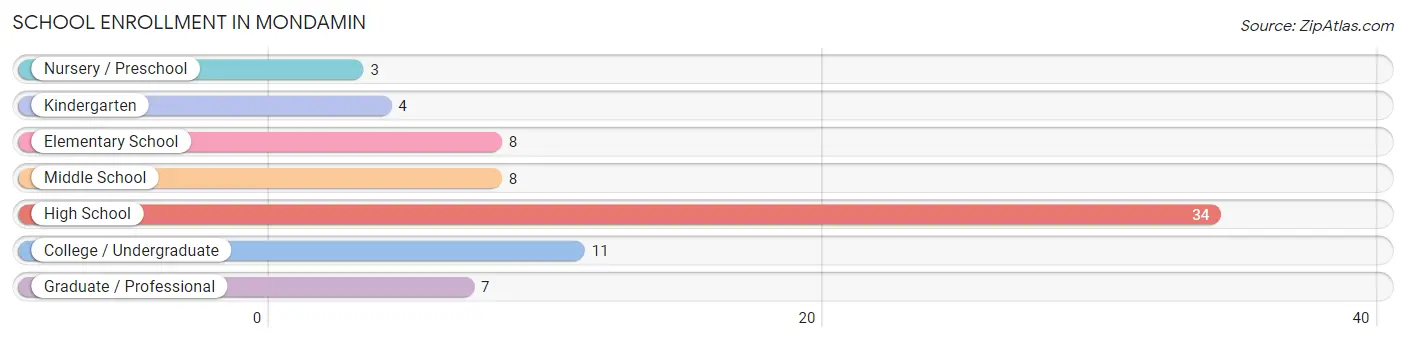
| School Level | # Students | % Students |
| Nursery / Preschool | 3 | 4.0% |
| Kindergarten | 4 | 5.3% |
| Elementary School | 8 | 10.7% |
| Middle School | 8 | 10.7% |
| High School | 34 | 45.3% |
| College / Undergraduate | 11 | 14.7% |
| Graduate / Professional | 7 | 9.3% |
| Total | 75 | 100.0% |
School Enrollment by Age by Funding Source in Mondamin
Out of a total of 75 students who are enrolled in schools in Mondamin, 5 (6.7%) attend a private institution, while the remaining 70 (93.3%) are enrolled in public schools. The age group of 5 to 9 year old has the highest likelihood of being enrolled in private schools, with 4 (28.6% in the age bracket) enrolled. Conversely, the age group of 3 to 4 year olds has the lowest likelihood of being enrolled in a private school, with 1 (100.0% in the age bracket) attending a public institution.
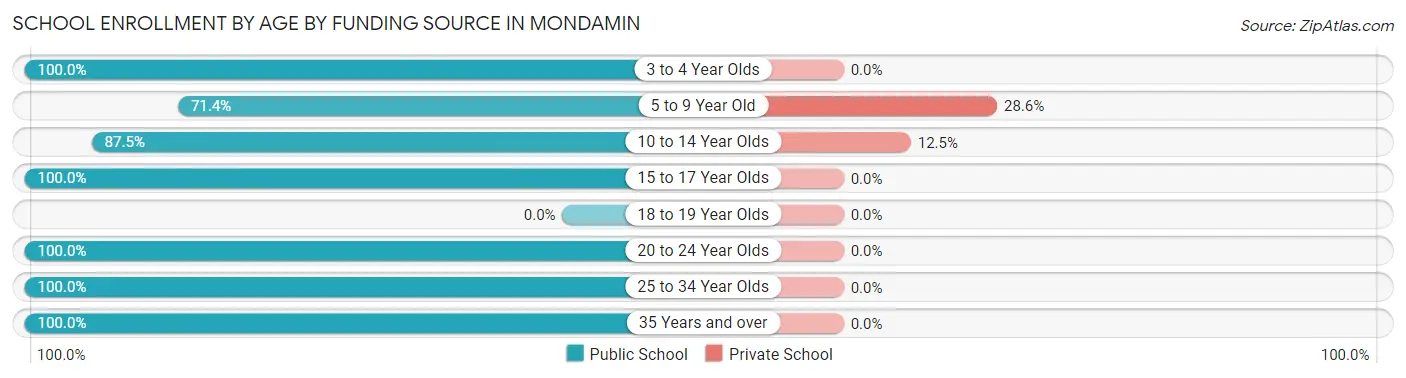
| Age Bracket | Public School | Private School |
| 3 to 4 Year Olds | 1 (100.0%) | 0 (0.0%) |
| 5 to 9 Year Old | 10 (71.4%) | 4 (28.6%) |
| 10 to 14 Year Olds | 7 (87.5%) | 1 (12.5%) |
| 15 to 17 Year Olds | 34 (100.0%) | 0 (0.0%) |
| 18 to 19 Year Olds | 0 (0.0%) | 0 (0.0%) |
| 20 to 24 Year Olds | 9 (100.0%) | 0 (0.0%) |
| 25 to 34 Year Olds | 5 (100.0%) | 0 (0.0%) |
| 35 Years and over | 4 (100.0%) | 0 (0.0%) |
| Total | 70 (93.3%) | 5 (6.7%) |
Educational Attainment by Field of Study in Mondamin
Business (15 | 32.6%), education (8 | 17.4%), science & technology (6 | 13.0%), communications (4 | 8.7%), and physical & health sciences (3 | 6.5%) are the most common fields of study among 46 individuals in Mondamin who have obtained a bachelor's degree or higher.
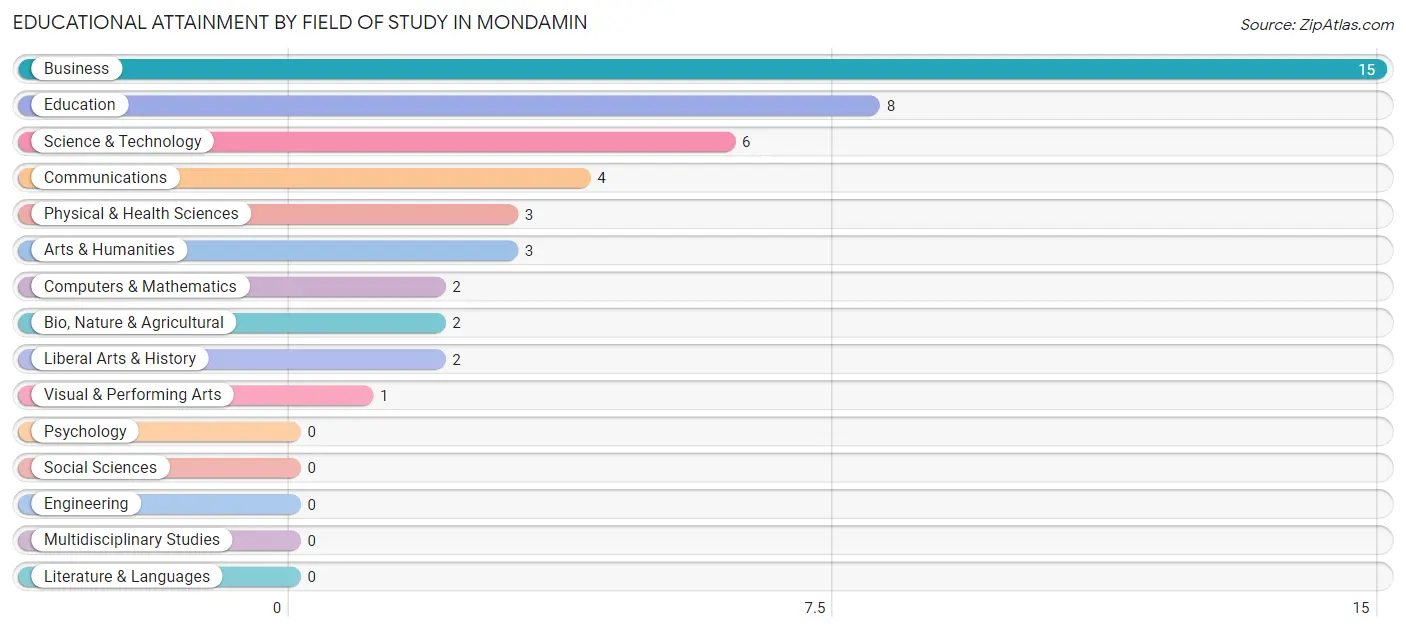
| Field of Study | # Graduates | % Graduates |
| Computers & Mathematics | 2 | 4.3% |
| Bio, Nature & Agricultural | 2 | 4.3% |
| Physical & Health Sciences | 3 | 6.5% |
| Psychology | 0 | 0.0% |
| Social Sciences | 0 | 0.0% |
| Engineering | 0 | 0.0% |
| Multidisciplinary Studies | 0 | 0.0% |
| Science & Technology | 6 | 13.0% |
| Business | 15 | 32.6% |
| Education | 8 | 17.4% |
| Literature & Languages | 0 | 0.0% |
| Liberal Arts & History | 2 | 4.3% |
| Visual & Performing Arts | 1 | 2.2% |
| Communications | 4 | 8.7% |
| Arts & Humanities | 3 | 6.5% |
| Total | 46 | 100.0% |
Transportation & Commute in Mondamin
Vehicle Availability by Sex in Mondamin
The most prevalent vehicle ownership categories in Mondamin are males with 2 vehicles (53, accounting for 43.8%) and females with 2 vehicles (27, making up 61.6%).
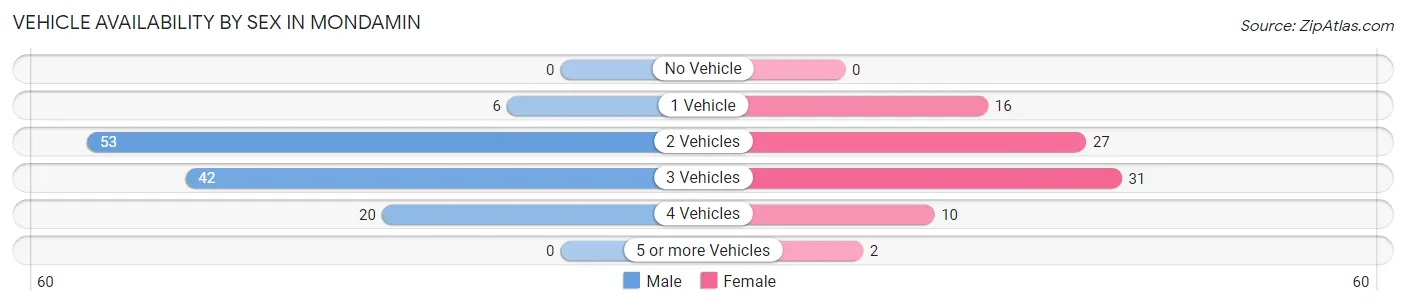
| Vehicles Available | Male | Female |
| No Vehicle | 0 (0.0%) | 0 (0.0%) |
| 1 Vehicle | 6 (5.0%) | 16 (18.6%) |
| 2 Vehicles | 53 (43.8%) | 27 (31.4%) |
| 3 Vehicles | 42 (34.7%) | 31 (36.0%) |
| 4 Vehicles | 20 (16.5%) | 10 (11.6%) |
| 5 or more Vehicles | 0 (0.0%) | 2 (2.3%) |
| Total | 121 (100.0%) | 86 (100.0%) |
Commute Time in Mondamin
The most frequently occuring commute durations in Mondamin are 20 to 24 minutes (45 commuters, 23.9%), 45 to 59 minutes (43 commuters, 22.9%), and 30 to 34 minutes (17 commuters, 9.0%).
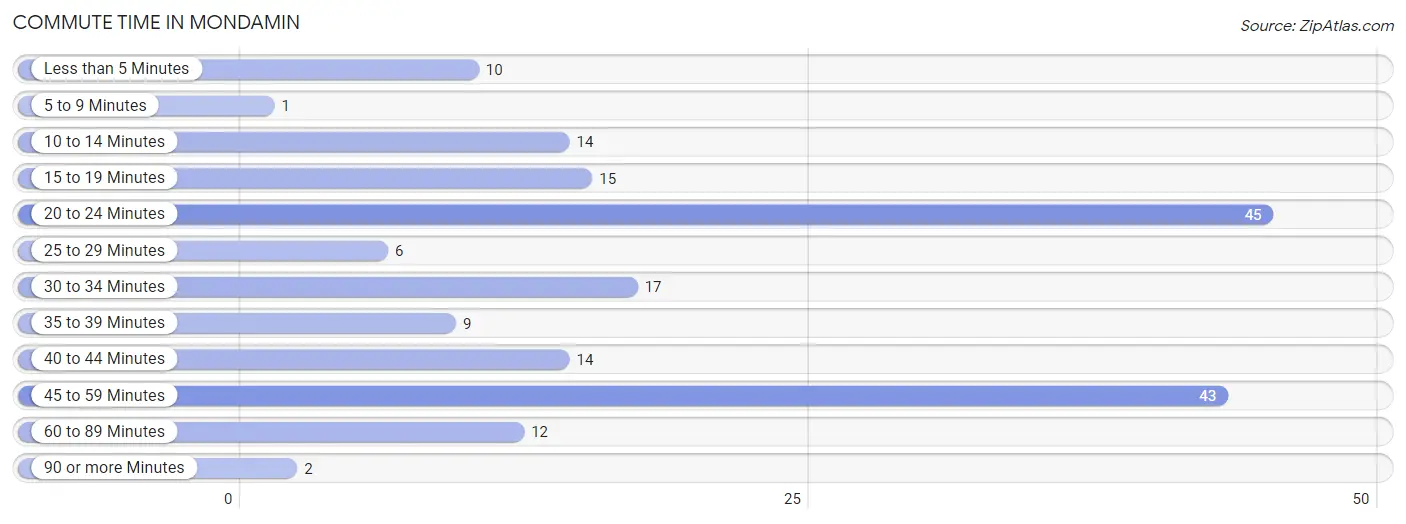
| Commute Time | # Commuters | % Commuters |
| Less than 5 Minutes | 10 | 5.3% |
| 5 to 9 Minutes | 1 | 0.5% |
| 10 to 14 Minutes | 14 | 7.4% |
| 15 to 19 Minutes | 15 | 8.0% |
| 20 to 24 Minutes | 45 | 23.9% |
| 25 to 29 Minutes | 6 | 3.2% |
| 30 to 34 Minutes | 17 | 9.0% |
| 35 to 39 Minutes | 9 | 4.8% |
| 40 to 44 Minutes | 14 | 7.4% |
| 45 to 59 Minutes | 43 | 22.9% |
| 60 to 89 Minutes | 12 | 6.4% |
| 90 or more Minutes | 2 | 1.1% |
Commute Time by Sex in Mondamin
The most common commute times in Mondamin are 45 to 59 minutes (27 commuters, 23.9%) for males and 20 to 24 minutes (22 commuters, 29.3%) for females.
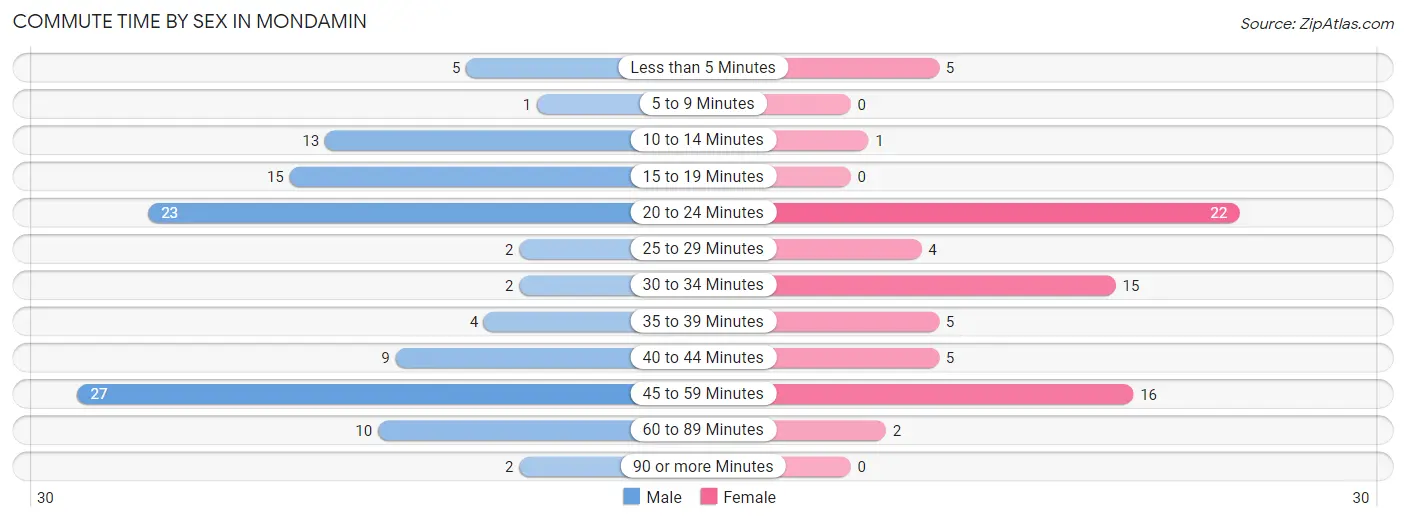
| Commute Time | Male | Female |
| Less than 5 Minutes | 5 (4.4%) | 5 (6.7%) |
| 5 to 9 Minutes | 1 (0.9%) | 0 (0.0%) |
| 10 to 14 Minutes | 13 (11.5%) | 1 (1.3%) |
| 15 to 19 Minutes | 15 (13.3%) | 0 (0.0%) |
| 20 to 24 Minutes | 23 (20.3%) | 22 (29.3%) |
| 25 to 29 Minutes | 2 (1.8%) | 4 (5.3%) |
| 30 to 34 Minutes | 2 (1.8%) | 15 (20.0%) |
| 35 to 39 Minutes | 4 (3.5%) | 5 (6.7%) |
| 40 to 44 Minutes | 9 (8.0%) | 5 (6.7%) |
| 45 to 59 Minutes | 27 (23.9%) | 16 (21.3%) |
| 60 to 89 Minutes | 10 (8.8%) | 2 (2.7%) |
| 90 or more Minutes | 2 (1.8%) | 0 (0.0%) |
Time of Departure to Work by Sex in Mondamin
The most frequent times of departure to work in Mondamin are 7:00 AM to 7:29 AM (42, 37.2%) for males and 7:00 AM to 7:29 AM (17, 22.7%) for females.
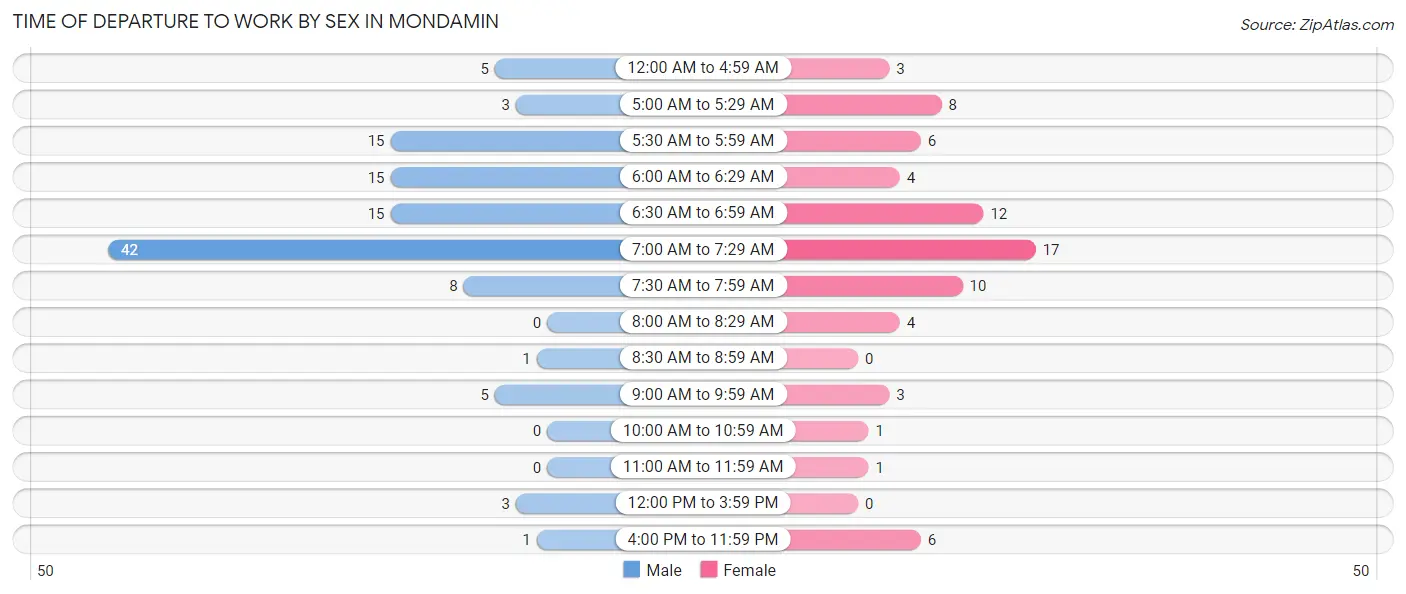
| Time of Departure | Male | Female |
| 12:00 AM to 4:59 AM | 5 (4.4%) | 3 (4.0%) |
| 5:00 AM to 5:29 AM | 3 (2.6%) | 8 (10.7%) |
| 5:30 AM to 5:59 AM | 15 (13.3%) | 6 (8.0%) |
| 6:00 AM to 6:29 AM | 15 (13.3%) | 4 (5.3%) |
| 6:30 AM to 6:59 AM | 15 (13.3%) | 12 (16.0%) |
| 7:00 AM to 7:29 AM | 42 (37.2%) | 17 (22.7%) |
| 7:30 AM to 7:59 AM | 8 (7.1%) | 10 (13.3%) |
| 8:00 AM to 8:29 AM | 0 (0.0%) | 4 (5.3%) |
| 8:30 AM to 8:59 AM | 1 (0.9%) | 0 (0.0%) |
| 9:00 AM to 9:59 AM | 5 (4.4%) | 3 (4.0%) |
| 10:00 AM to 10:59 AM | 0 (0.0%) | 1 (1.3%) |
| 11:00 AM to 11:59 AM | 0 (0.0%) | 1 (1.3%) |
| 12:00 PM to 3:59 PM | 3 (2.6%) | 0 (0.0%) |
| 4:00 PM to 11:59 PM | 1 (0.9%) | 6 (8.0%) |
| Total | 113 (100.0%) | 75 (100.0%) |
Housing Occupancy in Mondamin
Occupancy by Ownership in Mondamin
Of the total 171 dwellings in Mondamin, owner-occupied units account for 130 (76.0%), while renter-occupied units make up 41 (24.0%).
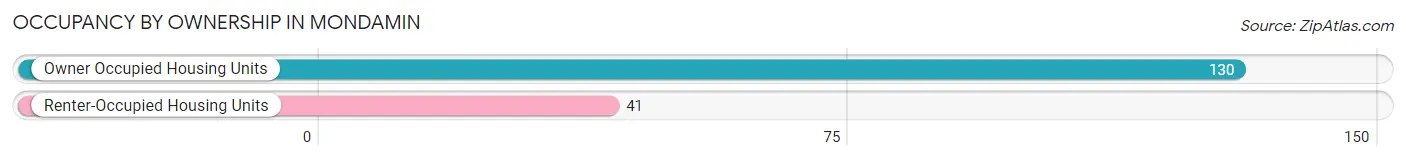
| Occupancy | # Housing Units | % Housing Units |
| Owner Occupied Housing Units | 130 | 76.0% |
| Renter-Occupied Housing Units | 41 | 24.0% |
| Total Occupied Housing Units | 171 | 100.0% |
Occupancy by Household Size in Mondamin
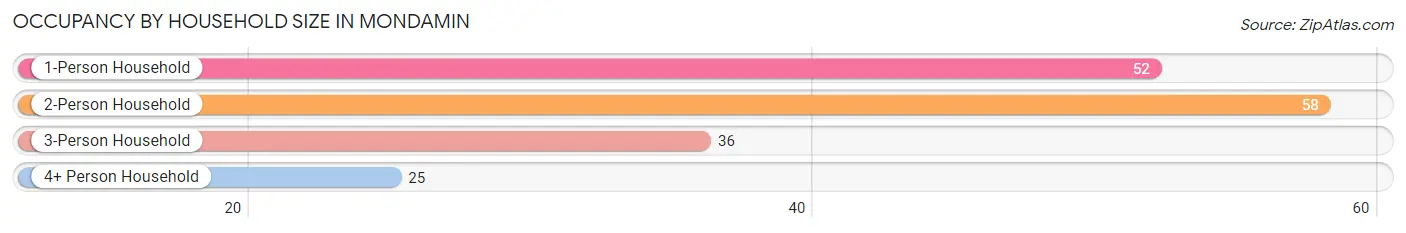
| Household Size | # Housing Units | % Housing Units |
| 1-Person Household | 52 | 30.4% |
| 2-Person Household | 58 | 33.9% |
| 3-Person Household | 36 | 21.0% |
| 4+ Person Household | 25 | 14.6% |
| Total Housing Units | 171 | 100.0% |
Occupancy by Ownership by Household Size in Mondamin
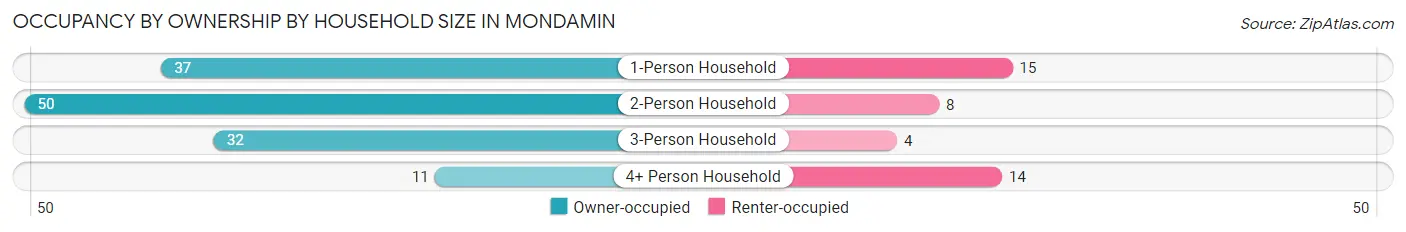
| Household Size | Owner-occupied | Renter-occupied |
| 1-Person Household | 37 (71.2%) | 15 (28.8%) |
| 2-Person Household | 50 (86.2%) | 8 (13.8%) |
| 3-Person Household | 32 (88.9%) | 4 (11.1%) |
| 4+ Person Household | 11 (44.0%) | 14 (56.0%) |
| Total Housing Units | 130 (76.0%) | 41 (24.0%) |
Occupancy by Educational Attainment in Mondamin
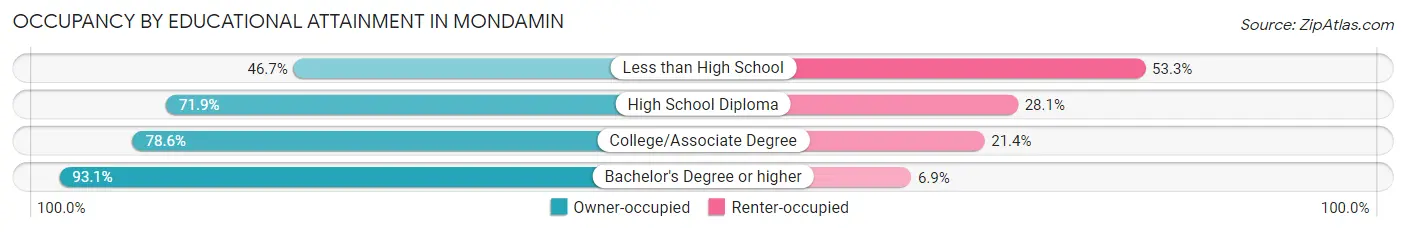
| Household Size | Owner-occupied | Renter-occupied |
| Less than High School | 7 (46.7%) | 8 (53.3%) |
| High School Diploma | 41 (71.9%) | 16 (28.1%) |
| College/Associate Degree | 55 (78.6%) | 15 (21.4%) |
| Bachelor's Degree or higher | 27 (93.1%) | 2 (6.9%) |
Occupancy by Age of Householder in Mondamin
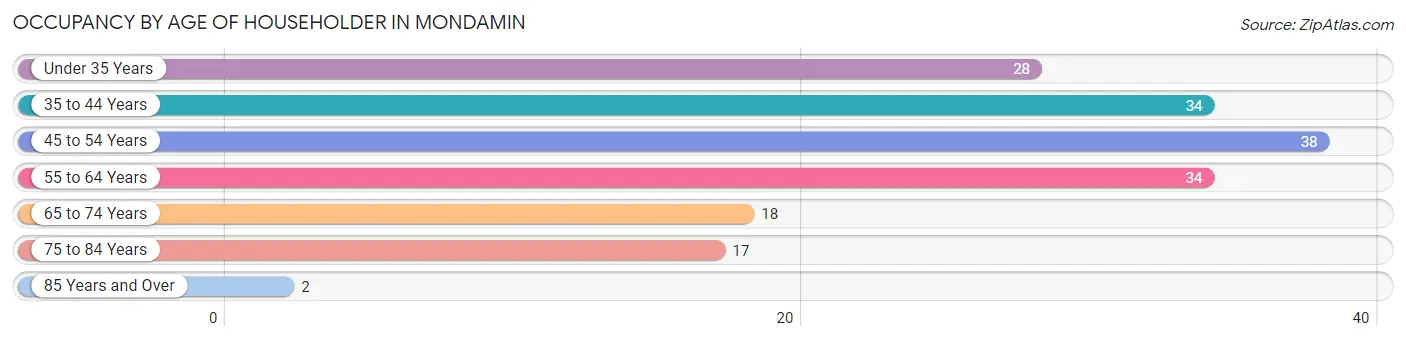
| Age Bracket | # Households | % Households |
| Under 35 Years | 28 | 16.4% |
| 35 to 44 Years | 34 | 19.9% |
| 45 to 54 Years | 38 | 22.2% |
| 55 to 64 Years | 34 | 19.9% |
| 65 to 74 Years | 18 | 10.5% |
| 75 to 84 Years | 17 | 9.9% |
| 85 Years and Over | 2 | 1.2% |
| Total | 171 | 100.0% |
Housing Finances in Mondamin
Median Income by Occupancy in Mondamin
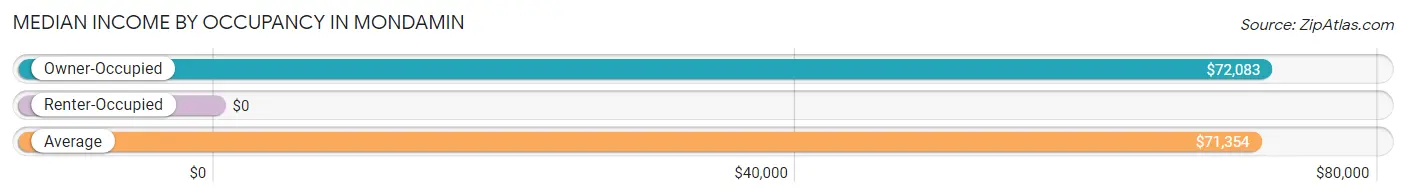
| Occupancy Type | # Households | Median Income |
| Owner-Occupied | 130 (76.0%) | $72,083 |
| Renter-Occupied | 41 (24.0%) | $0 |
| Average | 171 (100.0%) | $71,354 |
Occupancy by Householder Income Bracket in Mondamin
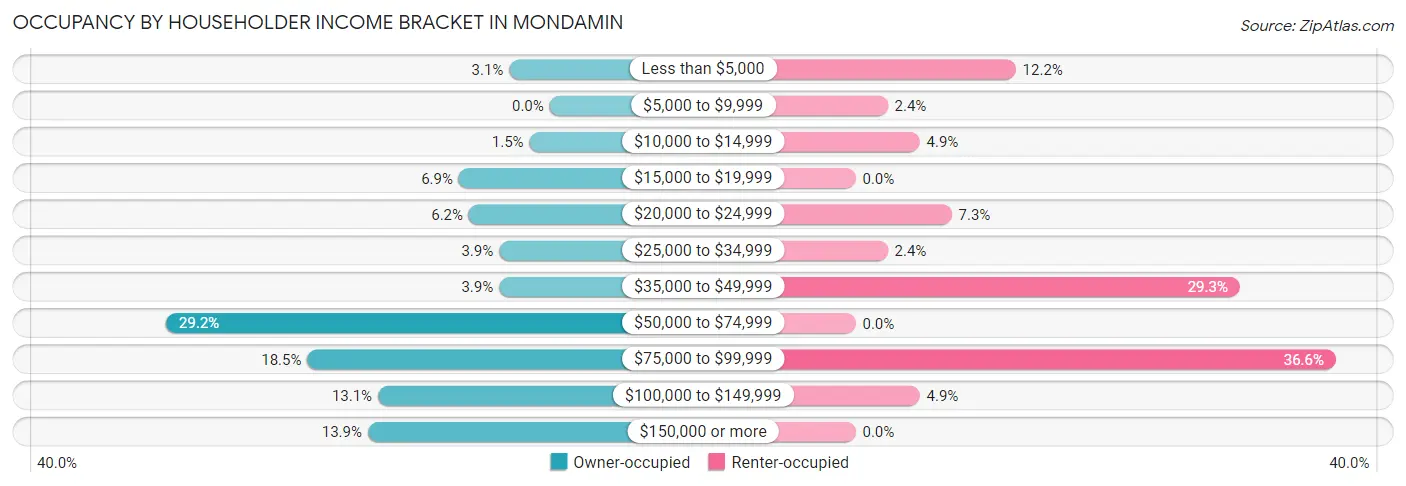
| Income Bracket | Owner-occupied | Renter-occupied |
| Less than $5,000 | 4 (3.1%) | 5 (12.2%) |
| $5,000 to $9,999 | 0 (0.0%) | 1 (2.4%) |
| $10,000 to $14,999 | 2 (1.5%) | 2 (4.9%) |
| $15,000 to $19,999 | 9 (6.9%) | 0 (0.0%) |
| $20,000 to $24,999 | 8 (6.1%) | 3 (7.3%) |
| $25,000 to $34,999 | 5 (3.8%) | 1 (2.4%) |
| $35,000 to $49,999 | 5 (3.8%) | 12 (29.3%) |
| $50,000 to $74,999 | 38 (29.2%) | 0 (0.0%) |
| $75,000 to $99,999 | 24 (18.5%) | 15 (36.6%) |
| $100,000 to $149,999 | 17 (13.1%) | 2 (4.9%) |
| $150,000 or more | 18 (13.9%) | 0 (0.0%) |
| Total | 130 (100.0%) | 41 (100.0%) |
Monthly Housing Cost Tiers in Mondamin
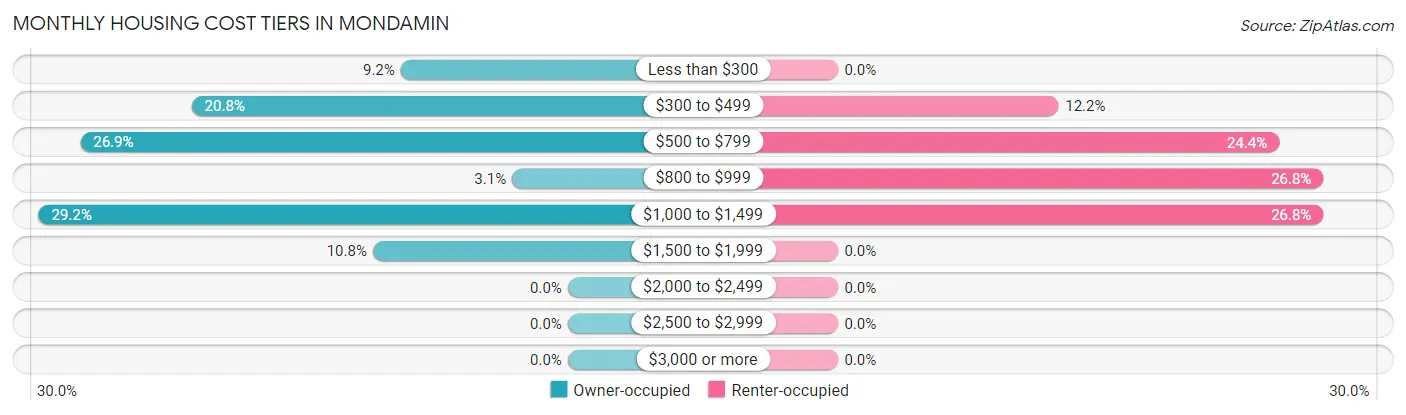
| Monthly Cost | Owner-occupied | Renter-occupied |
| Less than $300 | 12 (9.2%) | 0 (0.0%) |
| $300 to $499 | 27 (20.8%) | 5 (12.2%) |
| $500 to $799 | 35 (26.9%) | 10 (24.4%) |
| $800 to $999 | 4 (3.1%) | 11 (26.8%) |
| $1,000 to $1,499 | 38 (29.2%) | 11 (26.8%) |
| $1,500 to $1,999 | 14 (10.8%) | 0 (0.0%) |
| $2,000 to $2,499 | 0 (0.0%) | 0 (0.0%) |
| $2,500 to $2,999 | 0 (0.0%) | 0 (0.0%) |
| $3,000 or more | 0 (0.0%) | 0 (0.0%) |
| Total | 130 (100.0%) | 41 (100.0%) |
Physical Housing Characteristics in Mondamin
Housing Structures in Mondamin
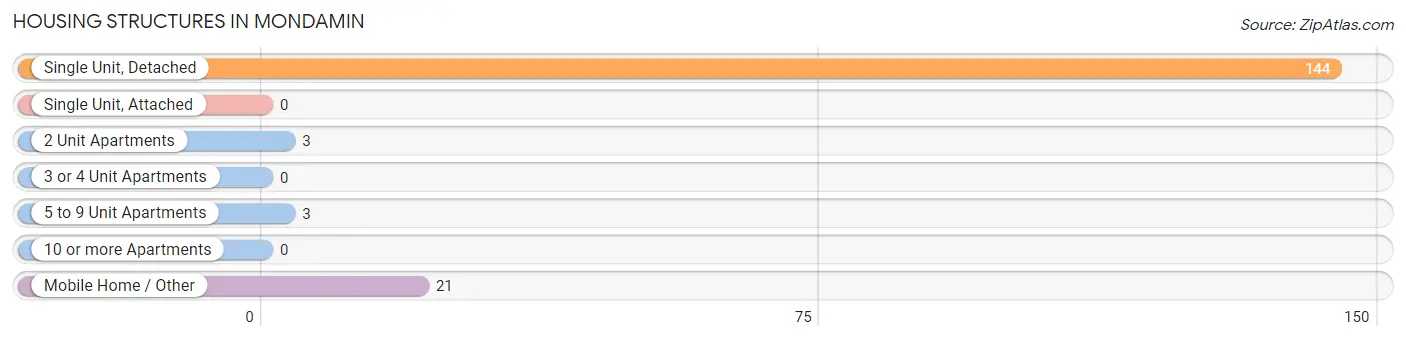
| Structure Type | # Housing Units | % Housing Units |
| Single Unit, Detached | 144 | 84.2% |
| Single Unit, Attached | 0 | 0.0% |
| 2 Unit Apartments | 3 | 1.8% |
| 3 or 4 Unit Apartments | 0 | 0.0% |
| 5 to 9 Unit Apartments | 3 | 1.8% |
| 10 or more Apartments | 0 | 0.0% |
| Mobile Home / Other | 21 | 12.3% |
| Total | 171 | 100.0% |
Housing Structures by Occupancy in Mondamin
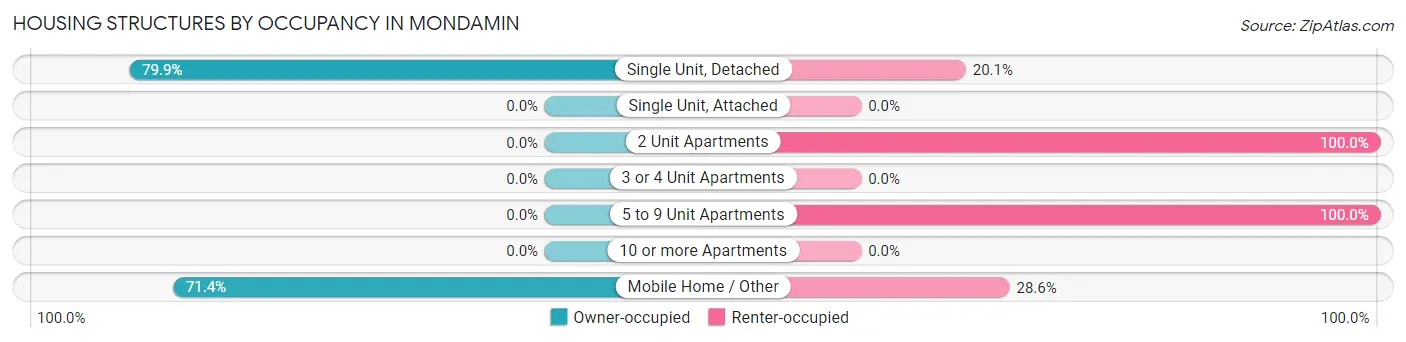
| Structure Type | Owner-occupied | Renter-occupied |
| Single Unit, Detached | 115 (79.9%) | 29 (20.1%) |
| Single Unit, Attached | 0 (0.0%) | 0 (0.0%) |
| 2 Unit Apartments | 0 (0.0%) | 3 (100.0%) |
| 3 or 4 Unit Apartments | 0 (0.0%) | 0 (0.0%) |
| 5 to 9 Unit Apartments | 0 (0.0%) | 3 (100.0%) |
| 10 or more Apartments | 0 (0.0%) | 0 (0.0%) |
| Mobile Home / Other | 15 (71.4%) | 6 (28.6%) |
| Total | 130 (76.0%) | 41 (24.0%) |
Housing Structures by Number of Rooms in Mondamin
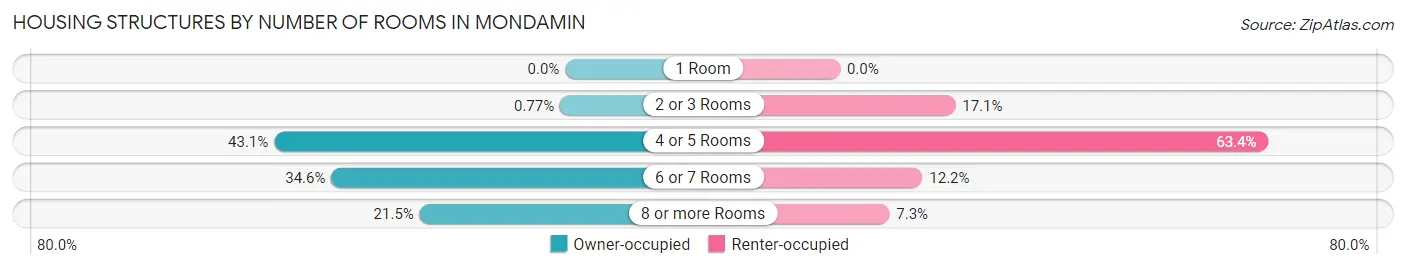
| Number of Rooms | Owner-occupied | Renter-occupied |
| 1 Room | 0 (0.0%) | 0 (0.0%) |
| 2 or 3 Rooms | 1 (0.8%) | 7 (17.1%) |
| 4 or 5 Rooms | 56 (43.1%) | 26 (63.4%) |
| 6 or 7 Rooms | 45 (34.6%) | 5 (12.2%) |
| 8 or more Rooms | 28 (21.5%) | 3 (7.3%) |
| Total | 130 (100.0%) | 41 (100.0%) |
Housing Structure by Heating Type in Mondamin
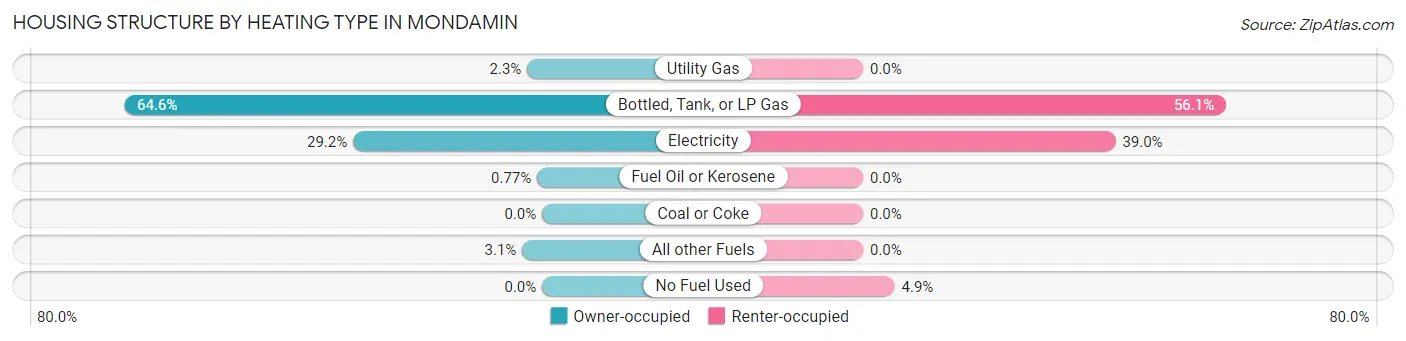
| Heating Type | Owner-occupied | Renter-occupied |
| Utility Gas | 3 (2.3%) | 0 (0.0%) |
| Bottled, Tank, or LP Gas | 84 (64.6%) | 23 (56.1%) |
| Electricity | 38 (29.2%) | 16 (39.0%) |
| Fuel Oil or Kerosene | 1 (0.8%) | 0 (0.0%) |
| Coal or Coke | 0 (0.0%) | 0 (0.0%) |
| All other Fuels | 4 (3.1%) | 0 (0.0%) |
| No Fuel Used | 0 (0.0%) | 2 (4.9%) |
| Total | 130 (100.0%) | 41 (100.0%) |
Household Vehicle Usage in Mondamin
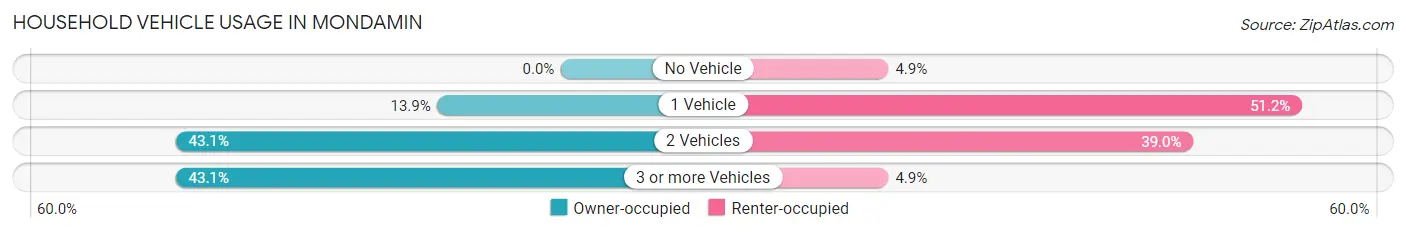
| Vehicles per Household | Owner-occupied | Renter-occupied |
| No Vehicle | 0 (0.0%) | 2 (4.9%) |
| 1 Vehicle | 18 (13.9%) | 21 (51.2%) |
| 2 Vehicles | 56 (43.1%) | 16 (39.0%) |
| 3 or more Vehicles | 56 (43.1%) | 2 (4.9%) |
| Total | 130 (100.0%) | 41 (100.0%) |
Real Estate & Mortgages in Mondamin
Real Estate and Mortgage Overview in Mondamin
| Characteristic | Without Mortgage | With Mortgage |
| Housing Units | 57 | 73 |
| Median Property Value | $74,700 | $124,200 |
| Median Household Income | $70,375 | $17 |
| Monthly Housing Costs | $434 | $0 |
| Real Estate Taxes | $1,083 | $0 |
Property Value by Mortgage Status in Mondamin
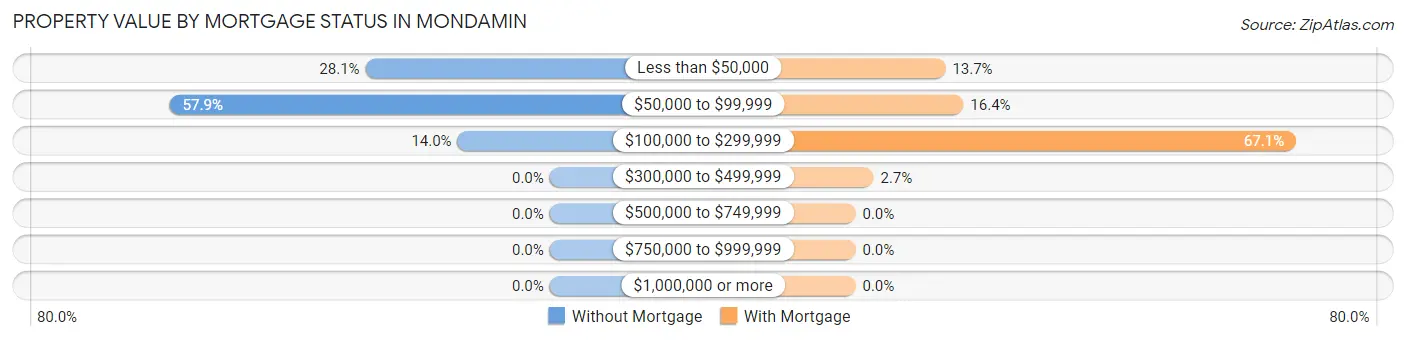
| Property Value | Without Mortgage | With Mortgage |
| Less than $50,000 | 16 (28.1%) | 10 (13.7%) |
| $50,000 to $99,999 | 33 (57.9%) | 12 (16.4%) |
| $100,000 to $299,999 | 8 (14.0%) | 49 (67.1%) |
| $300,000 to $499,999 | 0 (0.0%) | 2 (2.7%) |
| $500,000 to $749,999 | 0 (0.0%) | 0 (0.0%) |
| $750,000 to $999,999 | 0 (0.0%) | 0 (0.0%) |
| $1,000,000 or more | 0 (0.0%) | 0 (0.0%) |
| Total | 57 (100.0%) | 73 (100.0%) |
Household Income by Mortgage Status in Mondamin
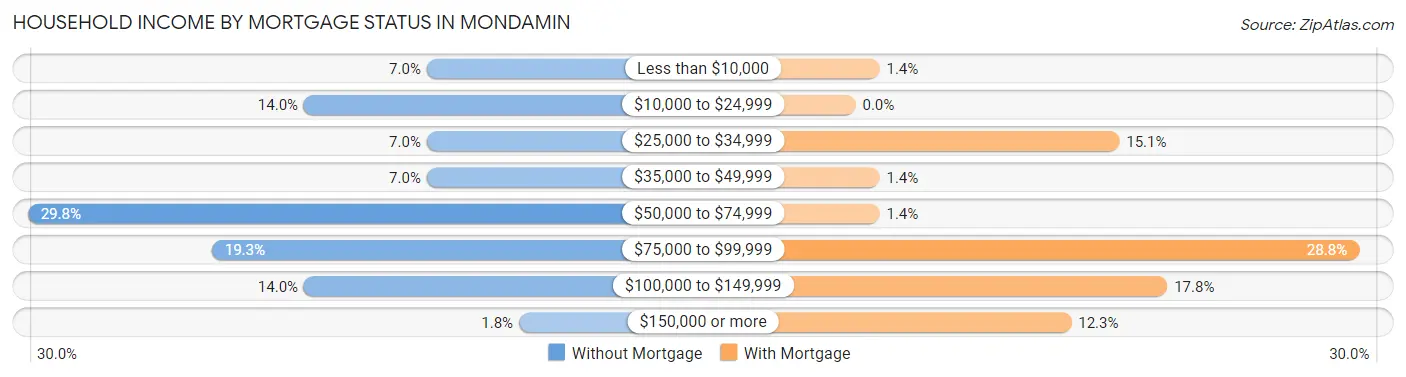
| Household Income | Without Mortgage | With Mortgage |
| Less than $10,000 | 4 (7.0%) | 1 (1.4%) |
| $10,000 to $24,999 | 8 (14.0%) | 0 (0.0%) |
| $25,000 to $34,999 | 4 (7.0%) | 11 (15.1%) |
| $35,000 to $49,999 | 4 (7.0%) | 1 (1.4%) |
| $50,000 to $74,999 | 17 (29.8%) | 1 (1.4%) |
| $75,000 to $99,999 | 11 (19.3%) | 21 (28.8%) |
| $100,000 to $149,999 | 8 (14.0%) | 13 (17.8%) |
| $150,000 or more | 1 (1.8%) | 9 (12.3%) |
| Total | 57 (100.0%) | 73 (100.0%) |
Property Value to Household Income Ratio in Mondamin
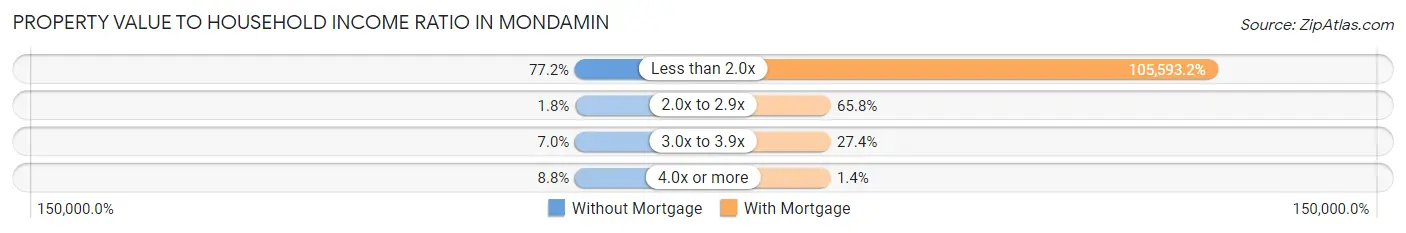
| Value-to-Income Ratio | Without Mortgage | With Mortgage |
| Less than 2.0x | 44 (77.2%) | 77,083 (105,593.1%) |
| 2.0x to 2.9x | 1 (1.8%) | 48 (65.7%) |
| 3.0x to 3.9x | 4 (7.0%) | 20 (27.4%) |
| 4.0x or more | 5 (8.8%) | 1 (1.4%) |
| Total | 57 (100.0%) | 73 (100.0%) |
Real Estate Taxes by Mortgage Status in Mondamin
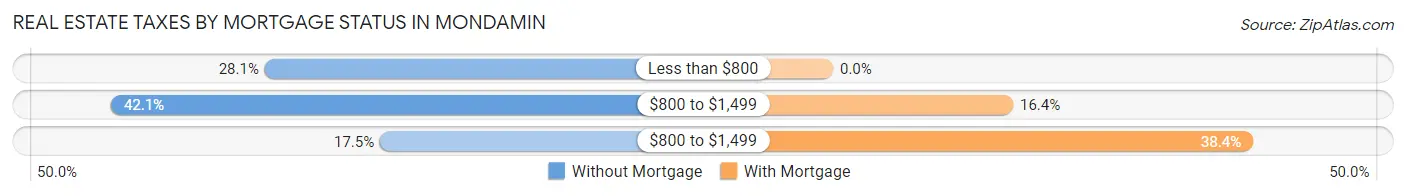
| Property Taxes | Without Mortgage | With Mortgage |
| Less than $800 | 16 (28.1%) | 0 (0.0%) |
| $800 to $1,499 | 24 (42.1%) | 12 (16.4%) |
| $800 to $1,499 | 10 (17.5%) | 28 (38.4%) |
| Total | 57 (100.0%) | 73 (100.0%) |
Health & Disability in Mondamin
Health Insurance Coverage by Age in Mondamin
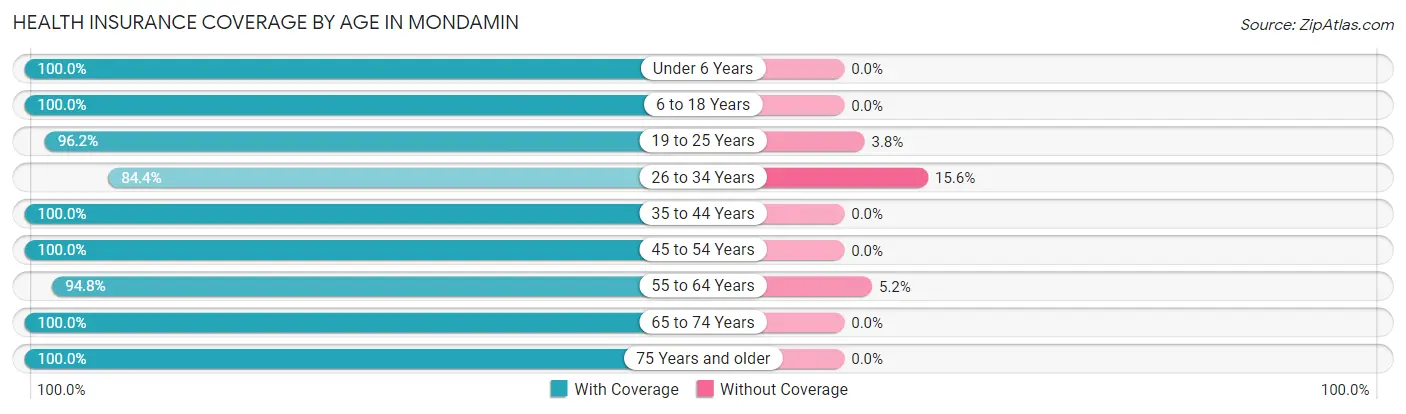
| Age Bracket | With Coverage | Without Coverage |
| Under 6 Years | 29 (100.0%) | 0 (0.0%) |
| 6 to 18 Years | 52 (100.0%) | 0 (0.0%) |
| 19 to 25 Years | 51 (96.2%) | 2 (3.8%) |
| 26 to 34 Years | 27 (84.4%) | 5 (15.6%) |
| 35 to 44 Years | 58 (100.0%) | 0 (0.0%) |
| 45 to 54 Years | 58 (100.0%) | 0 (0.0%) |
| 55 to 64 Years | 55 (94.8%) | 3 (5.2%) |
| 65 to 74 Years | 29 (100.0%) | 0 (0.0%) |
| 75 Years and older | 20 (100.0%) | 0 (0.0%) |
| Total | 379 (97.4%) | 10 (2.6%) |
Health Insurance Coverage by Citizenship Status in Mondamin
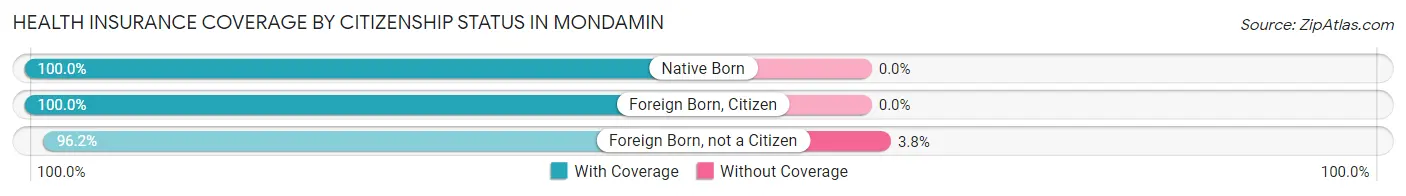
| Citizenship Status | With Coverage | Without Coverage |
| Native Born | 29 (100.0%) | 0 (0.0%) |
| Foreign Born, Citizen | 52 (100.0%) | 0 (0.0%) |
| Foreign Born, not a Citizen | 51 (96.2%) | 2 (3.8%) |
Health Insurance Coverage by Household Income in Mondamin
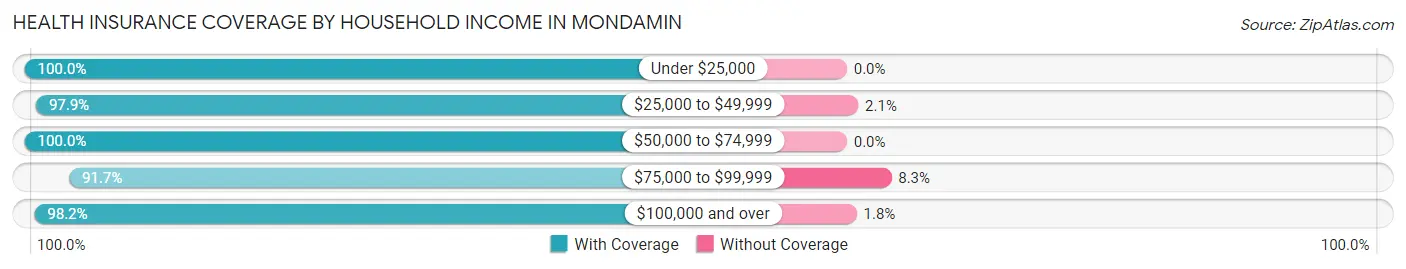
| Household Income | With Coverage | Without Coverage |
| Under $25,000 | 66 (100.0%) | 0 (0.0%) |
| $25,000 to $49,999 | 46 (97.9%) | 1 (2.1%) |
| $50,000 to $74,999 | 83 (100.0%) | 0 (0.0%) |
| $75,000 to $99,999 | 77 (91.7%) | 7 (8.3%) |
| $100,000 and over | 107 (98.2%) | 2 (1.8%) |
Public vs Private Health Insurance Coverage by Age in Mondamin
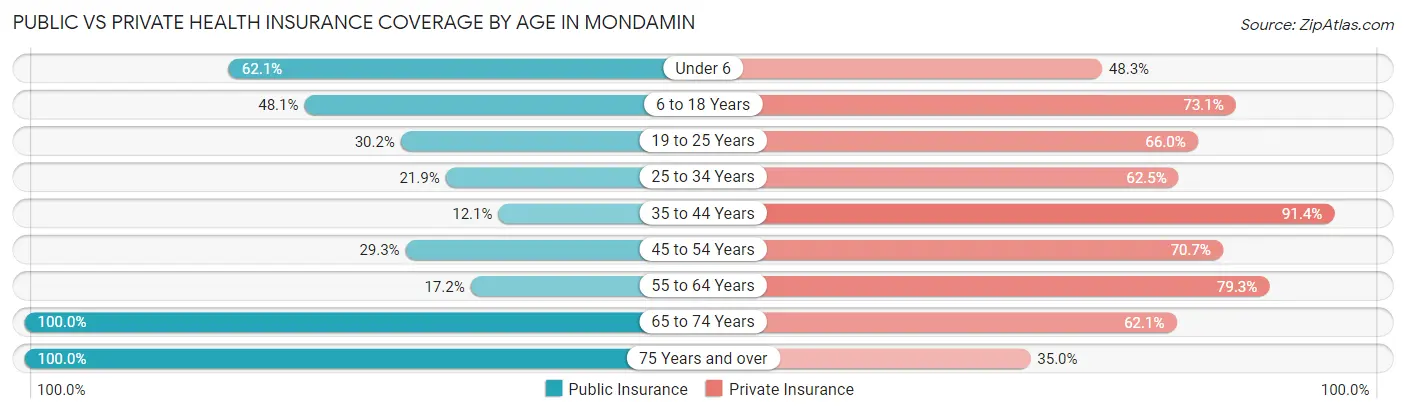
| Age Bracket | Public Insurance | Private Insurance |
| Under 6 | 18 (62.1%) | 14 (48.3%) |
| 6 to 18 Years | 25 (48.1%) | 38 (73.1%) |
| 19 to 25 Years | 16 (30.2%) | 35 (66.0%) |
| 25 to 34 Years | 7 (21.9%) | 20 (62.5%) |
| 35 to 44 Years | 7 (12.1%) | 53 (91.4%) |
| 45 to 54 Years | 17 (29.3%) | 41 (70.7%) |
| 55 to 64 Years | 10 (17.2%) | 46 (79.3%) |
| 65 to 74 Years | 29 (100.0%) | 18 (62.1%) |
| 75 Years and over | 20 (100.0%) | 7 (35.0%) |
| Total | 149 (38.3%) | 272 (69.9%) |
Disability Status by Sex by Age in Mondamin
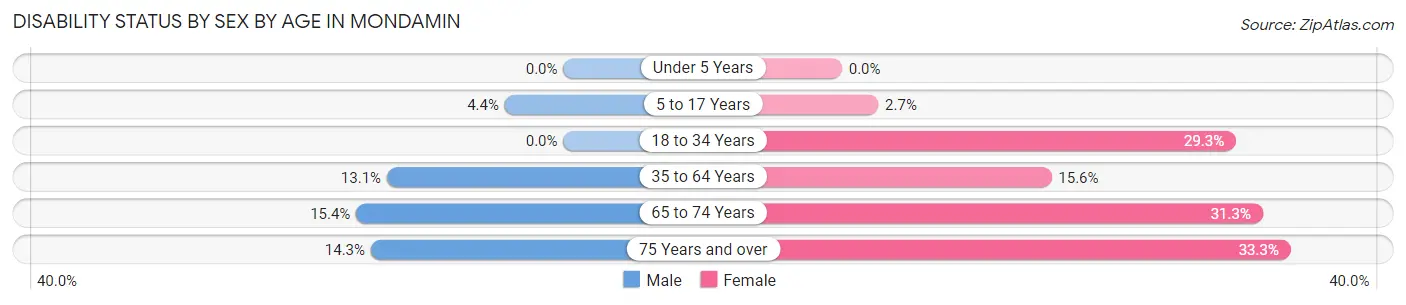
| Age Bracket | Male | Female |
| Under 5 Years | 0 (0.0%) | 0 (0.0%) |
| 5 to 17 Years | 1 (4.3%) | 1 (2.7%) |
| 18 to 34 Years | 0 (0.0%) | 12 (29.3%) |
| 35 to 64 Years | 11 (13.1%) | 14 (15.6%) |
| 65 to 74 Years | 2 (15.4%) | 5 (31.2%) |
| 75 Years and over | 2 (14.3%) | 2 (33.3%) |
Disability Class by Sex by Age in Mondamin
Disability Class: Hearing Difficulty
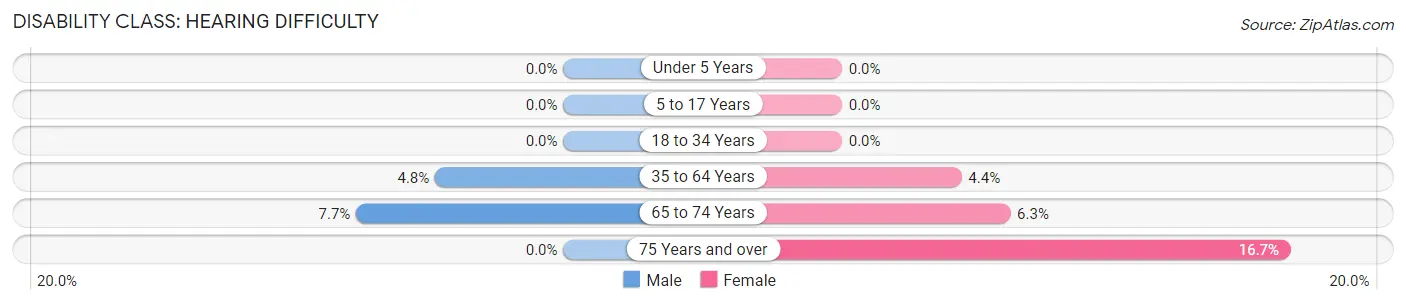
| Age Bracket | Male | Female |
| Under 5 Years | 0 (0.0%) | 0 (0.0%) |
| 5 to 17 Years | 0 (0.0%) | 0 (0.0%) |
| 18 to 34 Years | 0 (0.0%) | 0 (0.0%) |
| 35 to 64 Years | 4 (4.8%) | 4 (4.4%) |
| 65 to 74 Years | 1 (7.7%) | 1 (6.2%) |
| 75 Years and over | 0 (0.0%) | 1 (16.7%) |
Disability Class: Vision Difficulty
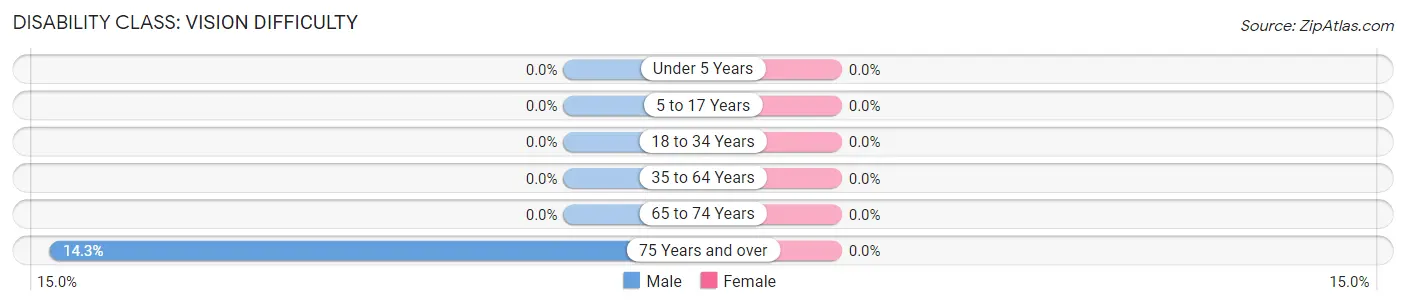
| Age Bracket | Male | Female |
| Under 5 Years | 0 (0.0%) | 0 (0.0%) |
| 5 to 17 Years | 0 (0.0%) | 0 (0.0%) |
| 18 to 34 Years | 0 (0.0%) | 0 (0.0%) |
| 35 to 64 Years | 0 (0.0%) | 0 (0.0%) |
| 65 to 74 Years | 0 (0.0%) | 0 (0.0%) |
| 75 Years and over | 2 (14.3%) | 0 (0.0%) |
Disability Class: Cognitive Difficulty
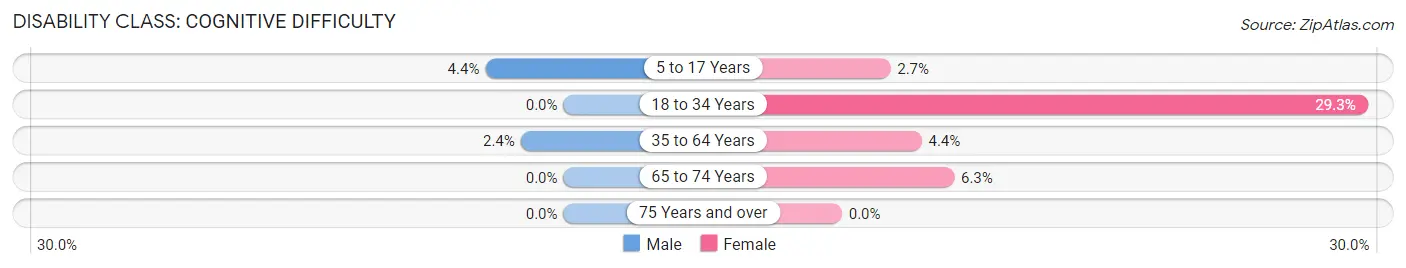
| Age Bracket | Male | Female |
| 5 to 17 Years | 1 (4.3%) | 1 (2.7%) |
| 18 to 34 Years | 0 (0.0%) | 12 (29.3%) |
| 35 to 64 Years | 2 (2.4%) | 4 (4.4%) |
| 65 to 74 Years | 0 (0.0%) | 1 (6.2%) |
| 75 Years and over | 0 (0.0%) | 0 (0.0%) |
Disability Class: Ambulatory Difficulty
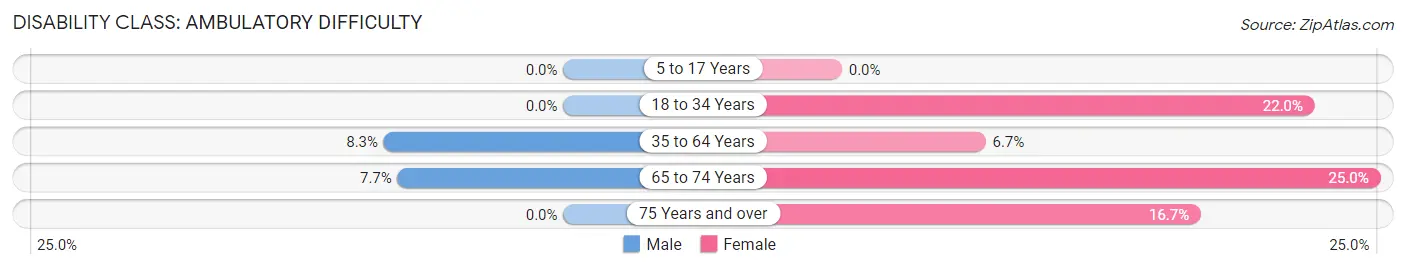
| Age Bracket | Male | Female |
| 5 to 17 Years | 0 (0.0%) | 0 (0.0%) |
| 18 to 34 Years | 0 (0.0%) | 9 (22.0%) |
| 35 to 64 Years | 7 (8.3%) | 6 (6.7%) |
| 65 to 74 Years | 1 (7.7%) | 4 (25.0%) |
| 75 Years and over | 0 (0.0%) | 1 (16.7%) |
Disability Class: Self-Care Difficulty
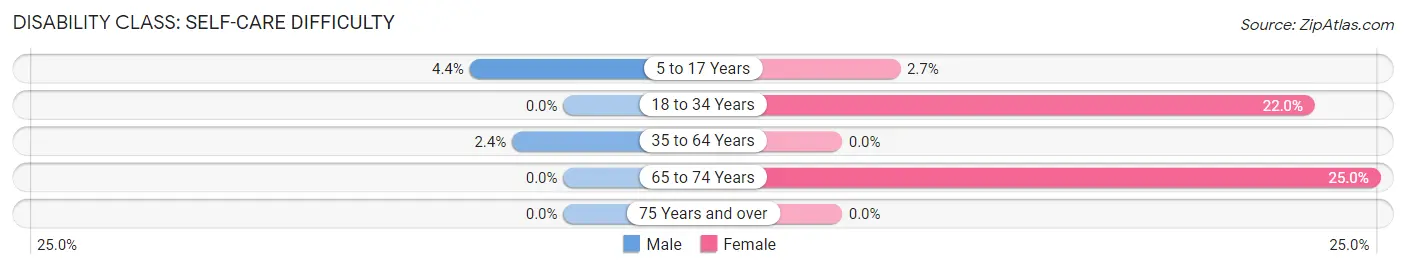
| Age Bracket | Male | Female |
| 5 to 17 Years | 1 (4.3%) | 1 (2.7%) |
| 18 to 34 Years | 0 (0.0%) | 9 (22.0%) |
| 35 to 64 Years | 2 (2.4%) | 0 (0.0%) |
| 65 to 74 Years | 0 (0.0%) | 4 (25.0%) |
| 75 Years and over | 0 (0.0%) | 0 (0.0%) |
Technology Access in Mondamin
Computing Device Access in Mondamin
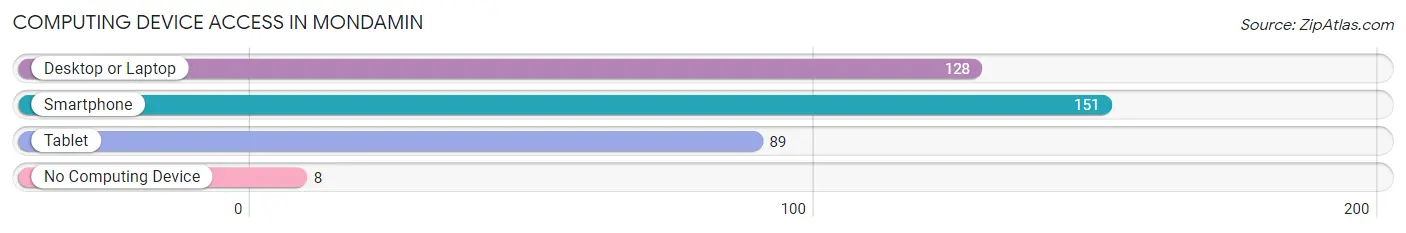
| Device Type | # Households | % Households |
| Desktop or Laptop | 128 | 74.9% |
| Smartphone | 151 | 88.3% |
| Tablet | 89 | 52.0% |
| No Computing Device | 8 | 4.7% |
| Total | 171 | 100.0% |
Internet Access in Mondamin
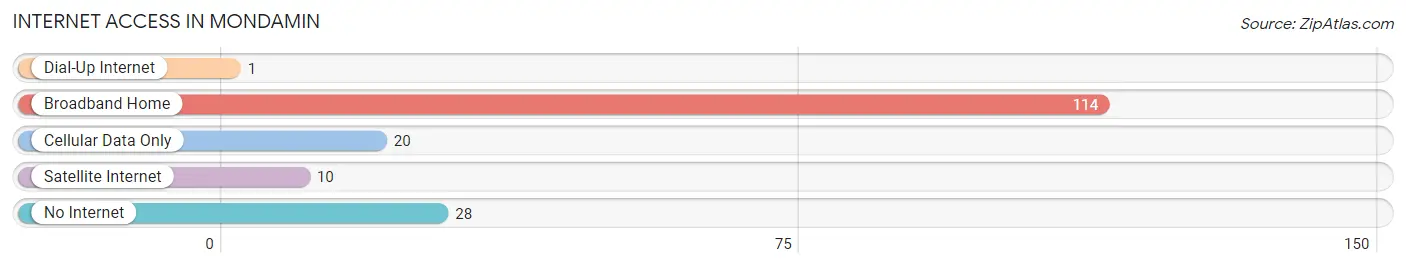
| Internet Type | # Households | % Households |
| Dial-Up Internet | 1 | 0.6% |
| Broadband Home | 114 | 66.7% |
| Cellular Data Only | 20 | 11.7% |
| Satellite Internet | 10 | 5.9% |
| No Internet | 28 | 16.4% |
| Total | 171 | 100.0% |
Mondamin Summary
Mondamin is a small town located in Harrison County, Iowa, United States. It is situated along the Little Sioux River, approximately 10 miles south of the county seat of Logan. The population of Mondamin was estimated to be 441 in the year 2020.
Geography
Mondamin is located at the intersection of Iowa Highway 127 and Iowa Highway 175. It is situated in the Loess Hills region of western Iowa, which is characterized by rolling hills and deep ravines. The town is located on the Little Sioux River, which is a tributary of the Missouri River. The town is surrounded by farmland, with corn and soybeans being the primary crops.
History
Mondamin was founded in 1856 by a group of settlers from Ohio. The town was named after the Native American chief, Mondamin, who was a leader of the Sauk and Fox tribes. The town was originally a trading post and a stop on the stagecoach route between Omaha and Sioux City.
In the late 19th century, Mondamin was a thriving agricultural community. The town was home to several grain elevators, a creamery, a flour mill, and a lumber yard. The town also had a hotel, a bank, and several stores.
In the early 20th century, Mondamin was a popular tourist destination. The town was home to several resorts, including the Mondamin Hotel and the Mondamin Inn. The town also had a movie theater, a bowling alley, and a golf course.
Economy
Mondamin’s economy is largely based on agriculture. The town is home to several grain elevators, a feed mill, and a fertilizer plant. The town also has several small businesses, including a grocery store, a hardware store, and a restaurant.
Demographics
As of the 2020 census, the population of Mondamin was 441. The racial makeup of the town was 97.3% White, 0.2% African American, 0.2% Native American, 0.2% Asian, 0.2% from other races, and 1.9% from two or more races. The median household income was $45,000, and the median family income was $50,000.
Conclusion
Mondamin is a small town located in Harrison County, Iowa. It is situated along the Little Sioux River and is surrounded by farmland. The town was founded in 1856 and has a population of 441 as of 2020. The economy of Mondamin is largely based on agriculture, and the town is home to several small businesses. The racial makeup of the town is predominantly White, with a small percentage of African American, Native American, and Asian residents.
Common Questions
What is Per Capita Income in Mondamin?
Per Capita income in Mondamin is $33,370.
What is the Median Family Income in Mondamin?
Median Family Income in Mondamin is $75,000.
What is the Median Household income in Mondamin?
Median Household Income in Mondamin is $71,354.
What is Income or Wage Gap in Mondamin?
Income or Wage Gap in Mondamin is 24.7%.
Women in Mondamin earn 75.3 cents for every dollar earned by a man.
What is Inequality or Gini Index in Mondamin?
Inequality or Gini Index in Mondamin is 0.37.
What is the Total Population of Mondamin?
Total Population of Mondamin is 389.
What is the Total Male Population of Mondamin?
Total Male Population of Mondamin is 188.
What is the Total Female Population of Mondamin?
Total Female Population of Mondamin is 201.
What is the Ratio of Males per 100 Females in Mondamin?
There are 93.53 Males per 100 Females in Mondamin.
What is the Ratio of Females per 100 Males in Mondamin?
There are 106.91 Females per 100 Males in Mondamin.
What is the Median Population Age in Mondamin?
Median Population Age in Mondamin is 40.4 Years.
What is the Average Family Size in Mondamin
Average Family Size in Mondamin is 2.8 People.
What is the Average Household Size in Mondamin
Average Household Size in Mondamin is 2.3 People.
How Large is the Labor Force in Mondamin?
There are 233 People in the Labor Forcein in Mondamin.
What is the Percentage of People in the Labor Force in Mondamin?
68.7% of People are in the Labor Force in Mondamin.
What is the Unemployment Rate in Mondamin?
Unemployment Rate in Mondamin is 6.4%.