Missouri Valley, IA Map & Demographics
Missouri Valley Map
Missouri Valley Overview
$29,302
PER CAPITA INCOME
$76,181
AVG FAMILY INCOME
$61,480
AVG HOUSEHOLD INCOME
11.9%
WAGE / INCOME GAP [ % ]
88.1¢/ $1
WAGE / INCOME GAP [ $ ]
0.35
INEQUALITY / GINI INDEX
2,692
TOTAL POPULATION
1,288
MALE POPULATION
1,404
FEMALE POPULATION
91.74
MALES / 100 FEMALES
109.01
FEMALES / 100 MALES
39.6
MEDIAN AGE
3.0
AVG FAMILY SIZE
2.2
AVG HOUSEHOLD SIZE
1,272
LABOR FORCE [ PEOPLE ]
60.4%
PERCENT IN LABOR FORCE
4.6%
UNEMPLOYMENT RATE
Missouri Valley Zip Codes
Missouri Valley Area Codes
Income in Missouri Valley
Income Overview in Missouri Valley
Per Capita Income in Missouri Valley is $29,302, while median incomes of families and households are $76,181 and $61,480 respectively.
| Characteristic | Number | Measure |
| Per Capita Income | 2,692 | $29,302 |
| Median Family Income | 645 | $76,181 |
| Mean Family Income | 645 | $77,192 |
| Median Household Income | 1,175 | $61,480 |
| Mean Household Income | 1,175 | $66,006 |
| Income Deficit | 645 | $0 |
| Wage / Income Gap (%) | 2,692 | 11.94% |
| Wage / Income Gap ($) | 2,692 | 88.06¢ per $1 |
| Gini / Inequality Index | 2,692 | 0.35 |
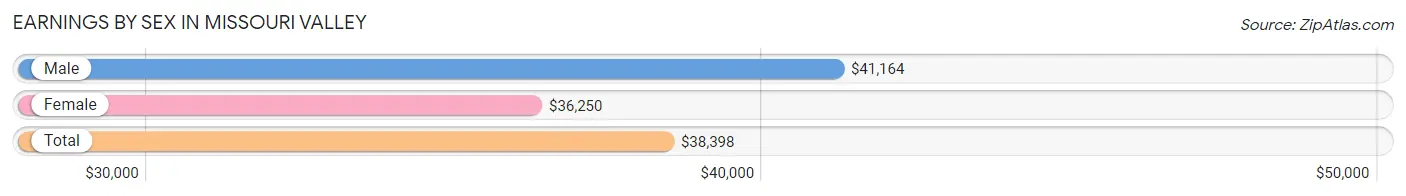
Earnings by Sex in Missouri Valley
Average Earnings in Missouri Valley are $38,398, $41,164 for men and $36,250 for women, a difference of 11.9%.
| Sex | Number | Average Earnings |
| Male | 749 (53.9%) | $41,164 |
| Female | 640 (46.1%) | $36,250 |
| Total | 1,389 (100.0%) | $38,398 |
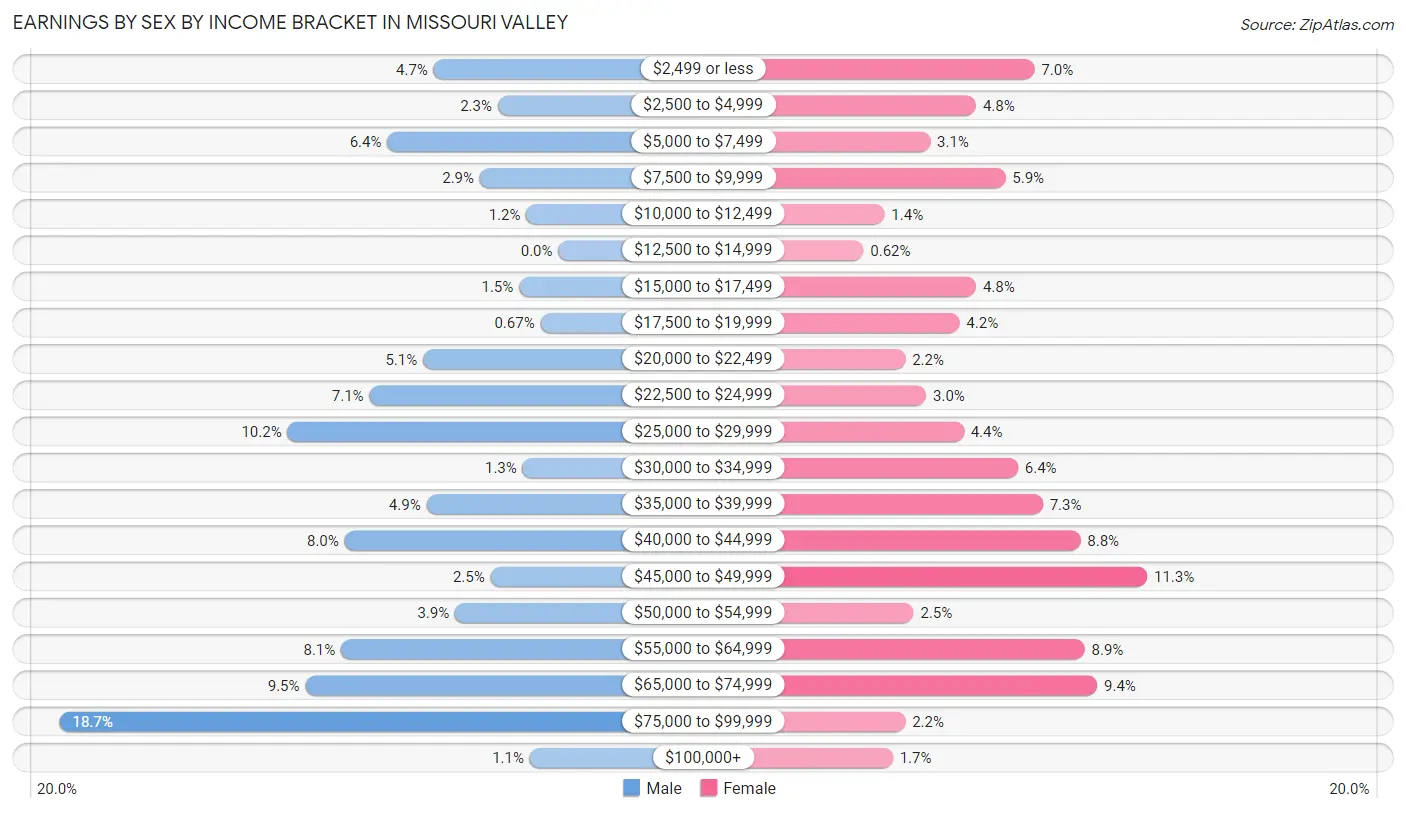
Earnings by Sex by Income Bracket in Missouri Valley
The most common earnings brackets in Missouri Valley are $75,000 to $99,999 for men (140 | 18.7%) and $45,000 to $49,999 for women (72 | 11.3%).
| Income | Male | Female |
| $2,499 or less | 35 (4.7%) | 45 (7.0%) |
| $2,500 to $4,999 | 17 (2.3%) | 31 (4.8%) |
| $5,000 to $7,499 | 48 (6.4%) | 20 (3.1%) |
| $7,500 to $9,999 | 22 (2.9%) | 38 (5.9%) |
| $10,000 to $12,499 | 9 (1.2%) | 9 (1.4%) |
| $12,500 to $14,999 | 0 (0.0%) | 4 (0.6%) |
| $15,000 to $17,499 | 11 (1.5%) | 31 (4.8%) |
| $17,500 to $19,999 | 5 (0.7%) | 27 (4.2%) |
| $20,000 to $22,499 | 38 (5.1%) | 14 (2.2%) |
| $22,500 to $24,999 | 53 (7.1%) | 19 (3.0%) |
| $25,000 to $29,999 | 76 (10.2%) | 28 (4.4%) |
| $30,000 to $34,999 | 10 (1.3%) | 41 (6.4%) |
| $35,000 to $39,999 | 37 (4.9%) | 47 (7.3%) |
| $40,000 to $44,999 | 60 (8.0%) | 56 (8.7%) |
| $45,000 to $49,999 | 19 (2.5%) | 72 (11.3%) |
| $50,000 to $54,999 | 29 (3.9%) | 16 (2.5%) |
| $55,000 to $64,999 | 61 (8.1%) | 57 (8.9%) |
| $65,000 to $74,999 | 71 (9.5%) | 60 (9.4%) |
| $75,000 to $99,999 | 140 (18.7%) | 14 (2.2%) |
| $100,000+ | 8 (1.1%) | 11 (1.7%) |
| Total | 749 (100.0%) | 640 (100.0%) |
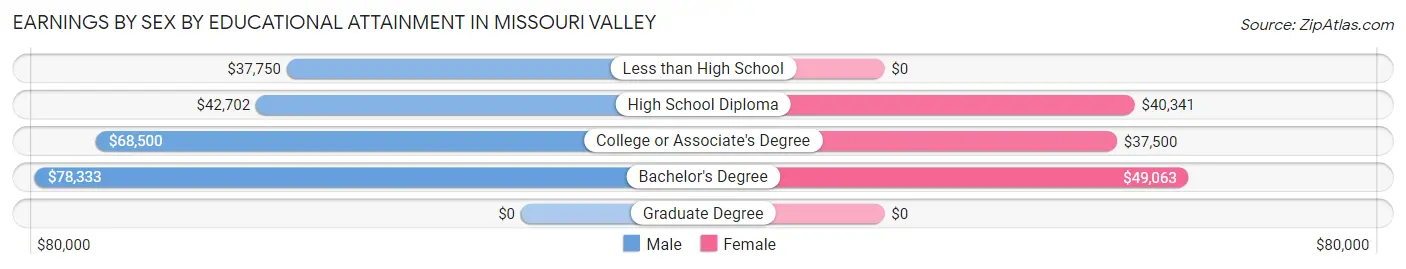
Earnings by Sex by Educational Attainment in Missouri Valley
Average earnings in Missouri Valley are $47,500 for men and $40,545 for women, a difference of 14.6%. Men with an educational attainment of bachelor's degree enjoy the highest average annual earnings of $78,333, while those with less than high school education earn the least with $37,750. Women with an educational attainment of bachelor's degree earn the most with the average annual earnings of $49,063, while those with college or associate's degree education have the smallest earnings of $37,500.
| Educational Attainment | Male Income | Female Income |
| Less than High School | $37,750 | $0 |
| High School Diploma | $42,702 | $40,341 |
| College or Associate's Degree | $68,500 | $37,500 |
| Bachelor's Degree | $78,333 | $49,063 |
| Graduate Degree | - | - |
| Total | $47,500 | $40,545 |
Family Income in Missouri Valley
Family Income Brackets in Missouri Valley
According to the Missouri Valley family income data, there are 165 families falling into the $75,000 to $99,999 income range, which is the most common income bracket and makes up 25.6% of all families.
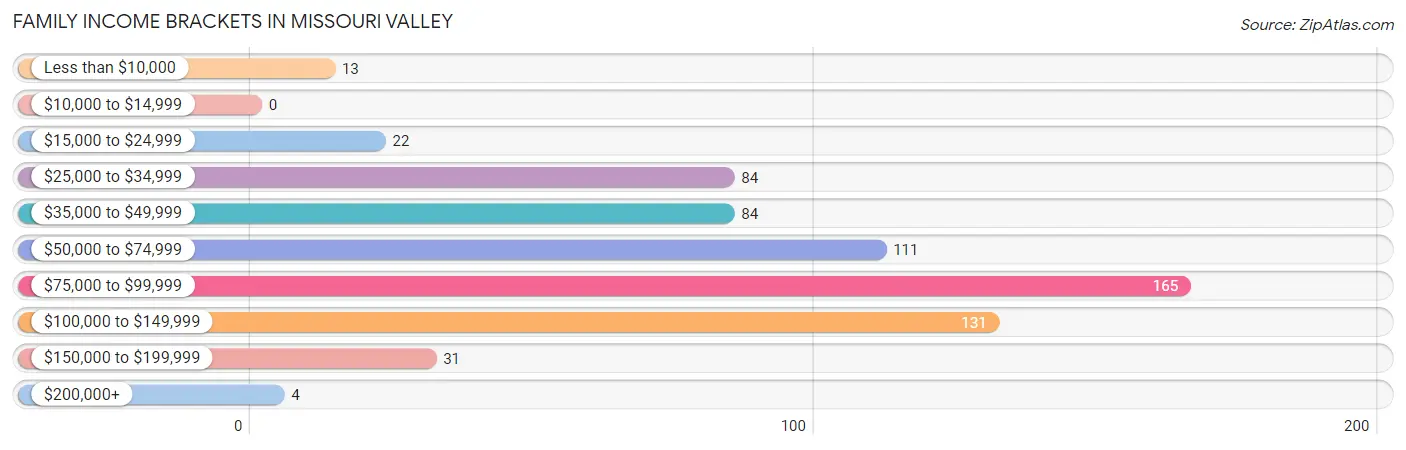
| Income Bracket | # Families | % Families |
| Less than $10,000 | 13 | 2.0% |
| $10,000 to $14,999 | 0 | 0.0% |
| $15,000 to $24,999 | 22 | 3.4% |
| $25,000 to $34,999 | 84 | 13.0% |
| $35,000 to $49,999 | 84 | 13.0% |
| $50,000 to $74,999 | 111 | 17.2% |
| $75,000 to $99,999 | 165 | 25.6% |
| $100,000 to $149,999 | 131 | 20.3% |
| $150,000 to $199,999 | 31 | 4.8% |
| $200,000+ | 4 | 0.6% |
Family Income by Famaliy Size in Missouri Valley
5-person families (37 | 5.7%) account for the highest median family income in Missouri Valley with $88,393 per family, while 2-person families (258 | 40.0%) have the highest median income of $31,600 per family member.
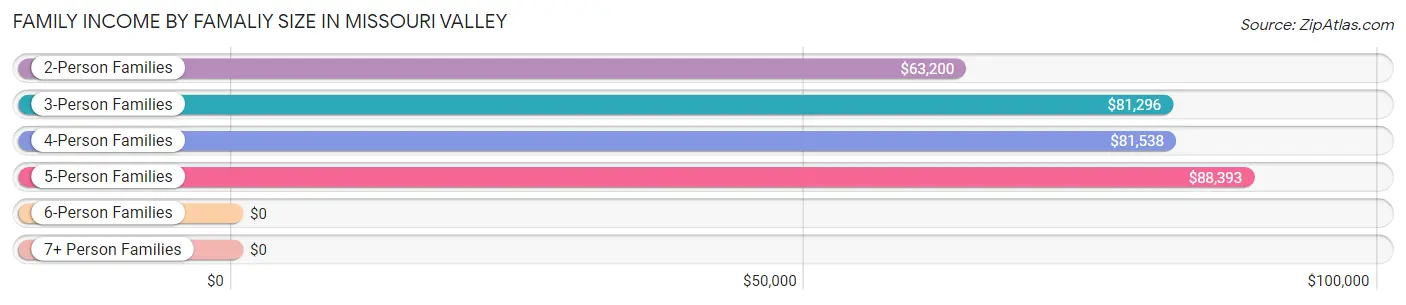
| Income Bracket | # Families | Median Income |
| 2-Person Families | 258 (40.0%) | $63,200 |
| 3-Person Families | 142 (22.0%) | $81,296 |
| 4-Person Families | 196 (30.4%) | $81,538 |
| 5-Person Families | 37 (5.7%) | $88,393 |
| 6-Person Families | 6 (0.9%) | $0 |
| 7+ Person Families | 6 (0.9%) | $0 |
| Total | 645 (100.0%) | $76,181 |
Family Income by Number of Earners in Missouri Valley
The median family income in Missouri Valley is $76,181, with families comprising 3+ earners (60) having the highest median family income of $109,773, while families with 1 earner (193) have the lowest median family income of $37,589, accounting for 9.3% and 29.9% of families, respectively.
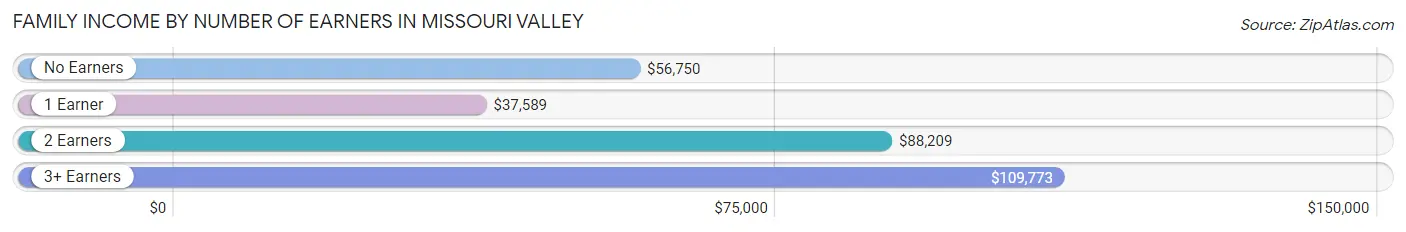
| Number of Earners | # Families | Median Income |
| No Earners | 91 (14.1%) | $56,750 |
| 1 Earner | 193 (29.9%) | $37,589 |
| 2 Earners | 301 (46.7%) | $88,209 |
| 3+ Earners | 60 (9.3%) | $109,773 |
| Total | 645 (100.0%) | $76,181 |
Household Income in Missouri Valley
Household Income Brackets in Missouri Valley
With 247 households falling in the category, the $50,000 to $74,999 income range is the most frequent in Missouri Valley, accounting for 21.0% of all households. In contrast, only 7 households (0.6%) fall into the $200,000+ income bracket, making it the least populous group.
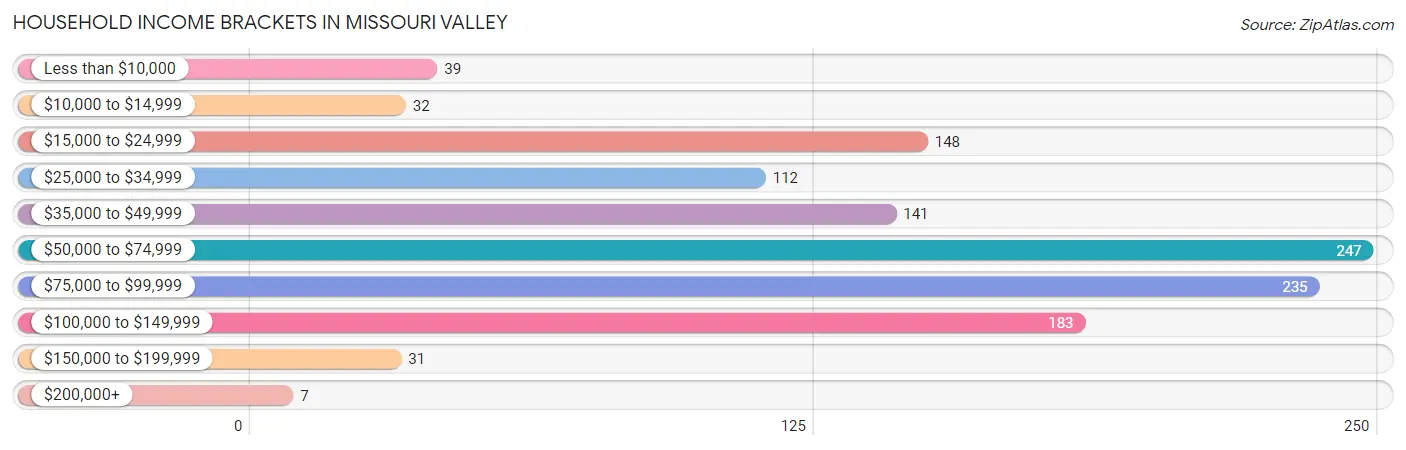
| Income Bracket | # Households | % Households |
| Less than $10,000 | 39 | 3.3% |
| $10,000 to $14,999 | 32 | 2.7% |
| $15,000 to $24,999 | 148 | 12.6% |
| $25,000 to $34,999 | 112 | 9.5% |
| $35,000 to $49,999 | 141 | 12.0% |
| $50,000 to $74,999 | 247 | 21.0% |
| $75,000 to $99,999 | 235 | 20.0% |
| $100,000 to $149,999 | 183 | 15.6% |
| $150,000 to $199,999 | 31 | 2.6% |
| $200,000+ | 7 | 0.6% |
Household Income by Householder Age in Missouri Valley
The median household income in Missouri Valley is $61,480, with the highest median household income of $75,900 found in the 25 to 44 years age bracket for the primary householder. A total of 362 households (30.8%) fall into this category. Meanwhile, the 65+ years age bracket for the primary householder has the lowest median household income of $40,179, with 335 households (28.5%) in this group.
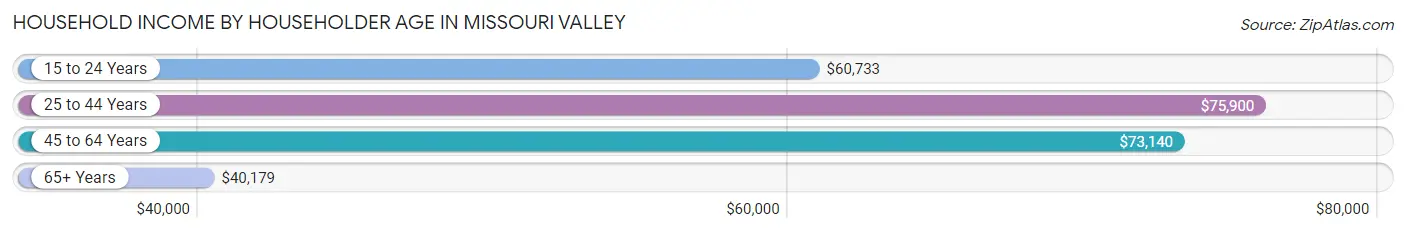
| Income Bracket | # Households | Median Income |
| 15 to 24 Years | 79 (6.7%) | $60,733 |
| 25 to 44 Years | 362 (30.8%) | $75,900 |
| 45 to 64 Years | 399 (34.0%) | $73,140 |
| 65+ Years | 335 (28.5%) | $40,179 |
| Total | 1,175 (100.0%) | $61,480 |
Poverty in Missouri Valley
Income Below Poverty by Sex and Age in Missouri Valley
With 6.6% poverty level for males and 12.0% for females among the residents of Missouri Valley, 15 year old males and 18 to 24 year old females are the most vulnerable to poverty, with 4 males (100.0%) and 36 females (29.7%) in their respective age groups living below the poverty level.
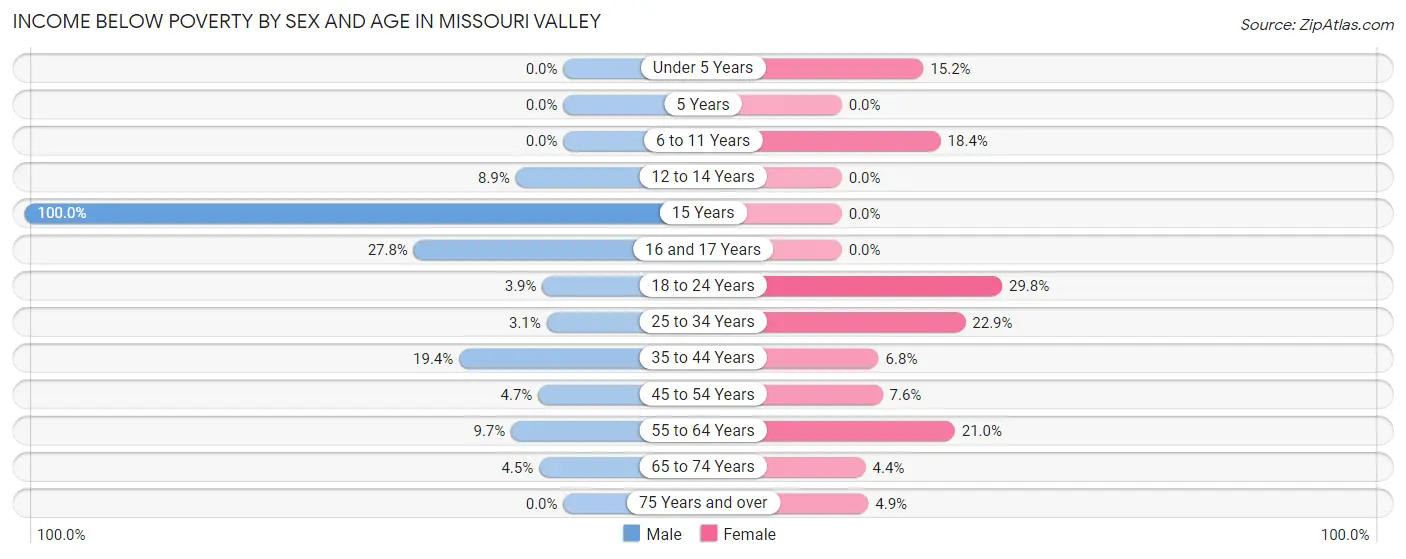
| Age Bracket | Male | Female |
| Under 5 Years | 0 (0.0%) | 10 (15.1%) |
| 5 Years | 0 (0.0%) | 0 (0.0%) |
| 6 to 11 Years | 0 (0.0%) | 20 (18.3%) |
| 12 to 14 Years | 7 (8.9%) | 0 (0.0%) |
| 15 Years | 4 (100.0%) | 0 (0.0%) |
| 16 and 17 Years | 5 (27.8%) | 0 (0.0%) |
| 18 to 24 Years | 6 (3.9%) | 36 (29.7%) |
| 25 to 34 Years | 5 (3.1%) | 25 (22.9%) |
| 35 to 44 Years | 30 (19.4%) | 13 (6.8%) |
| 45 to 54 Years | 7 (4.7%) | 16 (7.6%) |
| 55 to 64 Years | 13 (9.7%) | 26 (21.0%) |
| 65 to 74 Years | 6 (4.5%) | 5 (4.4%) |
| 75 Years and over | 0 (0.0%) | 7 (4.9%) |
| Total | 83 (6.6%) | 158 (12.0%) |
Income Above Poverty by Sex and Age in Missouri Valley
According to the poverty statistics in Missouri Valley, males aged under 5 years and females aged 5 years are the age groups that are most secure financially, with 100.0% of males and 100.0% of females in these age groups living above the poverty line.
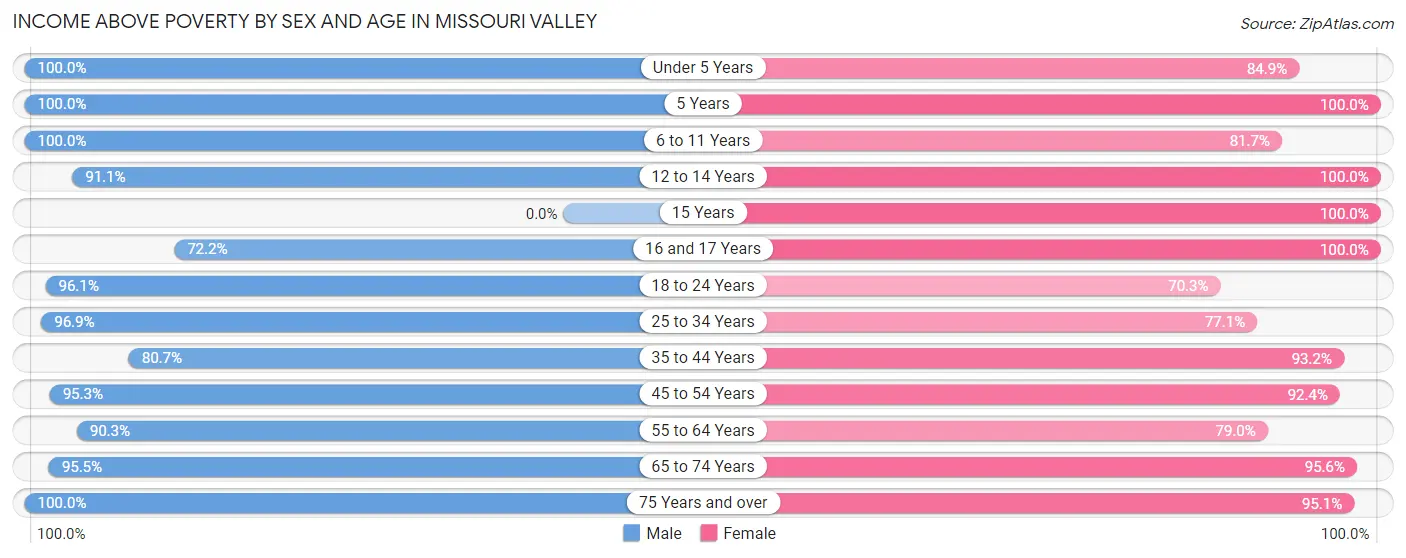
| Age Bracket | Male | Female |
| Under 5 Years | 59 (100.0%) | 56 (84.9%) |
| 5 Years | 13 (100.0%) | 9 (100.0%) |
| 6 to 11 Years | 132 (100.0%) | 89 (81.7%) |
| 12 to 14 Years | 72 (91.1%) | 74 (100.0%) |
| 15 Years | 0 (0.0%) | 41 (100.0%) |
| 16 and 17 Years | 13 (72.2%) | 8 (100.0%) |
| 18 to 24 Years | 148 (96.1%) | 85 (70.3%) |
| 25 to 34 Years | 156 (96.9%) | 84 (77.1%) |
| 35 to 44 Years | 125 (80.6%) | 177 (93.2%) |
| 45 to 54 Years | 143 (95.3%) | 195 (92.4%) |
| 55 to 64 Years | 121 (90.3%) | 98 (79.0%) |
| 65 to 74 Years | 127 (95.5%) | 108 (95.6%) |
| 75 Years and over | 74 (100.0%) | 135 (95.1%) |
| Total | 1,183 (93.4%) | 1,159 (88.0%) |
Income Below Poverty Among Married-Couple Families in Missouri Valley
The poverty statistics for married-couple families in Missouri Valley show that 2.0% or 9 of the total 456 families live below the poverty line. Families with 5 or more children have the highest poverty rate of 100.0%, comprising of 3 families. On the other hand, families with 3 or 4 children have the lowest poverty rate of 0.0%, which includes 0 families.
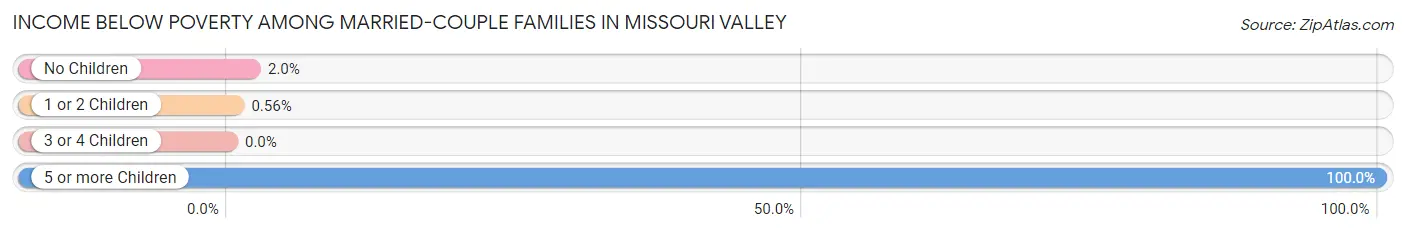
| Children | Above Poverty | Below Poverty |
| No Children | 245 (98.0%) | 5 (2.0%) |
| 1 or 2 Children | 178 (99.4%) | 1 (0.6%) |
| 3 or 4 Children | 24 (100.0%) | 0 (0.0%) |
| 5 or more Children | 0 (0.0%) | 3 (100.0%) |
| Total | 447 (98.0%) | 9 (2.0%) |
Income Below Poverty Among Single-Parent Households in Missouri Valley
According to the poverty data in Missouri Valley, 6.3% or 5 single-father households and 10.9% or 12 single-mother households are living below the poverty line. Among single-father households, those with 1 or 2 children have the highest poverty rate, with 5 households (13.9%) experiencing poverty. Likewise, among single-mother households, those with no children have the highest poverty rate, with 3 households (15.8%) falling below the poverty line.
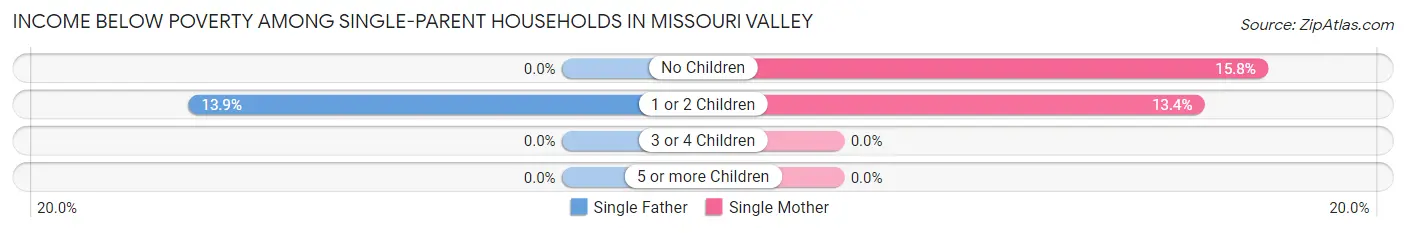
| Children | Single Father | Single Mother |
| No Children | 0 (0.0%) | 3 (15.8%) |
| 1 or 2 Children | 5 (13.9%) | 9 (13.4%) |
| 3 or 4 Children | 0 (0.0%) | 0 (0.0%) |
| 5 or more Children | 0 (0.0%) | 0 (0.0%) |
| Total | 5 (6.3%) | 12 (10.9%) |
Income Below Poverty Among Married-Couple vs Single-Parent Households in Missouri Valley
The poverty data for Missouri Valley shows that 9 of the married-couple family households (2.0%) and 17 of the single-parent households (9.0%) are living below the poverty level. Within the married-couple family households, those with 5 or more children have the highest poverty rate, with 3 households (100.0%) falling below the poverty line. Among the single-parent households, those with 1 or 2 children have the highest poverty rate, with 14 household (13.6%) living below poverty.
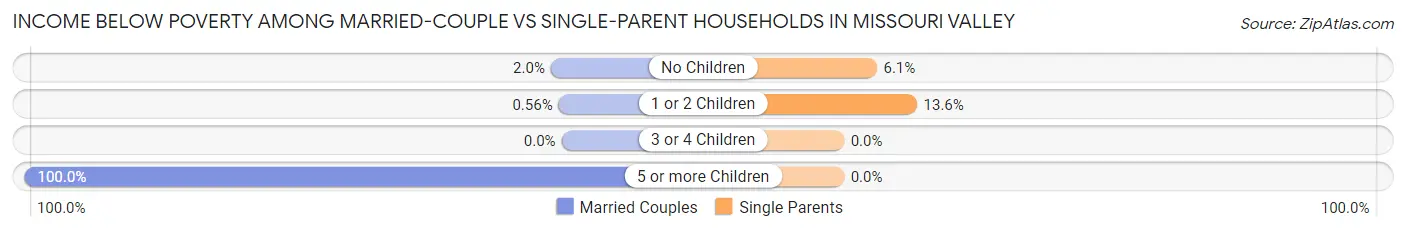
| Children | Married-Couple Families | Single-Parent Households |
| No Children | 5 (2.0%) | 3 (6.1%) |
| 1 or 2 Children | 1 (0.6%) | 14 (13.6%) |
| 3 or 4 Children | 0 (0.0%) | 0 (0.0%) |
| 5 or more Children | 3 (100.0%) | 0 (0.0%) |
| Total | 9 (2.0%) | 17 (9.0%) |
Race in Missouri Valley
The most populous races in Missouri Valley are White / Caucasian (2,608 | 96.9%), Two or more Races (80 | 3.0%), and Hispanic or Latino (30 | 1.1%).
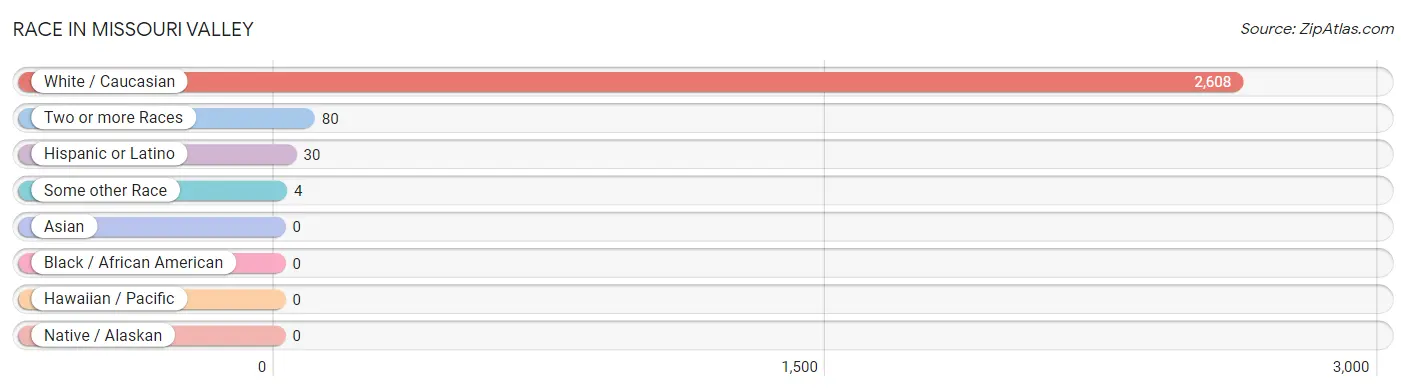
| Race | # Population | % Population |
| Asian | 0 | 0.0% |
| Black / African American | 0 | 0.0% |
| Hawaiian / Pacific | 0 | 0.0% |
| Hispanic or Latino | 30 | 1.1% |
| Native / Alaskan | 0 | 0.0% |
| White / Caucasian | 2,608 | 96.9% |
| Two or more Races | 80 | 3.0% |
| Some other Race | 4 | 0.2% |
| Total | 2,692 | 100.0% |
Ancestry in Missouri Valley
The most populous ancestries reported in Missouri Valley are German (986 | 36.6%), Irish (339 | 12.6%), English (216 | 8.0%), American (105 | 3.9%), and Italian (70 | 2.6%), together accounting for 63.7% of all Missouri Valley residents.
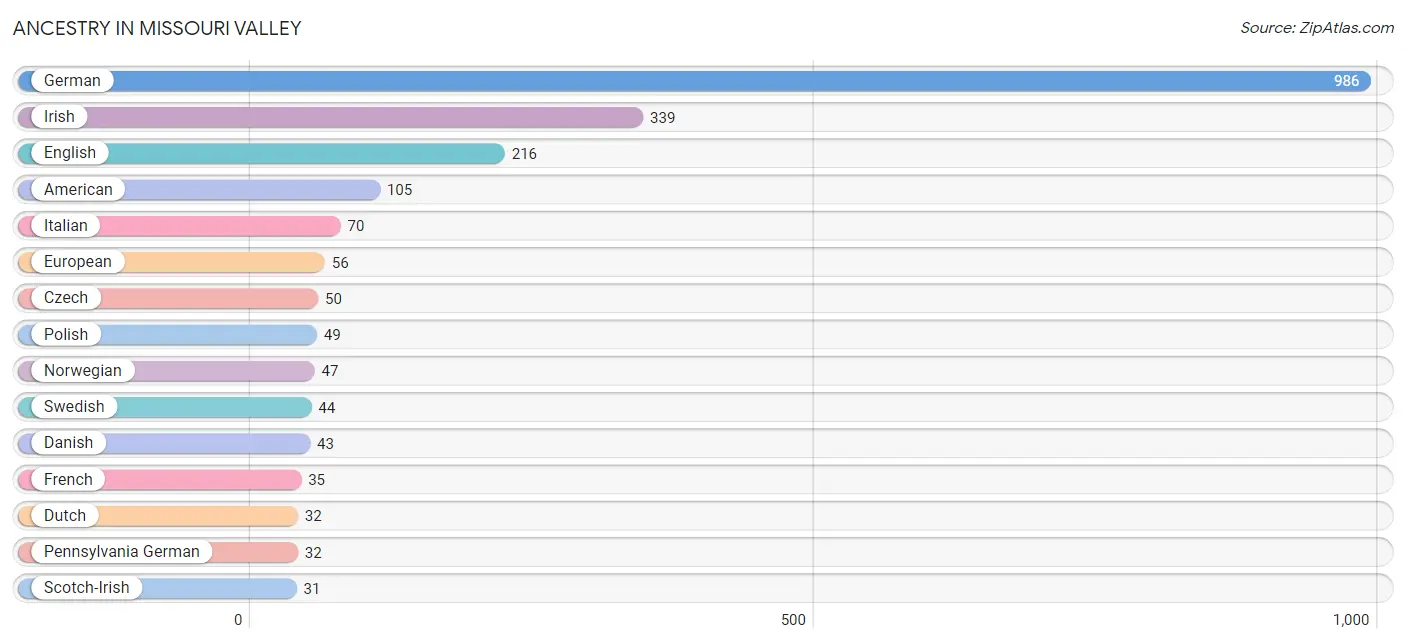
| Ancestry | # Population | % Population |
| American | 105 | 3.9% |
| Belgian | 5 | 0.2% |
| British | 4 | 0.2% |
| Canadian | 5 | 0.2% |
| Cherokee | 16 | 0.6% |
| Chippewa | 29 | 1.1% |
| Cuban | 3 | 0.1% |
| Czech | 50 | 1.9% |
| Danish | 43 | 1.6% |
| Dutch | 32 | 1.2% |
| English | 216 | 8.0% |
| European | 56 | 2.1% |
| French | 35 | 1.3% |
| German | 986 | 36.6% |
| Hungarian | 8 | 0.3% |
| Irish | 339 | 12.6% |
| Italian | 70 | 2.6% |
| Luxembourger | 9 | 0.3% |
| Mexican | 18 | 0.7% |
| Norwegian | 47 | 1.8% |
| Pennsylvania German | 32 | 1.2% |
| Polish | 49 | 1.8% |
| Russian | 6 | 0.2% |
| Scandinavian | 10 | 0.4% |
| Scotch-Irish | 31 | 1.1% |
| Scottish | 23 | 0.9% |
| Serbian | 7 | 0.3% |
| Swedish | 44 | 1.6% |
| Swiss | 9 | 0.3% |
| Welsh | 10 | 0.4% | View All 30 Rows |
Immigrants in Missouri Valley

| Immigration Origin | # Population | % Population | View All 0 Rows |
Sex and Age in Missouri Valley
Sex and Age in Missouri Valley
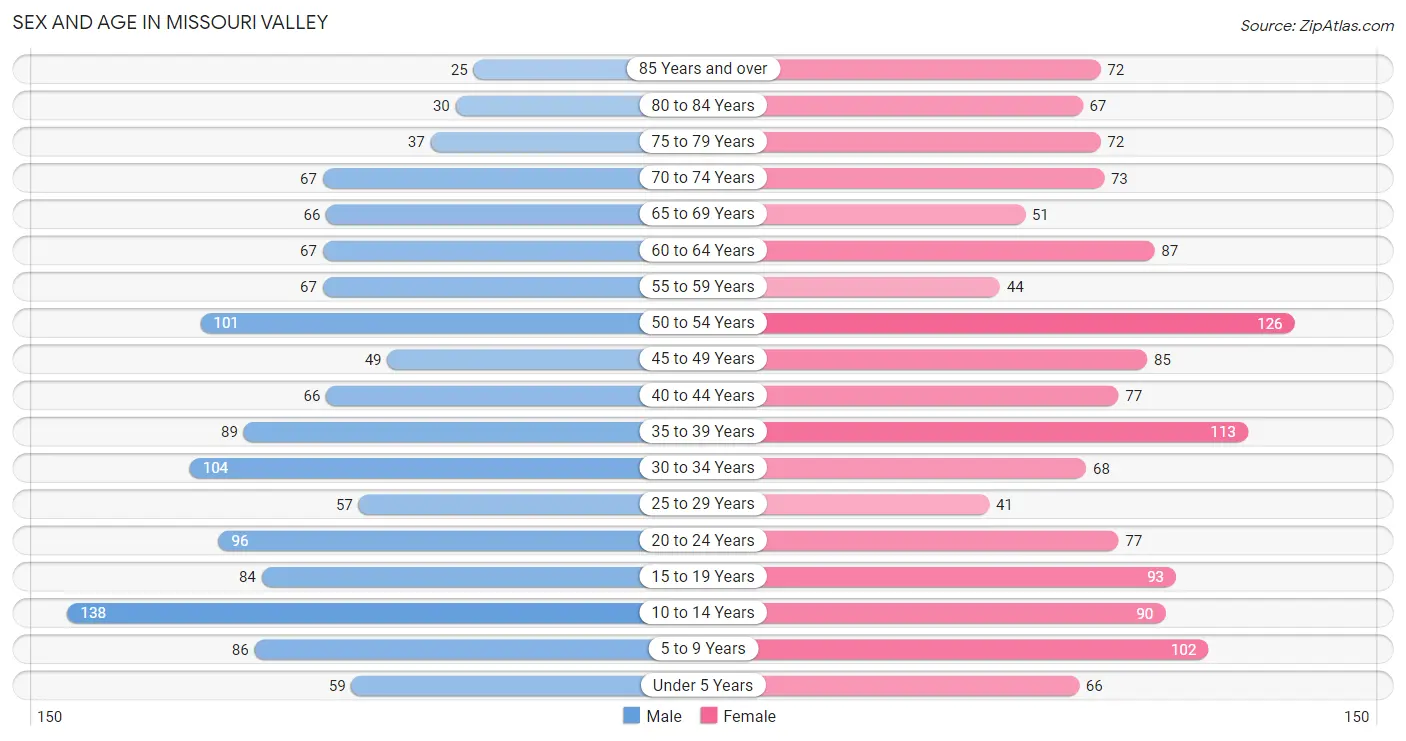
The most populous age groups in Missouri Valley are 10 to 14 Years (138 | 10.7%) for men and 50 to 54 Years (126 | 9.0%) for women.
| Age Bracket | Male | Female |
| Under 5 Years | 59 (4.6%) | 66 (4.7%) |
| 5 to 9 Years | 86 (6.7%) | 102 (7.3%) |
| 10 to 14 Years | 138 (10.7%) | 90 (6.4%) |
| 15 to 19 Years | 84 (6.5%) | 93 (6.6%) |
| 20 to 24 Years | 96 (7.4%) | 77 (5.5%) |
| 25 to 29 Years | 57 (4.4%) | 41 (2.9%) |
| 30 to 34 Years | 104 (8.1%) | 68 (4.8%) |
| 35 to 39 Years | 89 (6.9%) | 113 (8.1%) |
| 40 to 44 Years | 66 (5.1%) | 77 (5.5%) |
| 45 to 49 Years | 49 (3.8%) | 85 (6.0%) |
| 50 to 54 Years | 101 (7.8%) | 126 (9.0%) |
| 55 to 59 Years | 67 (5.2%) | 44 (3.1%) |
| 60 to 64 Years | 67 (5.2%) | 87 (6.2%) |
| 65 to 69 Years | 66 (5.1%) | 51 (3.6%) |
| 70 to 74 Years | 67 (5.2%) | 73 (5.2%) |
| 75 to 79 Years | 37 (2.9%) | 72 (5.1%) |
| 80 to 84 Years | 30 (2.3%) | 67 (4.8%) |
| 85 Years and over | 25 (1.9%) | 72 (5.1%) |
| Total | 1,288 (100.0%) | 1,404 (100.0%) |
Families and Households in Missouri Valley
Median Family Size in Missouri Valley
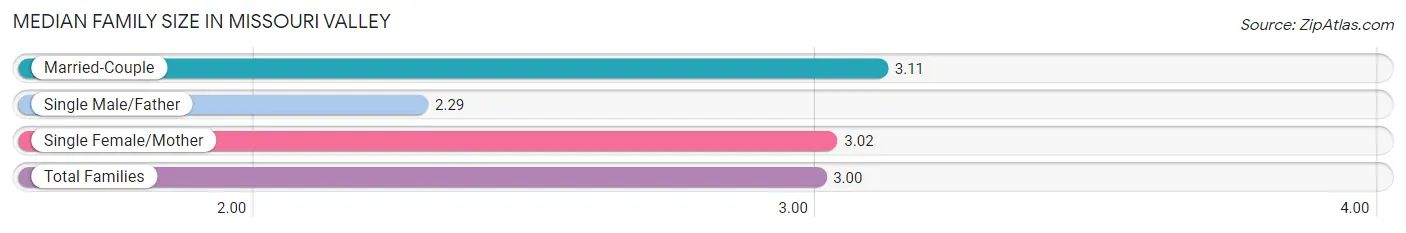
The median family size in Missouri Valley is 3.00 persons per family, with married-couple families (456 | 70.7%) accounting for the largest median family size of 3.11 persons per family. On the other hand, single male/father families (79 | 12.2%) represent the smallest median family size with 2.29 persons per family.
| Family Type | # Families | Family Size |
| Married-Couple | 456 (70.7%) | 3.11 |
| Single Male/Father | 79 (12.2%) | 2.29 |
| Single Female/Mother | 110 (17.1%) | 3.02 |
| Total Families | 645 (100.0%) | 3.00 |
Median Household Size in Missouri Valley
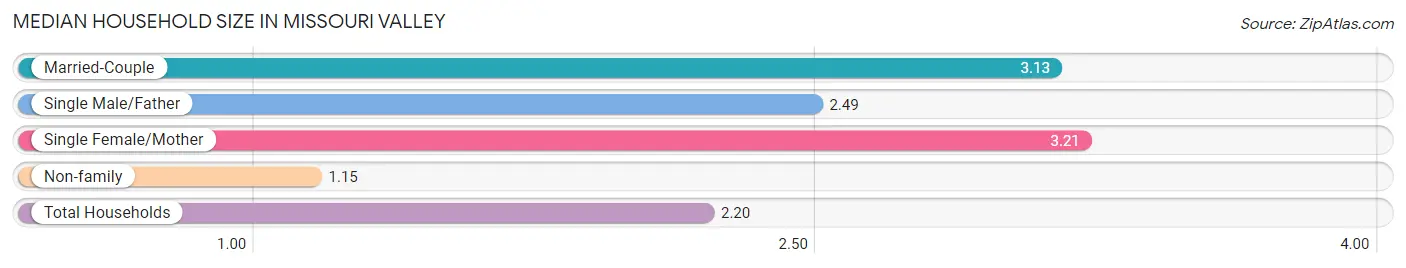
The median household size in Missouri Valley is 2.20 persons per household, with single female/mother households (110 | 9.4%) accounting for the largest median household size of 3.21 persons per household. non-family households (530 | 45.1%) represent the smallest median household size with 1.15 persons per household.
| Household Type | # Households | Household Size |
| Married-Couple | 456 (38.8%) | 3.13 |
| Single Male/Father | 79 (6.7%) | 2.49 |
| Single Female/Mother | 110 (9.4%) | 3.21 |
| Non-family | 530 (45.1%) | 1.15 |
| Total Households | 1,175 (100.0%) | 2.20 |
Household Size by Marriage Status in Missouri Valley
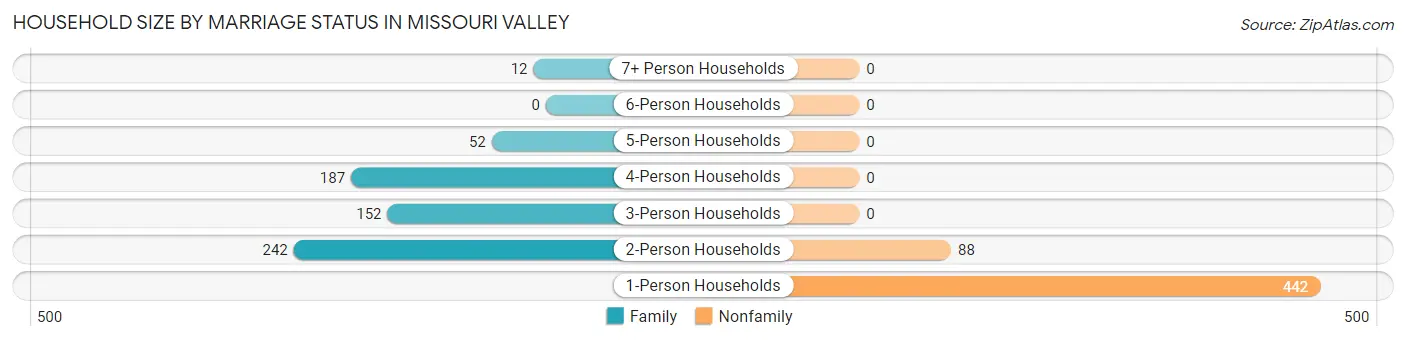
Out of a total of 1,175 households in Missouri Valley, 645 (54.9%) are family households, while 530 (45.1%) are nonfamily households. The most numerous type of family households are 2-person households, comprising 242, and the most common type of nonfamily households are 1-person households, comprising 442.
| Household Size | Family Households | Nonfamily Households |
| 1-Person Households | - | 442 (37.6%) |
| 2-Person Households | 242 (20.6%) | 88 (7.5%) |
| 3-Person Households | 152 (12.9%) | 0 (0.0%) |
| 4-Person Households | 187 (15.9%) | 0 (0.0%) |
| 5-Person Households | 52 (4.4%) | 0 (0.0%) |
| 6-Person Households | 0 (0.0%) | 0 (0.0%) |
| 7+ Person Households | 12 (1.0%) | 0 (0.0%) |
| Total | 645 (54.9%) | 530 (45.1%) |
Female Fertility in Missouri Valley
Fertility by Age in Missouri Valley
Average fertility rate in Missouri Valley is 87.0 births per 1,000 women. Women in the age bracket of 20 to 34 years have the highest fertility rate with 183.0 births per 1,000 women. Women in the age bracket of 20 to 34 years acount for 69.4% of all women with births.
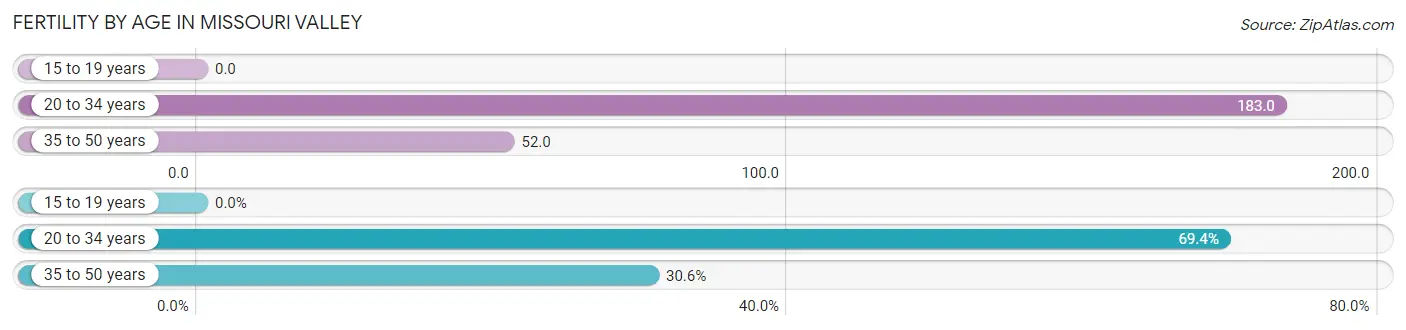
| Age Bracket | Women with Births | Births / 1,000 Women |
| 15 to 19 years | 0 (0.0%) | 0.0 |
| 20 to 34 years | 34 (69.4%) | 183.0 |
| 35 to 50 years | 15 (30.6%) | 52.0 |
| Total | 49 (100.0%) | 87.0 |
Fertility by Age by Marriage Status in Missouri Valley
69.4% of women with births (49) in Missouri Valley are married. The highest percentage of unmarried women with births falls into 35 to 50 years age bracket with 100.0% of them unmarried at the time of birth, while the lowest percentage of unmarried women with births belong to 20 to 34 years age bracket with 0.0% of them unmarried.
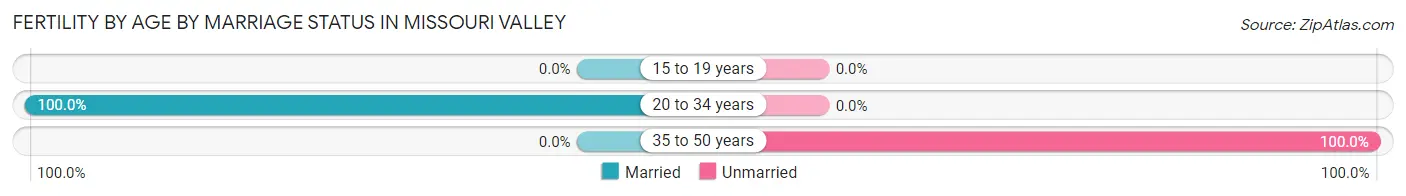
| Age Bracket | Married | Unmarried |
| 15 to 19 years | 0 (0.0%) | 0 (0.0%) |
| 20 to 34 years | 34 (100.0%) | 0 (0.0%) |
| 35 to 50 years | 0 (0.0%) | 15 (100.0%) |
| Total | 34 (69.4%) | 15 (30.6%) |
Fertility by Education in Missouri Valley
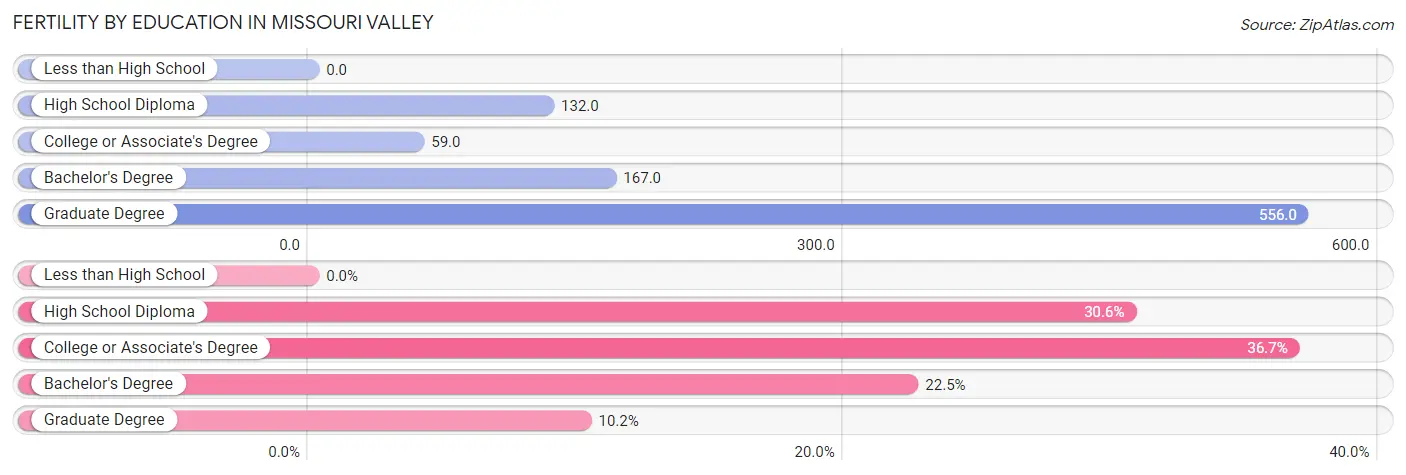
| Educational Attainment | Women with Births | Births / 1,000 Women |
| Less than High School | 0 (0.0%) | 0.0 |
| High School Diploma | 15 (30.6%) | 132.0 |
| College or Associate's Degree | 18 (36.7%) | 59.0 |
| Bachelor's Degree | 11 (22.5%) | 167.0 |
| Graduate Degree | 5 (10.2%) | 556.0 |
| Total | 49 (100.0%) | 87.0 |
Fertility by Education by Marriage Status in Missouri Valley
30.6% of women with births in Missouri Valley are unmarried. Women with the educational attainment of college or associate's degree are most likely to be married with 100.0% of them married at childbirth, while women with the educational attainment of high school diploma are least likely to be married with 100.0% of them unmarried at childbirth.
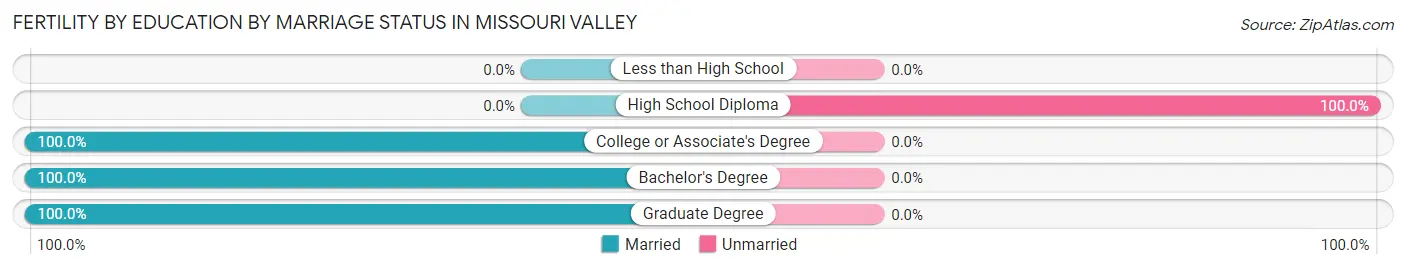
| Educational Attainment | Married | Unmarried |
| Less than High School | 0 (0.0%) | 0 (0.0%) |
| High School Diploma | 0 (0.0%) | 15 (100.0%) |
| College or Associate's Degree | 18 (100.0%) | 0 (0.0%) |
| Bachelor's Degree | 11 (100.0%) | 0 (0.0%) |
| Graduate Degree | 5 (100.0%) | 0 (0.0%) |
| Total | 34 (69.4%) | 15 (30.6%) |
Employment Characteristics in Missouri Valley
Employment by Class of Employer in Missouri Valley
Among the 1,196 employed individuals in Missouri Valley, private company employees (906 | 75.7%), not-for-profit organizations (81 | 6.8%), and local government employees (53 | 4.4%) make up the most common classes of employment.
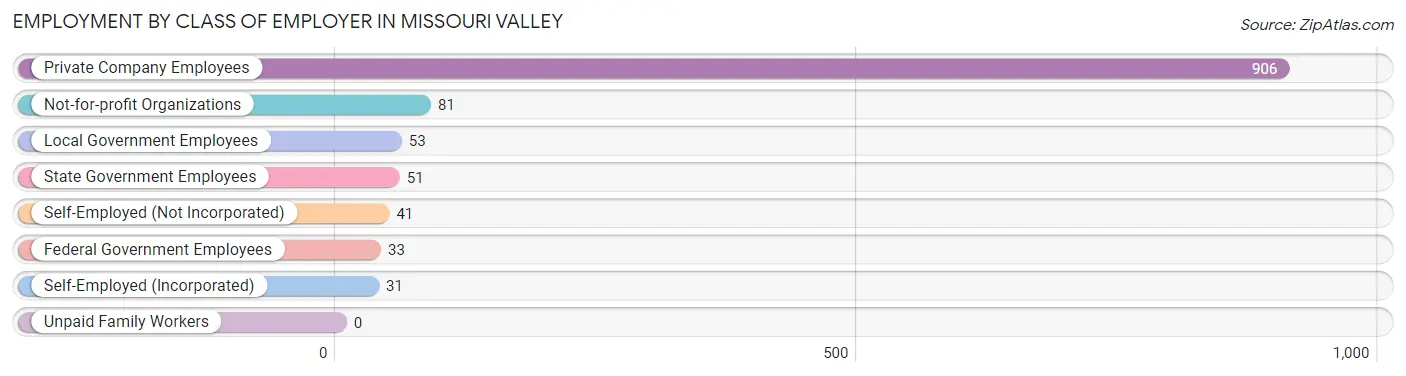
| Employer Class | # Employees | % Employees |
| Private Company Employees | 906 | 75.7% |
| Self-Employed (Incorporated) | 31 | 2.6% |
| Self-Employed (Not Incorporated) | 41 | 3.4% |
| Not-for-profit Organizations | 81 | 6.8% |
| Local Government Employees | 53 | 4.4% |
| State Government Employees | 51 | 4.3% |
| Federal Government Employees | 33 | 2.8% |
| Unpaid Family Workers | 0 | 0.0% |
| Total | 1,196 | 100.0% |
Employment Status by Age in Missouri Valley
According to the labor force statistics for Missouri Valley, out of the total population over 16 years of age (2,106), 60.4% or 1,272 individuals are in the labor force, with 4.6% or 59 of them unemployed. The age group with the highest labor force participation rate is 35 to 44 years, with 92.2% or 318 individuals in the labor force. Within the labor force, the 16 to 19 years age range has the highest percentage of unemployed individuals, with 15.9% or 7 of them being unemployed.
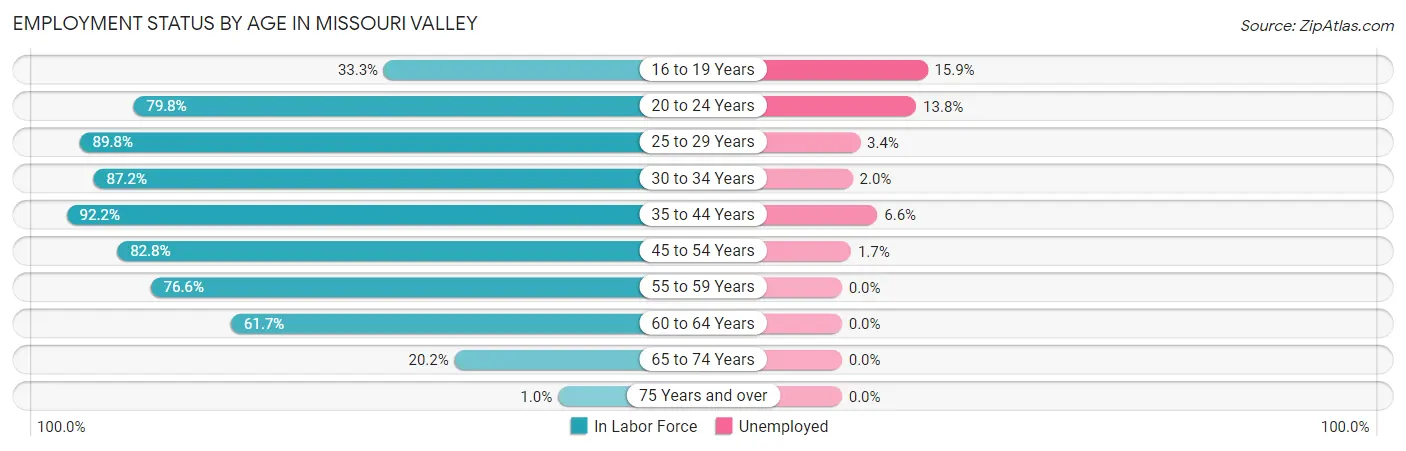
| Age Bracket | In Labor Force | Unemployed |
| 16 to 19 Years | 44 (33.3%) | 7 (15.9%) |
| 20 to 24 Years | 138 (79.8%) | 19 (13.8%) |
| 25 to 29 Years | 88 (89.8%) | 3 (3.4%) |
| 30 to 34 Years | 150 (87.2%) | 3 (2.0%) |
| 35 to 44 Years | 318 (92.2%) | 21 (6.6%) |
| 45 to 54 Years | 299 (82.8%) | 5 (1.7%) |
| 55 to 59 Years | 85 (76.6%) | 0 (0.0%) |
| 60 to 64 Years | 95 (61.7%) | 0 (0.0%) |
| 65 to 74 Years | 52 (20.2%) | 0 (0.0%) |
| 75 Years and over | 3 (1.0%) | 0 (0.0%) |
| Total | 1,272 (60.4%) | 59 (4.6%) |
Employment Status by Educational Attainment in Missouri Valley
According to labor force statistics for Missouri Valley, 83.4% of individuals (1,035) out of the total population between 25 and 64 years of age (1,241) are in the labor force, with 3.1% or 32 of them being unemployed. The group with the highest labor force participation rate are those with the educational attainment of bachelor's degree or higher, with 97.0% or 162 individuals in the labor force. Within the labor force, individuals with less than high school education have the highest percentage of unemployment, with 34.2% or 26 of them being unemployed.
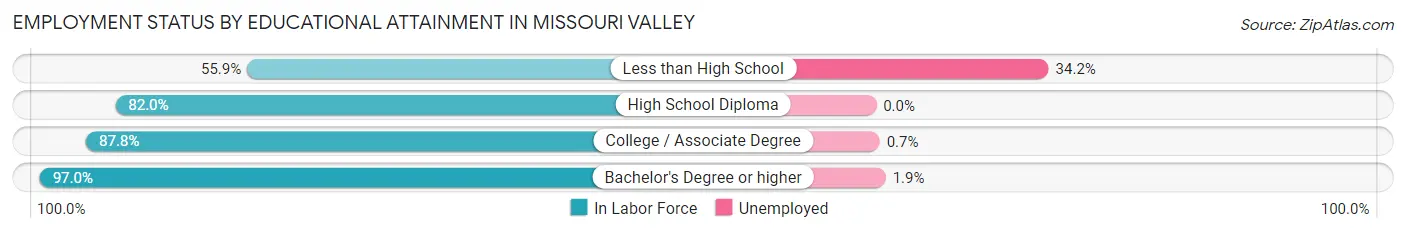
| Educational Attainment | In Labor Force | Unemployed |
| Less than High School | 76 (55.9%) | 47 (34.2%) |
| High School Diploma | 373 (82.0%) | 0 (0.0%) |
| College / Associate Degree | 424 (87.8%) | 3 (0.7%) |
| Bachelor's Degree or higher | 162 (97.0%) | 3 (1.9%) |
| Total | 1,035 (83.4%) | 38 (3.1%) |
Employment Occupations by Sex in Missouri Valley
Management, Business, Science and Arts Occupations
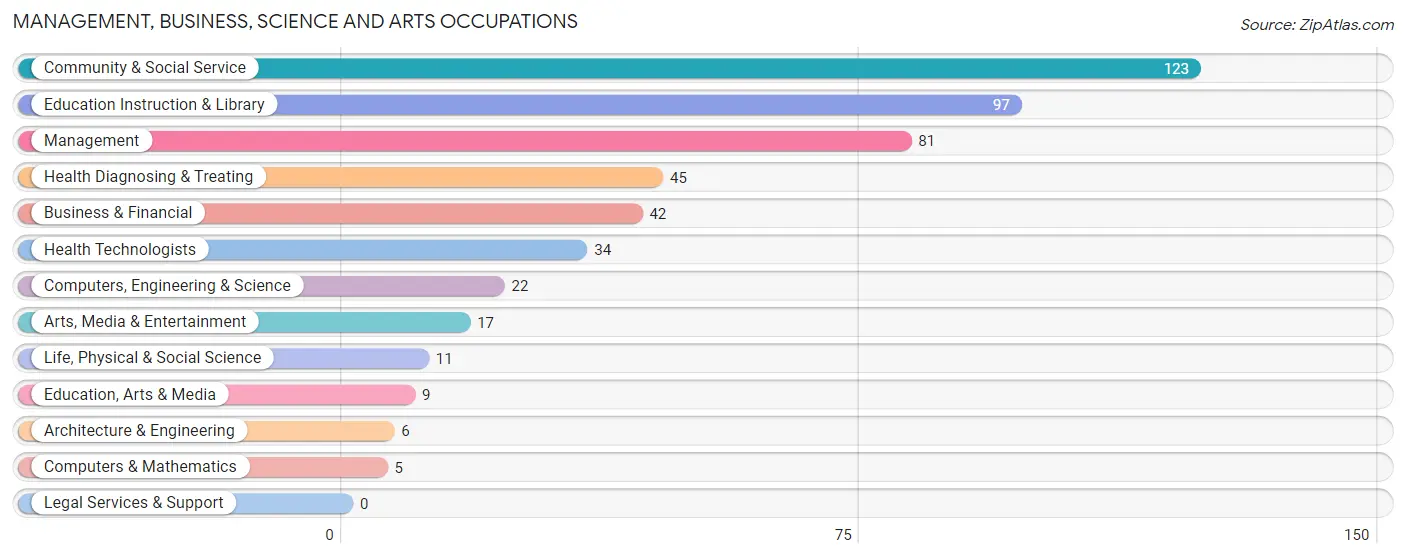
The most common Management, Business, Science and Arts occupations in Missouri Valley are Community & Social Service (123 | 10.1%), Education Instruction & Library (97 | 8.0%), Management (81 | 6.7%), Health Diagnosing & Treating (45 | 3.7%), and Business & Financial (42 | 3.5%).
Management, Business, Science and Arts Occupations by Sex
Within the Management, Business, Science and Arts occupations in Missouri Valley, the most male-oriented occupations are Computers & Mathematics (100.0%), Architecture & Engineering (100.0%), and Computers, Engineering & Science (50.0%), while the most female-oriented occupations are Life, Physical & Social Science (100.0%), Arts, Media & Entertainment (100.0%), and Health Diagnosing & Treating (88.9%).
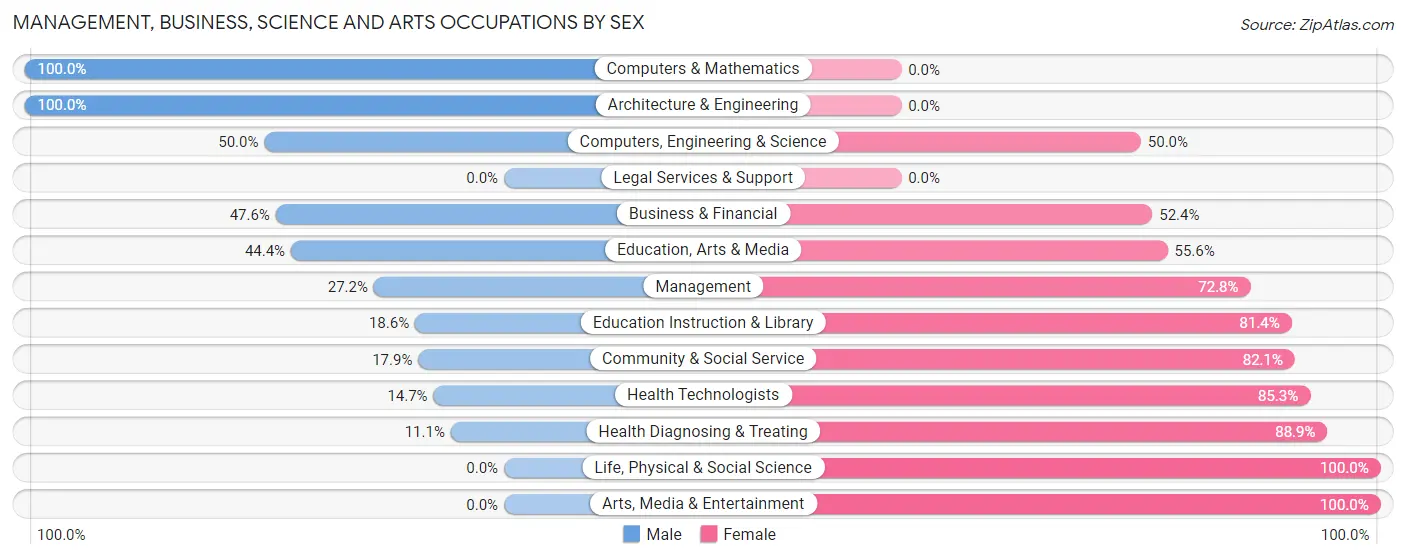
| Occupation | Male | Female |
| Management | 22 (27.2%) | 59 (72.8%) |
| Business & Financial | 20 (47.6%) | 22 (52.4%) |
| Computers, Engineering & Science | 11 (50.0%) | 11 (50.0%) |
| Computers & Mathematics | 5 (100.0%) | 0 (0.0%) |
| Architecture & Engineering | 6 (100.0%) | 0 (0.0%) |
| Life, Physical & Social Science | 0 (0.0%) | 11 (100.0%) |
| Community & Social Service | 22 (17.9%) | 101 (82.1%) |
| Education, Arts & Media | 4 (44.4%) | 5 (55.6%) |
| Legal Services & Support | 0 (0.0%) | 0 (0.0%) |
| Education Instruction & Library | 18 (18.6%) | 79 (81.4%) |
| Arts, Media & Entertainment | 0 (0.0%) | 17 (100.0%) |
| Health Diagnosing & Treating | 5 (11.1%) | 40 (88.9%) |
| Health Technologists | 5 (14.7%) | 29 (85.3%) |
| Total (Category) | 80 (25.6%) | 233 (74.4%) |
| Total (Overall) | 636 (52.4%) | 578 (47.6%) |
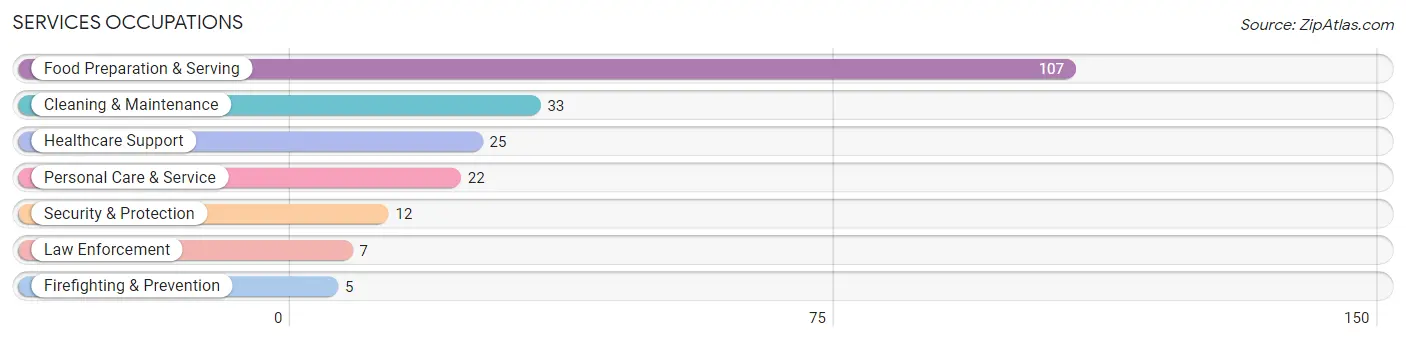
Services Occupations
The most common Services occupations in Missouri Valley are Food Preparation & Serving (107 | 8.8%), Cleaning & Maintenance (33 | 2.7%), Healthcare Support (25 | 2.1%), Personal Care & Service (22 | 1.8%), and Security & Protection (12 | 1.0%).
Services Occupations by Sex
Within the Services occupations in Missouri Valley, the most male-oriented occupations are Security & Protection (100.0%), Firefighting & Prevention (100.0%), and Law Enforcement (100.0%), while the most female-oriented occupations are Personal Care & Service (100.0%), Healthcare Support (88.0%), and Cleaning & Maintenance (78.8%).
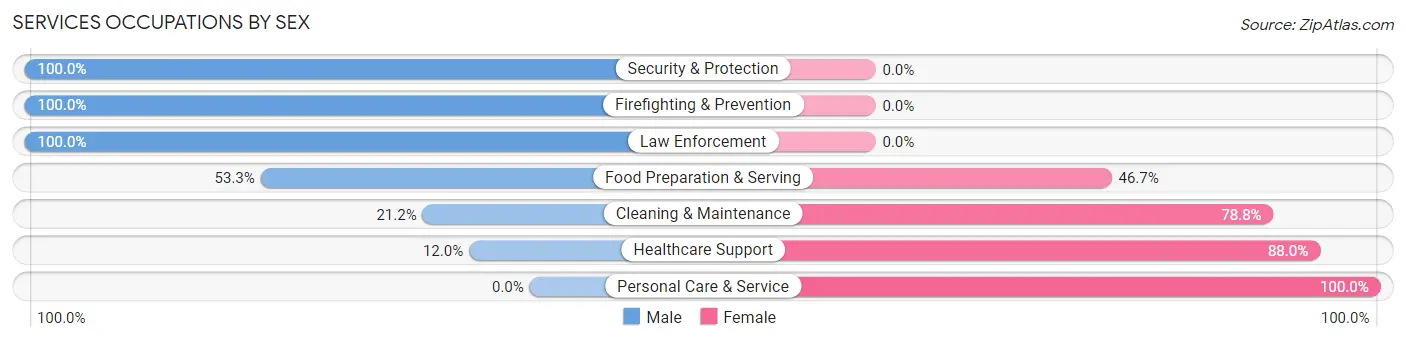
| Occupation | Male | Female |
| Healthcare Support | 3 (12.0%) | 22 (88.0%) |
| Security & Protection | 12 (100.0%) | 0 (0.0%) |
| Firefighting & Prevention | 5 (100.0%) | 0 (0.0%) |
| Law Enforcement | 7 (100.0%) | 0 (0.0%) |
| Food Preparation & Serving | 57 (53.3%) | 50 (46.7%) |
| Cleaning & Maintenance | 7 (21.2%) | 26 (78.8%) |
| Personal Care & Service | 0 (0.0%) | 22 (100.0%) |
| Total (Category) | 79 (39.7%) | 120 (60.3%) |
| Total (Overall) | 636 (52.4%) | 578 (47.6%) |
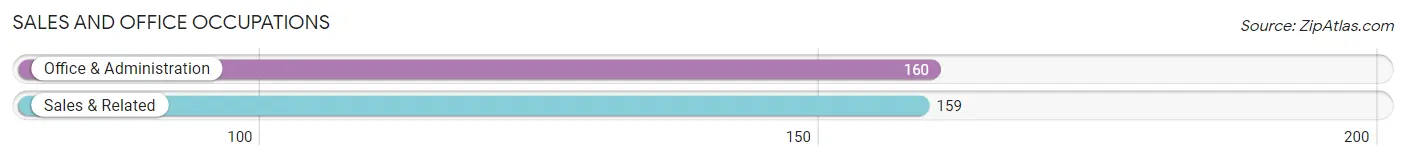
Sales and Office Occupations
The most common Sales and Office occupations in Missouri Valley are Office & Administration (160 | 13.2%), and Sales & Related (159 | 13.1%).
Sales and Office Occupations by Sex
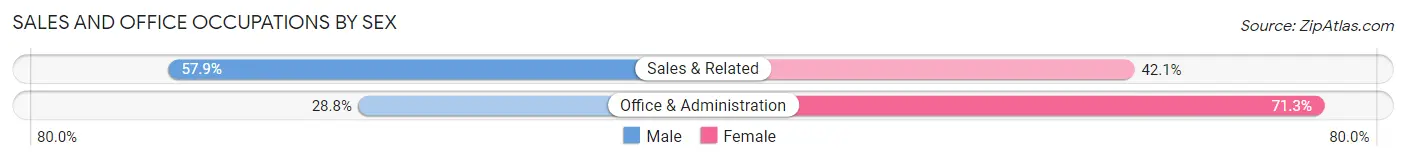
| Occupation | Male | Female |
| Sales & Related | 92 (57.9%) | 67 (42.1%) |
| Office & Administration | 46 (28.7%) | 114 (71.3%) |
| Total (Category) | 138 (43.3%) | 181 (56.7%) |
| Total (Overall) | 636 (52.4%) | 578 (47.6%) |
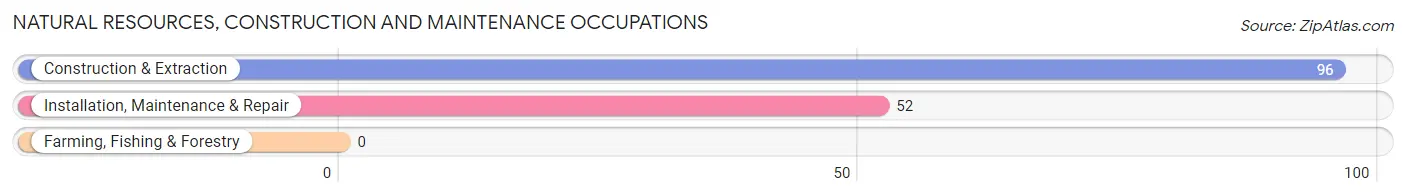
Natural Resources, Construction and Maintenance Occupations
The most common Natural Resources, Construction and Maintenance occupations in Missouri Valley are Construction & Extraction (96 | 7.9%), and Installation, Maintenance & Repair (52 | 4.3%).
Natural Resources, Construction and Maintenance Occupations by Sex
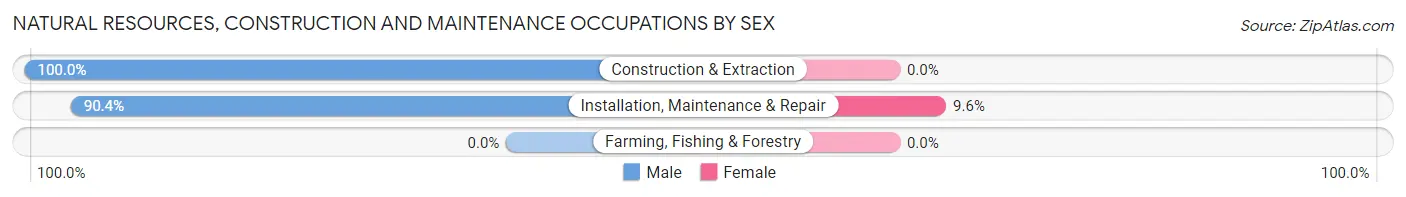
| Occupation | Male | Female |
| Farming, Fishing & Forestry | 0 (0.0%) | 0 (0.0%) |
| Construction & Extraction | 96 (100.0%) | 0 (0.0%) |
| Installation, Maintenance & Repair | 47 (90.4%) | 5 (9.6%) |
| Total (Category) | 143 (96.6%) | 5 (3.4%) |
| Total (Overall) | 636 (52.4%) | 578 (47.6%) |
Production, Transportation and Moving Occupations
The most common Production, Transportation and Moving occupations in Missouri Valley are Production (106 | 8.7%), Transportation (77 | 6.3%), and Material Moving (52 | 4.3%).
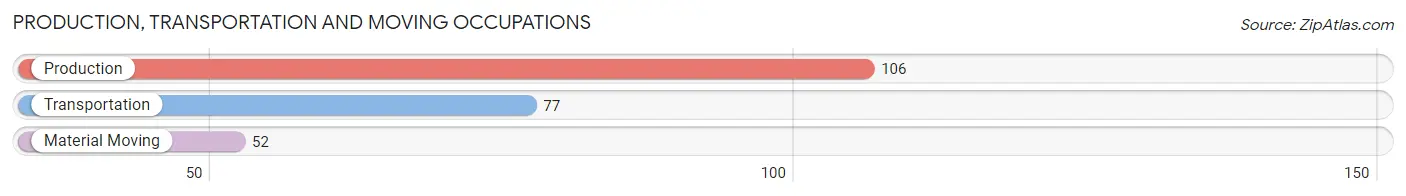
Production, Transportation and Moving Occupations by Sex

| Occupation | Male | Female |
| Production | 100 (94.3%) | 6 (5.7%) |
| Transportation | 55 (71.4%) | 22 (28.6%) |
| Material Moving | 41 (78.8%) | 11 (21.1%) |
| Total (Category) | 196 (83.4%) | 39 (16.6%) |
| Total (Overall) | 636 (52.4%) | 578 (47.6%) |
Employment Industries by Sex in Missouri Valley
Employment Industries in Missouri Valley
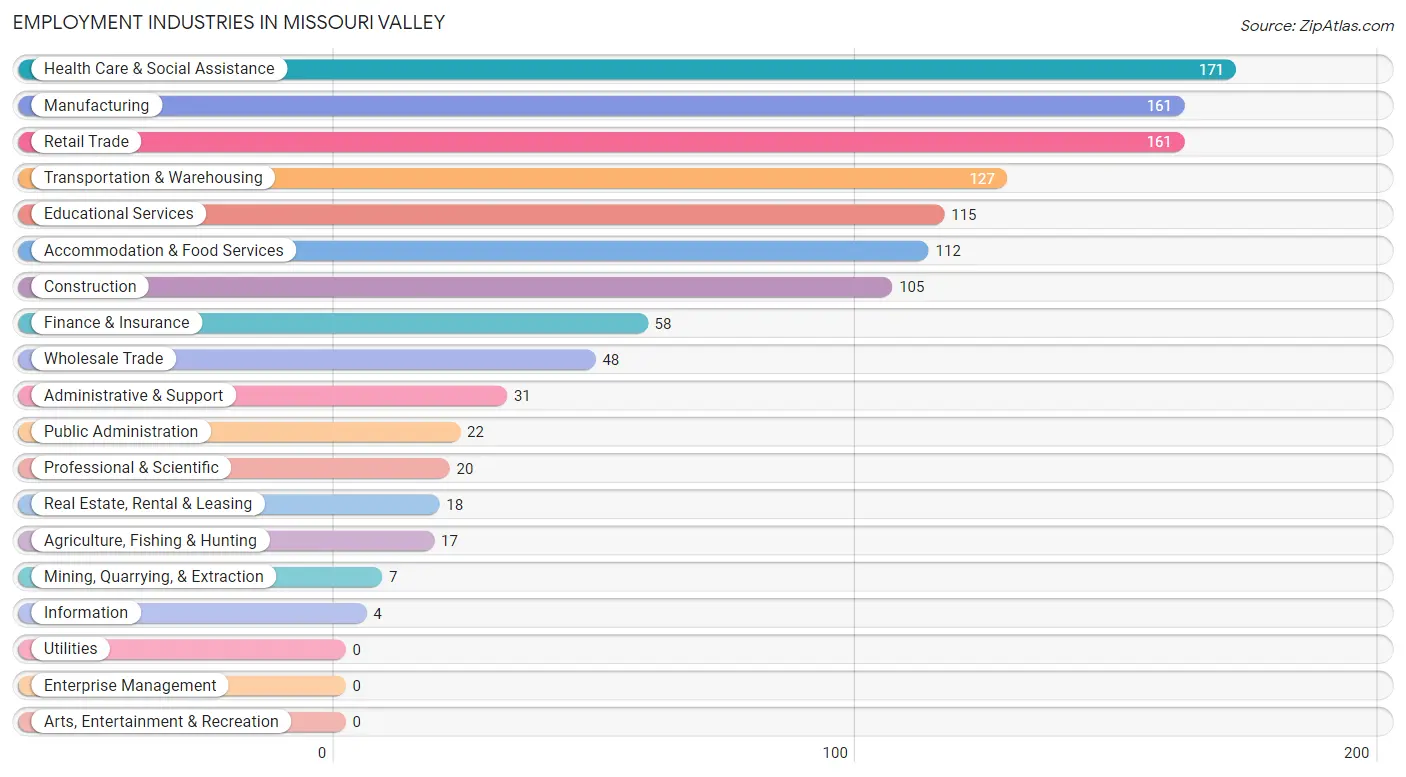
The major employment industries in Missouri Valley include Health Care & Social Assistance (171 | 14.1%), Manufacturing (161 | 13.3%), Retail Trade (161 | 13.3%), Transportation & Warehousing (127 | 10.5%), and Educational Services (115 | 9.5%).
Employment Industries by Sex in Missouri Valley
The Missouri Valley industries that see more men than women are Mining, Quarrying, & Extraction (100.0%), Construction (100.0%), and Wholesale Trade (93.8%), whereas the industries that tend to have a higher number of women are Information (100.0%), Administrative & Support (100.0%), and Health Care & Social Assistance (83.6%).
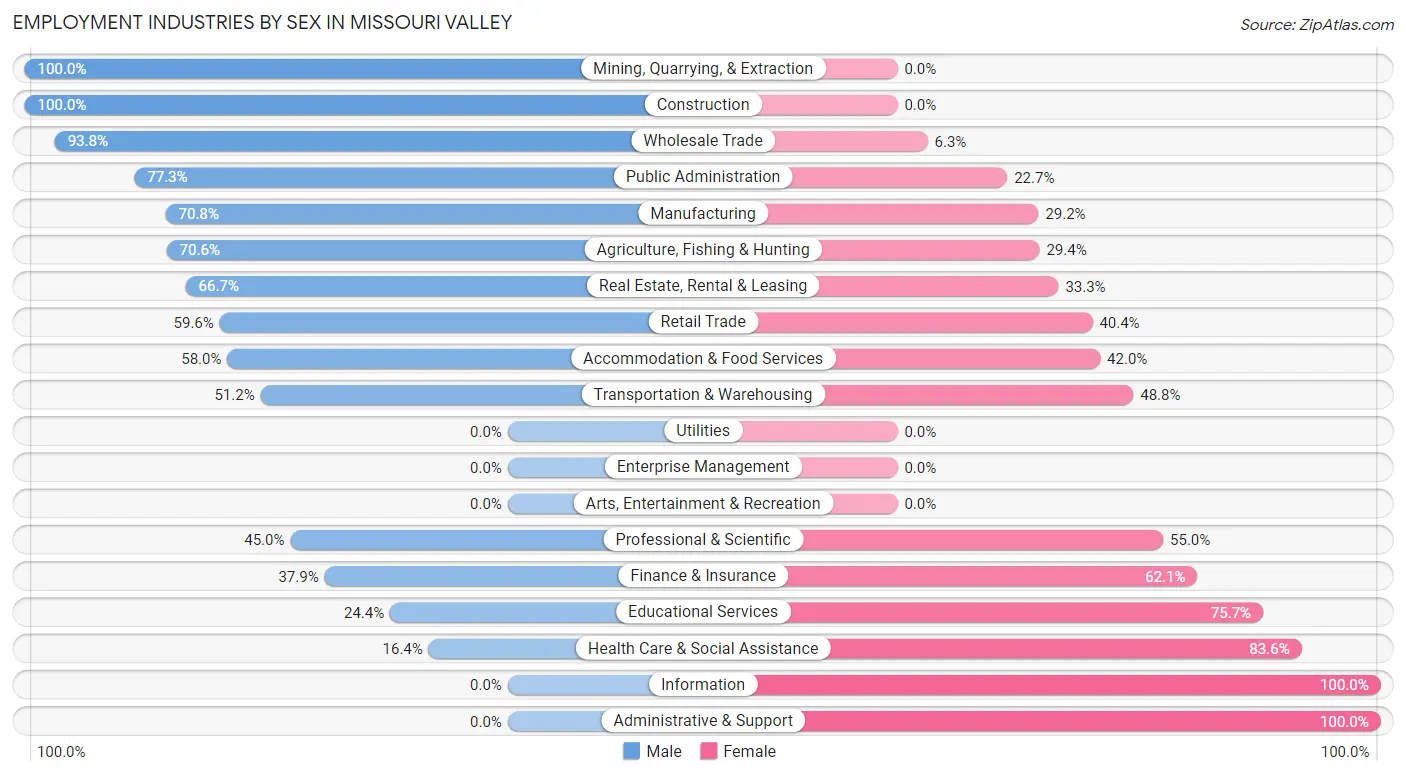
| Industry | Male | Female |
| Agriculture, Fishing & Hunting | 12 (70.6%) | 5 (29.4%) |
| Mining, Quarrying, & Extraction | 7 (100.0%) | 0 (0.0%) |
| Construction | 105 (100.0%) | 0 (0.0%) |
| Manufacturing | 114 (70.8%) | 47 (29.2%) |
| Wholesale Trade | 45 (93.8%) | 3 (6.2%) |
| Retail Trade | 96 (59.6%) | 65 (40.4%) |
| Transportation & Warehousing | 65 (51.2%) | 62 (48.8%) |
| Utilities | 0 (0.0%) | 0 (0.0%) |
| Information | 0 (0.0%) | 4 (100.0%) |
| Finance & Insurance | 22 (37.9%) | 36 (62.1%) |
| Real Estate, Rental & Leasing | 12 (66.7%) | 6 (33.3%) |
| Professional & Scientific | 9 (45.0%) | 11 (55.0%) |
| Enterprise Management | 0 (0.0%) | 0 (0.0%) |
| Administrative & Support | 0 (0.0%) | 31 (100.0%) |
| Educational Services | 28 (24.3%) | 87 (75.6%) |
| Health Care & Social Assistance | 28 (16.4%) | 143 (83.6%) |
| Arts, Entertainment & Recreation | 0 (0.0%) | 0 (0.0%) |
| Accommodation & Food Services | 65 (58.0%) | 47 (42.0%) |
| Public Administration | 17 (77.3%) | 5 (22.7%) |
| Total | 636 (52.4%) | 578 (47.6%) |
Education in Missouri Valley
School Enrollment in Missouri Valley
The most common levels of schooling among the 607 students in Missouri Valley are middle school (182 | 30.0%), elementary school (168 | 27.7%), and high school (102 | 16.8%).
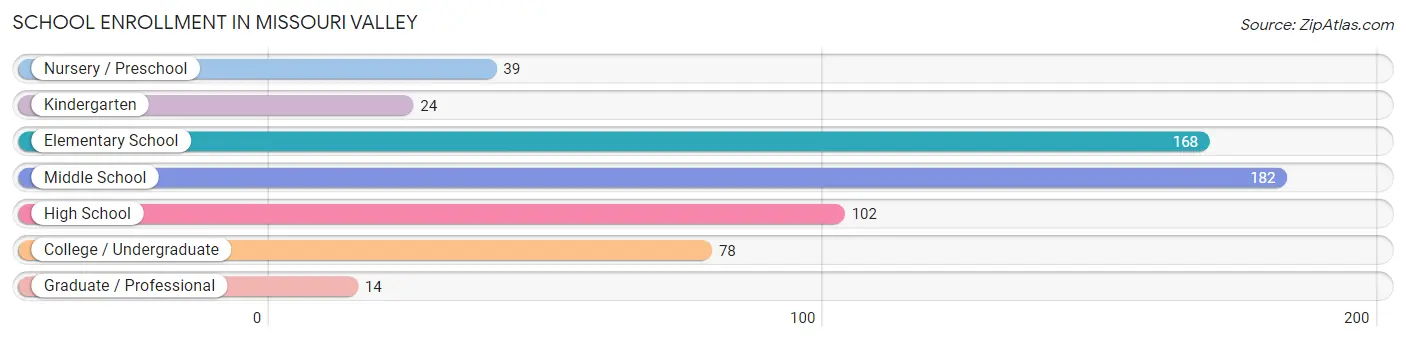
| School Level | # Students | % Students |
| Nursery / Preschool | 39 | 6.4% |
| Kindergarten | 24 | 4.0% |
| Elementary School | 168 | 27.7% |
| Middle School | 182 | 30.0% |
| High School | 102 | 16.8% |
| College / Undergraduate | 78 | 12.9% |
| Graduate / Professional | 14 | 2.3% |
| Total | 607 | 100.0% |
School Enrollment by Age by Funding Source in Missouri Valley
Out of a total of 607 students who are enrolled in schools in Missouri Valley, 70 (11.5%) attend a private institution, while the remaining 537 (88.5%) are enrolled in public schools. The age group of 3 to 4 year olds has the highest likelihood of being enrolled in private schools, with 11 (32.4% in the age bracket) enrolled. Conversely, the age group of 18 to 19 year olds has the lowest likelihood of being enrolled in a private school, with 14 (100.0% in the age bracket) attending a public institution.
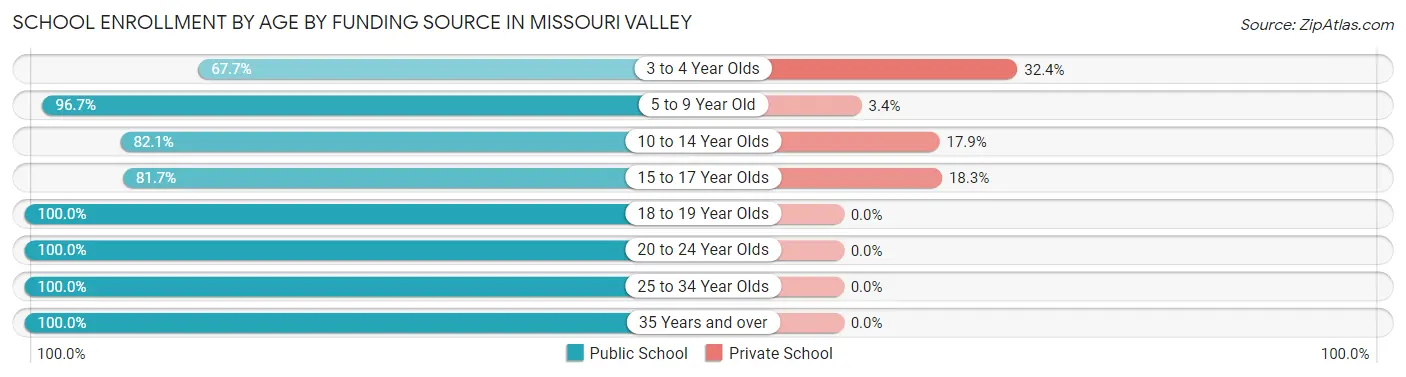
| Age Bracket | Public School | Private School |
| 3 to 4 Year Olds | 23 (67.6%) | 11 (32.4%) |
| 5 to 9 Year Old | 173 (96.7%) | 6 (3.4%) |
| 10 to 14 Year Olds | 184 (82.1%) | 40 (17.9%) |
| 15 to 17 Year Olds | 58 (81.7%) | 13 (18.3%) |
| 18 to 19 Year Olds | 14 (100.0%) | 0 (0.0%) |
| 20 to 24 Year Olds | 41 (100.0%) | 0 (0.0%) |
| 25 to 34 Year Olds | 11 (100.0%) | 0 (0.0%) |
| 35 Years and over | 33 (100.0%) | 0 (0.0%) |
| Total | 537 (88.5%) | 70 (11.5%) |
Educational Attainment by Field of Study in Missouri Valley
Education (96 | 39.2%), business (47 | 19.2%), arts & humanities (25 | 10.2%), science & technology (24 | 9.8%), and liberal arts & history (14 | 5.7%) are the most common fields of study among 245 individuals in Missouri Valley who have obtained a bachelor's degree or higher.
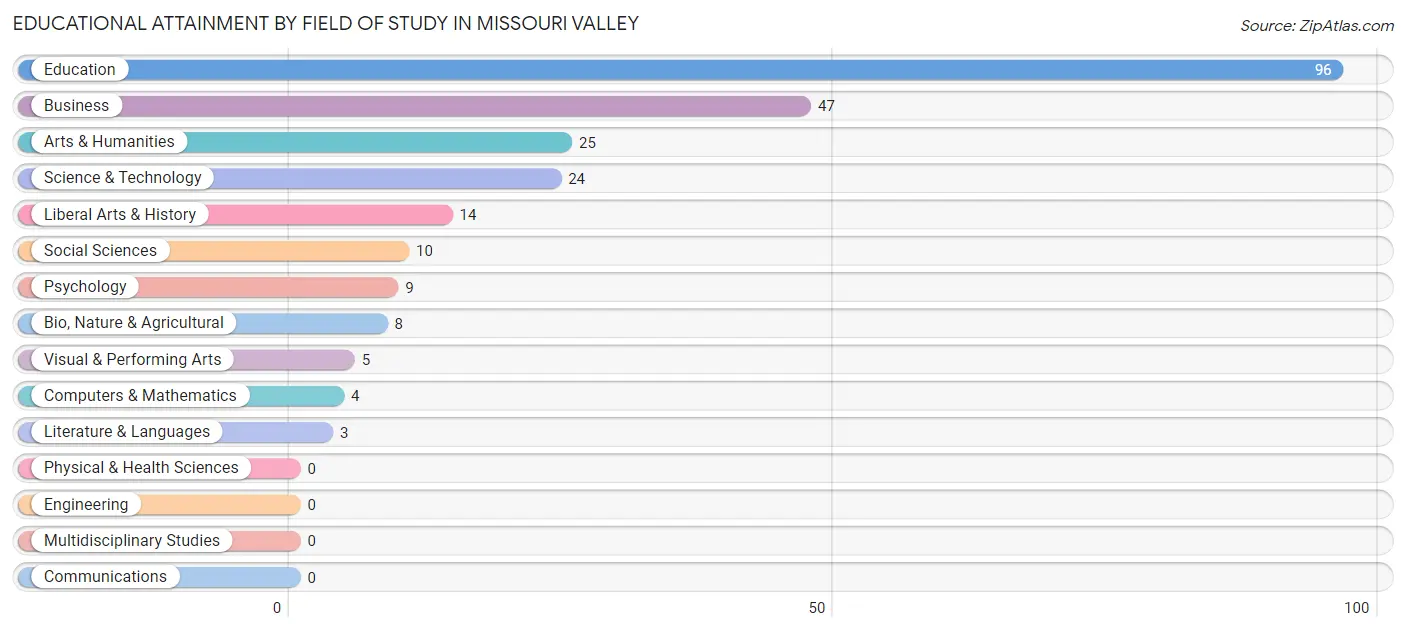
| Field of Study | # Graduates | % Graduates |
| Computers & Mathematics | 4 | 1.6% |
| Bio, Nature & Agricultural | 8 | 3.3% |
| Physical & Health Sciences | 0 | 0.0% |
| Psychology | 9 | 3.7% |
| Social Sciences | 10 | 4.1% |
| Engineering | 0 | 0.0% |
| Multidisciplinary Studies | 0 | 0.0% |
| Science & Technology | 24 | 9.8% |
| Business | 47 | 19.2% |
| Education | 96 | 39.2% |
| Literature & Languages | 3 | 1.2% |
| Liberal Arts & History | 14 | 5.7% |
| Visual & Performing Arts | 5 | 2.0% |
| Communications | 0 | 0.0% |
| Arts & Humanities | 25 | 10.2% |
| Total | 245 | 100.0% |
Transportation & Commute in Missouri Valley
Vehicle Availability by Sex in Missouri Valley
The most prevalent vehicle ownership categories in Missouri Valley are males with 2 vehicles (210, accounting for 33.3%) and females with 2 vehicles (196, making up 37.2%).
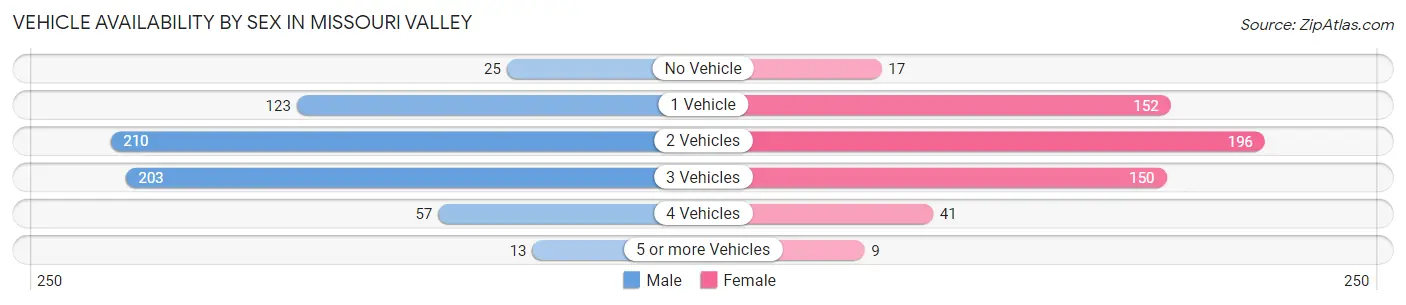
| Vehicles Available | Male | Female |
| No Vehicle | 25 (4.0%) | 17 (3.0%) |
| 1 Vehicle | 123 (19.5%) | 152 (26.9%) |
| 2 Vehicles | 210 (33.3%) | 196 (34.7%) |
| 3 Vehicles | 203 (32.2%) | 150 (26.6%) |
| 4 Vehicles | 57 (9.0%) | 41 (7.3%) |
| 5 or more Vehicles | 13 (2.1%) | 9 (1.6%) |
| Total | 631 (100.0%) | 565 (100.0%) |
Commute Time in Missouri Valley
The most frequently occuring commute durations in Missouri Valley are 5 to 9 minutes (249 commuters, 22.4%), 30 to 34 minutes (222 commuters, 20.0%), and less than 5 minutes (123 commuters, 11.1%).
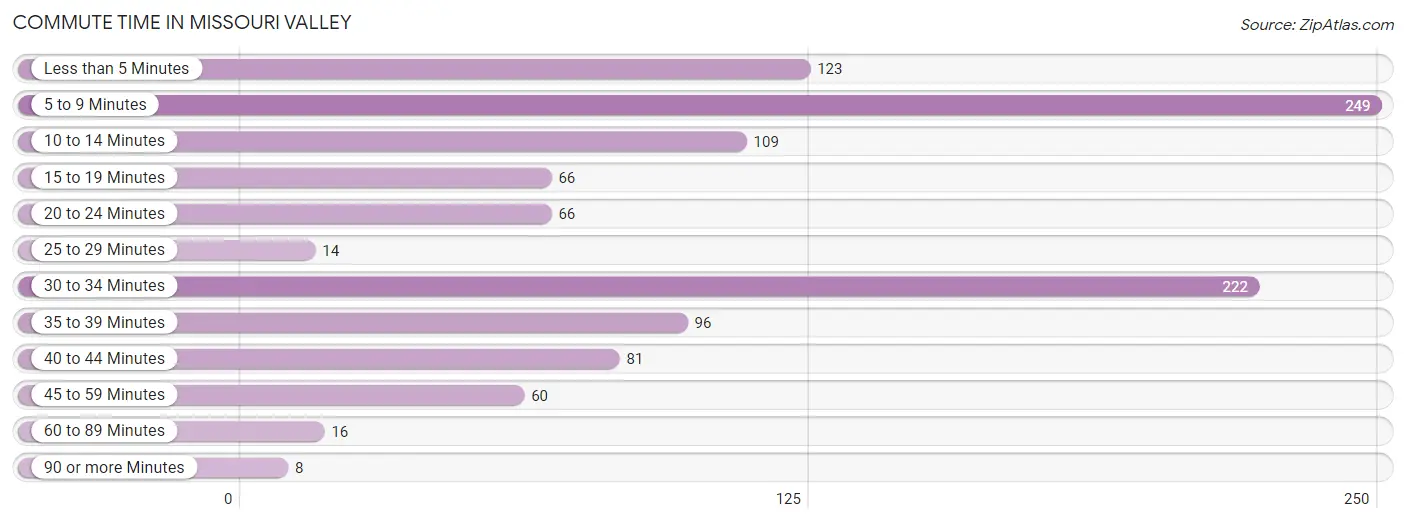
| Commute Time | # Commuters | % Commuters |
| Less than 5 Minutes | 123 | 11.1% |
| 5 to 9 Minutes | 249 | 22.4% |
| 10 to 14 Minutes | 109 | 9.8% |
| 15 to 19 Minutes | 66 | 5.9% |
| 20 to 24 Minutes | 66 | 5.9% |
| 25 to 29 Minutes | 14 | 1.3% |
| 30 to 34 Minutes | 222 | 20.0% |
| 35 to 39 Minutes | 96 | 8.6% |
| 40 to 44 Minutes | 81 | 7.3% |
| 45 to 59 Minutes | 60 | 5.4% |
| 60 to 89 Minutes | 16 | 1.4% |
| 90 or more Minutes | 8 | 0.7% |
Commute Time by Sex in Missouri Valley
The most common commute times in Missouri Valley are 30 to 34 minutes (145 commuters, 24.2%) for males and 5 to 9 minutes (135 commuters, 26.4%) for females.
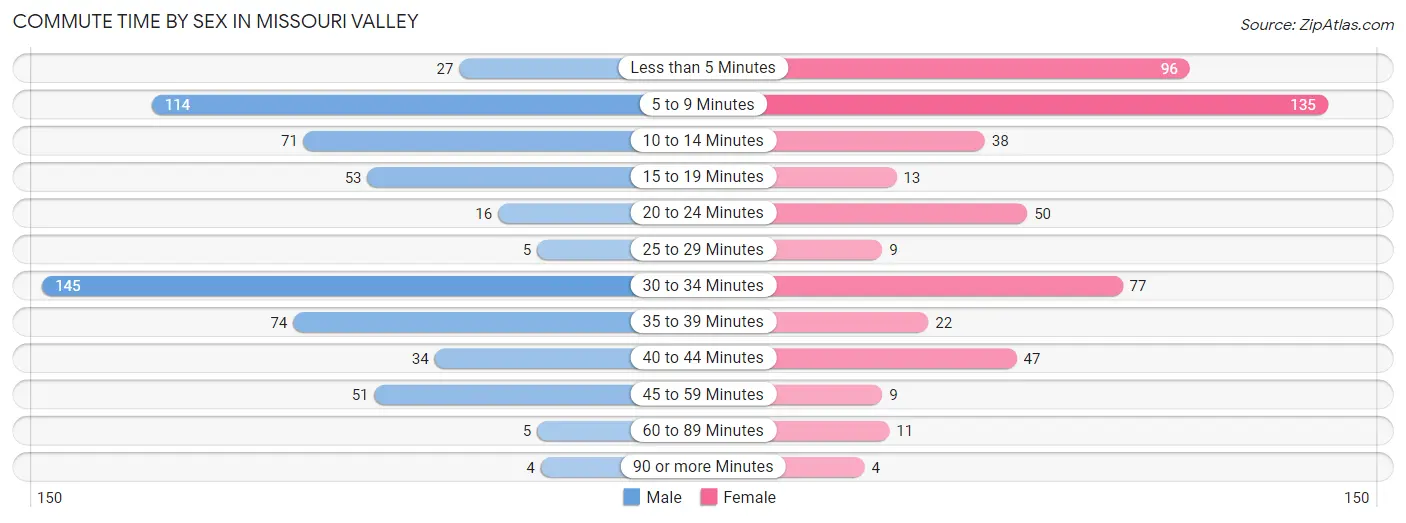
| Commute Time | Male | Female |
| Less than 5 Minutes | 27 (4.5%) | 96 (18.8%) |
| 5 to 9 Minutes | 114 (19.0%) | 135 (26.4%) |
| 10 to 14 Minutes | 71 (11.8%) | 38 (7.4%) |
| 15 to 19 Minutes | 53 (8.8%) | 13 (2.5%) |
| 20 to 24 Minutes | 16 (2.7%) | 50 (9.8%) |
| 25 to 29 Minutes | 5 (0.8%) | 9 (1.8%) |
| 30 to 34 Minutes | 145 (24.2%) | 77 (15.1%) |
| 35 to 39 Minutes | 74 (12.3%) | 22 (4.3%) |
| 40 to 44 Minutes | 34 (5.7%) | 47 (9.2%) |
| 45 to 59 Minutes | 51 (8.5%) | 9 (1.8%) |
| 60 to 89 Minutes | 5 (0.8%) | 11 (2.1%) |
| 90 or more Minutes | 4 (0.7%) | 4 (0.8%) |
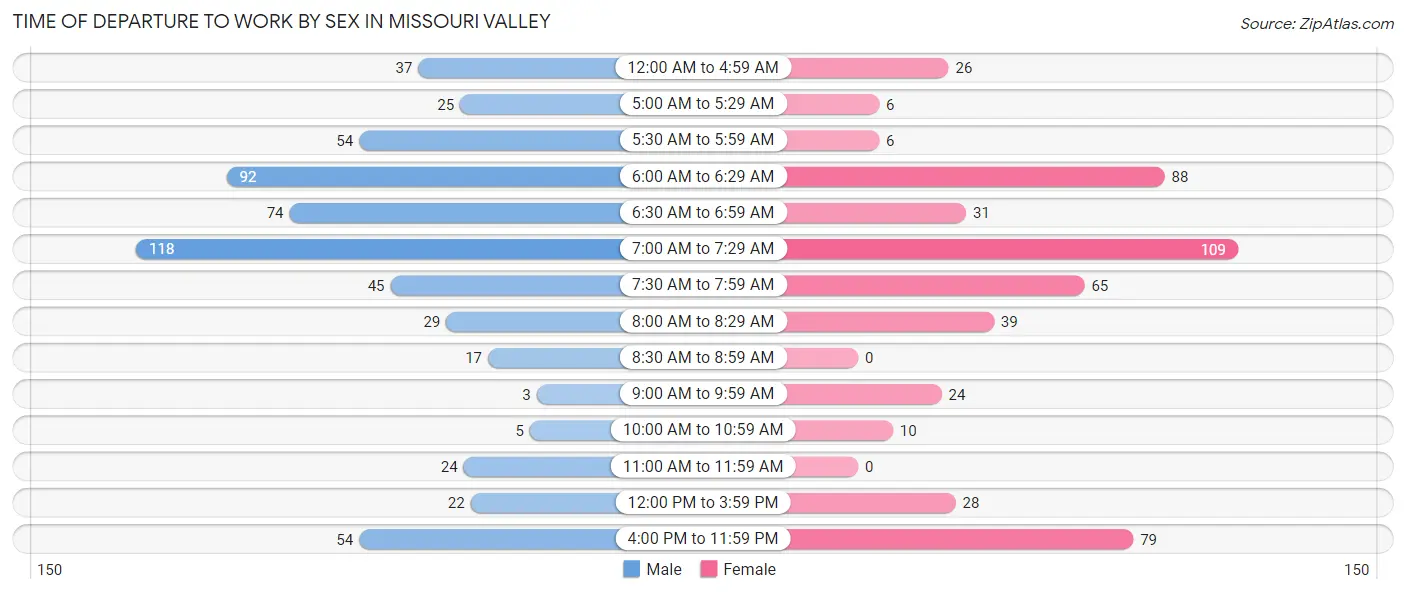
Time of Departure to Work by Sex in Missouri Valley
The most frequent times of departure to work in Missouri Valley are 7:00 AM to 7:29 AM (118, 19.7%) for males and 7:00 AM to 7:29 AM (109, 21.3%) for females.
| Time of Departure | Male | Female |
| 12:00 AM to 4:59 AM | 37 (6.2%) | 26 (5.1%) |
| 5:00 AM to 5:29 AM | 25 (4.2%) | 6 (1.2%) |
| 5:30 AM to 5:59 AM | 54 (9.0%) | 6 (1.2%) |
| 6:00 AM to 6:29 AM | 92 (15.4%) | 88 (17.2%) |
| 6:30 AM to 6:59 AM | 74 (12.3%) | 31 (6.1%) |
| 7:00 AM to 7:29 AM | 118 (19.7%) | 109 (21.3%) |
| 7:30 AM to 7:59 AM | 45 (7.5%) | 65 (12.7%) |
| 8:00 AM to 8:29 AM | 29 (4.8%) | 39 (7.6%) |
| 8:30 AM to 8:59 AM | 17 (2.8%) | 0 (0.0%) |
| 9:00 AM to 9:59 AM | 3 (0.5%) | 24 (4.7%) |
| 10:00 AM to 10:59 AM | 5 (0.8%) | 10 (2.0%) |
| 11:00 AM to 11:59 AM | 24 (4.0%) | 0 (0.0%) |
| 12:00 PM to 3:59 PM | 22 (3.7%) | 28 (5.5%) |
| 4:00 PM to 11:59 PM | 54 (9.0%) | 79 (15.5%) |
| Total | 599 (100.0%) | 511 (100.0%) |
Housing Occupancy in Missouri Valley
Occupancy by Ownership in Missouri Valley
Of the total 1,175 dwellings in Missouri Valley, owner-occupied units account for 692 (58.9%), while renter-occupied units make up 483 (41.1%).

| Occupancy | # Housing Units | % Housing Units |
| Owner Occupied Housing Units | 692 | 58.9% |
| Renter-Occupied Housing Units | 483 | 41.1% |
| Total Occupied Housing Units | 1,175 | 100.0% |
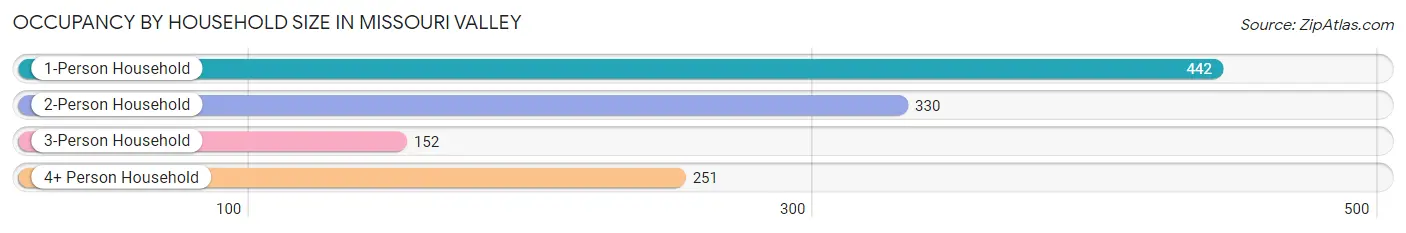
Occupancy by Household Size in Missouri Valley
| Household Size | # Housing Units | % Housing Units |
| 1-Person Household | 442 | 37.6% |
| 2-Person Household | 330 | 28.1% |
| 3-Person Household | 152 | 12.9% |
| 4+ Person Household | 251 | 21.4% |
| Total Housing Units | 1,175 | 100.0% |
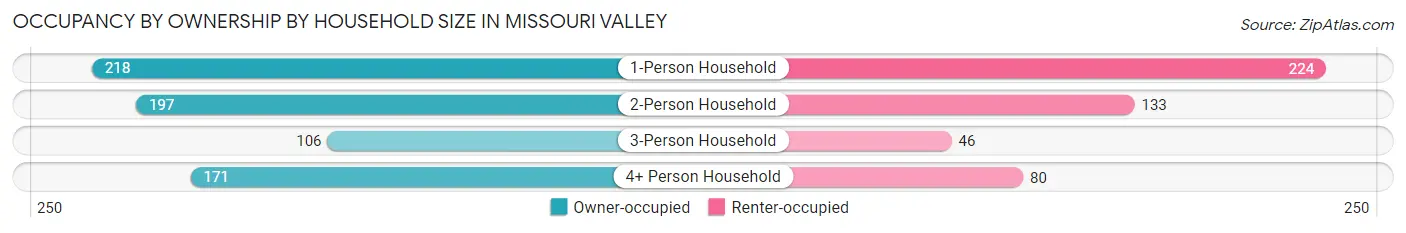
Occupancy by Ownership by Household Size in Missouri Valley
| Household Size | Owner-occupied | Renter-occupied |
| 1-Person Household | 218 (49.3%) | 224 (50.7%) |
| 2-Person Household | 197 (59.7%) | 133 (40.3%) |
| 3-Person Household | 106 (69.7%) | 46 (30.3%) |
| 4+ Person Household | 171 (68.1%) | 80 (31.9%) |
| Total Housing Units | 692 (58.9%) | 483 (41.1%) |
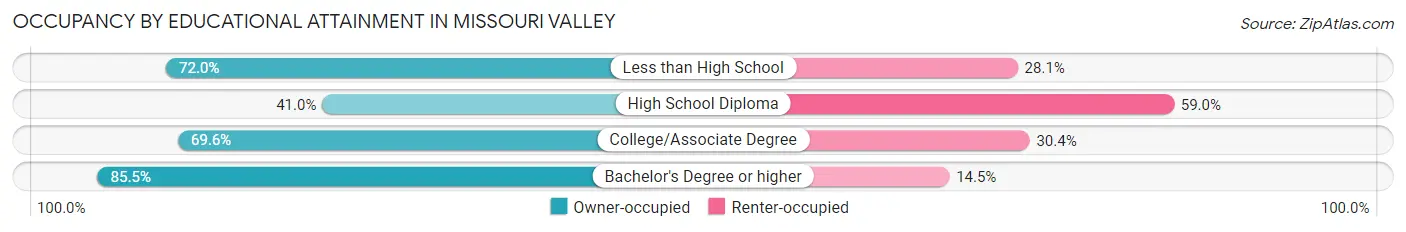
Occupancy by Educational Attainment in Missouri Valley
| Household Size | Owner-occupied | Renter-occupied |
| Less than High School | 59 (72.0%) | 23 (28.1%) |
| High School Diploma | 216 (41.0%) | 311 (59.0%) |
| College/Associate Degree | 293 (69.6%) | 128 (30.4%) |
| Bachelor's Degree or higher | 124 (85.5%) | 21 (14.5%) |
Occupancy by Age of Householder in Missouri Valley
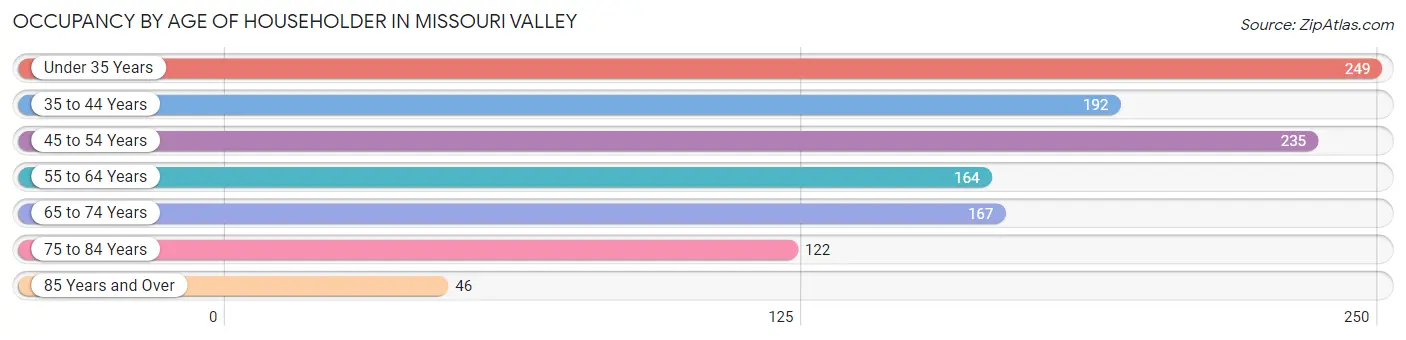
| Age Bracket | # Households | % Households |
| Under 35 Years | 249 | 21.2% |
| 35 to 44 Years | 192 | 16.3% |
| 45 to 54 Years | 235 | 20.0% |
| 55 to 64 Years | 164 | 14.0% |
| 65 to 74 Years | 167 | 14.2% |
| 75 to 84 Years | 122 | 10.4% |
| 85 Years and Over | 46 | 3.9% |
| Total | 1,175 | 100.0% |
Housing Finances in Missouri Valley
Median Income by Occupancy in Missouri Valley
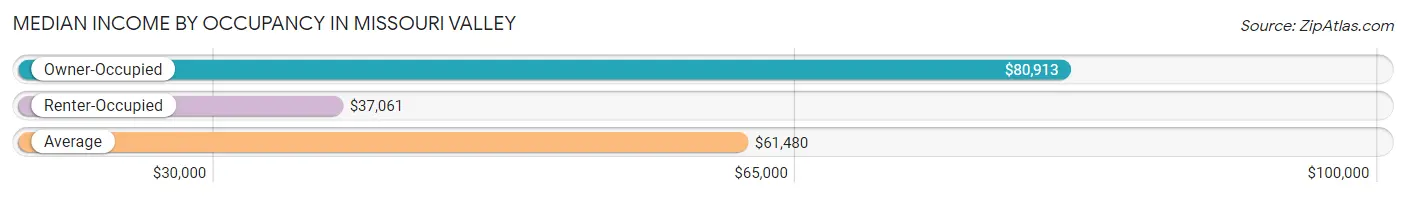
| Occupancy Type | # Households | Median Income |
| Owner-Occupied | 692 (58.9%) | $80,913 |
| Renter-Occupied | 483 (41.1%) | $37,061 |
| Average | 1,175 (100.0%) | $61,480 |
Occupancy by Householder Income Bracket in Missouri Valley
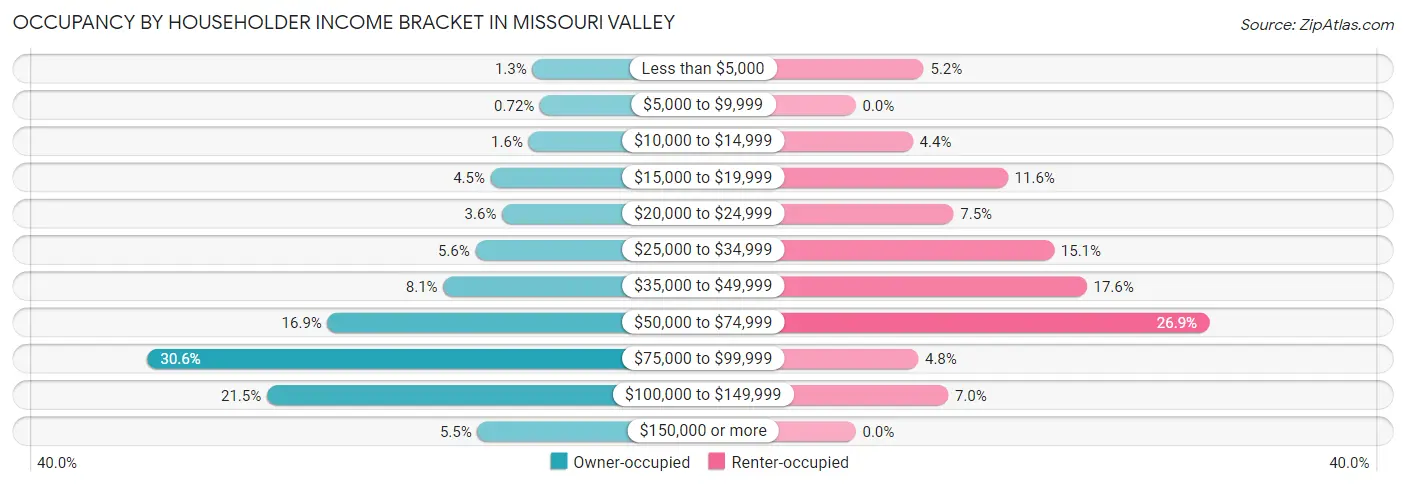
| Income Bracket | Owner-occupied | Renter-occupied |
| Less than $5,000 | 9 (1.3%) | 25 (5.2%) |
| $5,000 to $9,999 | 5 (0.7%) | 0 (0.0%) |
| $10,000 to $14,999 | 11 (1.6%) | 21 (4.3%) |
| $15,000 to $19,999 | 31 (4.5%) | 56 (11.6%) |
| $20,000 to $24,999 | 25 (3.6%) | 36 (7.4%) |
| $25,000 to $34,999 | 39 (5.6%) | 73 (15.1%) |
| $35,000 to $49,999 | 56 (8.1%) | 85 (17.6%) |
| $50,000 to $74,999 | 117 (16.9%) | 130 (26.9%) |
| $75,000 to $99,999 | 212 (30.6%) | 23 (4.8%) |
| $100,000 to $149,999 | 149 (21.5%) | 34 (7.0%) |
| $150,000 or more | 38 (5.5%) | 0 (0.0%) |
| Total | 692 (100.0%) | 483 (100.0%) |
Monthly Housing Cost Tiers in Missouri Valley
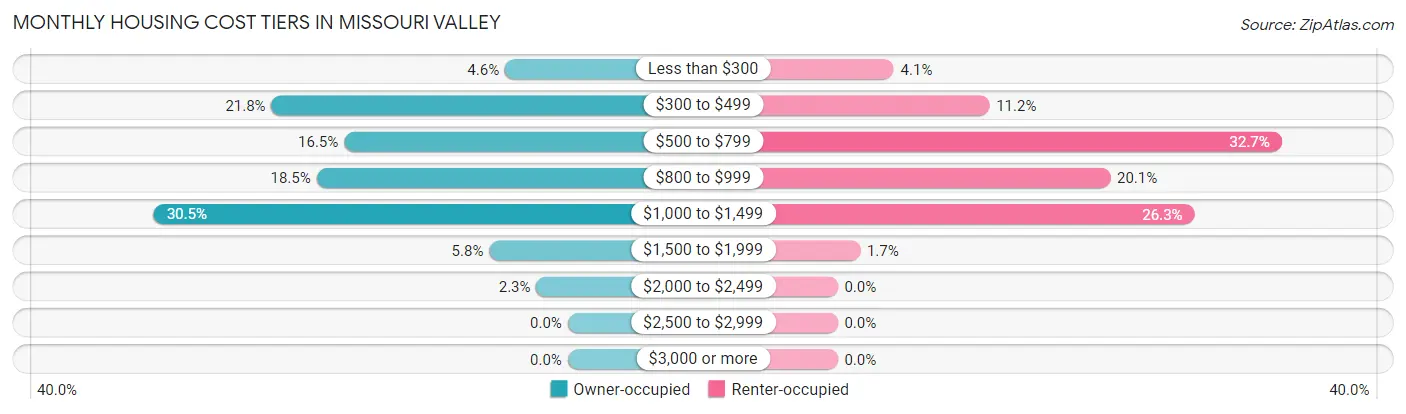
| Monthly Cost | Owner-occupied | Renter-occupied |
| Less than $300 | 32 (4.6%) | 20 (4.1%) |
| $300 to $499 | 151 (21.8%) | 54 (11.2%) |
| $500 to $799 | 114 (16.5%) | 158 (32.7%) |
| $800 to $999 | 128 (18.5%) | 97 (20.1%) |
| $1,000 to $1,499 | 211 (30.5%) | 127 (26.3%) |
| $1,500 to $1,999 | 40 (5.8%) | 8 (1.7%) |
| $2,000 to $2,499 | 16 (2.3%) | 0 (0.0%) |
| $2,500 to $2,999 | 0 (0.0%) | 0 (0.0%) |
| $3,000 or more | 0 (0.0%) | 0 (0.0%) |
| Total | 692 (100.0%) | 483 (100.0%) |
Physical Housing Characteristics in Missouri Valley
Housing Structures in Missouri Valley
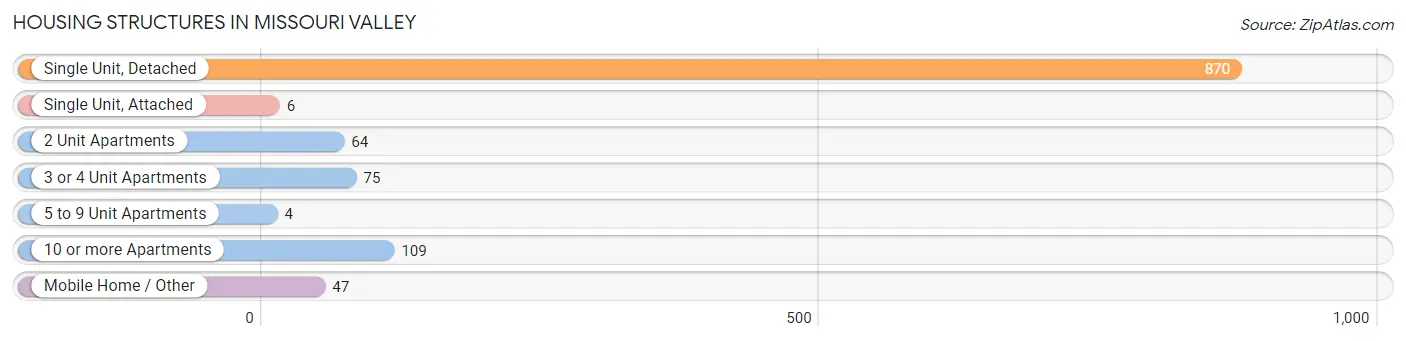
| Structure Type | # Housing Units | % Housing Units |
| Single Unit, Detached | 870 | 74.0% |
| Single Unit, Attached | 6 | 0.5% |
| 2 Unit Apartments | 64 | 5.4% |
| 3 or 4 Unit Apartments | 75 | 6.4% |
| 5 to 9 Unit Apartments | 4 | 0.3% |
| 10 or more Apartments | 109 | 9.3% |
| Mobile Home / Other | 47 | 4.0% |
| Total | 1,175 | 100.0% |
Housing Structures by Occupancy in Missouri Valley
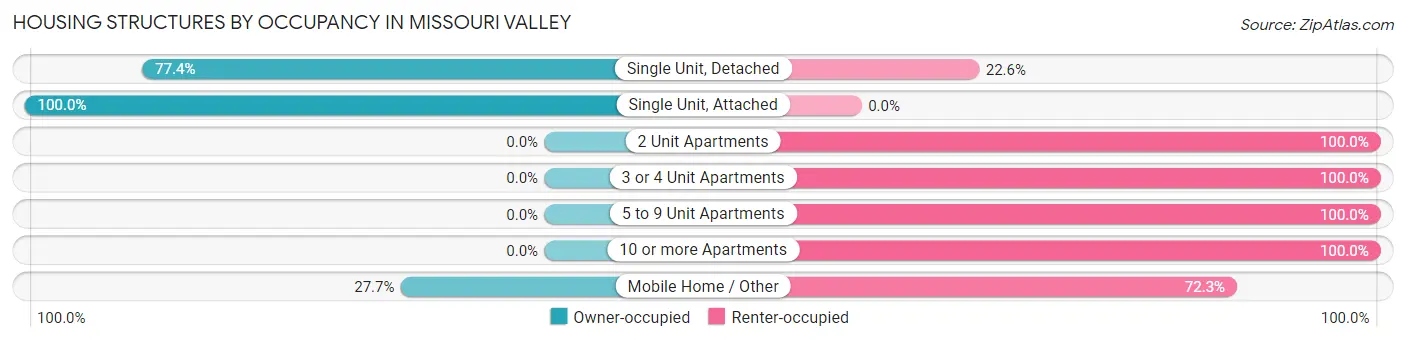
| Structure Type | Owner-occupied | Renter-occupied |
| Single Unit, Detached | 673 (77.4%) | 197 (22.6%) |
| Single Unit, Attached | 6 (100.0%) | 0 (0.0%) |
| 2 Unit Apartments | 0 (0.0%) | 64 (100.0%) |
| 3 or 4 Unit Apartments | 0 (0.0%) | 75 (100.0%) |
| 5 to 9 Unit Apartments | 0 (0.0%) | 4 (100.0%) |
| 10 or more Apartments | 0 (0.0%) | 109 (100.0%) |
| Mobile Home / Other | 13 (27.7%) | 34 (72.3%) |
| Total | 692 (58.9%) | 483 (41.1%) |
Housing Structures by Number of Rooms in Missouri Valley
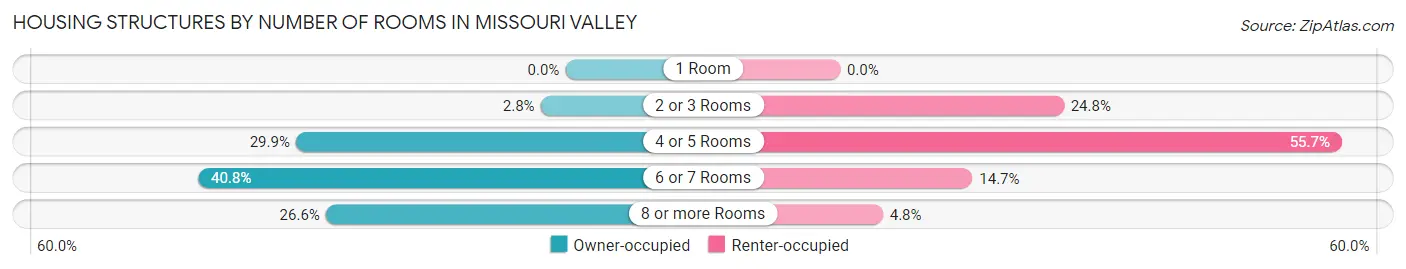
| Number of Rooms | Owner-occupied | Renter-occupied |
| 1 Room | 0 (0.0%) | 0 (0.0%) |
| 2 or 3 Rooms | 19 (2.8%) | 120 (24.8%) |
| 4 or 5 Rooms | 207 (29.9%) | 269 (55.7%) |
| 6 or 7 Rooms | 282 (40.7%) | 71 (14.7%) |
| 8 or more Rooms | 184 (26.6%) | 23 (4.8%) |
| Total | 692 (100.0%) | 483 (100.0%) |
Housing Structure by Heating Type in Missouri Valley
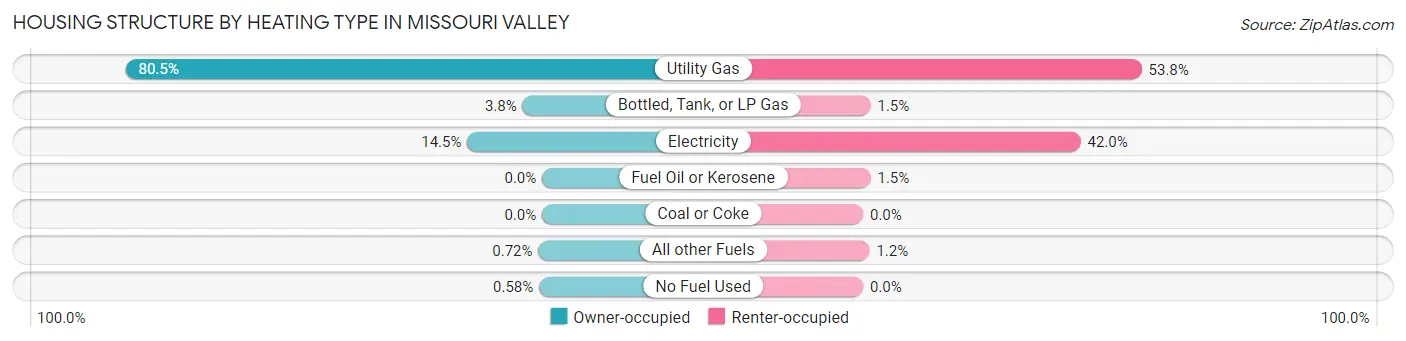
| Heating Type | Owner-occupied | Renter-occupied |
| Utility Gas | 557 (80.5%) | 260 (53.8%) |
| Bottled, Tank, or LP Gas | 26 (3.8%) | 7 (1.5%) |
| Electricity | 100 (14.4%) | 203 (42.0%) |
| Fuel Oil or Kerosene | 0 (0.0%) | 7 (1.5%) |
| Coal or Coke | 0 (0.0%) | 0 (0.0%) |
| All other Fuels | 5 (0.7%) | 6 (1.2%) |
| No Fuel Used | 4 (0.6%) | 0 (0.0%) |
| Total | 692 (100.0%) | 483 (100.0%) |
Household Vehicle Usage in Missouri Valley
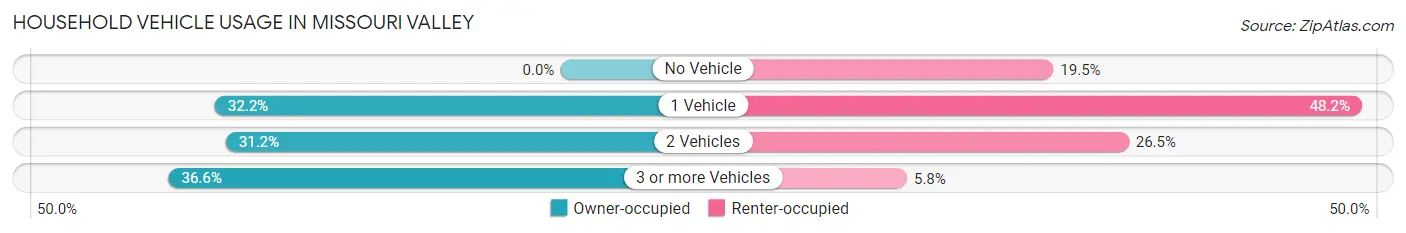
| Vehicles per Household | Owner-occupied | Renter-occupied |
| No Vehicle | 0 (0.0%) | 94 (19.5%) |
| 1 Vehicle | 223 (32.2%) | 233 (48.2%) |
| 2 Vehicles | 216 (31.2%) | 128 (26.5%) |
| 3 or more Vehicles | 253 (36.6%) | 28 (5.8%) |
| Total | 692 (100.0%) | 483 (100.0%) |
Real Estate & Mortgages in Missouri Valley
Real Estate and Mortgage Overview in Missouri Valley
| Characteristic | Without Mortgage | With Mortgage |
| Housing Units | 275 | 417 |
| Median Property Value | $89,300 | $130,600 |
| Median Household Income | $63,958 | $34 |
| Monthly Housing Costs | $457 | $0 |
| Real Estate Taxes | $1,738 | $22 |
Property Value by Mortgage Status in Missouri Valley
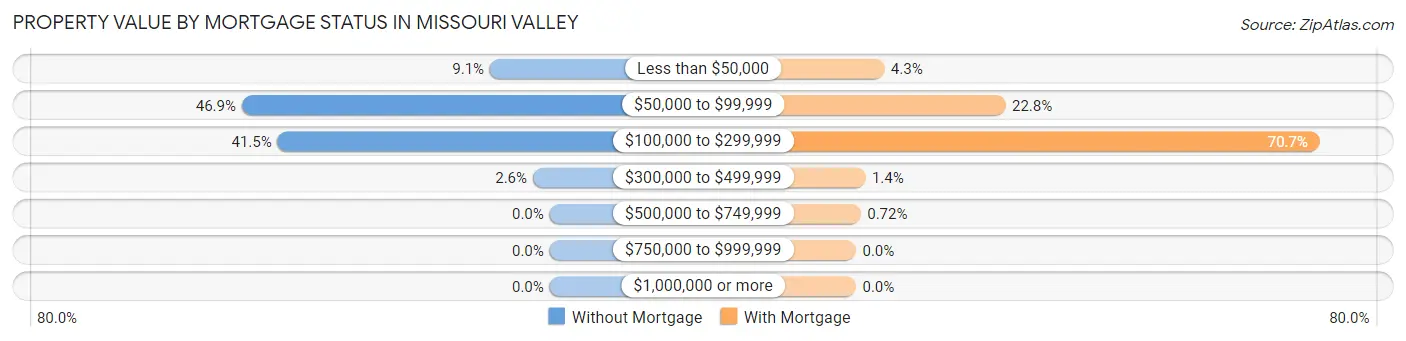
| Property Value | Without Mortgage | With Mortgage |
| Less than $50,000 | 25 (9.1%) | 18 (4.3%) |
| $50,000 to $99,999 | 129 (46.9%) | 95 (22.8%) |
| $100,000 to $299,999 | 114 (41.4%) | 295 (70.7%) |
| $300,000 to $499,999 | 7 (2.5%) | 6 (1.4%) |
| $500,000 to $749,999 | 0 (0.0%) | 3 (0.7%) |
| $750,000 to $999,999 | 0 (0.0%) | 0 (0.0%) |
| $1,000,000 or more | 0 (0.0%) | 0 (0.0%) |
| Total | 275 (100.0%) | 417 (100.0%) |
Household Income by Mortgage Status in Missouri Valley
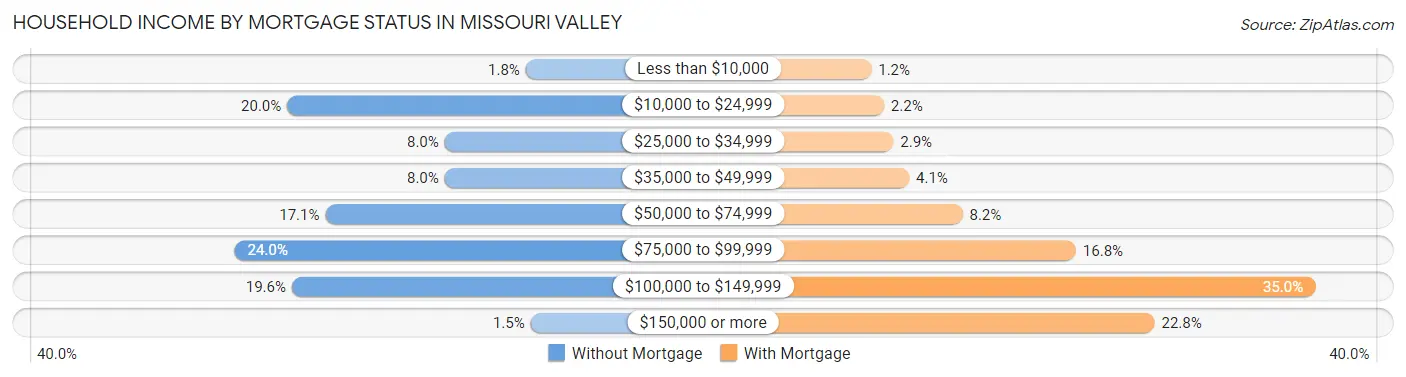
| Household Income | Without Mortgage | With Mortgage |
| Less than $10,000 | 5 (1.8%) | 5 (1.2%) |
| $10,000 to $24,999 | 55 (20.0%) | 9 (2.2%) |
| $25,000 to $34,999 | 22 (8.0%) | 12 (2.9%) |
| $35,000 to $49,999 | 22 (8.0%) | 17 (4.1%) |
| $50,000 to $74,999 | 47 (17.1%) | 34 (8.2%) |
| $75,000 to $99,999 | 66 (24.0%) | 70 (16.8%) |
| $100,000 to $149,999 | 54 (19.6%) | 146 (35.0%) |
| $150,000 or more | 4 (1.5%) | 95 (22.8%) |
| Total | 275 (100.0%) | 417 (100.0%) |
Property Value to Household Income Ratio in Missouri Valley
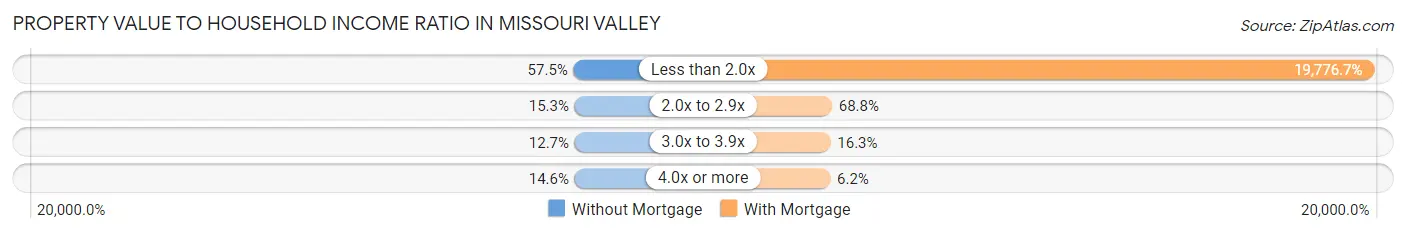
| Value-to-Income Ratio | Without Mortgage | With Mortgage |
| Less than 2.0x | 158 (57.5%) | 82,469 (19,776.7%) |
| 2.0x to 2.9x | 42 (15.3%) | 287 (68.8%) |
| 3.0x to 3.9x | 35 (12.7%) | 68 (16.3%) |
| 4.0x or more | 40 (14.5%) | 26 (6.2%) |
| Total | 275 (100.0%) | 417 (100.0%) |
Real Estate Taxes by Mortgage Status in Missouri Valley
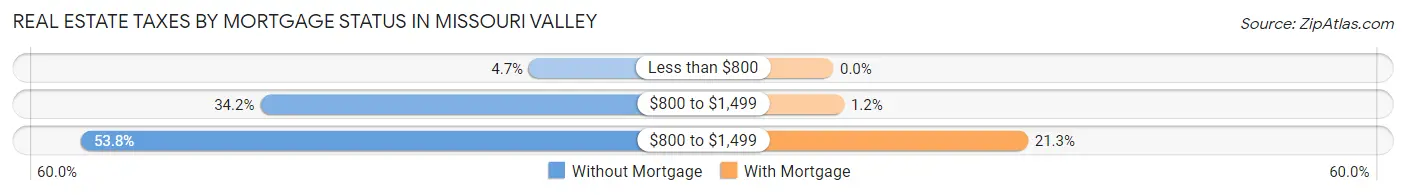
| Property Taxes | Without Mortgage | With Mortgage |
| Less than $800 | 13 (4.7%) | 0 (0.0%) |
| $800 to $1,499 | 94 (34.2%) | 5 (1.2%) |
| $800 to $1,499 | 148 (53.8%) | 89 (21.3%) |
| Total | 275 (100.0%) | 417 (100.0%) |
Health & Disability in Missouri Valley
Health Insurance Coverage by Age in Missouri Valley
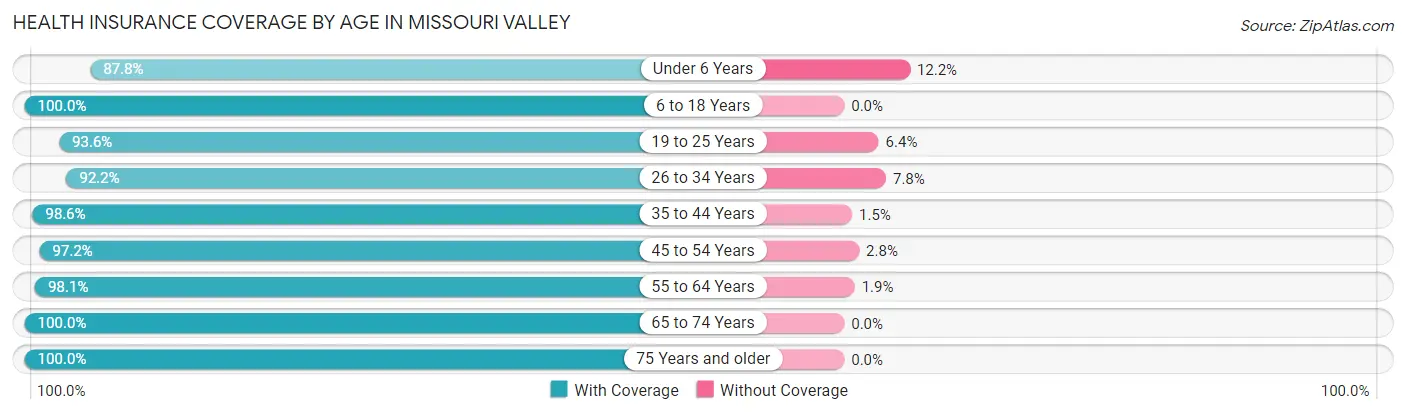
| Age Bracket | With Coverage | Without Coverage |
| Under 6 Years | 129 (87.8%) | 18 (12.2%) |
| 6 to 18 Years | 519 (100.0%) | 0 (0.0%) |
| 19 to 25 Years | 219 (93.6%) | 15 (6.4%) |
| 26 to 34 Years | 237 (92.2%) | 20 (7.8%) |
| 35 to 44 Years | 340 (98.6%) | 5 (1.5%) |
| 45 to 54 Years | 351 (97.2%) | 10 (2.8%) |
| 55 to 64 Years | 253 (98.1%) | 5 (1.9%) |
| 65 to 74 Years | 246 (100.0%) | 0 (0.0%) |
| 75 Years and older | 216 (100.0%) | 0 (0.0%) |
| Total | 2,510 (97.2%) | 73 (2.8%) |
Health Insurance Coverage by Citizenship Status in Missouri Valley
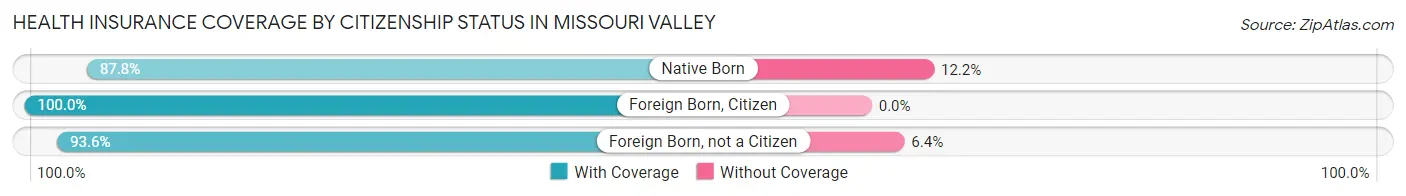
| Citizenship Status | With Coverage | Without Coverage |
| Native Born | 129 (87.8%) | 18 (12.2%) |
| Foreign Born, Citizen | 519 (100.0%) | 0 (0.0%) |
| Foreign Born, not a Citizen | 219 (93.6%) | 15 (6.4%) |
Health Insurance Coverage by Household Income in Missouri Valley
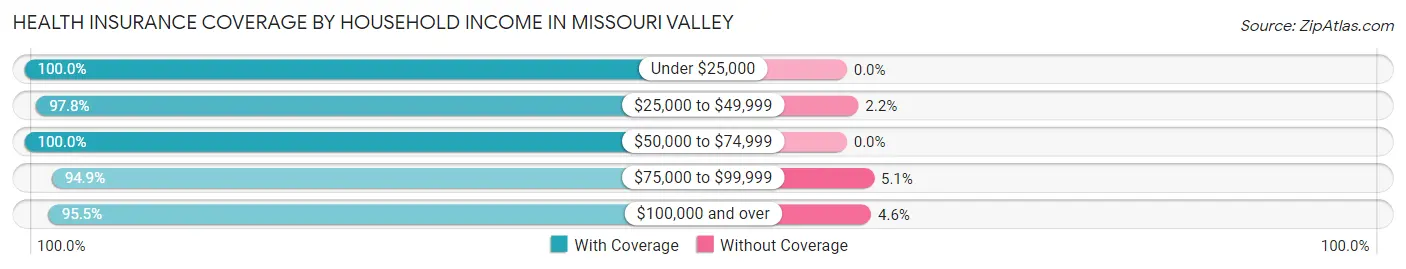
| Household Income | With Coverage | Without Coverage |
| Under $25,000 | 309 (100.0%) | 0 (0.0%) |
| $25,000 to $49,999 | 538 (97.8%) | 12 (2.2%) |
| $50,000 to $74,999 | 457 (100.0%) | 0 (0.0%) |
| $75,000 to $99,999 | 577 (94.9%) | 31 (5.1%) |
| $100,000 and over | 629 (95.5%) | 30 (4.5%) |
Public vs Private Health Insurance Coverage by Age in Missouri Valley
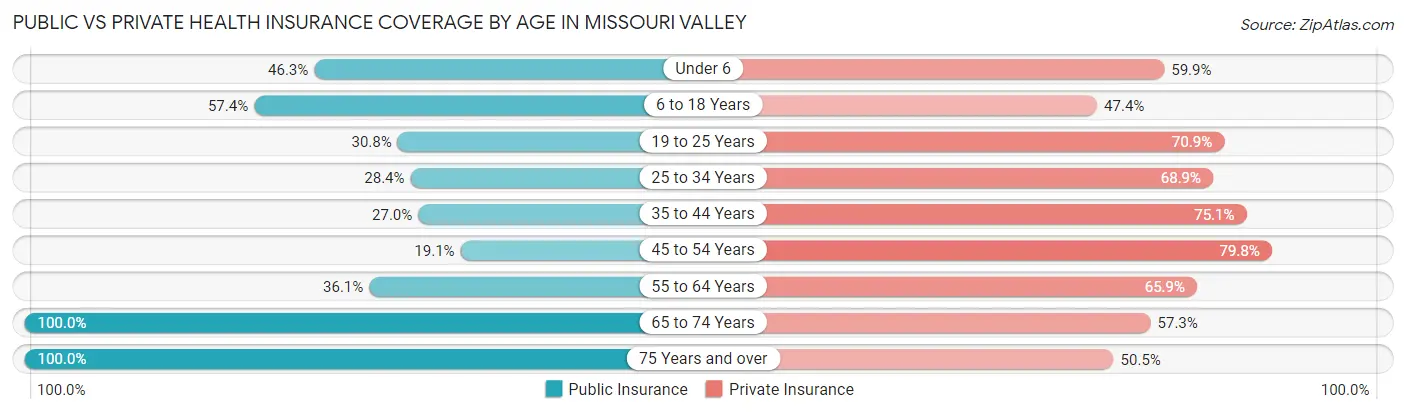
| Age Bracket | Public Insurance | Private Insurance |
| Under 6 | 68 (46.3%) | 88 (59.9%) |
| 6 to 18 Years | 298 (57.4%) | 246 (47.4%) |
| 19 to 25 Years | 72 (30.8%) | 166 (70.9%) |
| 25 to 34 Years | 73 (28.4%) | 177 (68.9%) |
| 35 to 44 Years | 93 (27.0%) | 259 (75.1%) |
| 45 to 54 Years | 69 (19.1%) | 288 (79.8%) |
| 55 to 64 Years | 93 (36.0%) | 170 (65.9%) |
| 65 to 74 Years | 246 (100.0%) | 141 (57.3%) |
| 75 Years and over | 216 (100.0%) | 109 (50.5%) |
| Total | 1,228 (47.5%) | 1,644 (63.6%) |
Disability Status by Sex by Age in Missouri Valley
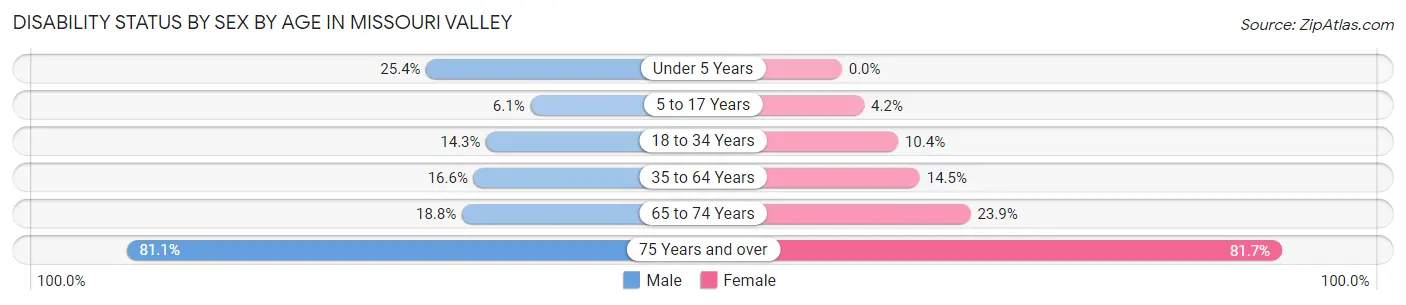
| Age Bracket | Male | Female |
| Under 5 Years | 15 (25.4%) | 0 (0.0%) |
| 5 to 17 Years | 15 (6.1%) | 10 (4.2%) |
| 18 to 34 Years | 45 (14.3%) | 24 (10.4%) |
| 35 to 64 Years | 73 (16.6%) | 76 (14.5%) |
| 65 to 74 Years | 25 (18.8%) | 27 (23.9%) |
| 75 Years and over | 60 (81.1%) | 116 (81.7%) |
Disability Class by Sex by Age in Missouri Valley
Disability Class: Hearing Difficulty
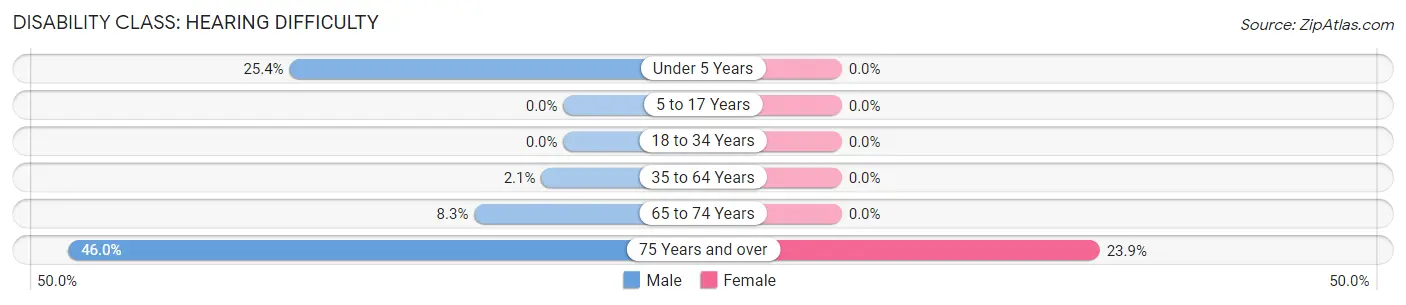
| Age Bracket | Male | Female |
| Under 5 Years | 15 (25.4%) | 0 (0.0%) |
| 5 to 17 Years | 0 (0.0%) | 0 (0.0%) |
| 18 to 34 Years | 0 (0.0%) | 0 (0.0%) |
| 35 to 64 Years | 9 (2.1%) | 0 (0.0%) |
| 65 to 74 Years | 11 (8.3%) | 0 (0.0%) |
| 75 Years and over | 34 (46.0%) | 34 (23.9%) |
Disability Class: Vision Difficulty
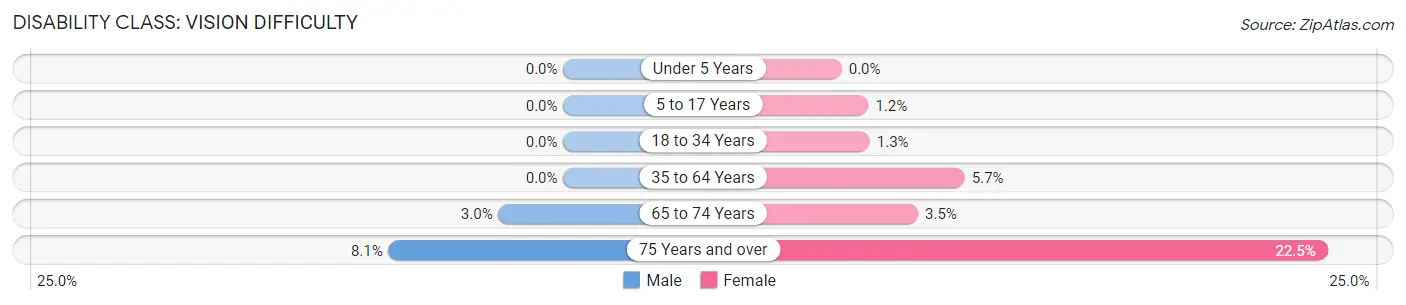
| Age Bracket | Male | Female |
| Under 5 Years | 0 (0.0%) | 0 (0.0%) |
| 5 to 17 Years | 0 (0.0%) | 3 (1.2%) |
| 18 to 34 Years | 0 (0.0%) | 3 (1.3%) |
| 35 to 64 Years | 0 (0.0%) | 30 (5.7%) |
| 65 to 74 Years | 4 (3.0%) | 4 (3.5%) |
| 75 Years and over | 6 (8.1%) | 32 (22.5%) |
Disability Class: Cognitive Difficulty
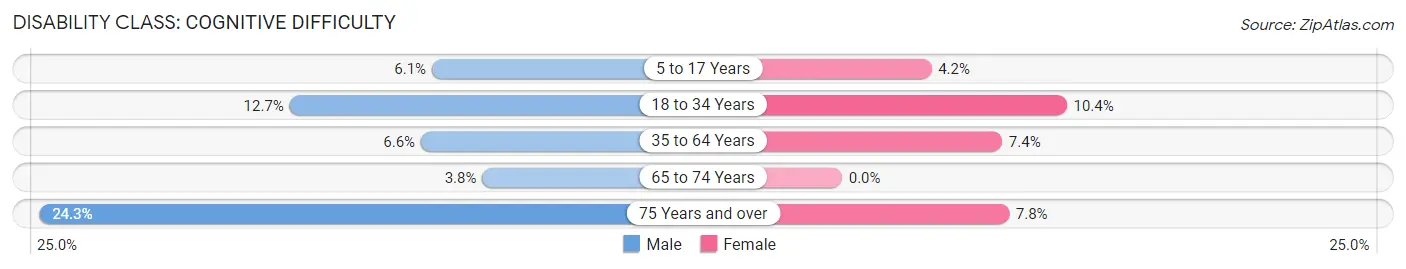
| Age Bracket | Male | Female |
| 5 to 17 Years | 15 (6.1%) | 10 (4.2%) |
| 18 to 34 Years | 40 (12.7%) | 24 (10.4%) |
| 35 to 64 Years | 29 (6.6%) | 39 (7.4%) |
| 65 to 74 Years | 5 (3.8%) | 0 (0.0%) |
| 75 Years and over | 18 (24.3%) | 11 (7.7%) |
Disability Class: Ambulatory Difficulty
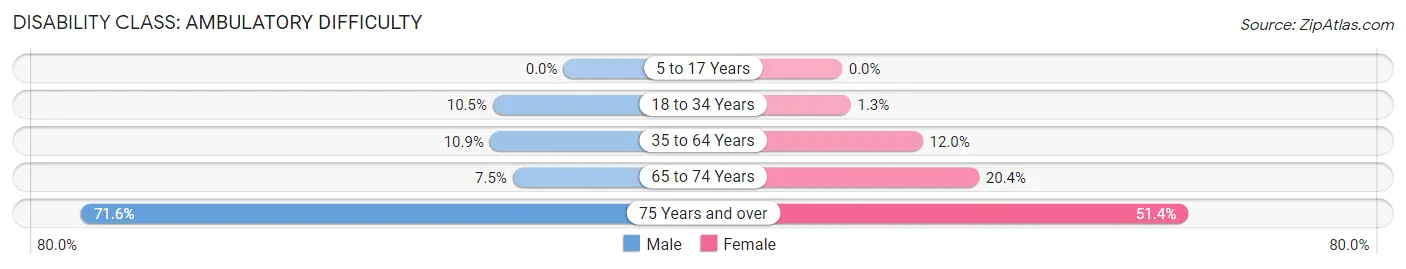
| Age Bracket | Male | Female |
| 5 to 17 Years | 0 (0.0%) | 0 (0.0%) |
| 18 to 34 Years | 33 (10.5%) | 3 (1.3%) |
| 35 to 64 Years | 48 (10.9%) | 63 (12.0%) |
| 65 to 74 Years | 10 (7.5%) | 23 (20.3%) |
| 75 Years and over | 53 (71.6%) | 73 (51.4%) |
Disability Class: Self-Care Difficulty
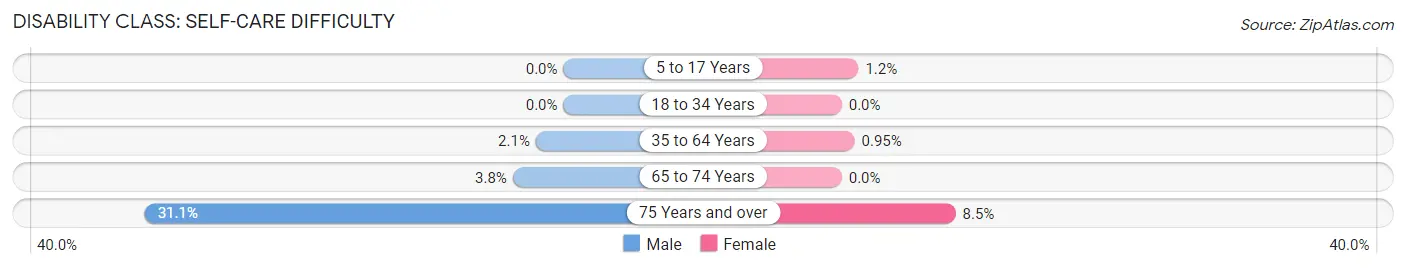
| Age Bracket | Male | Female |
| 5 to 17 Years | 0 (0.0%) | 3 (1.2%) |
| 18 to 34 Years | 0 (0.0%) | 0 (0.0%) |
| 35 to 64 Years | 9 (2.1%) | 5 (0.9%) |
| 65 to 74 Years | 5 (3.8%) | 0 (0.0%) |
| 75 Years and over | 23 (31.1%) | 12 (8.5%) |
Technology Access in Missouri Valley
Computing Device Access in Missouri Valley
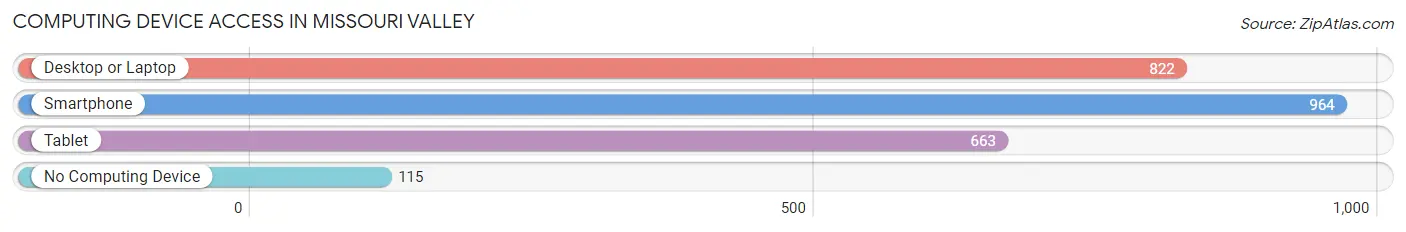
| Device Type | # Households | % Households |
| Desktop or Laptop | 822 | 70.0% |
| Smartphone | 964 | 82.0% |
| Tablet | 663 | 56.4% |
| No Computing Device | 115 | 9.8% |
| Total | 1,175 | 100.0% |
Internet Access in Missouri Valley
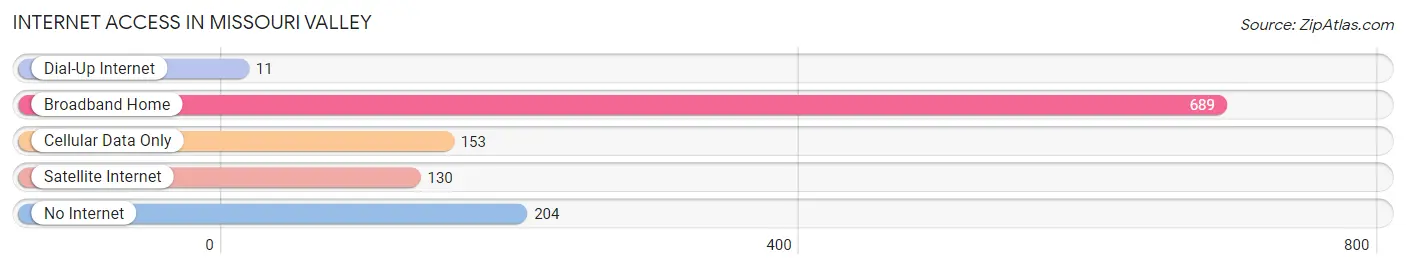
| Internet Type | # Households | % Households |
| Dial-Up Internet | 11 | 0.9% |
| Broadband Home | 689 | 58.6% |
| Cellular Data Only | 153 | 13.0% |
| Satellite Internet | 130 | 11.1% |
| No Internet | 204 | 17.4% |
| Total | 1,175 | 100.0% |
Missouri Valley Summary
Missouri Valley, Iowa is a small city located in Harrison County, Iowa, United States. It is situated along the Missouri River, and is part of the Omaha-Council Bluffs metropolitan area. The city has a population of approximately 3,000 people, and is the county seat of Harrison County.
History
Missouri Valley was founded in 1854 by a group of settlers from Missouri. The city was named after the nearby Missouri River, which was a major transportation route for the settlers. The city was incorporated in 1856, and the first post office was established in 1857.
The city was an important stop on the Union Pacific Railroad, and was a major hub for the transportation of goods and people. The city was also a major stop on the Pony Express, and was the site of the first Pony Express station in Iowa.
The city was also an important stop on the Underground Railroad, and was a major hub for the transportation of escaped slaves. The city was also the site of the first African-American church in Iowa, which was founded in 1867.
Geography
Missouri Valley is located in western Iowa, in Harrison County. The city is situated along the Missouri River, and is part of the Omaha-Council Bluffs metropolitan area. The city has a total area of 2.2 square miles, all of which is land.
The city has a humid continental climate, with hot summers and cold winters. The average temperature in the summer is around 75 degrees Fahrenheit, and the average temperature in the winter is around 25 degrees Fahrenheit.
Economy
The economy of Missouri Valley is largely based on agriculture and manufacturing. The city is home to several large agricultural companies, including Cargill, Tyson Foods, and Land O’Lakes. The city is also home to several manufacturing companies, including John Deere, Case IH, and Caterpillar.
The city is also home to several retail stores, including Walmart, Target, and Hy-Vee. The city is also home to several restaurants, including McDonald’s, Burger King, and Applebee’s.
Demographics
As of the 2010 census, the population of Missouri Valley was 3,039. The racial makeup of the city was 95.2% White, 0.7% African American, 0.3% Native American, 0.7% Asian, 0.1% Pacific Islander, 1.2% from other races, and 1.7% from two or more races. Hispanic or Latino of any race were 3.2% of the population.
The median income for a household in the city was $41,250, and the median income for a family was $50,000. The per capita income for the city was $20,845. About 8.2% of families and 10.2% of the population were below the poverty line, including 14.2% of those under age 18 and 8.2% of those age 65 or over.
Missouri Valley is a small city with a rich history and a diverse economy. The city is home to several large agricultural and manufacturing companies, as well as several retail stores and restaurants. The city has a population of approximately 3,000 people, and is the county seat of Harrison County. The city has a humid continental climate, with hot summers and cold winters. The median income for a household in the city was $41,250, and the median income for a family was $50,000. The city is a great place to live, work, and raise a family.
Common Questions
What is Per Capita Income in Missouri Valley?
Per Capita income in Missouri Valley is $29,302.
What is the Median Family Income in Missouri Valley?
Median Family Income in Missouri Valley is $76,181.
What is the Median Household income in Missouri Valley?
Median Household Income in Missouri Valley is $61,480.
What is Income or Wage Gap in Missouri Valley?
Income or Wage Gap in Missouri Valley is 11.9%.
Women in Missouri Valley earn 88.1 cents for every dollar earned by a man.
What is Inequality or Gini Index in Missouri Valley?
Inequality or Gini Index in Missouri Valley is 0.35.
What is the Total Population of Missouri Valley?
Total Population of Missouri Valley is 2,692.
What is the Total Male Population of Missouri Valley?
Total Male Population of Missouri Valley is 1,288.
What is the Total Female Population of Missouri Valley?
Total Female Population of Missouri Valley is 1,404.
What is the Ratio of Males per 100 Females in Missouri Valley?
There are 91.74 Males per 100 Females in Missouri Valley.
What is the Ratio of Females per 100 Males in Missouri Valley?
There are 109.01 Females per 100 Males in Missouri Valley.
What is the Median Population Age in Missouri Valley?
Median Population Age in Missouri Valley is 39.6 Years.
What is the Average Family Size in Missouri Valley
Average Family Size in Missouri Valley is 3.0 People.
What is the Average Household Size in Missouri Valley
Average Household Size in Missouri Valley is 2.2 People.
How Large is the Labor Force in Missouri Valley?
There are 1,272 People in the Labor Forcein in Missouri Valley.
What is the Percentage of People in the Labor Force in Missouri Valley?
60.4% of People are in the Labor Force in Missouri Valley.
What is the Unemployment Rate in Missouri Valley?
Unemployment Rate in Missouri Valley is 4.6%.