Milford, IA Map & Demographics
Milford Map
Milford Overview
$36,233
PER CAPITA INCOME
$68,063
AVG FAMILY INCOME
$59,059
AVG HOUSEHOLD INCOME
13.9%
WAGE / INCOME GAP [ % ]
86.1¢/ $1
WAGE / INCOME GAP [ $ ]
$4,780
FAMILY INCOME DEFICIT
0.42
INEQUALITY / GINI INDEX
3,295
TOTAL POPULATION
1,702
MALE POPULATION
1,593
FEMALE POPULATION
106.84
MALES / 100 FEMALES
93.60
FEMALES / 100 MALES
44.0
MEDIAN AGE
2.9
AVG FAMILY SIZE
2.2
AVG HOUSEHOLD SIZE
1,726
LABOR FORCE [ PEOPLE ]
65.5%
PERCENT IN LABOR FORCE
3.4%
UNEMPLOYMENT RATE
Milford Zip Codes
Milford Area Codes
Income in Milford
Income Overview in Milford
Per Capita Income in Milford is $36,233, while median incomes of families and households are $68,063 and $59,059 respectively.
| Characteristic | Number | Measure |
| Per Capita Income | 3,295 | $36,233 |
| Median Family Income | 907 | $68,063 |
| Mean Family Income | 907 | $98,350 |
| Median Household Income | 1,441 | $59,059 |
| Mean Household Income | 1,441 | $82,088 |
| Income Deficit | 907 | $4,780 |
| Wage / Income Gap (%) | 3,295 | 13.86% |
| Wage / Income Gap ($) | 3,295 | 86.14¢ per $1 |
| Gini / Inequality Index | 3,295 | 0.42 |
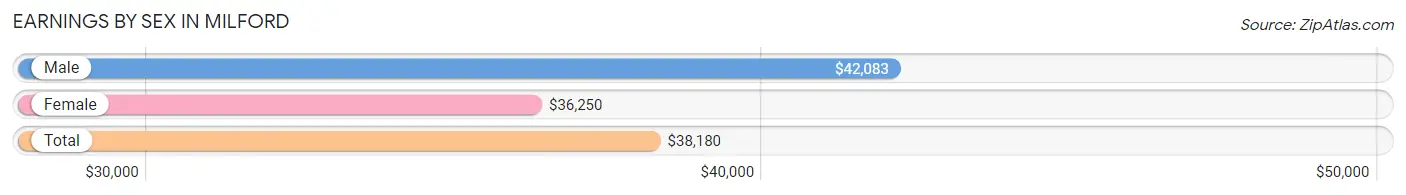
Earnings by Sex in Milford
Average Earnings in Milford are $38,180, $42,083 for men and $36,250 for women, a difference of 13.9%.
| Sex | Number | Average Earnings |
| Male | 975 (54.4%) | $42,083 |
| Female | 817 (45.6%) | $36,250 |
| Total | 1,792 (100.0%) | $38,180 |
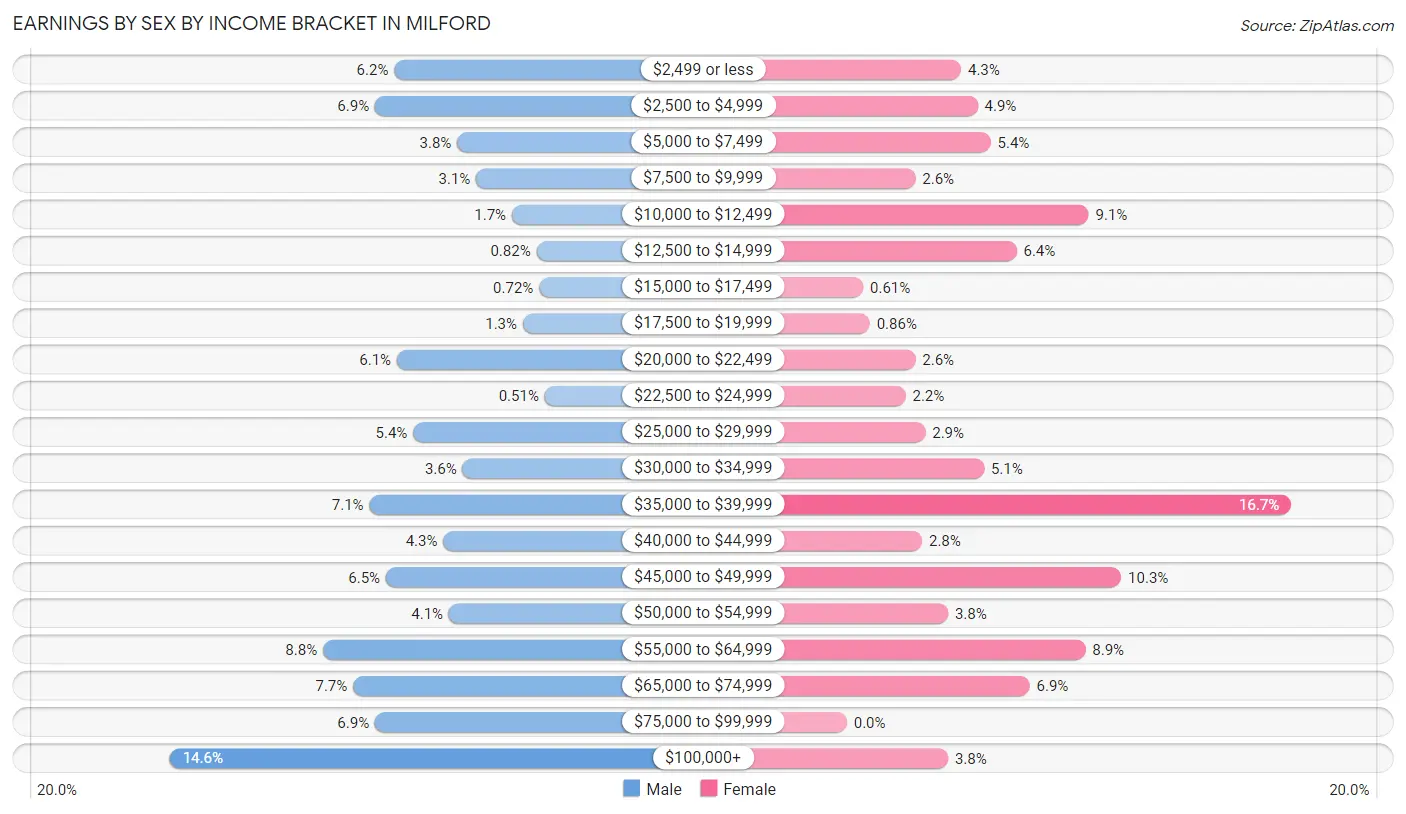
Earnings by Sex by Income Bracket in Milford
The most common earnings brackets in Milford are $100,000+ for men (142 | 14.6%) and $35,000 to $39,999 for women (136 | 16.7%).
| Income | Male | Female |
| $2,499 or less | 60 (6.1%) | 35 (4.3%) |
| $2,500 to $4,999 | 67 (6.9%) | 40 (4.9%) |
| $5,000 to $7,499 | 37 (3.8%) | 44 (5.4%) |
| $7,500 to $9,999 | 30 (3.1%) | 21 (2.6%) |
| $10,000 to $12,499 | 17 (1.7%) | 74 (9.1%) |
| $12,500 to $14,999 | 8 (0.8%) | 52 (6.4%) |
| $15,000 to $17,499 | 7 (0.7%) | 5 (0.6%) |
| $17,500 to $19,999 | 13 (1.3%) | 7 (0.9%) |
| $20,000 to $22,499 | 59 (6.0%) | 21 (2.6%) |
| $22,500 to $24,999 | 5 (0.5%) | 18 (2.2%) |
| $25,000 to $29,999 | 53 (5.4%) | 24 (2.9%) |
| $30,000 to $34,999 | 35 (3.6%) | 42 (5.1%) |
| $35,000 to $39,999 | 69 (7.1%) | 136 (16.7%) |
| $40,000 to $44,999 | 42 (4.3%) | 23 (2.8%) |
| $45,000 to $49,999 | 63 (6.5%) | 84 (10.3%) |
| $50,000 to $54,999 | 40 (4.1%) | 31 (3.8%) |
| $55,000 to $64,999 | 86 (8.8%) | 73 (8.9%) |
| $65,000 to $74,999 | 75 (7.7%) | 56 (6.9%) |
| $75,000 to $99,999 | 67 (6.9%) | 0 (0.0%) |
| $100,000+ | 142 (14.6%) | 31 (3.8%) |
| Total | 975 (100.0%) | 817 (100.0%) |
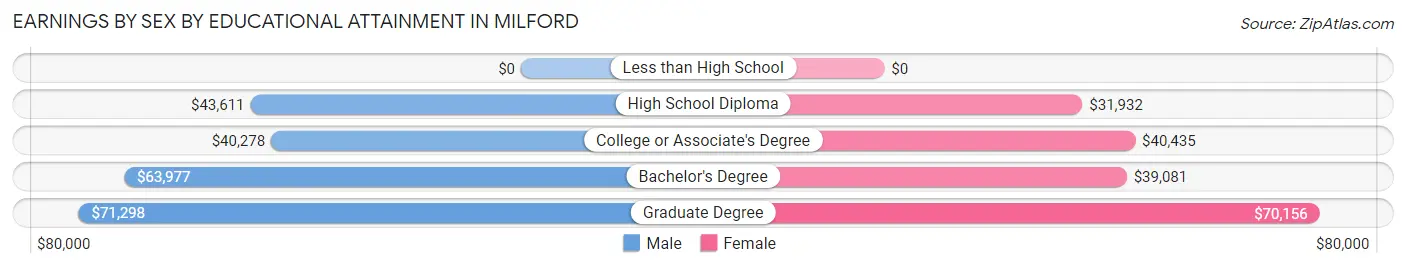
Earnings by Sex by Educational Attainment in Milford
Average earnings in Milford are $48,846 for men and $38,618 for women, a difference of 20.9%. Men with an educational attainment of graduate degree enjoy the highest average annual earnings of $71,298, while those with college or associate's degree education earn the least with $40,278. Women with an educational attainment of graduate degree earn the most with the average annual earnings of $70,156, while those with high school diploma education have the smallest earnings of $31,932.
| Educational Attainment | Male Income | Female Income |
| Less than High School | - | - |
| High School Diploma | $43,611 | $31,932 |
| College or Associate's Degree | $40,278 | $40,435 |
| Bachelor's Degree | $63,977 | $39,081 |
| Graduate Degree | $71,298 | $70,156 |
| Total | $48,846 | $38,618 |
Family Income in Milford
Family Income Brackets in Milford
According to the Milford family income data, there are 253 families falling into the $50,000 to $74,999 income range, which is the most common income bracket and makes up 27.9% of all families.
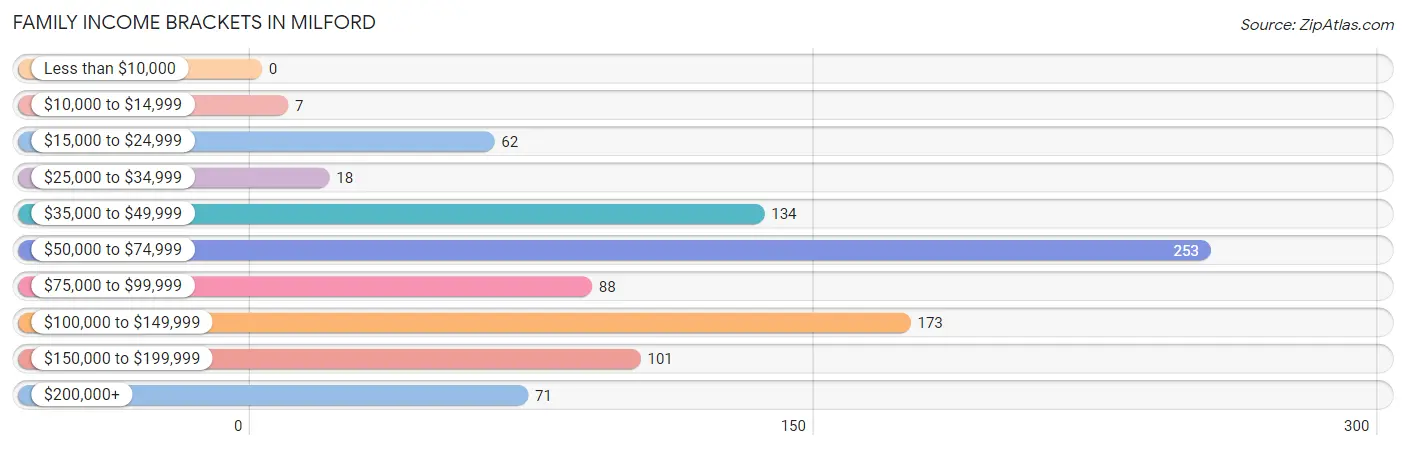
| Income Bracket | # Families | % Families |
| Less than $10,000 | 0 | 0.0% |
| $10,000 to $14,999 | 7 | 0.8% |
| $15,000 to $24,999 | 62 | 6.8% |
| $25,000 to $34,999 | 18 | 2.0% |
| $35,000 to $49,999 | 134 | 14.8% |
| $50,000 to $74,999 | 253 | 27.9% |
| $75,000 to $99,999 | 88 | 9.7% |
| $100,000 to $149,999 | 173 | 19.1% |
| $150,000 to $199,999 | 101 | 11.1% |
| $200,000+ | 71 | 7.8% |
Family Income by Famaliy Size in Milford
5-person families (30 | 3.3%) account for the highest median family income in Milford with $130,294 per family, while 2-person families (502 | 55.3%) have the highest median income of $29,961 per family member.
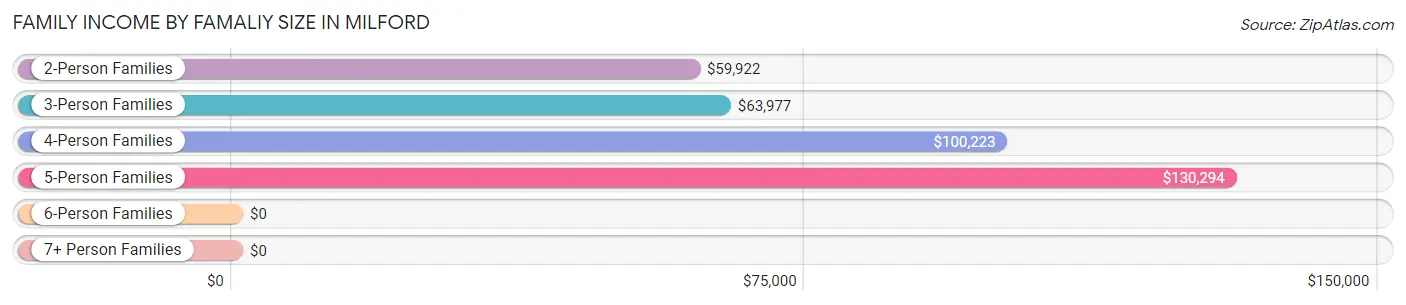
| Income Bracket | # Families | Median Income |
| 2-Person Families | 502 (55.3%) | $59,922 |
| 3-Person Families | 147 (16.2%) | $63,977 |
| 4-Person Families | 197 (21.7%) | $100,223 |
| 5-Person Families | 30 (3.3%) | $130,294 |
| 6-Person Families | 5 (0.5%) | $0 |
| 7+ Person Families | 26 (2.9%) | $0 |
| Total | 907 (100.0%) | $68,063 |
Family Income by Number of Earners in Milford
The median family income in Milford is $68,063, with families comprising 3+ earners (167) having the highest median family income of $112,344, while families with no earners (145) have the lowest median family income of $47,450, accounting for 18.4% and 16.0% of families, respectively.
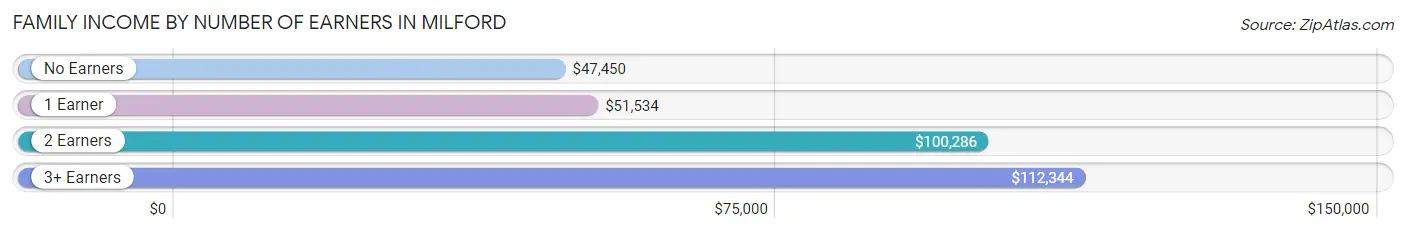
| Number of Earners | # Families | Median Income |
| No Earners | 145 (16.0%) | $47,450 |
| 1 Earner | 233 (25.7%) | $51,534 |
| 2 Earners | 362 (39.9%) | $100,286 |
| 3+ Earners | 167 (18.4%) | $112,344 |
| Total | 907 (100.0%) | $68,063 |
Household Income in Milford
Household Income Brackets in Milford
With 321 households falling in the category, the $50,000 to $74,999 income range is the most frequent in Milford, accounting for 22.3% of all households. In contrast, only 17 households (1.2%) fall into the less than $10,000 income bracket, making it the least populous group.
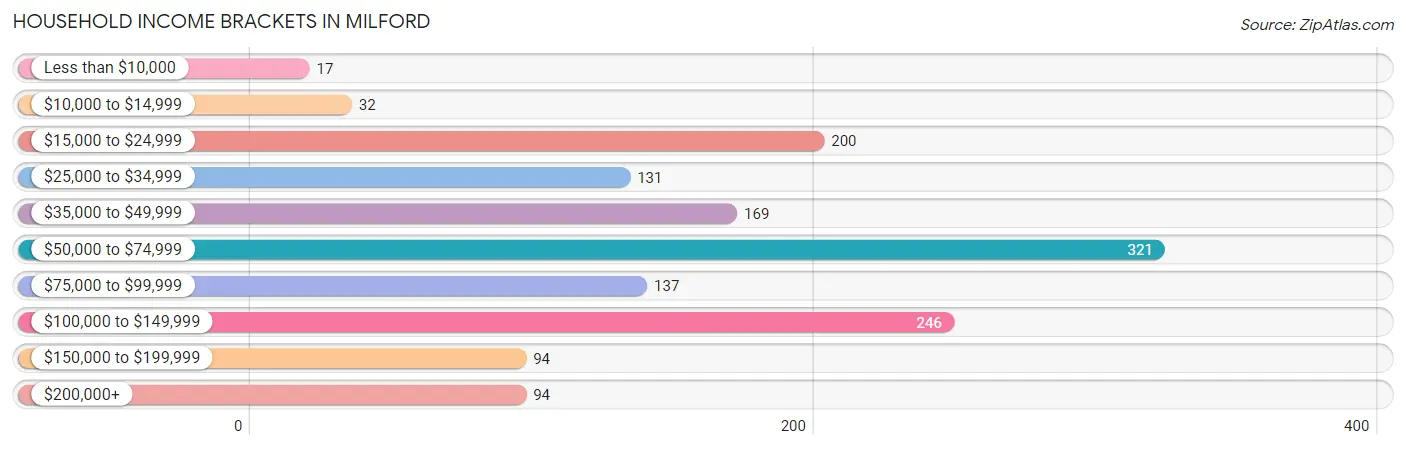
| Income Bracket | # Households | % Households |
| Less than $10,000 | 17 | 1.2% |
| $10,000 to $14,999 | 32 | 2.2% |
| $15,000 to $24,999 | 200 | 13.9% |
| $25,000 to $34,999 | 131 | 9.1% |
| $35,000 to $49,999 | 169 | 11.7% |
| $50,000 to $74,999 | 321 | 22.3% |
| $75,000 to $99,999 | 137 | 9.5% |
| $100,000 to $149,999 | 246 | 17.1% |
| $150,000 to $199,999 | 94 | 6.5% |
| $200,000+ | 94 | 6.5% |
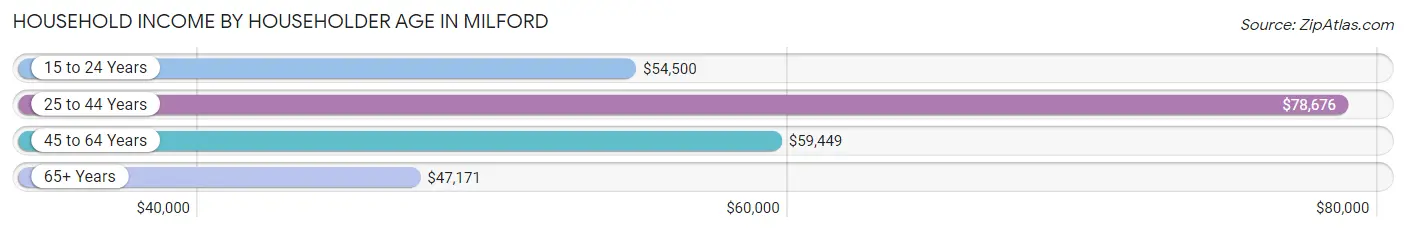
Household Income by Householder Age in Milford
The median household income in Milford is $59,059, with the highest median household income of $78,676 found in the 25 to 44 years age bracket for the primary householder. A total of 404 households (28.0%) fall into this category. Meanwhile, the 65+ years age bracket for the primary householder has the lowest median household income of $47,171, with 502 households (34.8%) in this group.
| Income Bracket | # Households | Median Income |
| 15 to 24 Years | 22 (1.5%) | $54,500 |
| 25 to 44 Years | 404 (28.0%) | $78,676 |
| 45 to 64 Years | 513 (35.6%) | $59,449 |
| 65+ Years | 502 (34.8%) | $47,171 |
| Total | 1,441 (100.0%) | $59,059 |
Poverty in Milford
Income Below Poverty by Sex and Age in Milford
With 2.1% poverty level for males and 9.4% for females among the residents of Milford, under 5 year old males and 5 year old females are the most vulnerable to poverty, with 19 males (23.7%) and 13 females (44.8%) in their respective age groups living below the poverty level.
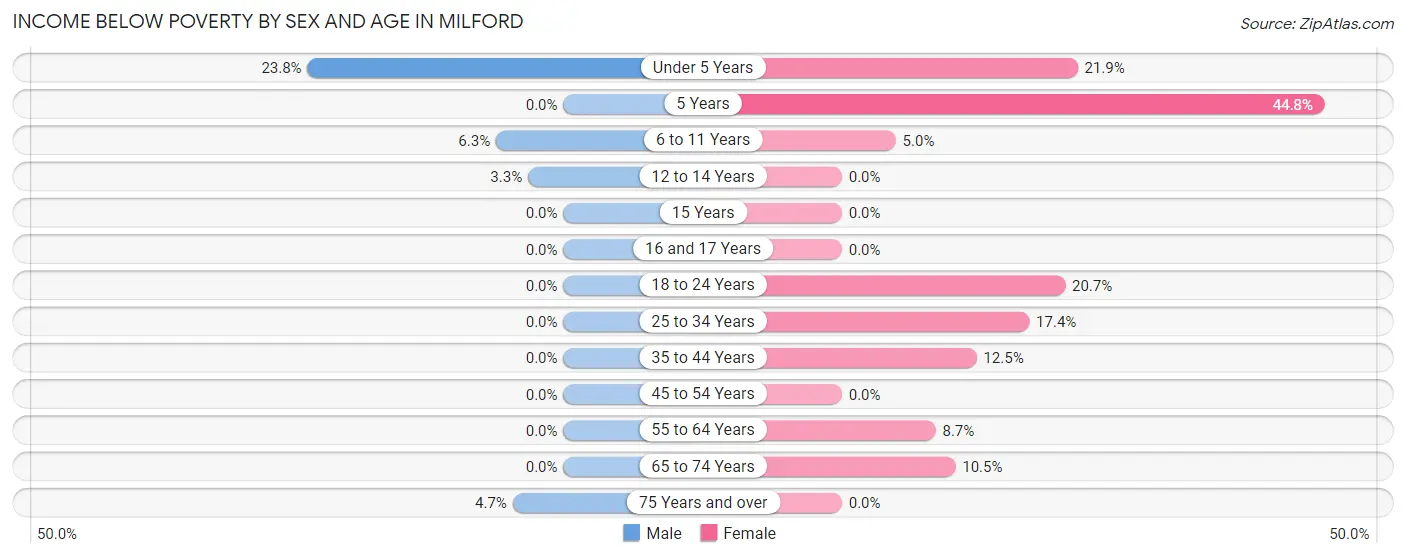
| Age Bracket | Male | Female |
| Under 5 Years | 19 (23.7%) | 14 (21.9%) |
| 5 Years | 0 (0.0%) | 13 (44.8%) |
| 6 to 11 Years | 5 (6.2%) | 6 (5.0%) |
| 12 to 14 Years | 4 (3.3%) | 0 (0.0%) |
| 15 Years | 0 (0.0%) | 0 (0.0%) |
| 16 and 17 Years | 0 (0.0%) | 0 (0.0%) |
| 18 to 24 Years | 0 (0.0%) | 23 (20.7%) |
| 25 to 34 Years | 0 (0.0%) | 20 (17.4%) |
| 35 to 44 Years | 0 (0.0%) | 27 (12.5%) |
| 45 to 54 Years | 0 (0.0%) | 0 (0.0%) |
| 55 to 64 Years | 0 (0.0%) | 20 (8.7%) |
| 65 to 74 Years | 0 (0.0%) | 24 (10.5%) |
| 75 Years and over | 7 (4.7%) | 0 (0.0%) |
| Total | 35 (2.1%) | 147 (9.4%) |
Income Above Poverty by Sex and Age in Milford
According to the poverty statistics in Milford, males aged 5 years and females aged 12 to 14 years are the age groups that are most secure financially, with 100.0% of males and 100.0% of females in these age groups living above the poverty line.
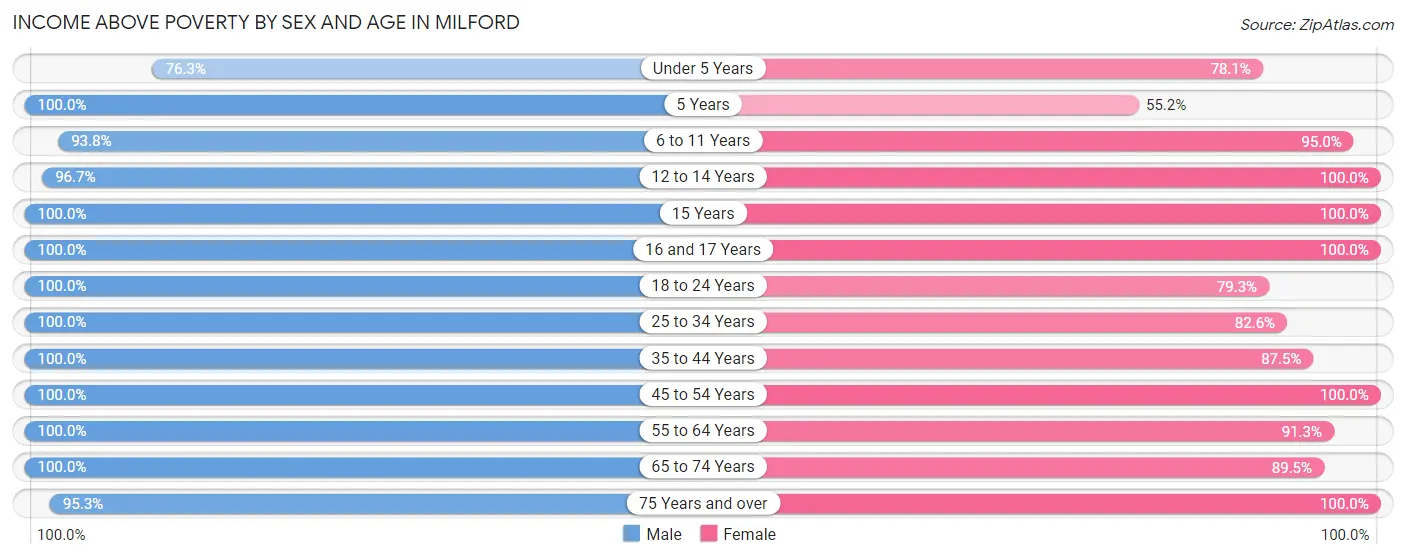
| Age Bracket | Male | Female |
| Under 5 Years | 61 (76.2%) | 50 (78.1%) |
| 5 Years | 17 (100.0%) | 16 (55.2%) |
| 6 to 11 Years | 75 (93.8%) | 114 (95.0%) |
| 12 to 14 Years | 118 (96.7%) | 88 (100.0%) |
| 15 Years | 33 (100.0%) | 27 (100.0%) |
| 16 and 17 Years | 115 (100.0%) | 31 (100.0%) |
| 18 to 24 Years | 76 (100.0%) | 88 (79.3%) |
| 25 to 34 Years | 246 (100.0%) | 95 (82.6%) |
| 35 to 44 Years | 110 (100.0%) | 189 (87.5%) |
| 45 to 54 Years | 224 (100.0%) | 200 (100.0%) |
| 55 to 64 Years | 156 (100.0%) | 210 (91.3%) |
| 65 to 74 Years | 272 (100.0%) | 204 (89.5%) |
| 75 Years and over | 142 (95.3%) | 108 (100.0%) |
| Total | 1,645 (97.9%) | 1,420 (90.6%) |
Income Below Poverty Among Married-Couple Families in Milford
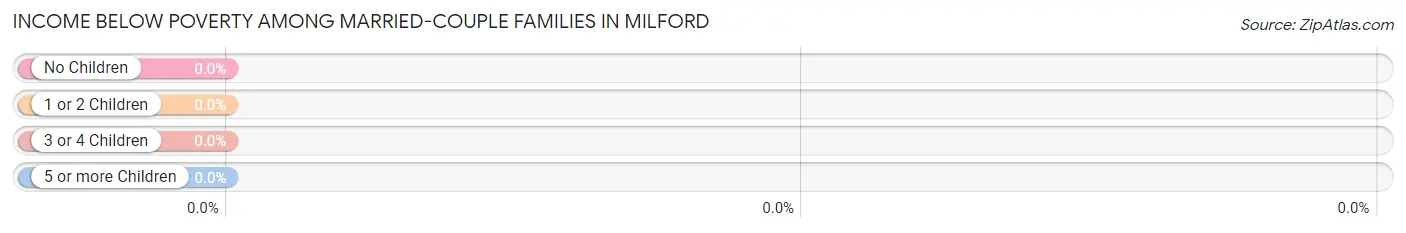
| Children | Above Poverty | Below Poverty |
| No Children | 439 (100.0%) | 0 (0.0%) |
| 1 or 2 Children | 187 (100.0%) | 0 (0.0%) |
| 3 or 4 Children | 40 (100.0%) | 0 (0.0%) |
| 5 or more Children | 21 (100.0%) | 0 (0.0%) |
| Total | 687 (100.0%) | 0 (0.0%) |
Income Below Poverty Among Single-Parent Households in Milford
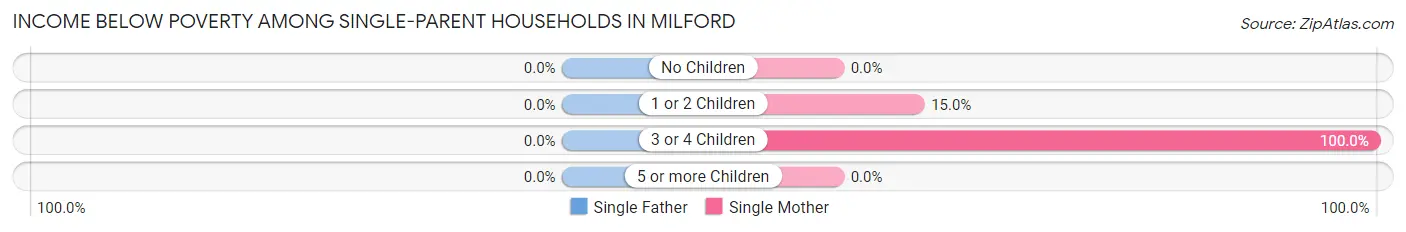
| Children | Single Father | Single Mother |
| No Children | 0 (0.0%) | 0 (0.0%) |
| 1 or 2 Children | 0 (0.0%) | 12 (15.0%) |
| 3 or 4 Children | 0 (0.0%) | 13 (100.0%) |
| 5 or more Children | 0 (0.0%) | 0 (0.0%) |
| Total | 0 (0.0%) | 25 (16.3%) |
Income Below Poverty Among Married-Couple vs Single-Parent Households in Milford
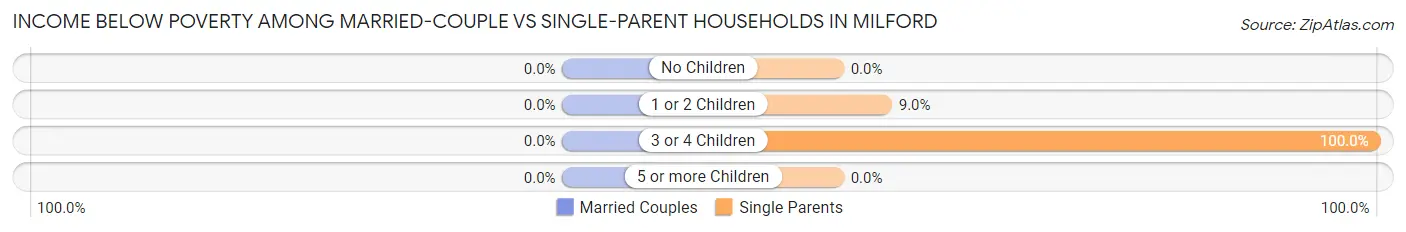
| Children | Married-Couple Families | Single-Parent Households |
| No Children | 0 (0.0%) | 0 (0.0%) |
| 1 or 2 Children | 0 (0.0%) | 12 (9.0%) |
| 3 or 4 Children | 0 (0.0%) | 13 (100.0%) |
| 5 or more Children | 0 (0.0%) | 0 (0.0%) |
| Total | 0 (0.0%) | 25 (11.4%) |
Race in Milford
The most populous races in Milford are White / Caucasian (3,137 | 95.2%), Hispanic or Latino (174 | 5.3%), and Two or more Races (117 | 3.5%).
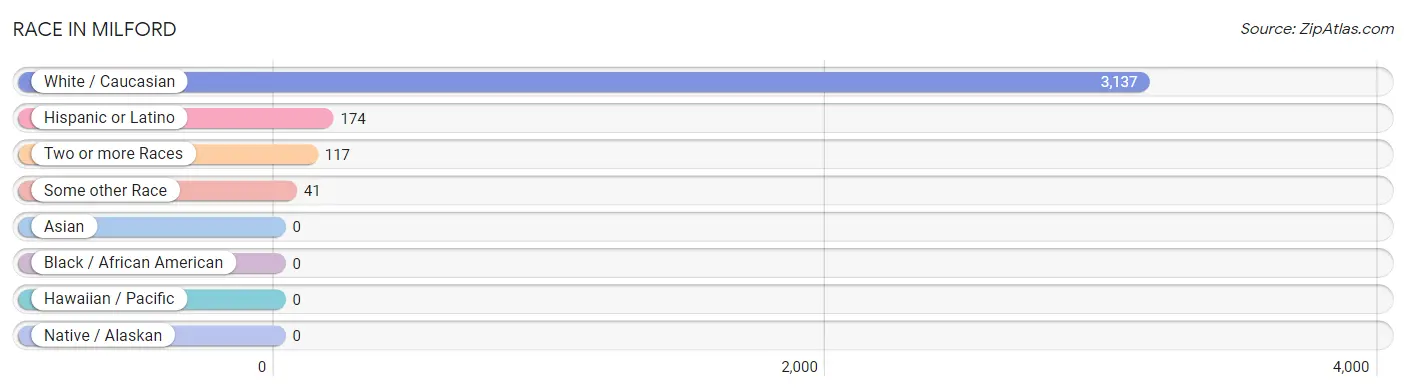
| Race | # Population | % Population |
| Asian | 0 | 0.0% |
| Black / African American | 0 | 0.0% |
| Hawaiian / Pacific | 0 | 0.0% |
| Hispanic or Latino | 174 | 5.3% |
| Native / Alaskan | 0 | 0.0% |
| White / Caucasian | 3,137 | 95.2% |
| Two or more Races | 117 | 3.5% |
| Some other Race | 41 | 1.2% |
| Total | 3,295 | 100.0% |
Ancestry in Milford
The most populous ancestries reported in Milford are German (1,301 | 39.5%), Irish (479 | 14.5%), English (342 | 10.4%), Norwegian (209 | 6.3%), and American (203 | 6.2%), together accounting for 76.9% of all Milford residents.
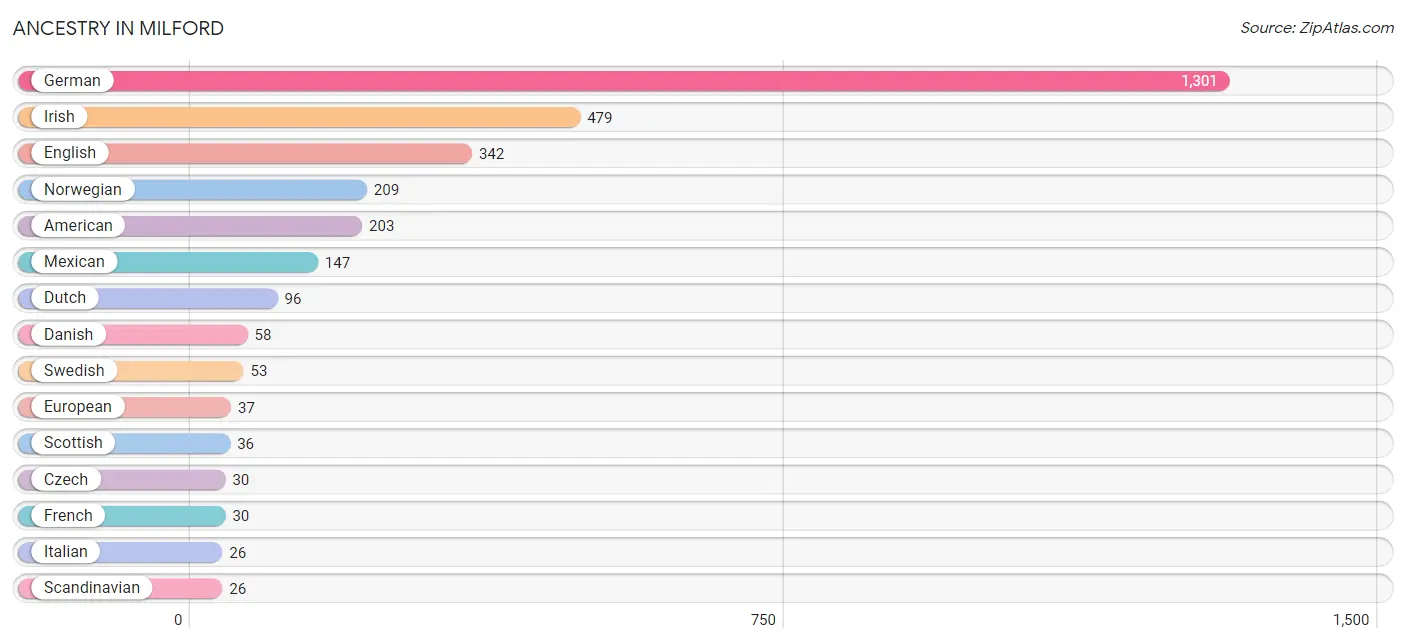
| Ancestry | # Population | % Population |
| American | 203 | 6.2% |
| Belgian | 5 | 0.2% |
| Central American | 10 | 0.3% |
| Czech | 30 | 0.9% |
| Danish | 58 | 1.8% |
| Dutch | 96 | 2.9% |
| English | 342 | 10.4% |
| European | 37 | 1.1% |
| French | 30 | 0.9% |
| French Canadian | 9 | 0.3% |
| German | 1,301 | 39.5% |
| Guatemalan | 10 | 0.3% |
| Irish | 479 | 14.5% |
| Italian | 26 | 0.8% |
| Mexican | 147 | 4.5% |
| Norwegian | 209 | 6.3% |
| Pennsylvania German | 9 | 0.3% |
| Polish | 11 | 0.3% |
| Russian | 7 | 0.2% |
| Scandinavian | 26 | 0.8% |
| Scotch-Irish | 3 | 0.1% |
| Scottish | 36 | 1.1% |
| Swedish | 53 | 1.6% |
| Swiss | 8 | 0.2% |
| Welsh | 7 | 0.2% | View All 25 Rows |
Immigrants in Milford
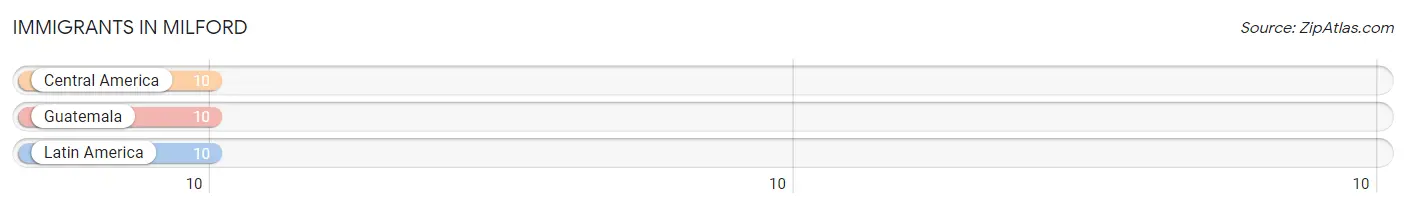
The most numerous immigrant groups reported in Milford came from Central America (10 | 0.3%), Guatemala (10 | 0.3%), and Latin America (10 | 0.3%), together accounting for 0.9% of all Milford residents.
| Immigration Origin | # Population | % Population |
| Central America | 10 | 0.3% |
| Guatemala | 10 | 0.3% |
| Latin America | 10 | 0.3% | View All 3 Rows |
Sex and Age in Milford
Sex and Age in Milford
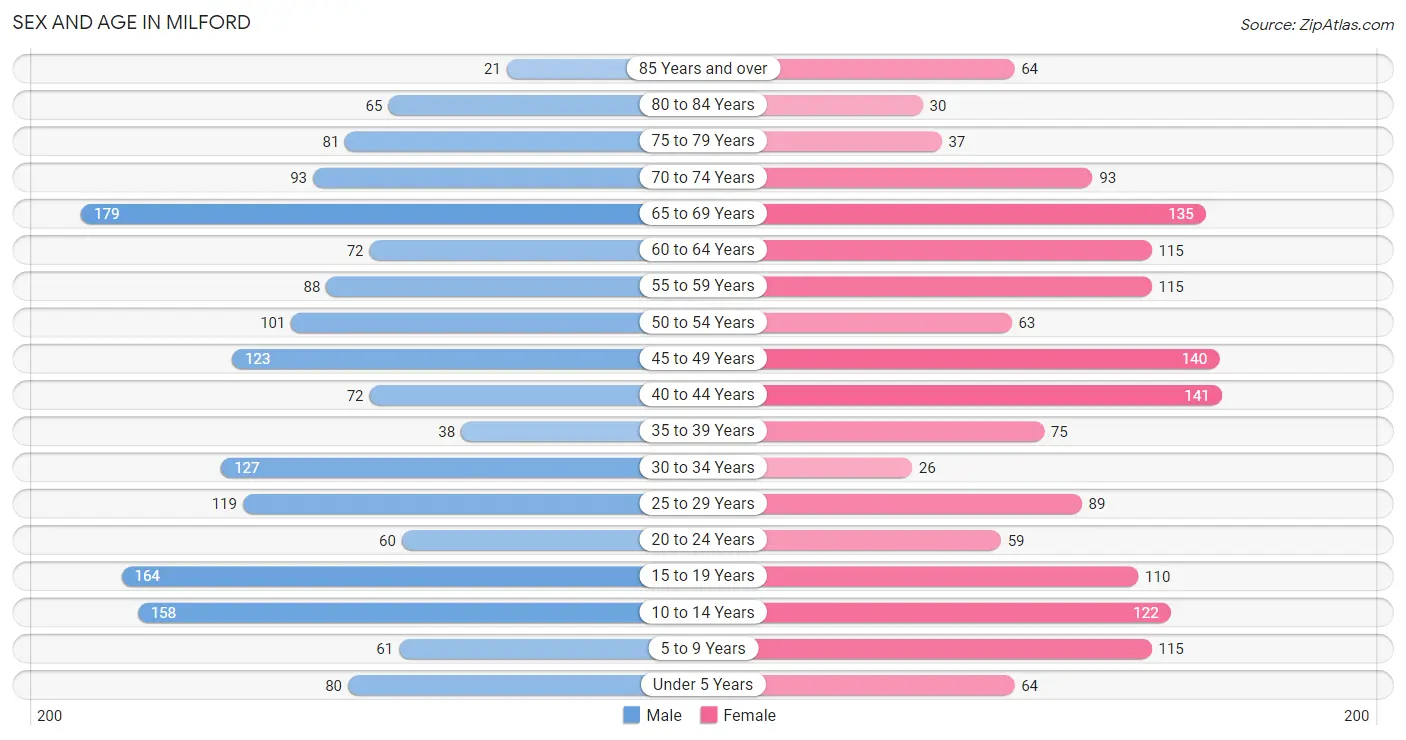
The most populous age groups in Milford are 65 to 69 Years (179 | 10.5%) for men and 40 to 44 Years (141 | 8.8%) for women.
| Age Bracket | Male | Female |
| Under 5 Years | 80 (4.7%) | 64 (4.0%) |
| 5 to 9 Years | 61 (3.6%) | 115 (7.2%) |
| 10 to 14 Years | 158 (9.3%) | 122 (7.7%) |
| 15 to 19 Years | 164 (9.6%) | 110 (6.9%) |
| 20 to 24 Years | 60 (3.5%) | 59 (3.7%) |
| 25 to 29 Years | 119 (7.0%) | 89 (5.6%) |
| 30 to 34 Years | 127 (7.5%) | 26 (1.6%) |
| 35 to 39 Years | 38 (2.2%) | 75 (4.7%) |
| 40 to 44 Years | 72 (4.2%) | 141 (8.8%) |
| 45 to 49 Years | 123 (7.2%) | 140 (8.8%) |
| 50 to 54 Years | 101 (5.9%) | 63 (4.0%) |
| 55 to 59 Years | 88 (5.2%) | 115 (7.2%) |
| 60 to 64 Years | 72 (4.2%) | 115 (7.2%) |
| 65 to 69 Years | 179 (10.5%) | 135 (8.5%) |
| 70 to 74 Years | 93 (5.5%) | 93 (5.8%) |
| 75 to 79 Years | 81 (4.8%) | 37 (2.3%) |
| 80 to 84 Years | 65 (3.8%) | 30 (1.9%) |
| 85 Years and over | 21 (1.2%) | 64 (4.0%) |
| Total | 1,702 (100.0%) | 1,593 (100.0%) |
Families and Households in Milford
Median Family Size in Milford
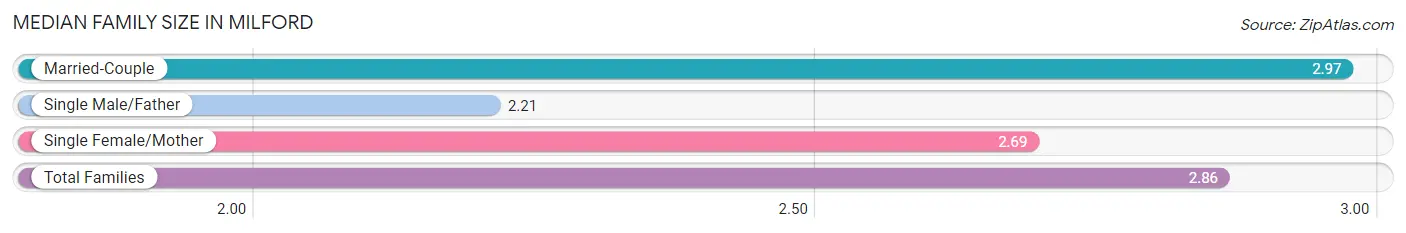
The median family size in Milford is 2.86 persons per family, with married-couple families (687 | 75.7%) accounting for the largest median family size of 2.97 persons per family. On the other hand, single male/father families (67 | 7.4%) represent the smallest median family size with 2.21 persons per family.
| Family Type | # Families | Family Size |
| Married-Couple | 687 (75.7%) | 2.97 |
| Single Male/Father | 67 (7.4%) | 2.21 |
| Single Female/Mother | 153 (16.9%) | 2.69 |
| Total Families | 907 (100.0%) | 2.86 |
Median Household Size in Milford
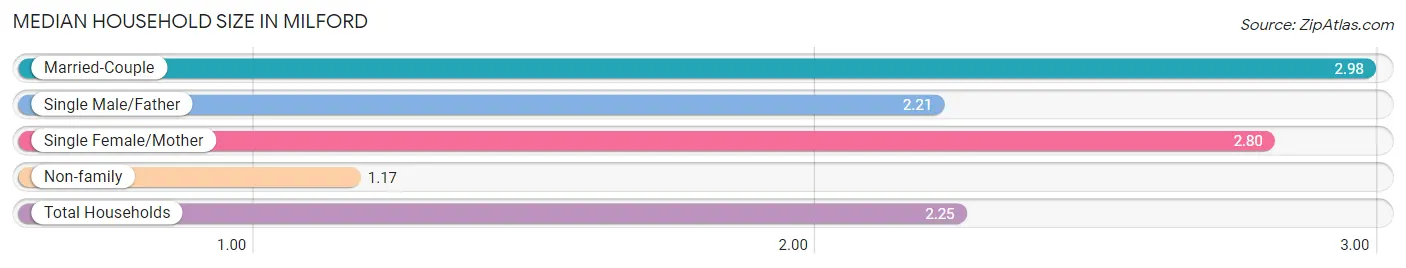
The median household size in Milford is 2.25 persons per household, with married-couple households (687 | 47.7%) accounting for the largest median household size of 2.98 persons per household. non-family households (534 | 37.1%) represent the smallest median household size with 1.17 persons per household.
| Household Type | # Households | Household Size |
| Married-Couple | 687 (47.7%) | 2.98 |
| Single Male/Father | 67 (4.6%) | 2.21 |
| Single Female/Mother | 153 (10.6%) | 2.80 |
| Non-family | 534 (37.1%) | 1.17 |
| Total Households | 1,441 (100.0%) | 2.25 |
Household Size by Marriage Status in Milford
Out of a total of 1,441 households in Milford, 907 (62.9%) are family households, while 534 (37.1%) are nonfamily households. The most numerous type of family households are 2-person households, comprising 494, and the most common type of nonfamily households are 1-person households, comprising 467.
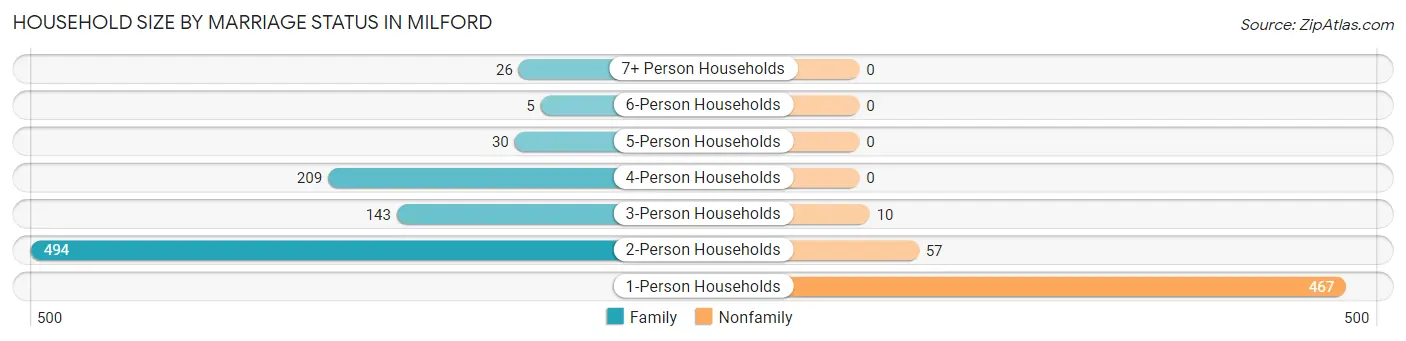
| Household Size | Family Households | Nonfamily Households |
| 1-Person Households | - | 467 (32.4%) |
| 2-Person Households | 494 (34.3%) | 57 (4.0%) |
| 3-Person Households | 143 (9.9%) | 10 (0.7%) |
| 4-Person Households | 209 (14.5%) | 0 (0.0%) |
| 5-Person Households | 30 (2.1%) | 0 (0.0%) |
| 6-Person Households | 5 (0.4%) | 0 (0.0%) |
| 7+ Person Households | 26 (1.8%) | 0 (0.0%) |
| Total | 907 (62.9%) | 534 (37.1%) |
Female Fertility in Milford
Fertility by Age in Milford
Average fertility rate in Milford is 27.0 births per 1,000 women. Women in the age bracket of 20 to 34 years have the highest fertility rate with 52.0 births per 1,000 women. Women in the age bracket of 20 to 34 years acount for 52.9% of all women with births.
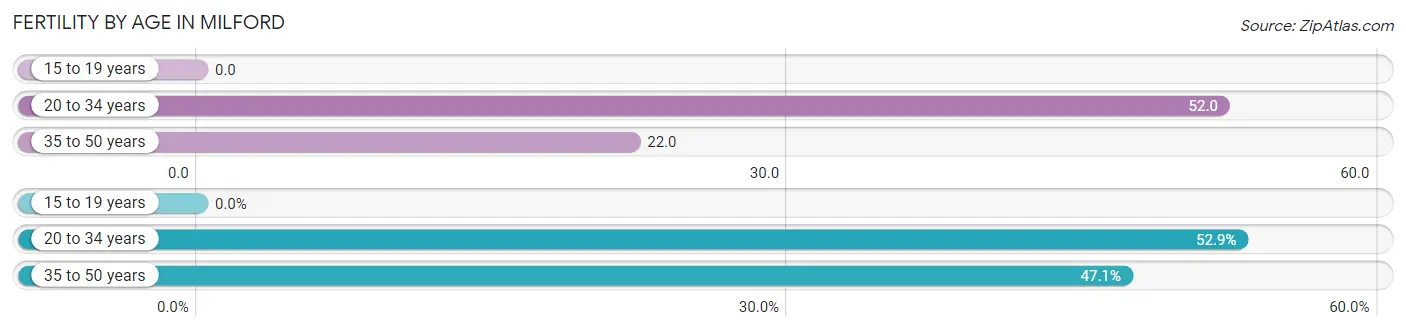
| Age Bracket | Women with Births | Births / 1,000 Women |
| 15 to 19 years | 0 (0.0%) | 0.0 |
| 20 to 34 years | 9 (52.9%) | 52.0 |
| 35 to 50 years | 8 (47.1%) | 22.0 |
| Total | 17 (100.0%) | 27.0 |
Fertility by Age by Marriage Status in Milford
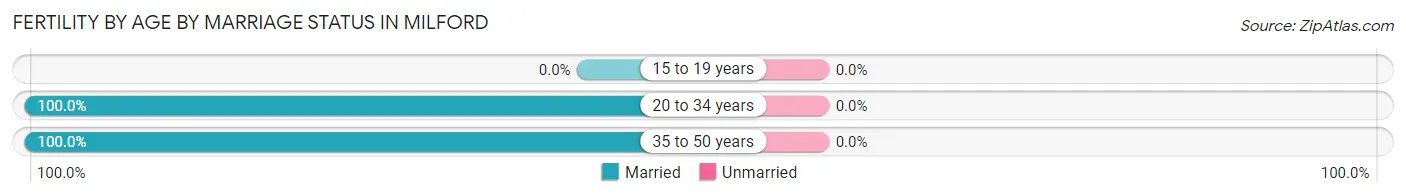
| Age Bracket | Married | Unmarried |
| 15 to 19 years | 0 (0.0%) | 0 (0.0%) |
| 20 to 34 years | 9 (100.0%) | 0 (0.0%) |
| 35 to 50 years | 8 (100.0%) | 0 (0.0%) |
| Total | 17 (100.0%) | 0 (0.0%) |
Fertility by Education in Milford
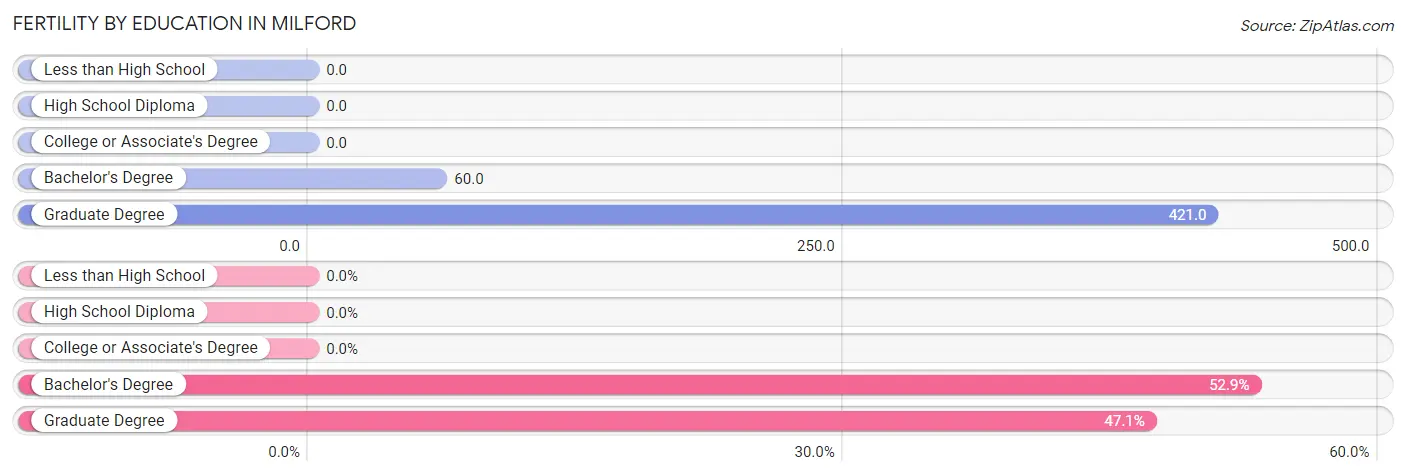
| Educational Attainment | Women with Births | Births / 1,000 Women |
| Less than High School | 0 (0.0%) | 0.0 |
| High School Diploma | 0 (0.0%) | 0.0 |
| College or Associate's Degree | 0 (0.0%) | 0.0 |
| Bachelor's Degree | 9 (52.9%) | 60.0 |
| Graduate Degree | 8 (47.1%) | 421.0 |
| Total | 17 (100.0%) | 27.0 |
Fertility by Education by Marriage Status in Milford
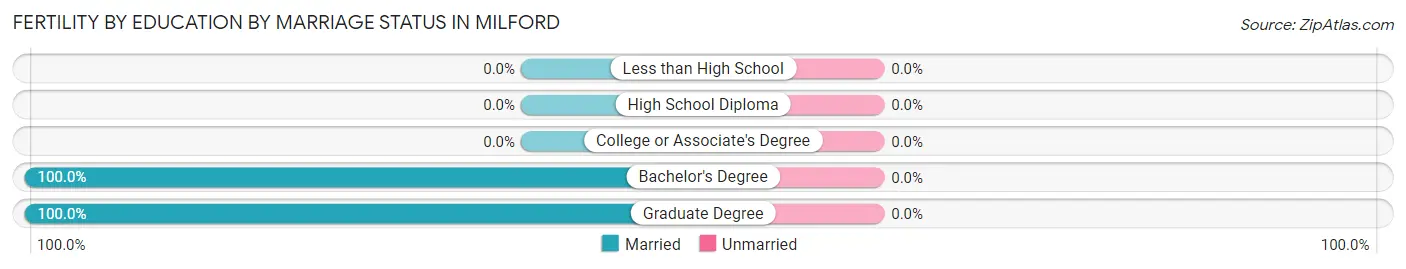
| Educational Attainment | Married | Unmarried |
| Less than High School | 0 (0.0%) | 0 (0.0%) |
| High School Diploma | 0 (0.0%) | 0 (0.0%) |
| College or Associate's Degree | 0 (0.0%) | 0 (0.0%) |
| Bachelor's Degree | 9 (100.0%) | 0 (0.0%) |
| Graduate Degree | 8 (100.0%) | 0 (0.0%) |
| Total | 17 (100.0%) | 0 (0.0%) |
Employment Characteristics in Milford
Employment by Class of Employer in Milford
Among the 1,643 employed individuals in Milford, private company employees (1,053 | 64.1%), self-employed (not incorporated) (273 | 16.6%), and not-for-profit organizations (159 | 9.7%) make up the most common classes of employment.
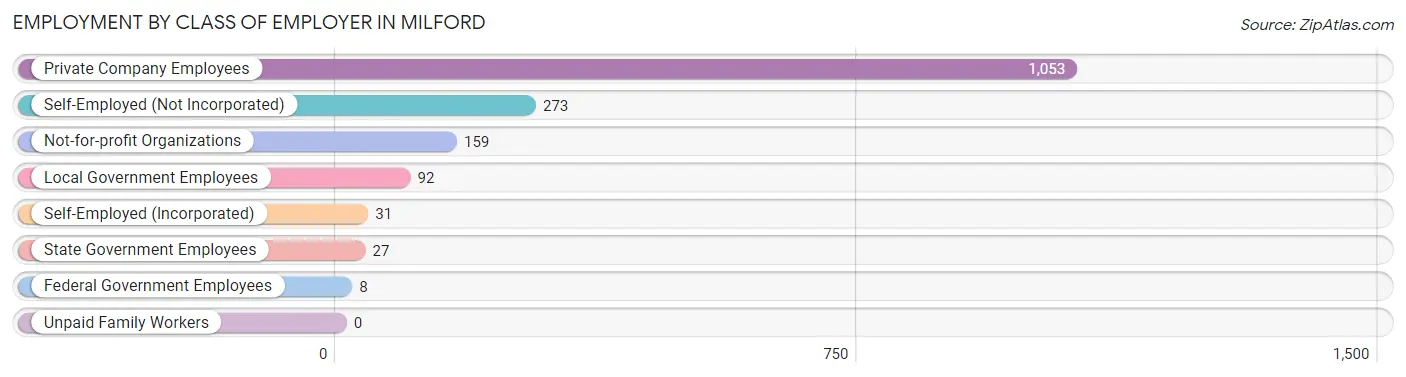
| Employer Class | # Employees | % Employees |
| Private Company Employees | 1,053 | 64.1% |
| Self-Employed (Incorporated) | 31 | 1.9% |
| Self-Employed (Not Incorporated) | 273 | 16.6% |
| Not-for-profit Organizations | 159 | 9.7% |
| Local Government Employees | 92 | 5.6% |
| State Government Employees | 27 | 1.6% |
| Federal Government Employees | 8 | 0.5% |
| Unpaid Family Workers | 0 | 0.0% |
| Total | 1,643 | 100.0% |
Employment Status by Age in Milford
According to the labor force statistics for Milford, out of the total population over 16 years of age (2,635), 65.5% or 1,726 individuals are in the labor force, with 3.4% or 59 of them unemployed. The age group with the highest labor force participation rate is 30 to 34 years, with 100.0% or 153 individuals in the labor force. Within the labor force, the 55 to 59 years age range has the highest percentage of unemployed individuals, with 16.2% or 21 of them being unemployed.
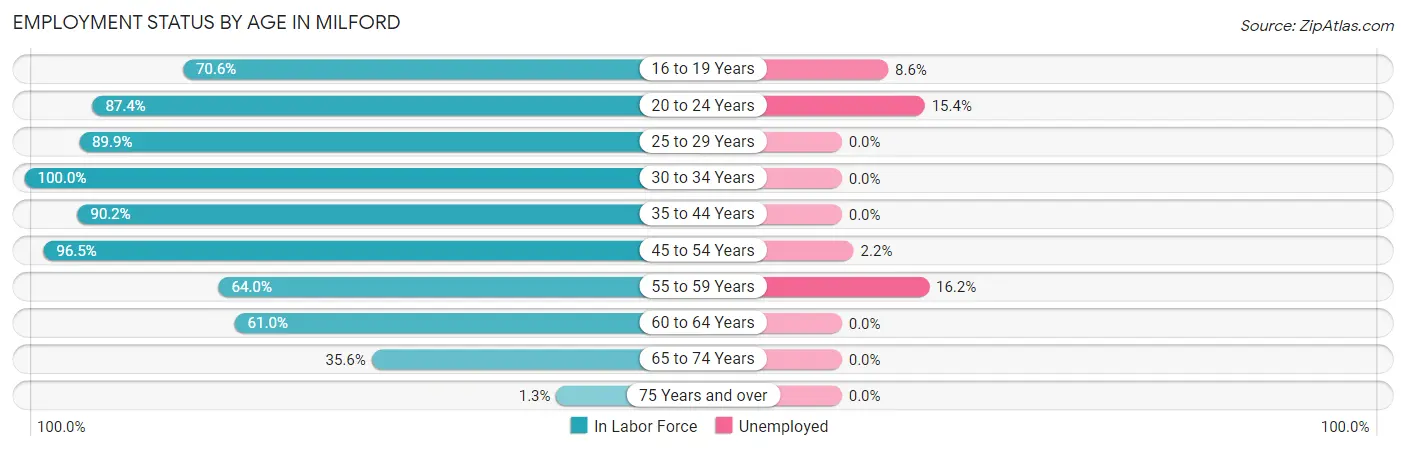
| Age Bracket | In Labor Force | Unemployed |
| 16 to 19 Years | 151 (70.6%) | 13 (8.6%) |
| 20 to 24 Years | 104 (87.4%) | 16 (15.4%) |
| 25 to 29 Years | 187 (89.9%) | 0 (0.0%) |
| 30 to 34 Years | 153 (100.0%) | 0 (0.0%) |
| 35 to 44 Years | 294 (90.2%) | 0 (0.0%) |
| 45 to 54 Years | 412 (96.5%) | 9 (2.2%) |
| 55 to 59 Years | 130 (64.0%) | 21 (16.2%) |
| 60 to 64 Years | 114 (61.0%) | 0 (0.0%) |
| 65 to 74 Years | 178 (35.6%) | 0 (0.0%) |
| 75 Years and over | 4 (1.3%) | 0 (0.0%) |
| Total | 1,726 (65.5%) | 59 (3.4%) |
Employment Status by Educational Attainment in Milford
According to labor force statistics for Milford, 85.8% of individuals (1,290) out of the total population between 25 and 64 years of age (1,504) are in the labor force, with 2.3% or 30 of them being unemployed. The group with the highest labor force participation rate are those with the educational attainment of bachelor's degree or higher, with 98.2% or 426 individuals in the labor force. Within the labor force, individuals with high school diploma education have the highest percentage of unemployment, with 6.3% or 21 of them being unemployed.
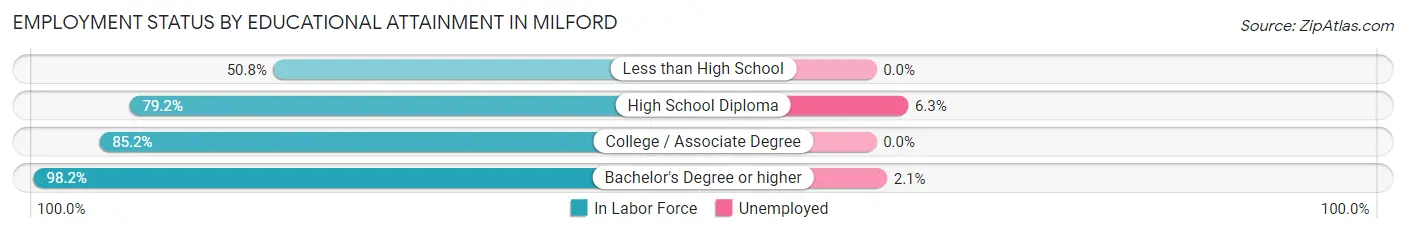
| Educational Attainment | In Labor Force | Unemployed |
| Less than High School | 33 (50.8%) | 0 (0.0%) |
| High School Diploma | 332 (79.2%) | 26 (6.3%) |
| College / Associate Degree | 499 (85.2%) | 0 (0.0%) |
| Bachelor's Degree or higher | 426 (98.2%) | 9 (2.1%) |
| Total | 1,290 (85.8%) | 35 (2.3%) |
Employment Occupations by Sex in Milford
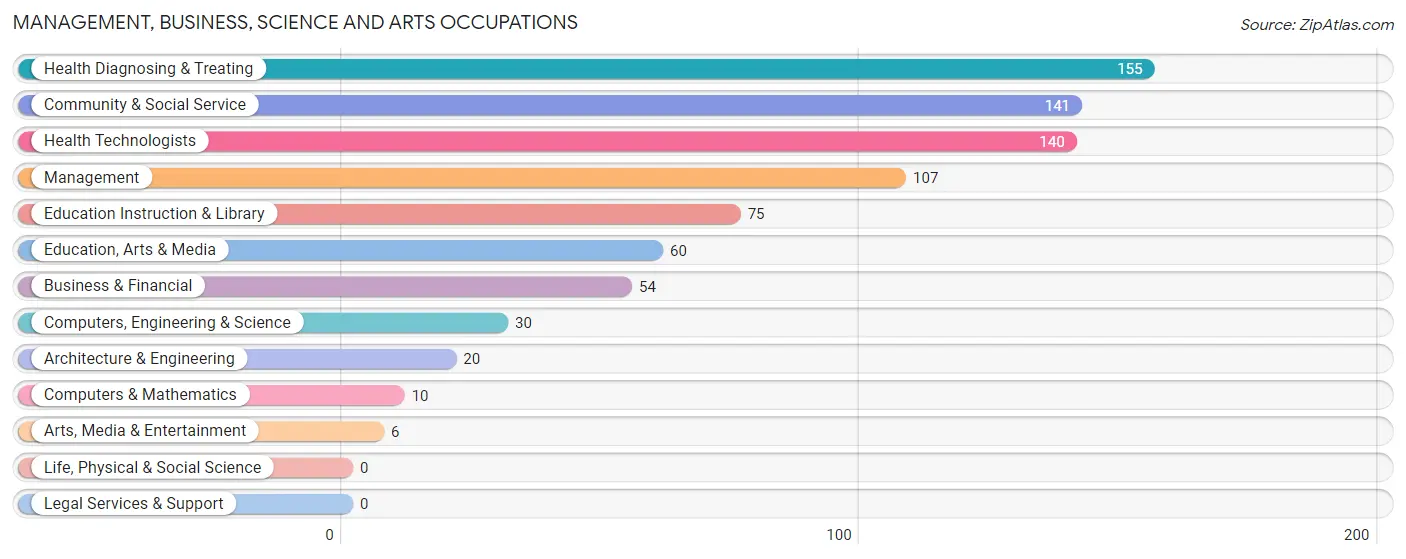
Management, Business, Science and Arts Occupations
The most common Management, Business, Science and Arts occupations in Milford are Health Diagnosing & Treating (155 | 9.3%), Community & Social Service (141 | 8.5%), Health Technologists (140 | 8.4%), Management (107 | 6.4%), and Education Instruction & Library (75 | 4.5%).
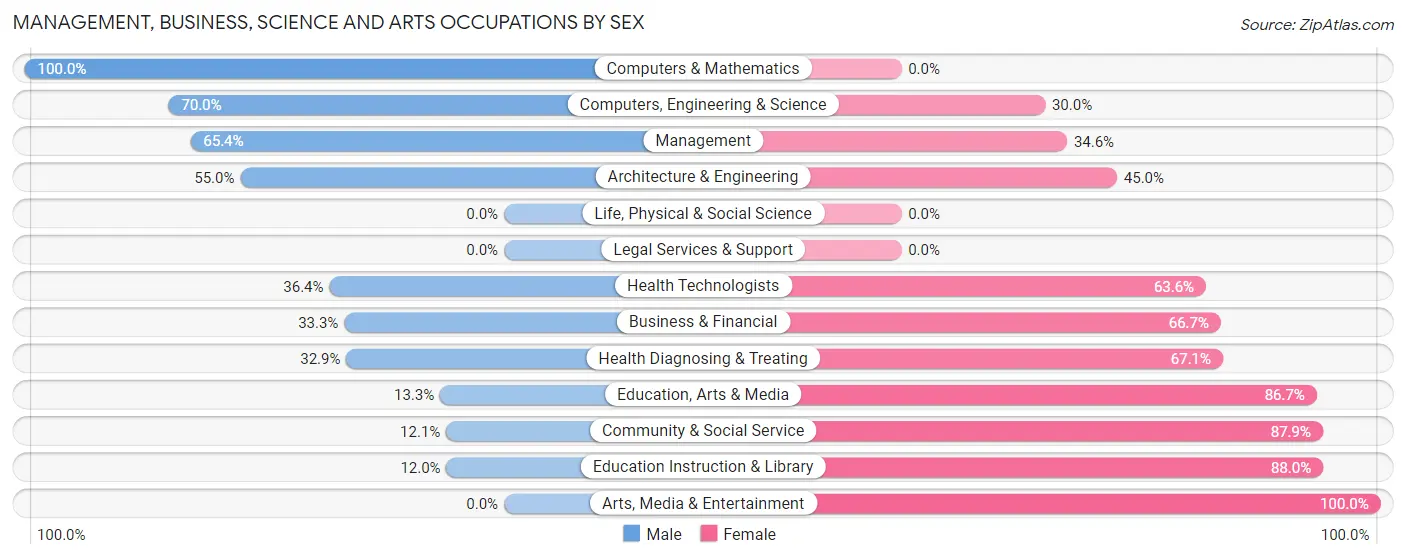
Management, Business, Science and Arts Occupations by Sex
Within the Management, Business, Science and Arts occupations in Milford, the most male-oriented occupations are Computers & Mathematics (100.0%), Computers, Engineering & Science (70.0%), and Management (65.4%), while the most female-oriented occupations are Arts, Media & Entertainment (100.0%), Education Instruction & Library (88.0%), and Community & Social Service (87.9%).
| Occupation | Male | Female |
| Management | 70 (65.4%) | 37 (34.6%) |
| Business & Financial | 18 (33.3%) | 36 (66.7%) |
| Computers, Engineering & Science | 21 (70.0%) | 9 (30.0%) |
| Computers & Mathematics | 10 (100.0%) | 0 (0.0%) |
| Architecture & Engineering | 11 (55.0%) | 9 (45.0%) |
| Life, Physical & Social Science | 0 (0.0%) | 0 (0.0%) |
| Community & Social Service | 17 (12.1%) | 124 (87.9%) |
| Education, Arts & Media | 8 (13.3%) | 52 (86.7%) |
| Legal Services & Support | 0 (0.0%) | 0 (0.0%) |
| Education Instruction & Library | 9 (12.0%) | 66 (88.0%) |
| Arts, Media & Entertainment | 0 (0.0%) | 6 (100.0%) |
| Health Diagnosing & Treating | 51 (32.9%) | 104 (67.1%) |
| Health Technologists | 51 (36.4%) | 89 (63.6%) |
| Total (Category) | 177 (36.3%) | 310 (63.7%) |
| Total (Overall) | 922 (55.3%) | 746 (44.7%) |
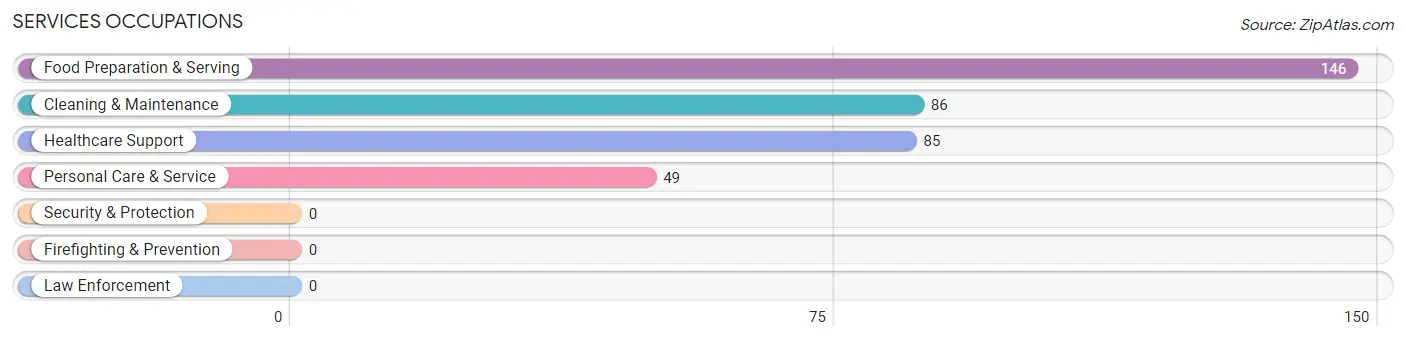
Services Occupations
The most common Services occupations in Milford are Food Preparation & Serving (146 | 8.7%), Cleaning & Maintenance (86 | 5.2%), Healthcare Support (85 | 5.1%), and Personal Care & Service (49 | 2.9%).
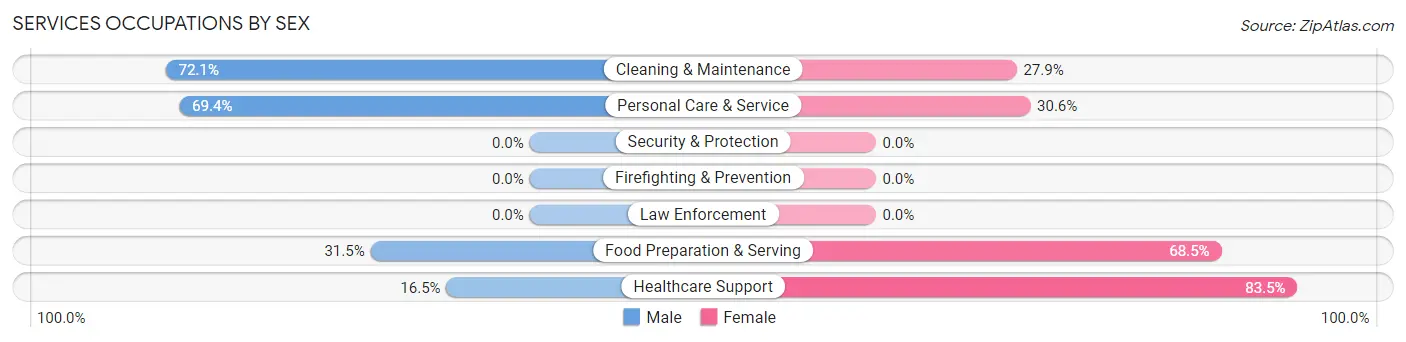
Services Occupations by Sex
Within the Services occupations in Milford, the most male-oriented occupations are Cleaning & Maintenance (72.1%), Personal Care & Service (69.4%), and Food Preparation & Serving (31.5%), while the most female-oriented occupations are Healthcare Support (83.5%), Food Preparation & Serving (68.5%), and Personal Care & Service (30.6%).
| Occupation | Male | Female |
| Healthcare Support | 14 (16.5%) | 71 (83.5%) |
| Security & Protection | 0 (0.0%) | 0 (0.0%) |
| Firefighting & Prevention | 0 (0.0%) | 0 (0.0%) |
| Law Enforcement | 0 (0.0%) | 0 (0.0%) |
| Food Preparation & Serving | 46 (31.5%) | 100 (68.5%) |
| Cleaning & Maintenance | 62 (72.1%) | 24 (27.9%) |
| Personal Care & Service | 34 (69.4%) | 15 (30.6%) |
| Total (Category) | 156 (42.6%) | 210 (57.4%) |
| Total (Overall) | 922 (55.3%) | 746 (44.7%) |
Sales and Office Occupations
The most common Sales and Office occupations in Milford are Sales & Related (315 | 18.9%), and Office & Administration (121 | 7.2%).
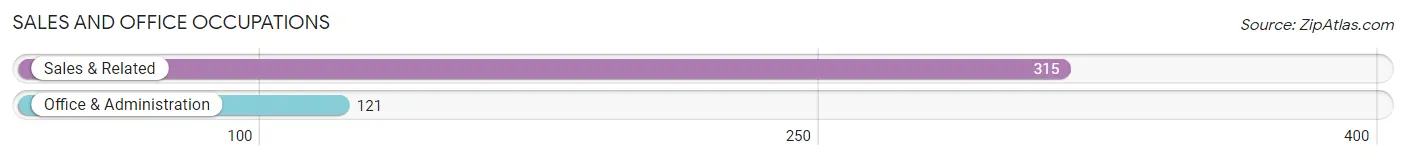
Sales and Office Occupations by Sex
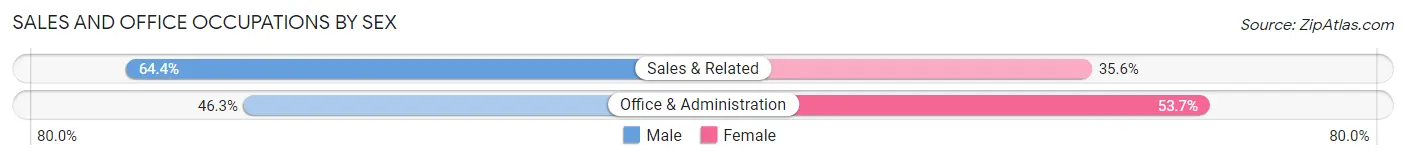
| Occupation | Male | Female |
| Sales & Related | 203 (64.4%) | 112 (35.6%) |
| Office & Administration | 56 (46.3%) | 65 (53.7%) |
| Total (Category) | 259 (59.4%) | 177 (40.6%) |
| Total (Overall) | 922 (55.3%) | 746 (44.7%) |
Natural Resources, Construction and Maintenance Occupations
The most common Natural Resources, Construction and Maintenance occupations in Milford are Construction & Extraction (70 | 4.2%), and Installation, Maintenance & Repair (52 | 3.1%).
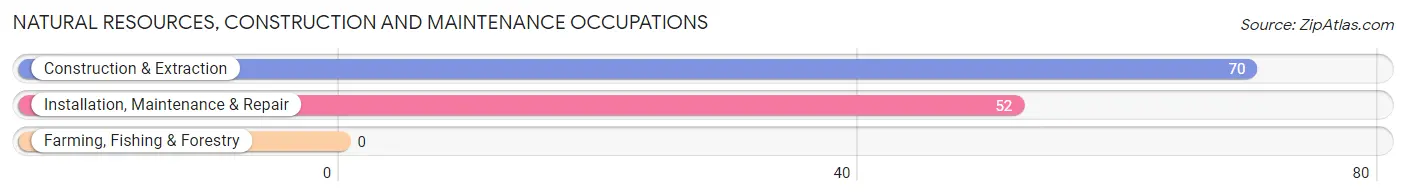
Natural Resources, Construction and Maintenance Occupations by Sex
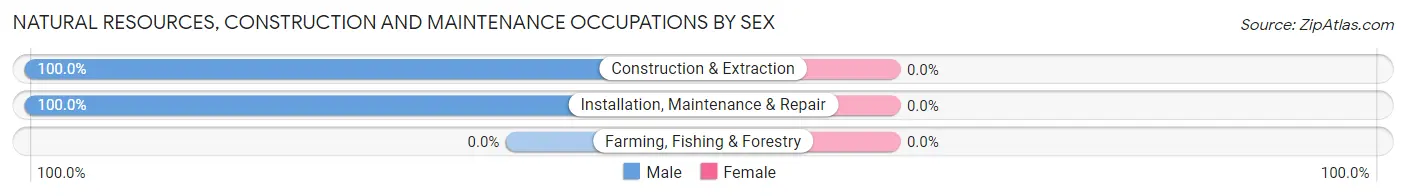
| Occupation | Male | Female |
| Farming, Fishing & Forestry | 0 (0.0%) | 0 (0.0%) |
| Construction & Extraction | 70 (100.0%) | 0 (0.0%) |
| Installation, Maintenance & Repair | 52 (100.0%) | 0 (0.0%) |
| Total (Category) | 122 (100.0%) | 0 (0.0%) |
| Total (Overall) | 922 (55.3%) | 746 (44.7%) |
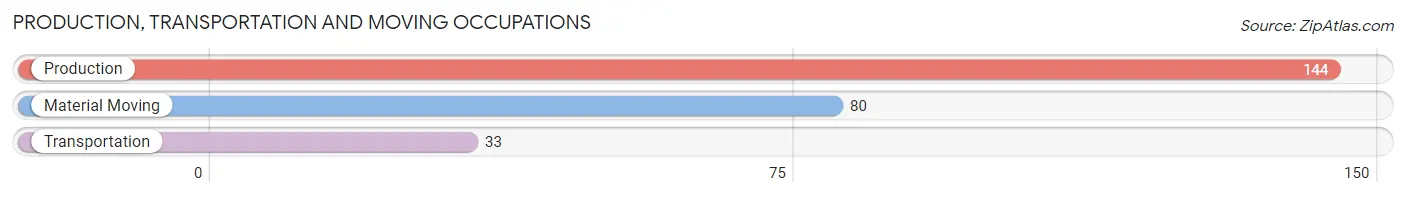
Production, Transportation and Moving Occupations
The most common Production, Transportation and Moving occupations in Milford are Production (144 | 8.6%), Material Moving (80 | 4.8%), and Transportation (33 | 2.0%).
Production, Transportation and Moving Occupations by Sex
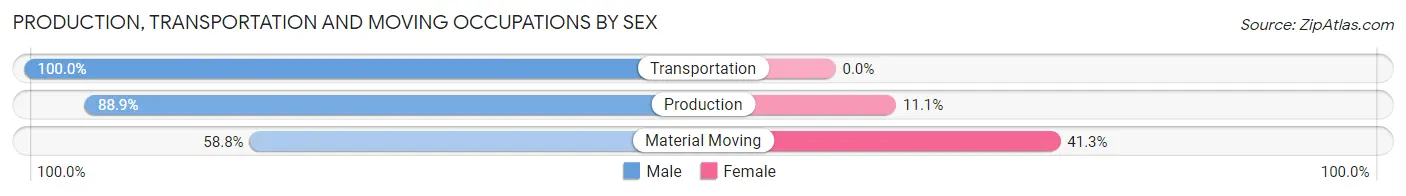
| Occupation | Male | Female |
| Production | 128 (88.9%) | 16 (11.1%) |
| Transportation | 33 (100.0%) | 0 (0.0%) |
| Material Moving | 47 (58.8%) | 33 (41.2%) |
| Total (Category) | 208 (80.9%) | 49 (19.1%) |
| Total (Overall) | 922 (55.3%) | 746 (44.7%) |
Employment Industries by Sex in Milford
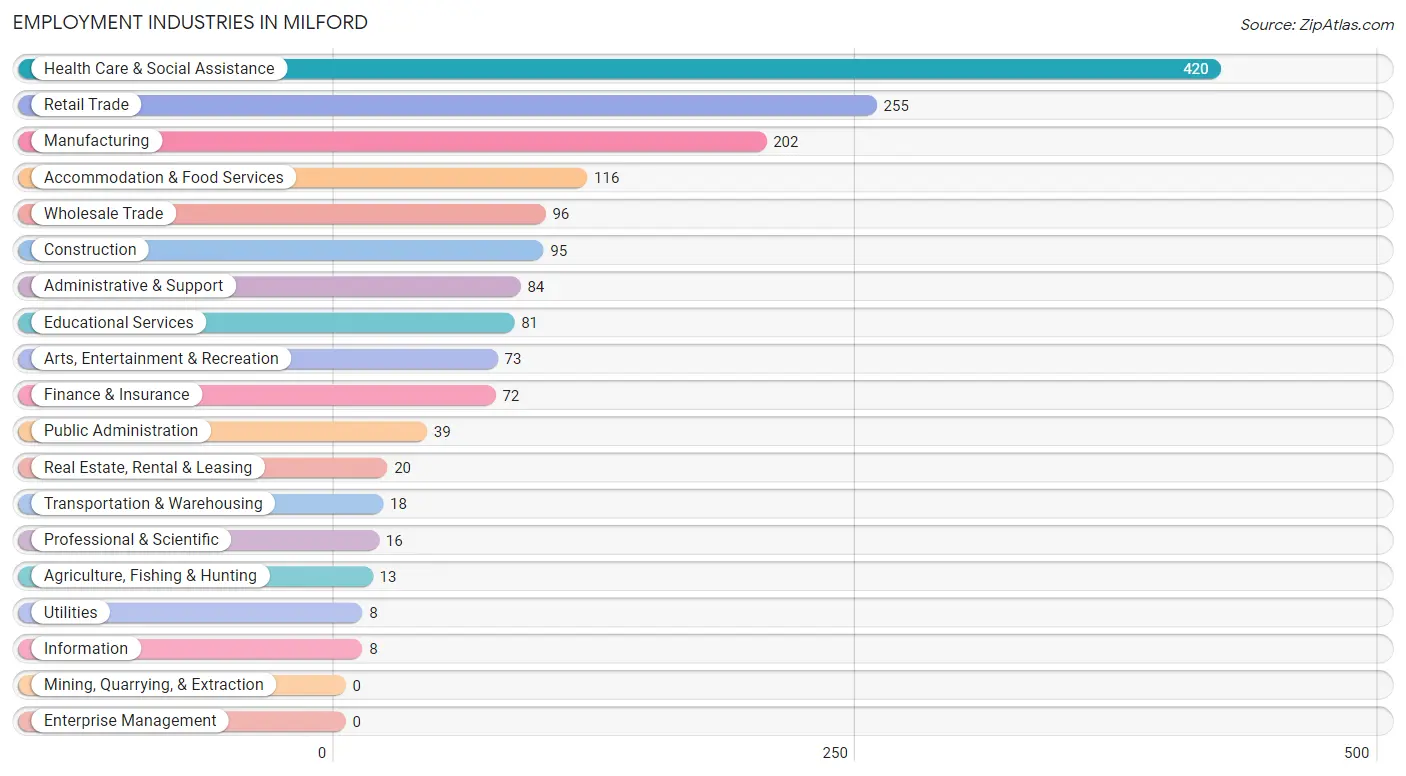
Employment Industries in Milford
The major employment industries in Milford include Health Care & Social Assistance (420 | 25.2%), Retail Trade (255 | 15.3%), Manufacturing (202 | 12.1%), Accommodation & Food Services (116 | 7.0%), and Wholesale Trade (96 | 5.8%).
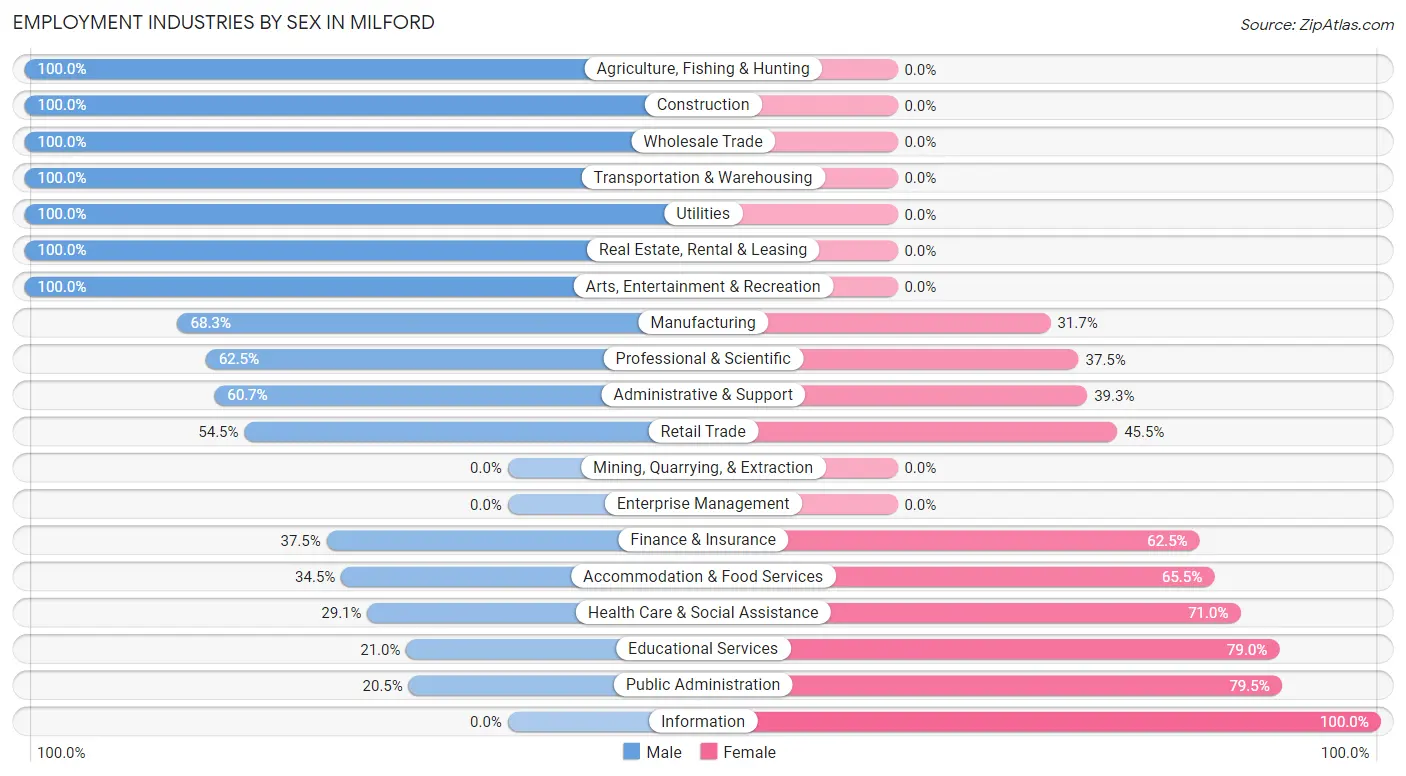
Employment Industries by Sex in Milford
The Milford industries that see more men than women are Agriculture, Fishing & Hunting (100.0%), Construction (100.0%), and Wholesale Trade (100.0%), whereas the industries that tend to have a higher number of women are Information (100.0%), Public Administration (79.5%), and Educational Services (79.0%).
| Industry | Male | Female |
| Agriculture, Fishing & Hunting | 13 (100.0%) | 0 (0.0%) |
| Mining, Quarrying, & Extraction | 0 (0.0%) | 0 (0.0%) |
| Construction | 95 (100.0%) | 0 (0.0%) |
| Manufacturing | 138 (68.3%) | 64 (31.7%) |
| Wholesale Trade | 96 (100.0%) | 0 (0.0%) |
| Retail Trade | 139 (54.5%) | 116 (45.5%) |
| Transportation & Warehousing | 18 (100.0%) | 0 (0.0%) |
| Utilities | 8 (100.0%) | 0 (0.0%) |
| Information | 0 (0.0%) | 8 (100.0%) |
| Finance & Insurance | 27 (37.5%) | 45 (62.5%) |
| Real Estate, Rental & Leasing | 20 (100.0%) | 0 (0.0%) |
| Professional & Scientific | 10 (62.5%) | 6 (37.5%) |
| Enterprise Management | 0 (0.0%) | 0 (0.0%) |
| Administrative & Support | 51 (60.7%) | 33 (39.3%) |
| Educational Services | 17 (21.0%) | 64 (79.0%) |
| Health Care & Social Assistance | 122 (29.0%) | 298 (71.0%) |
| Arts, Entertainment & Recreation | 73 (100.0%) | 0 (0.0%) |
| Accommodation & Food Services | 40 (34.5%) | 76 (65.5%) |
| Public Administration | 8 (20.5%) | 31 (79.5%) |
| Total | 922 (55.3%) | 746 (44.7%) |
Education in Milford
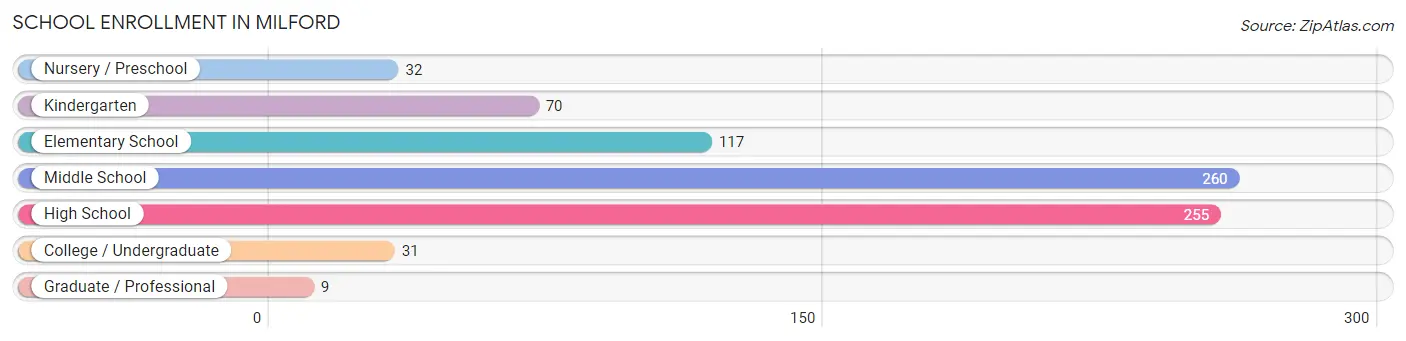
School Enrollment in Milford
The most common levels of schooling among the 774 students in Milford are middle school (260 | 33.6%), high school (255 | 33.0%), and elementary school (117 | 15.1%).
| School Level | # Students | % Students |
| Nursery / Preschool | 32 | 4.1% |
| Kindergarten | 70 | 9.0% |
| Elementary School | 117 | 15.1% |
| Middle School | 260 | 33.6% |
| High School | 255 | 33.0% |
| College / Undergraduate | 31 | 4.0% |
| Graduate / Professional | 9 | 1.2% |
| Total | 774 | 100.0% |
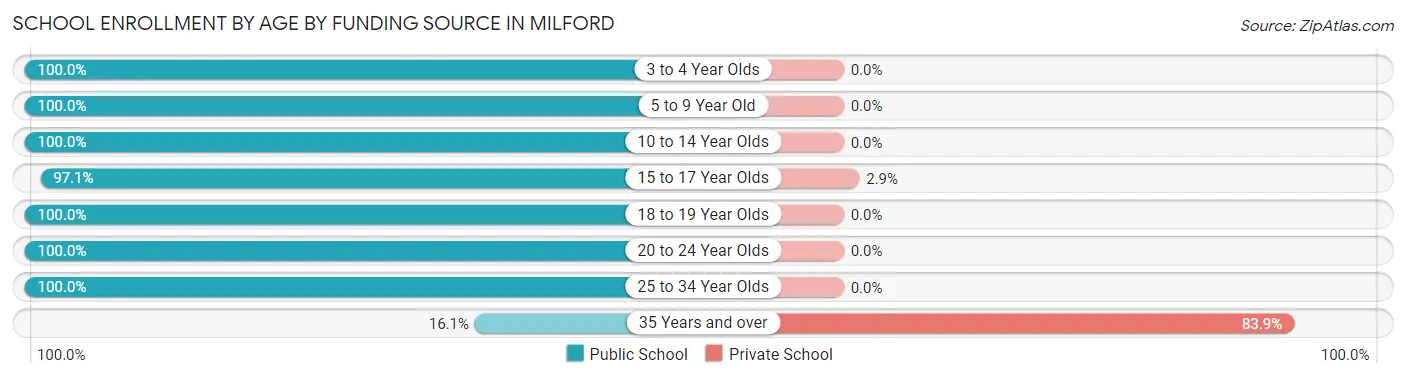
School Enrollment by Age by Funding Source in Milford
Out of a total of 774 students who are enrolled in schools in Milford, 32 (4.1%) attend a private institution, while the remaining 742 (95.9%) are enrolled in public schools. The age group of 35 years and over has the highest likelihood of being enrolled in private schools, with 26 (83.9% in the age bracket) enrolled. Conversely, the age group of 3 to 4 year olds has the lowest likelihood of being enrolled in a private school, with 32 (100.0% in the age bracket) attending a public institution.
| Age Bracket | Public School | Private School |
| 3 to 4 Year Olds | 32 (100.0%) | 0 (0.0%) |
| 5 to 9 Year Old | 176 (100.0%) | 0 (0.0%) |
| 10 to 14 Year Olds | 280 (100.0%) | 0 (0.0%) |
| 15 to 17 Year Olds | 200 (97.1%) | 6 (2.9%) |
| 18 to 19 Year Olds | 32 (100.0%) | 0 (0.0%) |
| 20 to 24 Year Olds | 10 (100.0%) | 0 (0.0%) |
| 25 to 34 Year Olds | 7 (100.0%) | 0 (0.0%) |
| 35 Years and over | 5 (16.1%) | 26 (83.9%) |
| Total | 742 (95.9%) | 32 (4.1%) |
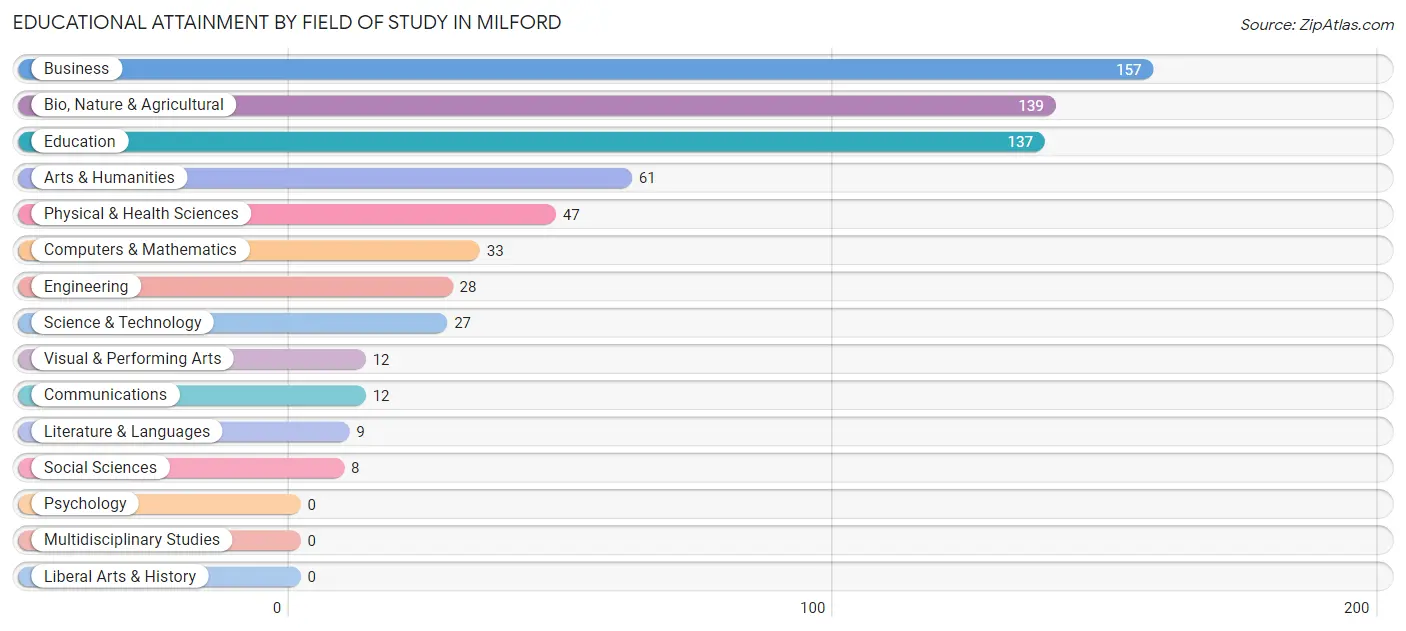
Educational Attainment by Field of Study in Milford
Business (157 | 23.4%), bio, nature & agricultural (139 | 20.7%), education (137 | 20.4%), arts & humanities (61 | 9.1%), and physical & health sciences (47 | 7.0%) are the most common fields of study among 670 individuals in Milford who have obtained a bachelor's degree or higher.
| Field of Study | # Graduates | % Graduates |
| Computers & Mathematics | 33 | 4.9% |
| Bio, Nature & Agricultural | 139 | 20.7% |
| Physical & Health Sciences | 47 | 7.0% |
| Psychology | 0 | 0.0% |
| Social Sciences | 8 | 1.2% |
| Engineering | 28 | 4.2% |
| Multidisciplinary Studies | 0 | 0.0% |
| Science & Technology | 27 | 4.0% |
| Business | 157 | 23.4% |
| Education | 137 | 20.4% |
| Literature & Languages | 9 | 1.3% |
| Liberal Arts & History | 0 | 0.0% |
| Visual & Performing Arts | 12 | 1.8% |
| Communications | 12 | 1.8% |
| Arts & Humanities | 61 | 9.1% |
| Total | 670 | 100.0% |
Transportation & Commute in Milford
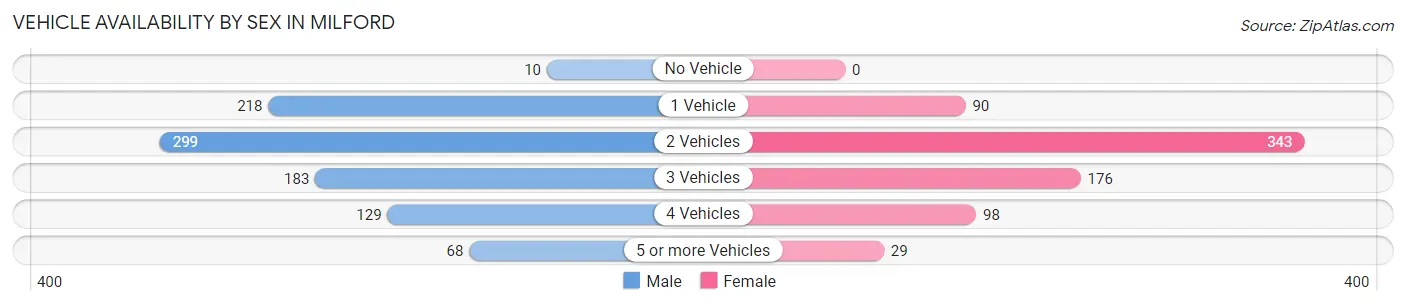
Vehicle Availability by Sex in Milford
The most prevalent vehicle ownership categories in Milford are males with 2 vehicles (299, accounting for 33.0%) and females with 2 vehicles (343, making up 40.6%).
| Vehicles Available | Male | Female |
| No Vehicle | 10 (1.1%) | 0 (0.0%) |
| 1 Vehicle | 218 (24.0%) | 90 (12.2%) |
| 2 Vehicles | 299 (33.0%) | 343 (46.6%) |
| 3 Vehicles | 183 (20.2%) | 176 (23.9%) |
| 4 Vehicles | 129 (14.2%) | 98 (13.3%) |
| 5 or more Vehicles | 68 (7.5%) | 29 (3.9%) |
| Total | 907 (100.0%) | 736 (100.0%) |
Commute Time in Milford
The most frequently occuring commute durations in Milford are 15 to 19 minutes (397 commuters, 24.9%), 5 to 9 minutes (320 commuters, 20.1%), and 20 to 24 minutes (226 commuters, 14.2%).
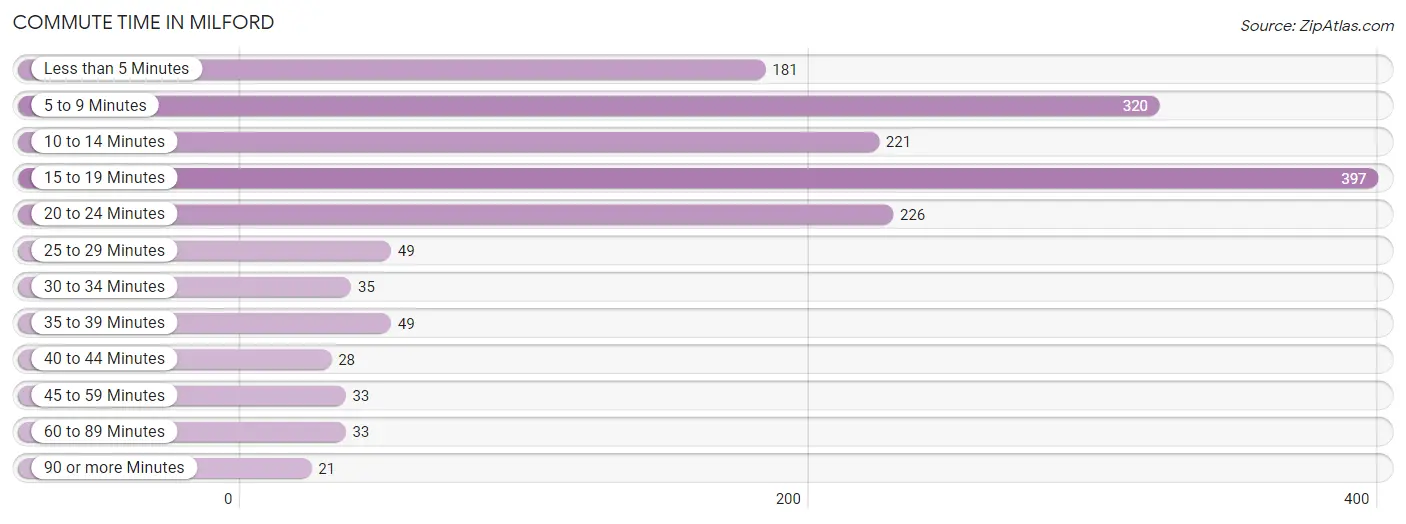
| Commute Time | # Commuters | % Commuters |
| Less than 5 Minutes | 181 | 11.4% |
| 5 to 9 Minutes | 320 | 20.1% |
| 10 to 14 Minutes | 221 | 13.9% |
| 15 to 19 Minutes | 397 | 24.9% |
| 20 to 24 Minutes | 226 | 14.2% |
| 25 to 29 Minutes | 49 | 3.1% |
| 30 to 34 Minutes | 35 | 2.2% |
| 35 to 39 Minutes | 49 | 3.1% |
| 40 to 44 Minutes | 28 | 1.8% |
| 45 to 59 Minutes | 33 | 2.1% |
| 60 to 89 Minutes | 33 | 2.1% |
| 90 or more Minutes | 21 | 1.3% |
Commute Time by Sex in Milford
The most common commute times in Milford are 15 to 19 minutes (237 commuters, 27.1%) for males and 5 to 9 minutes (167 commuters, 23.2%) for females.
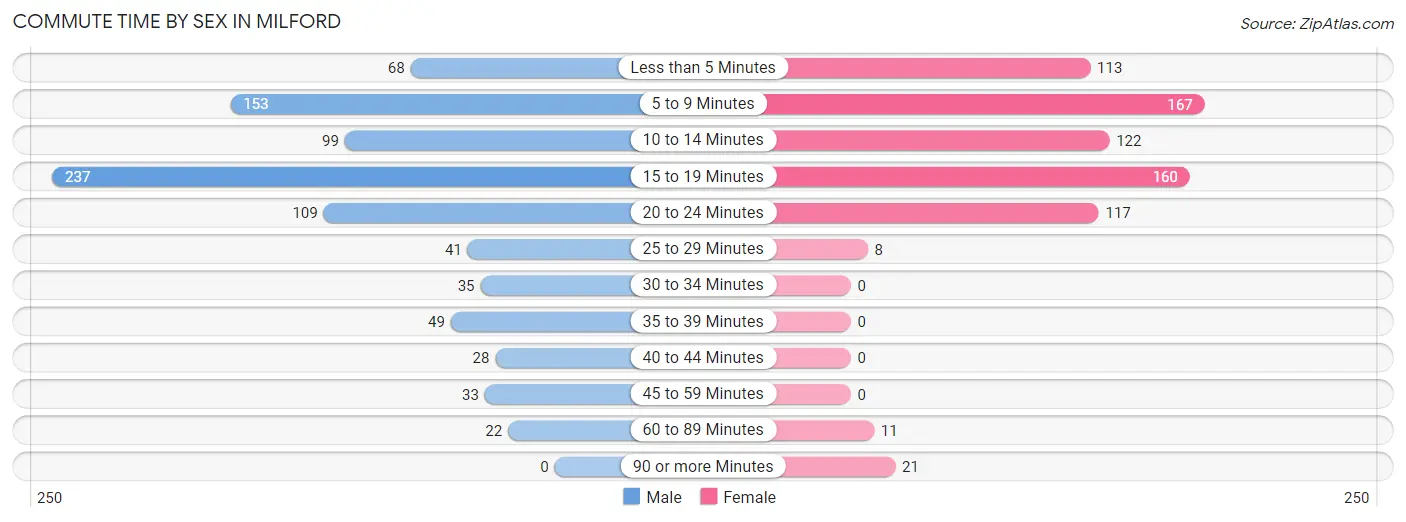
| Commute Time | Male | Female |
| Less than 5 Minutes | 68 (7.8%) | 113 (15.7%) |
| 5 to 9 Minutes | 153 (17.5%) | 167 (23.2%) |
| 10 to 14 Minutes | 99 (11.3%) | 122 (17.0%) |
| 15 to 19 Minutes | 237 (27.1%) | 160 (22.3%) |
| 20 to 24 Minutes | 109 (12.5%) | 117 (16.3%) |
| 25 to 29 Minutes | 41 (4.7%) | 8 (1.1%) |
| 30 to 34 Minutes | 35 (4.0%) | 0 (0.0%) |
| 35 to 39 Minutes | 49 (5.6%) | 0 (0.0%) |
| 40 to 44 Minutes | 28 (3.2%) | 0 (0.0%) |
| 45 to 59 Minutes | 33 (3.8%) | 0 (0.0%) |
| 60 to 89 Minutes | 22 (2.5%) | 11 (1.5%) |
| 90 or more Minutes | 0 (0.0%) | 21 (2.9%) |
Time of Departure to Work by Sex in Milford
The most frequent times of departure to work in Milford are 7:30 AM to 7:59 AM (252, 28.8%) for males and 7:30 AM to 7:59 AM (200, 27.8%) for females.
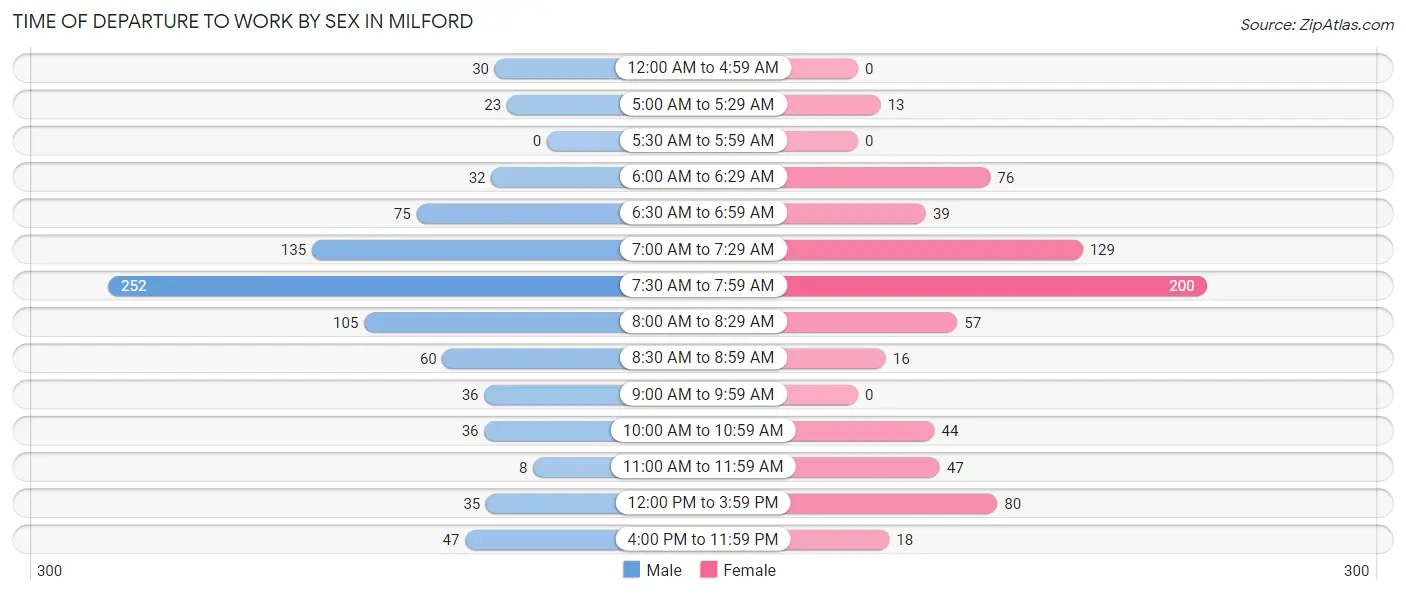
| Time of Departure | Male | Female |
| 12:00 AM to 4:59 AM | 30 (3.4%) | 0 (0.0%) |
| 5:00 AM to 5:29 AM | 23 (2.6%) | 13 (1.8%) |
| 5:30 AM to 5:59 AM | 0 (0.0%) | 0 (0.0%) |
| 6:00 AM to 6:29 AM | 32 (3.7%) | 76 (10.6%) |
| 6:30 AM to 6:59 AM | 75 (8.6%) | 39 (5.4%) |
| 7:00 AM to 7:29 AM | 135 (15.4%) | 129 (17.9%) |
| 7:30 AM to 7:59 AM | 252 (28.8%) | 200 (27.8%) |
| 8:00 AM to 8:29 AM | 105 (12.0%) | 57 (7.9%) |
| 8:30 AM to 8:59 AM | 60 (6.9%) | 16 (2.2%) |
| 9:00 AM to 9:59 AM | 36 (4.1%) | 0 (0.0%) |
| 10:00 AM to 10:59 AM | 36 (4.1%) | 44 (6.1%) |
| 11:00 AM to 11:59 AM | 8 (0.9%) | 47 (6.5%) |
| 12:00 PM to 3:59 PM | 35 (4.0%) | 80 (11.1%) |
| 4:00 PM to 11:59 PM | 47 (5.4%) | 18 (2.5%) |
| Total | 874 (100.0%) | 719 (100.0%) |
Housing Occupancy in Milford
Occupancy by Ownership in Milford
Of the total 1,441 dwellings in Milford, owner-occupied units account for 1,066 (74.0%), while renter-occupied units make up 375 (26.0%).
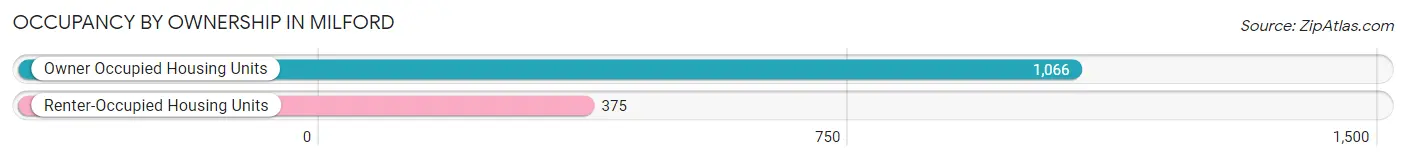
| Occupancy | # Housing Units | % Housing Units |
| Owner Occupied Housing Units | 1,066 | 74.0% |
| Renter-Occupied Housing Units | 375 | 26.0% |
| Total Occupied Housing Units | 1,441 | 100.0% |
Occupancy by Household Size in Milford
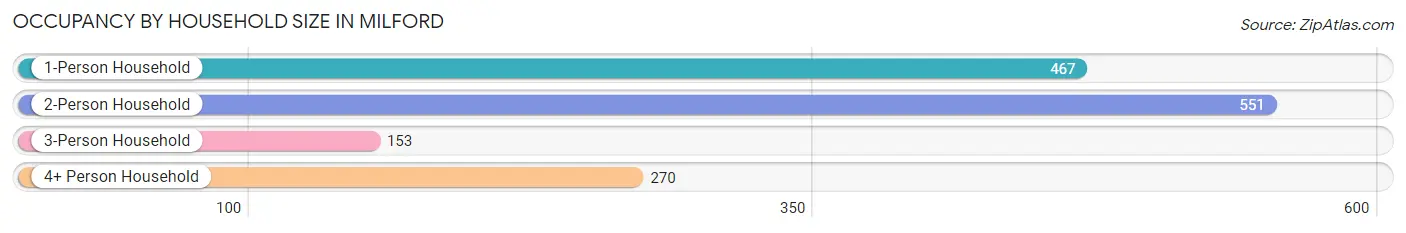
| Household Size | # Housing Units | % Housing Units |
| 1-Person Household | 467 | 32.4% |
| 2-Person Household | 551 | 38.2% |
| 3-Person Household | 153 | 10.6% |
| 4+ Person Household | 270 | 18.7% |
| Total Housing Units | 1,441 | 100.0% |
Occupancy by Ownership by Household Size in Milford
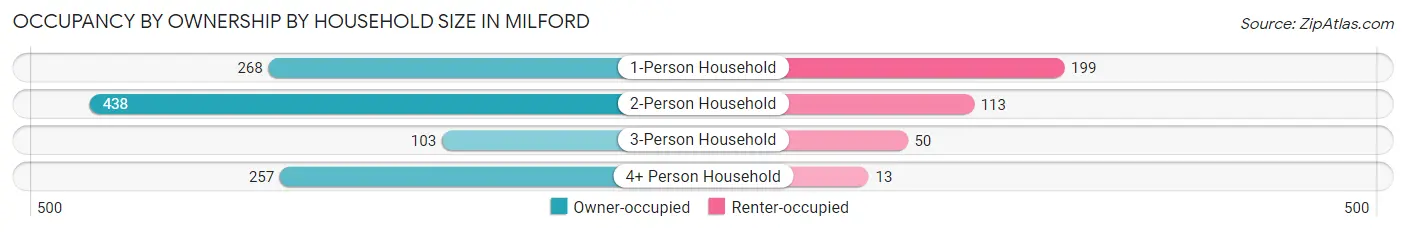
| Household Size | Owner-occupied | Renter-occupied |
| 1-Person Household | 268 (57.4%) | 199 (42.6%) |
| 2-Person Household | 438 (79.5%) | 113 (20.5%) |
| 3-Person Household | 103 (67.3%) | 50 (32.7%) |
| 4+ Person Household | 257 (95.2%) | 13 (4.8%) |
| Total Housing Units | 1,066 (74.0%) | 375 (26.0%) |
Occupancy by Educational Attainment in Milford
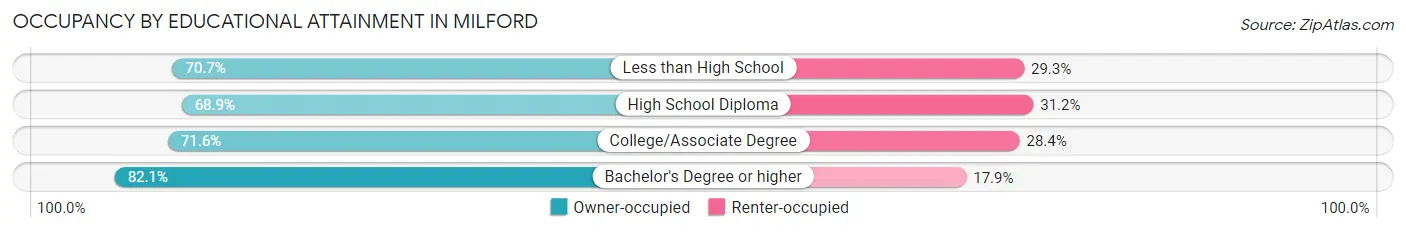
| Household Size | Owner-occupied | Renter-occupied |
| Less than High School | 41 (70.7%) | 17 (29.3%) |
| High School Diploma | 263 (68.9%) | 119 (31.1%) |
| College/Associate Degree | 408 (71.6%) | 162 (28.4%) |
| Bachelor's Degree or higher | 354 (82.1%) | 77 (17.9%) |
Occupancy by Age of Householder in Milford
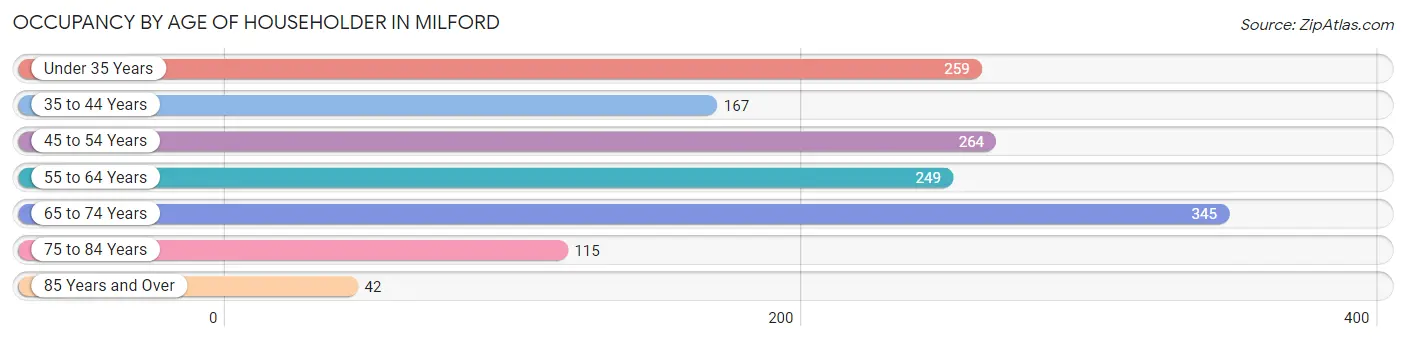
| Age Bracket | # Households | % Households |
| Under 35 Years | 259 | 18.0% |
| 35 to 44 Years | 167 | 11.6% |
| 45 to 54 Years | 264 | 18.3% |
| 55 to 64 Years | 249 | 17.3% |
| 65 to 74 Years | 345 | 23.9% |
| 75 to 84 Years | 115 | 8.0% |
| 85 Years and Over | 42 | 2.9% |
| Total | 1,441 | 100.0% |
Housing Finances in Milford
Median Income by Occupancy in Milford
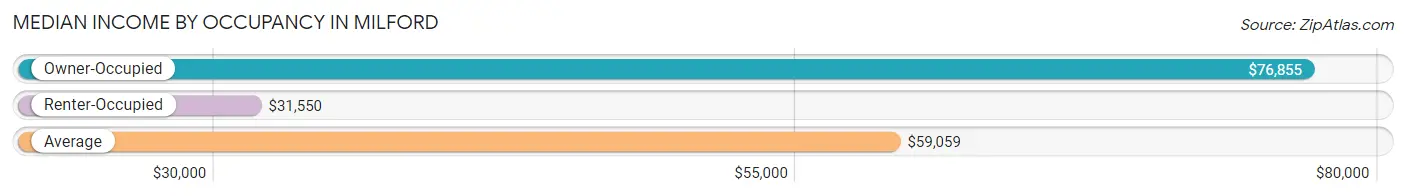
| Occupancy Type | # Households | Median Income |
| Owner-Occupied | 1,066 (74.0%) | $76,855 |
| Renter-Occupied | 375 (26.0%) | $31,550 |
| Average | 1,441 (100.0%) | $59,059 |
Occupancy by Householder Income Bracket in Milford
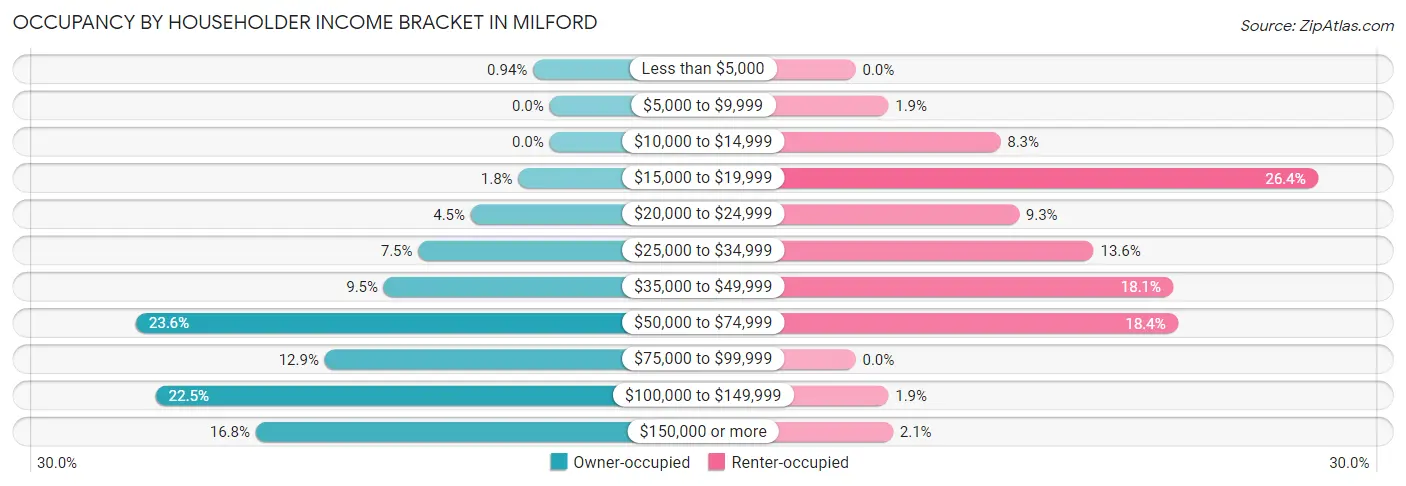
| Income Bracket | Owner-occupied | Renter-occupied |
| Less than $5,000 | 10 (0.9%) | 0 (0.0%) |
| $5,000 to $9,999 | 0 (0.0%) | 7 (1.9%) |
| $10,000 to $14,999 | 0 (0.0%) | 31 (8.3%) |
| $15,000 to $19,999 | 19 (1.8%) | 99 (26.4%) |
| $20,000 to $24,999 | 48 (4.5%) | 35 (9.3%) |
| $25,000 to $34,999 | 80 (7.5%) | 51 (13.6%) |
| $35,000 to $49,999 | 101 (9.5%) | 68 (18.1%) |
| $50,000 to $74,999 | 252 (23.6%) | 69 (18.4%) |
| $75,000 to $99,999 | 137 (12.9%) | 0 (0.0%) |
| $100,000 to $149,999 | 240 (22.5%) | 7 (1.9%) |
| $150,000 or more | 179 (16.8%) | 8 (2.1%) |
| Total | 1,066 (100.0%) | 375 (100.0%) |
Monthly Housing Cost Tiers in Milford
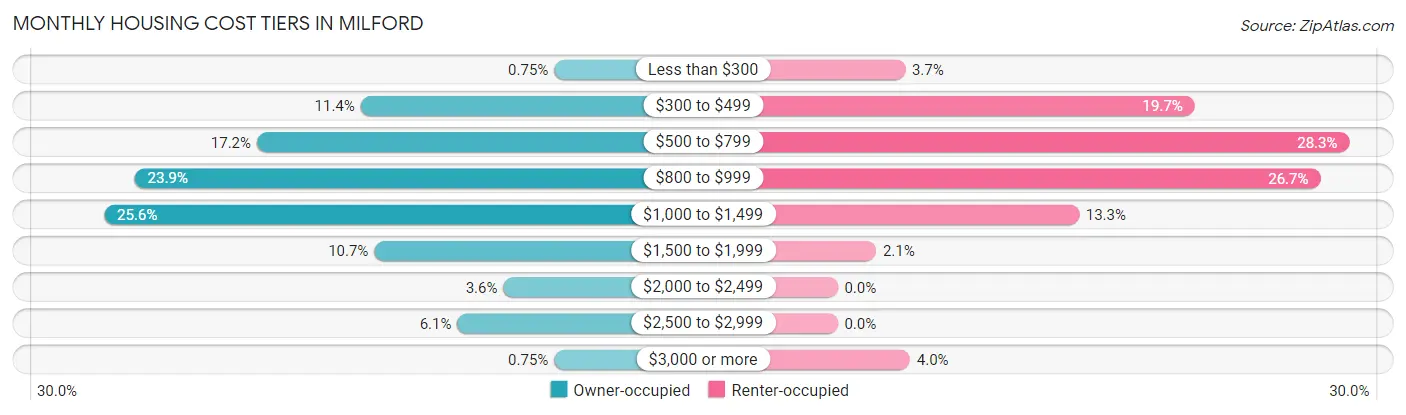
| Monthly Cost | Owner-occupied | Renter-occupied |
| Less than $300 | 8 (0.7%) | 14 (3.7%) |
| $300 to $499 | 122 (11.4%) | 74 (19.7%) |
| $500 to $799 | 183 (17.2%) | 106 (28.3%) |
| $800 to $999 | 255 (23.9%) | 100 (26.7%) |
| $1,000 to $1,499 | 273 (25.6%) | 50 (13.3%) |
| $1,500 to $1,999 | 114 (10.7%) | 8 (2.1%) |
| $2,000 to $2,499 | 38 (3.6%) | 0 (0.0%) |
| $2,500 to $2,999 | 65 (6.1%) | 0 (0.0%) |
| $3,000 or more | 8 (0.7%) | 15 (4.0%) |
| Total | 1,066 (100.0%) | 375 (100.0%) |
Physical Housing Characteristics in Milford
Housing Structures in Milford
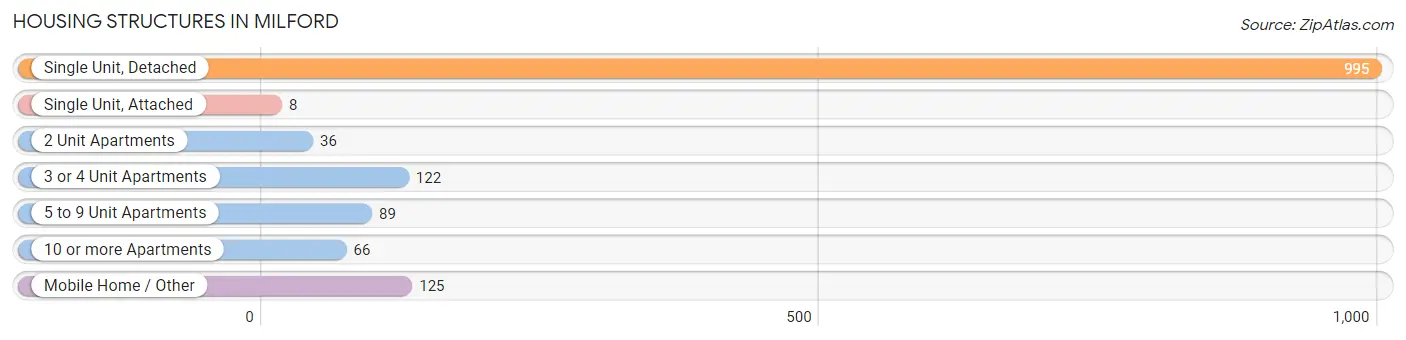
| Structure Type | # Housing Units | % Housing Units |
| Single Unit, Detached | 995 | 69.1% |
| Single Unit, Attached | 8 | 0.6% |
| 2 Unit Apartments | 36 | 2.5% |
| 3 or 4 Unit Apartments | 122 | 8.5% |
| 5 to 9 Unit Apartments | 89 | 6.2% |
| 10 or more Apartments | 66 | 4.6% |
| Mobile Home / Other | 125 | 8.7% |
| Total | 1,441 | 100.0% |
Housing Structures by Occupancy in Milford
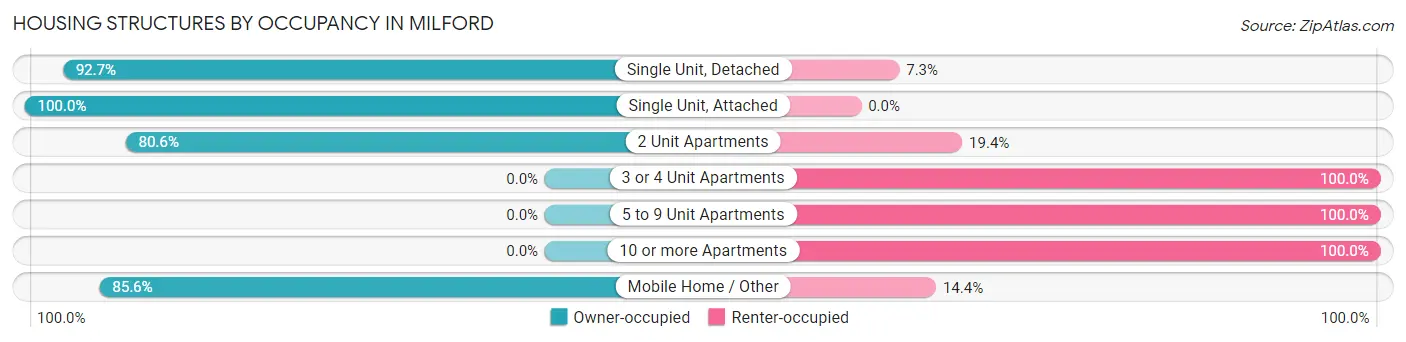
| Structure Type | Owner-occupied | Renter-occupied |
| Single Unit, Detached | 922 (92.7%) | 73 (7.3%) |
| Single Unit, Attached | 8 (100.0%) | 0 (0.0%) |
| 2 Unit Apartments | 29 (80.6%) | 7 (19.4%) |
| 3 or 4 Unit Apartments | 0 (0.0%) | 122 (100.0%) |
| 5 to 9 Unit Apartments | 0 (0.0%) | 89 (100.0%) |
| 10 or more Apartments | 0 (0.0%) | 66 (100.0%) |
| Mobile Home / Other | 107 (85.6%) | 18 (14.4%) |
| Total | 1,066 (74.0%) | 375 (26.0%) |
Housing Structures by Number of Rooms in Milford
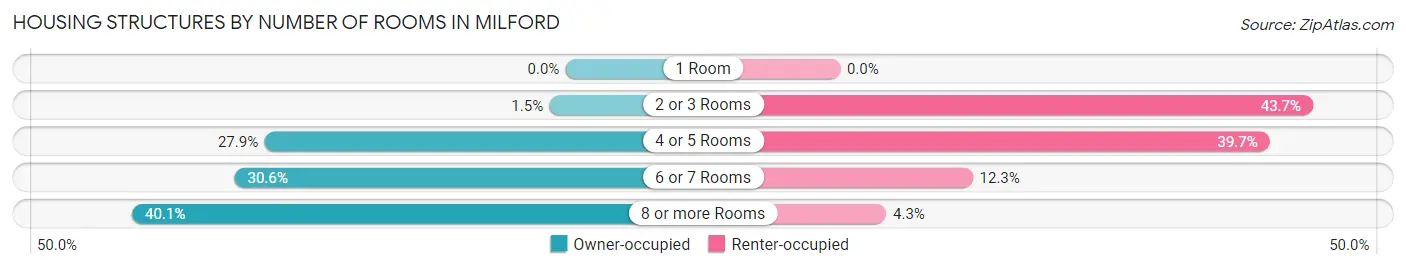
| Number of Rooms | Owner-occupied | Renter-occupied |
| 1 Room | 0 (0.0%) | 0 (0.0%) |
| 2 or 3 Rooms | 16 (1.5%) | 164 (43.7%) |
| 4 or 5 Rooms | 297 (27.9%) | 149 (39.7%) |
| 6 or 7 Rooms | 326 (30.6%) | 46 (12.3%) |
| 8 or more Rooms | 427 (40.1%) | 16 (4.3%) |
| Total | 1,066 (100.0%) | 375 (100.0%) |
Housing Structure by Heating Type in Milford
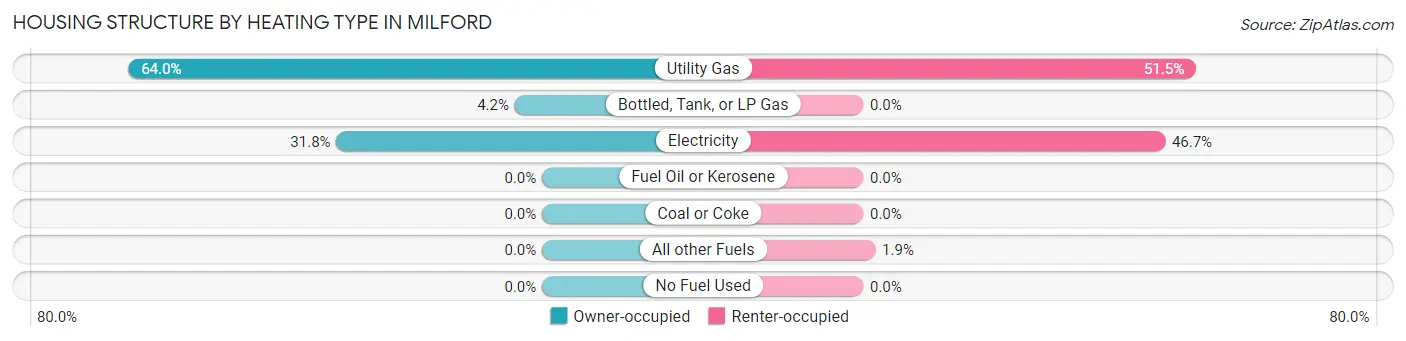
| Heating Type | Owner-occupied | Renter-occupied |
| Utility Gas | 682 (64.0%) | 193 (51.5%) |
| Bottled, Tank, or LP Gas | 45 (4.2%) | 0 (0.0%) |
| Electricity | 339 (31.8%) | 175 (46.7%) |
| Fuel Oil or Kerosene | 0 (0.0%) | 0 (0.0%) |
| Coal or Coke | 0 (0.0%) | 0 (0.0%) |
| All other Fuels | 0 (0.0%) | 7 (1.9%) |
| No Fuel Used | 0 (0.0%) | 0 (0.0%) |
| Total | 1,066 (100.0%) | 375 (100.0%) |
Household Vehicle Usage in Milford
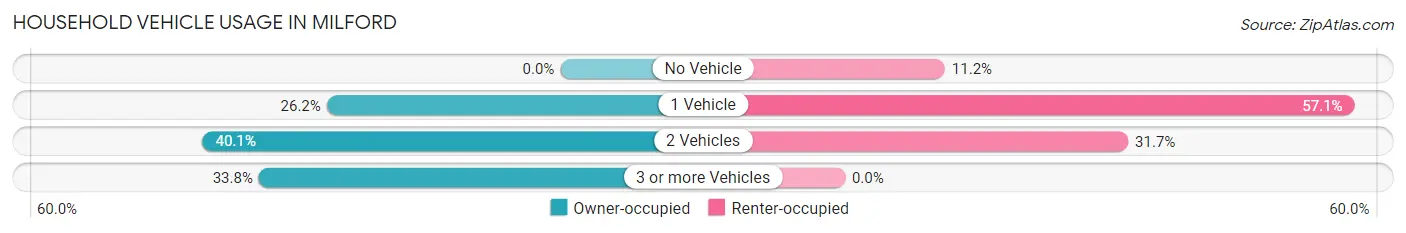
| Vehicles per Household | Owner-occupied | Renter-occupied |
| No Vehicle | 0 (0.0%) | 42 (11.2%) |
| 1 Vehicle | 279 (26.2%) | 214 (57.1%) |
| 2 Vehicles | 427 (40.1%) | 119 (31.7%) |
| 3 or more Vehicles | 360 (33.8%) | 0 (0.0%) |
| Total | 1,066 (100.0%) | 375 (100.0%) |
Real Estate & Mortgages in Milford
Real Estate and Mortgage Overview in Milford
| Characteristic | Without Mortgage | With Mortgage |
| Housing Units | 450 | 616 |
| Median Property Value | $216,500 | $193,300 |
| Median Household Income | $62,857 | $103 |
| Monthly Housing Costs | $633 | $8 |
| Real Estate Taxes | $2,696 | $31 |
Property Value by Mortgage Status in Milford
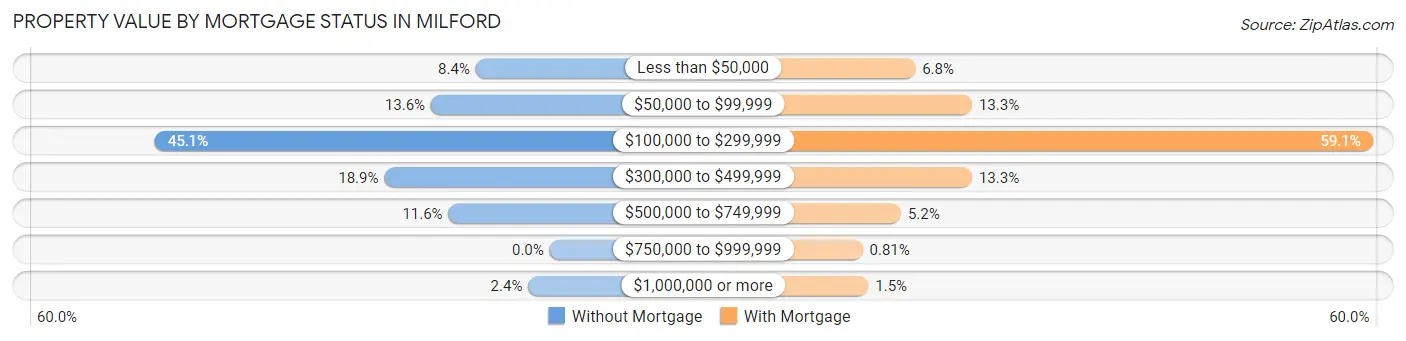
| Property Value | Without Mortgage | With Mortgage |
| Less than $50,000 | 38 (8.4%) | 42 (6.8%) |
| $50,000 to $99,999 | 61 (13.6%) | 82 (13.3%) |
| $100,000 to $299,999 | 203 (45.1%) | 364 (59.1%) |
| $300,000 to $499,999 | 85 (18.9%) | 82 (13.3%) |
| $500,000 to $749,999 | 52 (11.6%) | 32 (5.2%) |
| $750,000 to $999,999 | 0 (0.0%) | 5 (0.8%) |
| $1,000,000 or more | 11 (2.4%) | 9 (1.5%) |
| Total | 450 (100.0%) | 616 (100.0%) |
Household Income by Mortgage Status in Milford
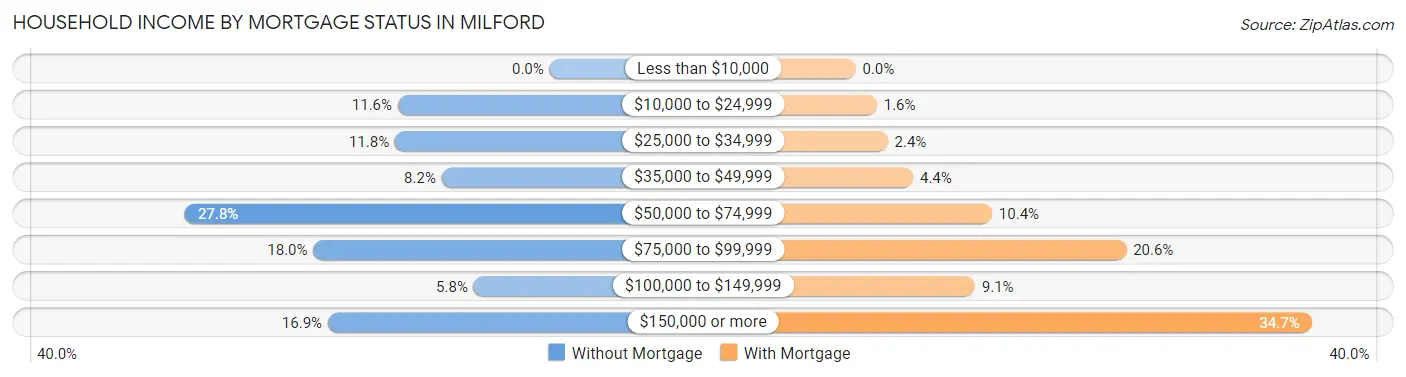
| Household Income | Without Mortgage | With Mortgage |
| Less than $10,000 | 0 (0.0%) | 0 (0.0%) |
| $10,000 to $24,999 | 52 (11.6%) | 10 (1.6%) |
| $25,000 to $34,999 | 53 (11.8%) | 15 (2.4%) |
| $35,000 to $49,999 | 37 (8.2%) | 27 (4.4%) |
| $50,000 to $74,999 | 125 (27.8%) | 64 (10.4%) |
| $75,000 to $99,999 | 81 (18.0%) | 127 (20.6%) |
| $100,000 to $149,999 | 26 (5.8%) | 56 (9.1%) |
| $150,000 or more | 76 (16.9%) | 214 (34.7%) |
| Total | 450 (100.0%) | 616 (100.0%) |
Property Value to Household Income Ratio in Milford
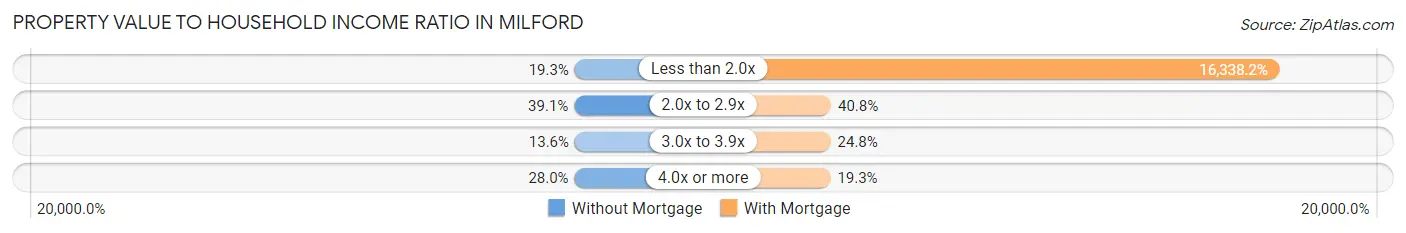
| Value-to-Income Ratio | Without Mortgage | With Mortgage |
| Less than 2.0x | 87 (19.3%) | 100,643 (16,338.1%) |
| 2.0x to 2.9x | 176 (39.1%) | 251 (40.7%) |
| 3.0x to 3.9x | 61 (13.6%) | 153 (24.8%) |
| 4.0x or more | 126 (28.0%) | 119 (19.3%) |
| Total | 450 (100.0%) | 616 (100.0%) |
Real Estate Taxes by Mortgage Status in Milford
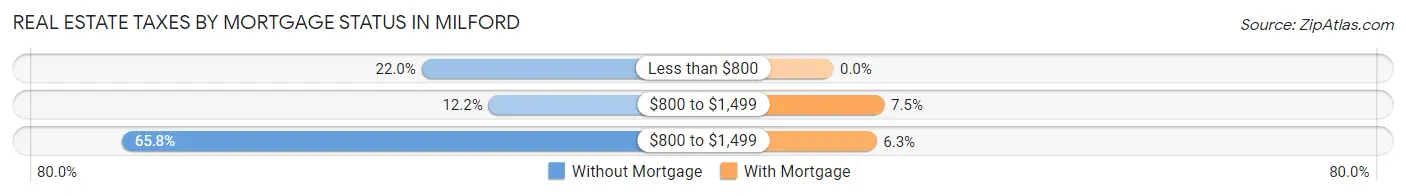
| Property Taxes | Without Mortgage | With Mortgage |
| Less than $800 | 99 (22.0%) | 0 (0.0%) |
| $800 to $1,499 | 55 (12.2%) | 46 (7.5%) |
| $800 to $1,499 | 296 (65.8%) | 39 (6.3%) |
| Total | 450 (100.0%) | 616 (100.0%) |
Health & Disability in Milford
Health Insurance Coverage by Age in Milford
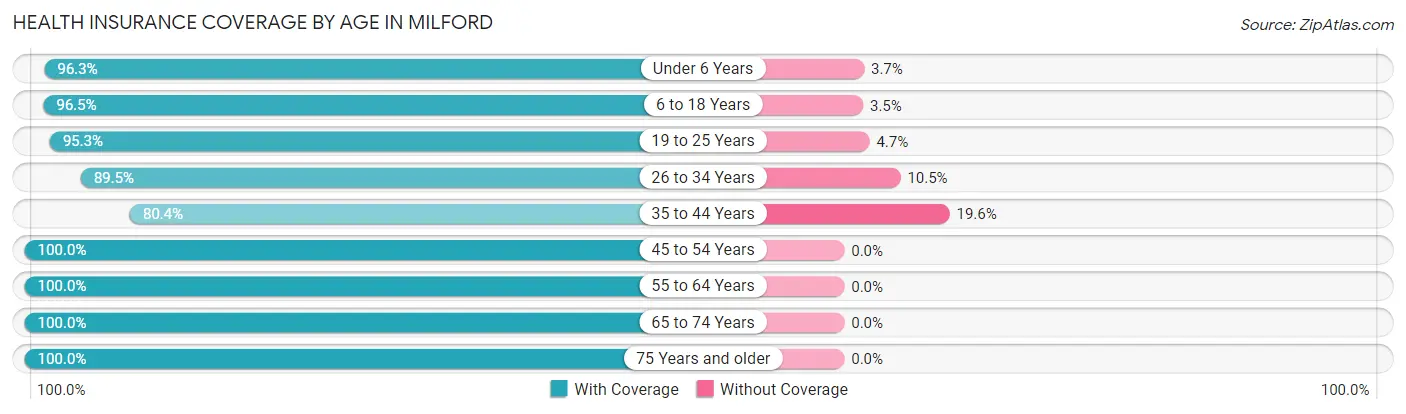
| Age Bracket | With Coverage | Without Coverage |
| Under 6 Years | 183 (96.3%) | 7 (3.7%) |
| 6 to 18 Years | 606 (96.5%) | 22 (3.5%) |
| 19 to 25 Years | 183 (95.3%) | 9 (4.7%) |
| 26 to 34 Years | 308 (89.5%) | 36 (10.5%) |
| 35 to 44 Years | 262 (80.4%) | 64 (19.6%) |
| 45 to 54 Years | 424 (100.0%) | 0 (0.0%) |
| 55 to 64 Years | 386 (100.0%) | 0 (0.0%) |
| 65 to 74 Years | 500 (100.0%) | 0 (0.0%) |
| 75 Years and older | 257 (100.0%) | 0 (0.0%) |
| Total | 3,109 (95.8%) | 138 (4.3%) |
Health Insurance Coverage by Citizenship Status in Milford
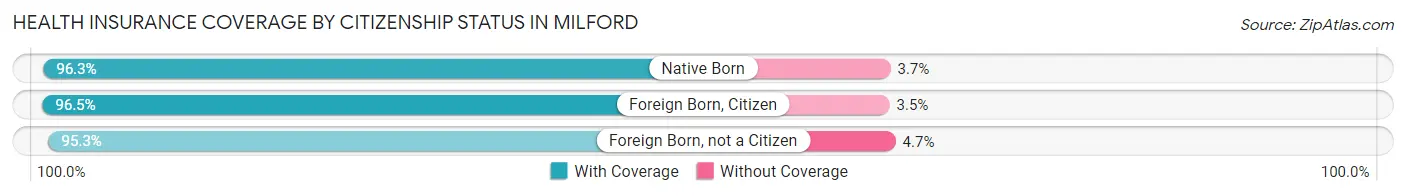
| Citizenship Status | With Coverage | Without Coverage |
| Native Born | 183 (96.3%) | 7 (3.7%) |
| Foreign Born, Citizen | 606 (96.5%) | 22 (3.5%) |
| Foreign Born, not a Citizen | 183 (95.3%) | 9 (4.7%) |
Health Insurance Coverage by Household Income in Milford
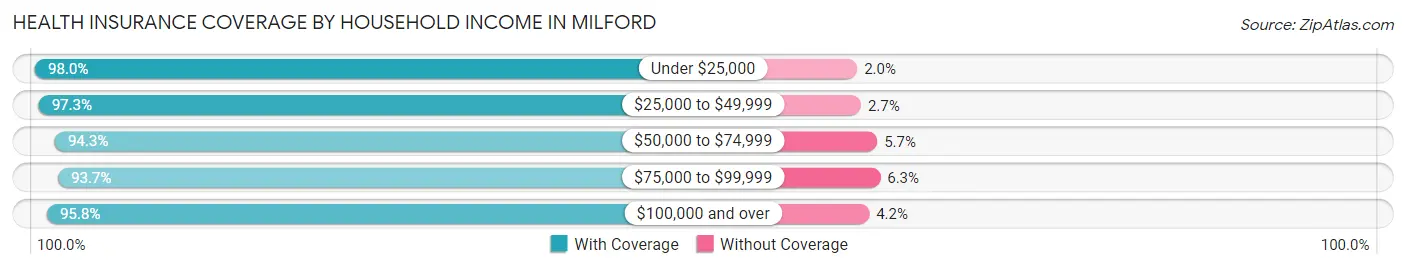
| Household Income | With Coverage | Without Coverage |
| Under $25,000 | 351 (98.0%) | 7 (2.0%) |
| $25,000 to $49,999 | 513 (97.3%) | 14 (2.7%) |
| $50,000 to $74,999 | 678 (94.3%) | 41 (5.7%) |
| $75,000 to $99,999 | 314 (93.7%) | 21 (6.3%) |
| $100,000 and over | 1,253 (95.8%) | 55 (4.2%) |
Public vs Private Health Insurance Coverage by Age in Milford
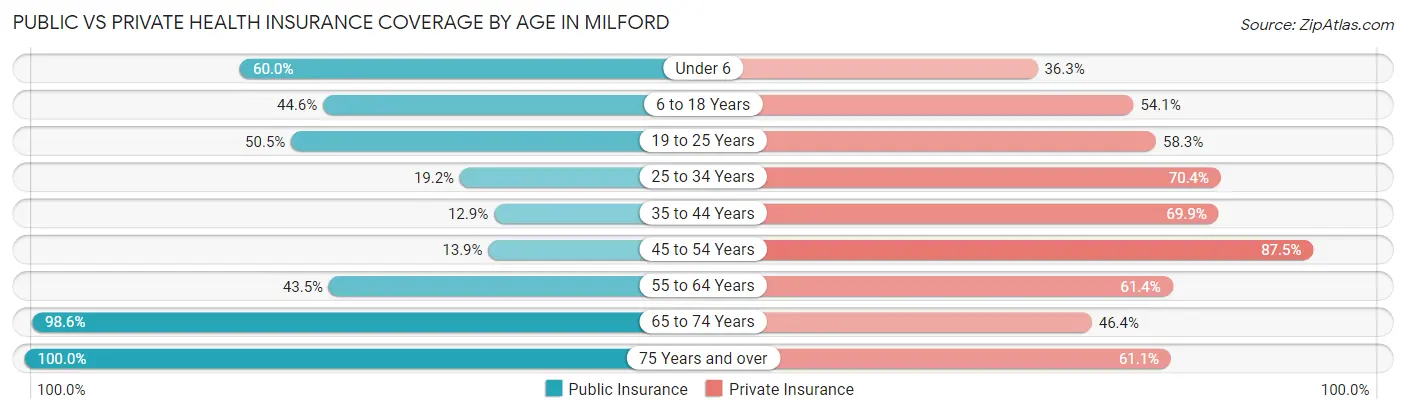
| Age Bracket | Public Insurance | Private Insurance |
| Under 6 | 114 (60.0%) | 69 (36.3%) |
| 6 to 18 Years | 280 (44.6%) | 340 (54.1%) |
| 19 to 25 Years | 97 (50.5%) | 112 (58.3%) |
| 25 to 34 Years | 66 (19.2%) | 242 (70.4%) |
| 35 to 44 Years | 42 (12.9%) | 228 (69.9%) |
| 45 to 54 Years | 59 (13.9%) | 371 (87.5%) |
| 55 to 64 Years | 168 (43.5%) | 237 (61.4%) |
| 65 to 74 Years | 493 (98.6%) | 232 (46.4%) |
| 75 Years and over | 257 (100.0%) | 157 (61.1%) |
| Total | 1,576 (48.5%) | 1,988 (61.2%) |
Disability Status by Sex by Age in Milford
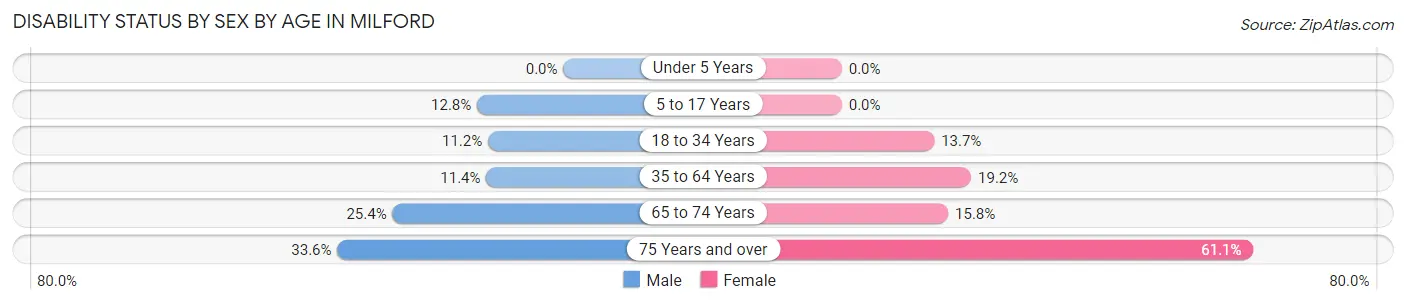
| Age Bracket | Male | Female |
| Under 5 Years | 0 (0.0%) | 0 (0.0%) |
| 5 to 17 Years | 47 (12.8%) | 0 (0.0%) |
| 18 to 34 Years | 36 (11.2%) | 31 (13.7%) |
| 35 to 64 Years | 56 (11.4%) | 124 (19.2%) |
| 65 to 74 Years | 69 (25.4%) | 36 (15.8%) |
| 75 Years and over | 50 (33.6%) | 66 (61.1%) |
Disability Class by Sex by Age in Milford
Disability Class: Hearing Difficulty
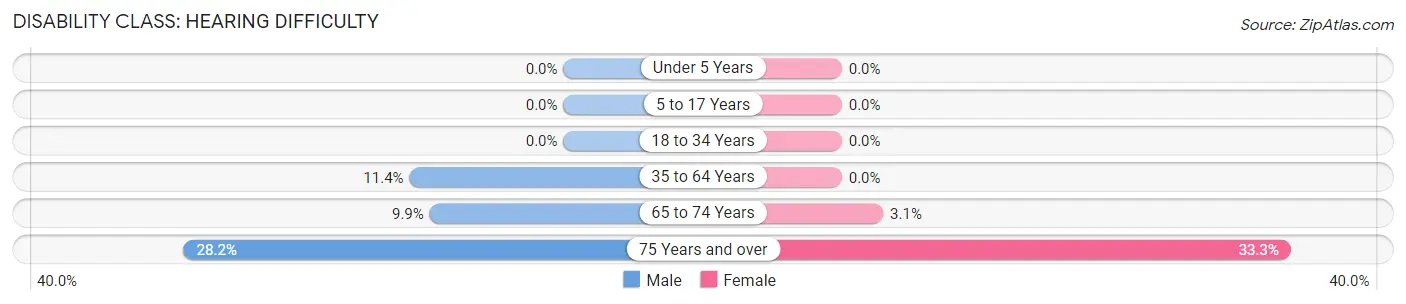
| Age Bracket | Male | Female |
| Under 5 Years | 0 (0.0%) | 0 (0.0%) |
| 5 to 17 Years | 0 (0.0%) | 0 (0.0%) |
| 18 to 34 Years | 0 (0.0%) | 0 (0.0%) |
| 35 to 64 Years | 56 (11.4%) | 0 (0.0%) |
| 65 to 74 Years | 27 (9.9%) | 7 (3.1%) |
| 75 Years and over | 42 (28.2%) | 36 (33.3%) |
Disability Class: Vision Difficulty
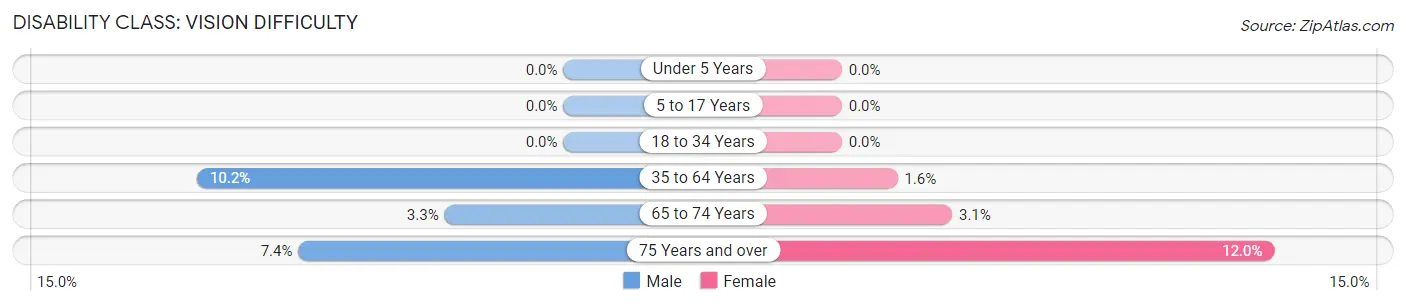
| Age Bracket | Male | Female |
| Under 5 Years | 0 (0.0%) | 0 (0.0%) |
| 5 to 17 Years | 0 (0.0%) | 0 (0.0%) |
| 18 to 34 Years | 0 (0.0%) | 0 (0.0%) |
| 35 to 64 Years | 50 (10.2%) | 10 (1.5%) |
| 65 to 74 Years | 9 (3.3%) | 7 (3.1%) |
| 75 Years and over | 11 (7.4%) | 13 (12.0%) |
Disability Class: Cognitive Difficulty
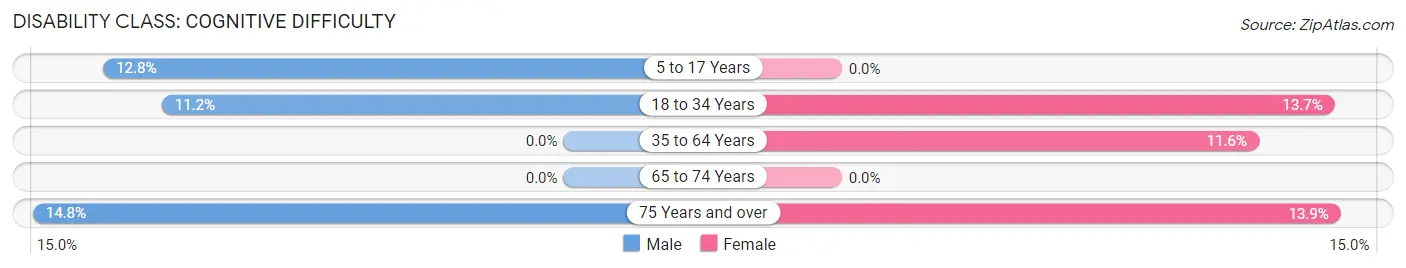
| Age Bracket | Male | Female |
| 5 to 17 Years | 47 (12.8%) | 0 (0.0%) |
| 18 to 34 Years | 36 (11.2%) | 31 (13.7%) |
| 35 to 64 Years | 0 (0.0%) | 75 (11.6%) |
| 65 to 74 Years | 0 (0.0%) | 0 (0.0%) |
| 75 Years and over | 22 (14.8%) | 15 (13.9%) |
Disability Class: Ambulatory Difficulty
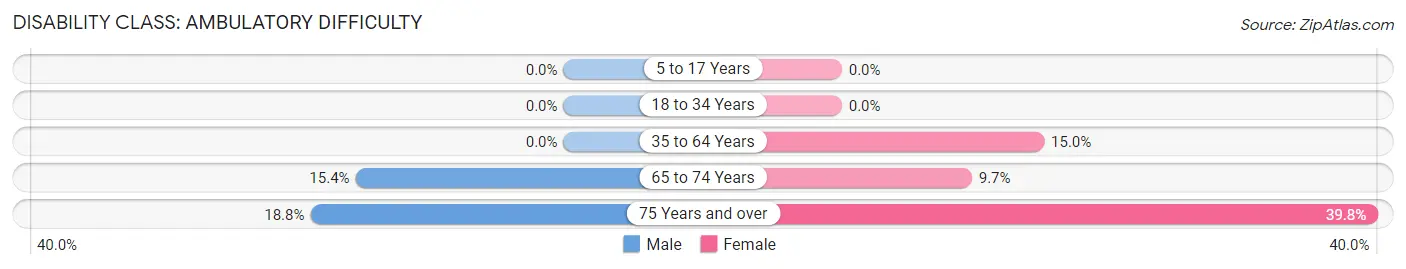
| Age Bracket | Male | Female |
| 5 to 17 Years | 0 (0.0%) | 0 (0.0%) |
| 18 to 34 Years | 0 (0.0%) | 0 (0.0%) |
| 35 to 64 Years | 0 (0.0%) | 97 (15.0%) |
| 65 to 74 Years | 42 (15.4%) | 22 (9.7%) |
| 75 Years and over | 28 (18.8%) | 43 (39.8%) |
Disability Class: Self-Care Difficulty
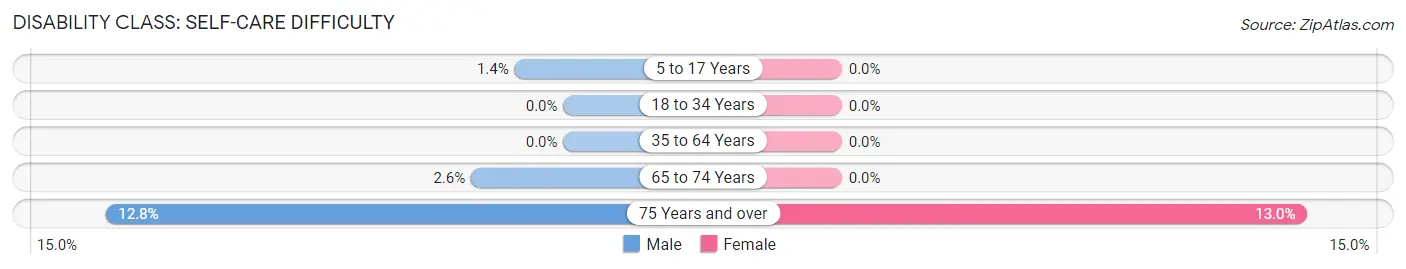
| Age Bracket | Male | Female |
| 5 to 17 Years | 5 (1.4%) | 0 (0.0%) |
| 18 to 34 Years | 0 (0.0%) | 0 (0.0%) |
| 35 to 64 Years | 0 (0.0%) | 0 (0.0%) |
| 65 to 74 Years | 7 (2.6%) | 0 (0.0%) |
| 75 Years and over | 19 (12.8%) | 14 (13.0%) |
Technology Access in Milford
Computing Device Access in Milford
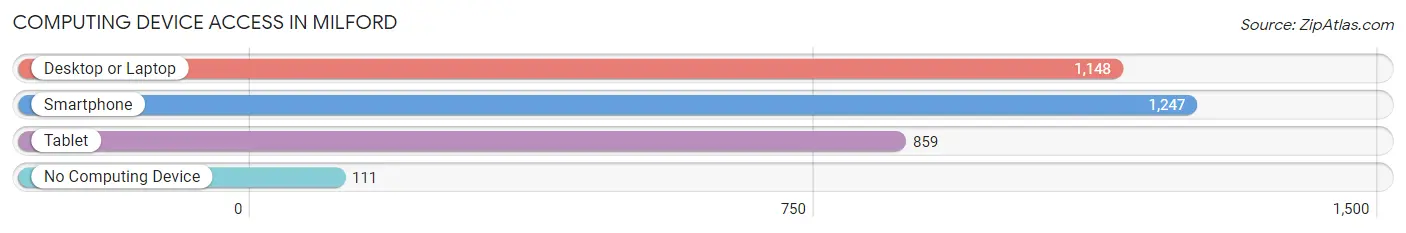
| Device Type | # Households | % Households |
| Desktop or Laptop | 1,148 | 79.7% |
| Smartphone | 1,247 | 86.5% |
| Tablet | 859 | 59.6% |
| No Computing Device | 111 | 7.7% |
| Total | 1,441 | 100.0% |
Internet Access in Milford
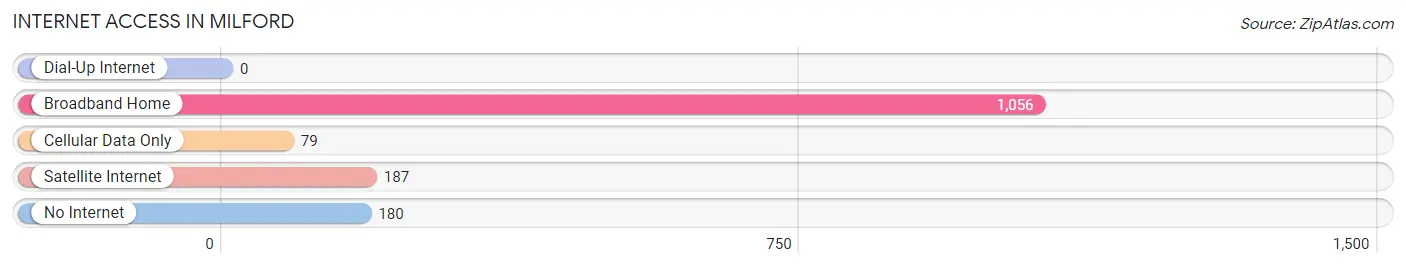
| Internet Type | # Households | % Households |
| Dial-Up Internet | 0 | 0.0% |
| Broadband Home | 1,056 | 73.3% |
| Cellular Data Only | 79 | 5.5% |
| Satellite Internet | 187 | 13.0% |
| No Internet | 180 | 12.5% |
| Total | 1,441 | 100.0% |
Milford Summary
Milford, Iowa is a small city located in Dickinson County in the northwest corner of the state. It is situated on the banks of the Little Sioux River and is part of the Sioux City metropolitan area. The city has a population of approximately 2,500 people and is known for its small-town charm and friendly atmosphere.
History
The area that is now Milford was first settled in 1856 by a group of settlers from Ohio. The town was originally known as “Little Sioux” and was later renamed Milford in 1872. The name was chosen in honor of the town’s first postmaster, William Milford.
The town grew slowly but steadily over the years, and by the early 1900s, it had become a thriving agricultural community. The town was home to several businesses, including a flour mill, a creamery, a lumber yard, and a blacksmith shop.
In the 1920s, Milford experienced a period of growth and prosperity. The town was home to several banks, a movie theater, and a variety of other businesses. The town also had a thriving agricultural industry, with several large farms located in the area.
Geography
Milford is located in the northwest corner of Iowa, in Dickinson County. It is situated on the banks of the Little Sioux River, which flows through the city. The city is surrounded by rolling hills and farmland, and is located approximately 30 miles from Sioux City.
The city has a total area of 1.7 square miles, all of which is land. The city has a humid continental climate, with hot summers and cold winters.
Economy
Milford’s economy is largely based on agriculture. The city is home to several large farms, which produce a variety of crops, including corn, soybeans, and wheat. The city also has a thriving livestock industry, with several large cattle and hog farms located in the area.
In addition to agriculture, Milford is home to several small businesses, including restaurants, retail stores, and service providers. The city also has a small manufacturing sector, with several small factories located in the area.
Demographics
As of the 2010 census, Milford had a population of 2,500 people. The racial makeup of the city was 97.2% White, 0.8% African American, 0.4% Native American, 0.4% Asian, and 0.2% from other races. Hispanic or Latino of any race were 1.2% of the population.
The median household income in Milford was $41,250, and the median family income was $50,000. The per capita income for the city was $20,845. About 8.2% of families and 10.2% of the population were below the poverty line, including 14.2% of those under age 18 and 6.2% of those age 65 or over.
Milford is a small city with a rich history and a friendly atmosphere. The city is home to a thriving agricultural industry, as well as several small businesses. The city has a diverse population and a strong economy, making it an ideal place to live and work.
Common Questions
What is Per Capita Income in Milford?
Per Capita income in Milford is $36,233.
What is the Median Family Income in Milford?
Median Family Income in Milford is $68,063.
What is the Median Household income in Milford?
Median Household Income in Milford is $59,059.
What is Income or Wage Gap in Milford?
Income or Wage Gap in Milford is 13.9%.
Women in Milford earn 86.1 cents for every dollar earned by a man.
What is Family Income Deficit in Milford?
Family Income Deficit in Milford is $4,780.
Families that are below poverty line in Milford earn $4,780 less on average than the poverty threshold level.
What is Inequality or Gini Index in Milford?
Inequality or Gini Index in Milford is 0.42.
What is the Total Population of Milford?
Total Population of Milford is 3,295.
What is the Total Male Population of Milford?
Total Male Population of Milford is 1,702.
What is the Total Female Population of Milford?
Total Female Population of Milford is 1,593.
What is the Ratio of Males per 100 Females in Milford?
There are 106.84 Males per 100 Females in Milford.
What is the Ratio of Females per 100 Males in Milford?
There are 93.60 Females per 100 Males in Milford.
What is the Median Population Age in Milford?
Median Population Age in Milford is 44.0 Years.
What is the Average Family Size in Milford
Average Family Size in Milford is 2.9 People.
What is the Average Household Size in Milford
Average Household Size in Milford is 2.2 People.
How Large is the Labor Force in Milford?
There are 1,726 People in the Labor Forcein in Milford.
What is the Percentage of People in the Labor Force in Milford?
65.5% of People are in the Labor Force in Milford.
What is the Unemployment Rate in Milford?
Unemployment Rate in Milford is 3.4%.