Mapleton, IA Map & Demographics
Mapleton Map
Mapleton Overview
$38,198
PER CAPITA INCOME
$74,125
AVG FAMILY INCOME
$51,648
AVG HOUSEHOLD INCOME
33.6%
WAGE / INCOME GAP [ % ]
66.4¢/ $1
WAGE / INCOME GAP [ $ ]
0.43
INEQUALITY / GINI INDEX
923
TOTAL POPULATION
415
MALE POPULATION
508
FEMALE POPULATION
81.69
MALES / 100 FEMALES
122.41
FEMALES / 100 MALES
56.8
MEDIAN AGE
2.4
AVG FAMILY SIZE
1.8
AVG HOUSEHOLD SIZE
406
LABOR FORCE [ PEOPLE ]
51.4%
PERCENT IN LABOR FORCE
2.5%
UNEMPLOYMENT RATE
Mapleton Zip Codes
Mapleton Area Codes
Income in Mapleton
Income Overview in Mapleton
Per Capita Income in Mapleton is $38,198, while median incomes of families and households are $74,125 and $51,648 respectively.
| Characteristic | Number | Measure |
| Per Capita Income | 923 | $38,198 |
| Median Family Income | 259 | $74,125 |
| Mean Family Income | 259 | $88,176 |
| Median Household Income | 487 | $51,648 |
| Mean Household Income | 487 | $66,840 |
| Income Deficit | 259 | $0 |
| Wage / Income Gap (%) | 923 | 33.59% |
| Wage / Income Gap ($) | 923 | 66.41¢ per $1 |
| Gini / Inequality Index | 923 | 0.43 |
Earnings by Sex in Mapleton
Average Earnings in Mapleton are $39,583, $49,479 for men and $32,857 for women, a difference of 33.6%.
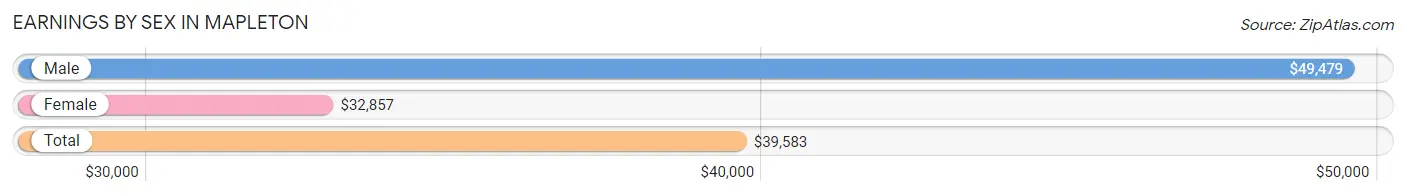
| Sex | Number | Average Earnings |
| Male | 229 (52.9%) | $49,479 |
| Female | 204 (47.1%) | $32,857 |
| Total | 433 (100.0%) | $39,583 |
Earnings by Sex by Income Bracket in Mapleton
The most common earnings brackets in Mapleton are $100,000+ for men (29 | 12.7%) and $50,000 to $54,999 for women (28 | 13.7%).
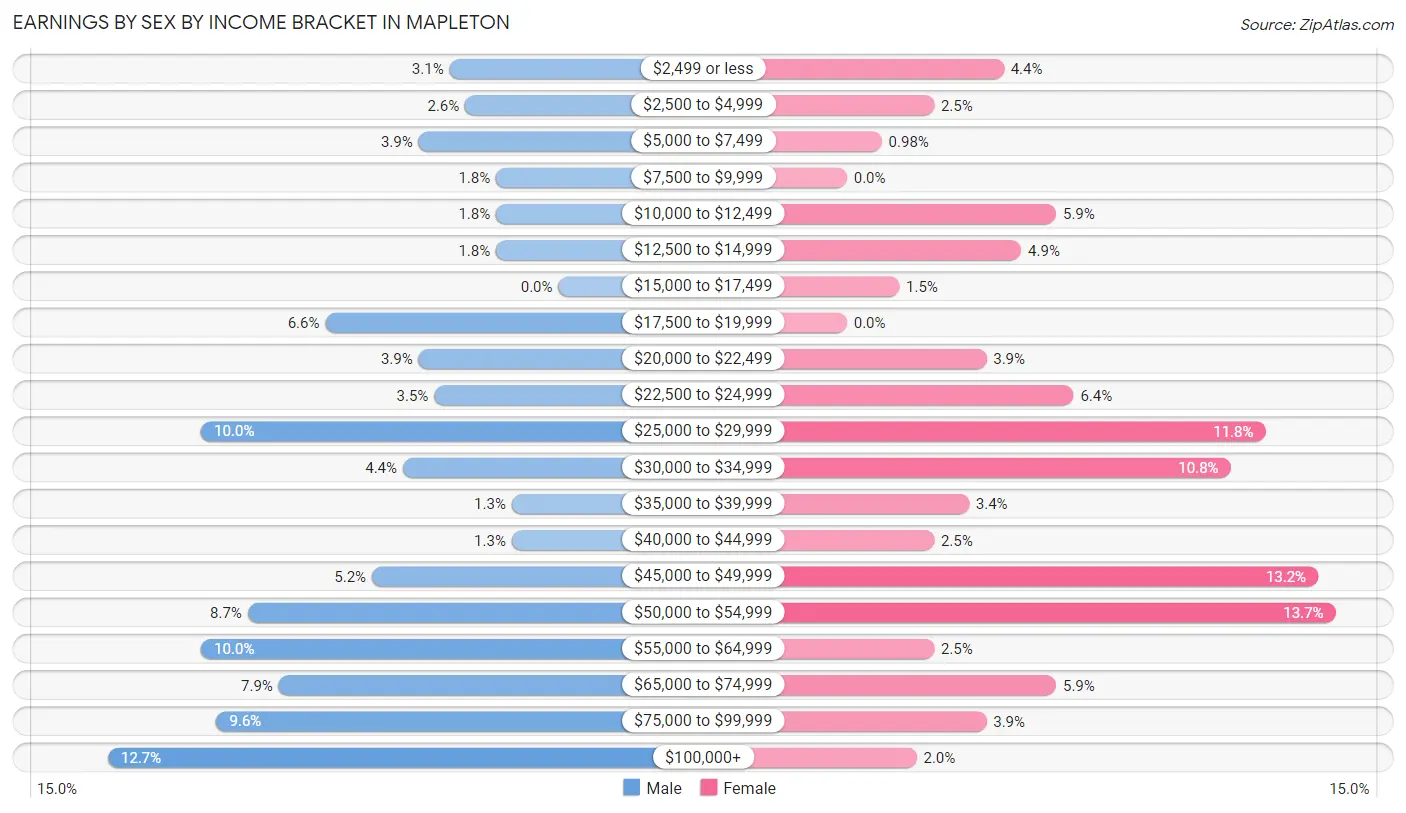
| Income | Male | Female |
| $2,499 or less | 7 (3.1%) | 9 (4.4%) |
| $2,500 to $4,999 | 6 (2.6%) | 5 (2.5%) |
| $5,000 to $7,499 | 9 (3.9%) | 2 (1.0%) |
| $7,500 to $9,999 | 4 (1.8%) | 0 (0.0%) |
| $10,000 to $12,499 | 4 (1.8%) | 12 (5.9%) |
| $12,500 to $14,999 | 4 (1.8%) | 10 (4.9%) |
| $15,000 to $17,499 | 0 (0.0%) | 3 (1.5%) |
| $17,500 to $19,999 | 15 (6.6%) | 0 (0.0%) |
| $20,000 to $22,499 | 9 (3.9%) | 8 (3.9%) |
| $22,500 to $24,999 | 8 (3.5%) | 13 (6.4%) |
| $25,000 to $29,999 | 23 (10.0%) | 24 (11.8%) |
| $30,000 to $34,999 | 10 (4.4%) | 22 (10.8%) |
| $35,000 to $39,999 | 3 (1.3%) | 7 (3.4%) |
| $40,000 to $44,999 | 3 (1.3%) | 5 (2.5%) |
| $45,000 to $49,999 | 12 (5.2%) | 27 (13.2%) |
| $50,000 to $54,999 | 20 (8.7%) | 28 (13.7%) |
| $55,000 to $64,999 | 23 (10.0%) | 5 (2.5%) |
| $65,000 to $74,999 | 18 (7.9%) | 12 (5.9%) |
| $75,000 to $99,999 | 22 (9.6%) | 8 (3.9%) |
| $100,000+ | 29 (12.7%) | 4 (2.0%) |
| Total | 229 (100.0%) | 204 (100.0%) |
Earnings by Sex by Educational Attainment in Mapleton
Average earnings in Mapleton are $50,250 for men and $35,357 for women, a difference of 29.6%. Men with an educational attainment of bachelor's degree enjoy the highest average annual earnings of $83,750, while those with high school diploma education earn the least with $34,167. Women with an educational attainment of graduate degree earn the most with the average annual earnings of $60,833, while those with high school diploma education have the smallest earnings of $28,417.
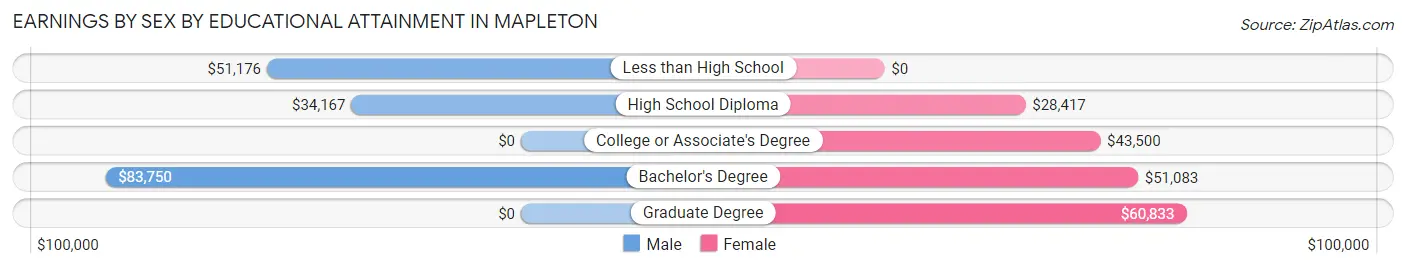
| Educational Attainment | Male Income | Female Income |
| Less than High School | $51,176 | $0 |
| High School Diploma | $34,167 | $28,417 |
| College or Associate's Degree | - | - |
| Bachelor's Degree | $83,750 | $51,083 |
| Graduate Degree | - | - |
| Total | $50,250 | $35,357 |
Family Income in Mapleton
Family Income Brackets in Mapleton
According to the Mapleton family income data, there are 70 families falling into the $50,000 to $74,999 income range, which is the most common income bracket and makes up 27.0% of all families.
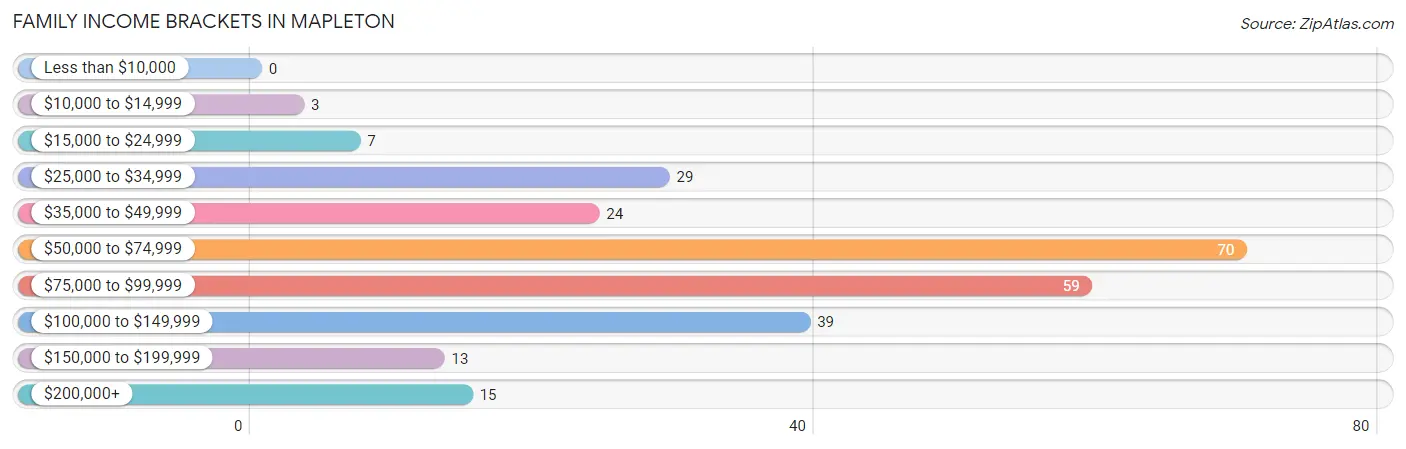
| Income Bracket | # Families | % Families |
| Less than $10,000 | 0 | 0.0% |
| $10,000 to $14,999 | 3 | 1.2% |
| $15,000 to $24,999 | 7 | 2.7% |
| $25,000 to $34,999 | 29 | 11.2% |
| $35,000 to $49,999 | 24 | 9.3% |
| $50,000 to $74,999 | 70 | 27.0% |
| $75,000 to $99,999 | 59 | 22.8% |
| $100,000 to $149,999 | 39 | 15.1% |
| $150,000 to $199,999 | 13 | 5.0% |
| $200,000+ | 15 | 5.8% |
Family Income by Famaliy Size in Mapleton
5-person families (15 | 5.8%) account for the highest median family income in Mapleton with $110,938 per family, while 2-person families (177 | 68.3%) have the highest median income of $36,146 per family member.
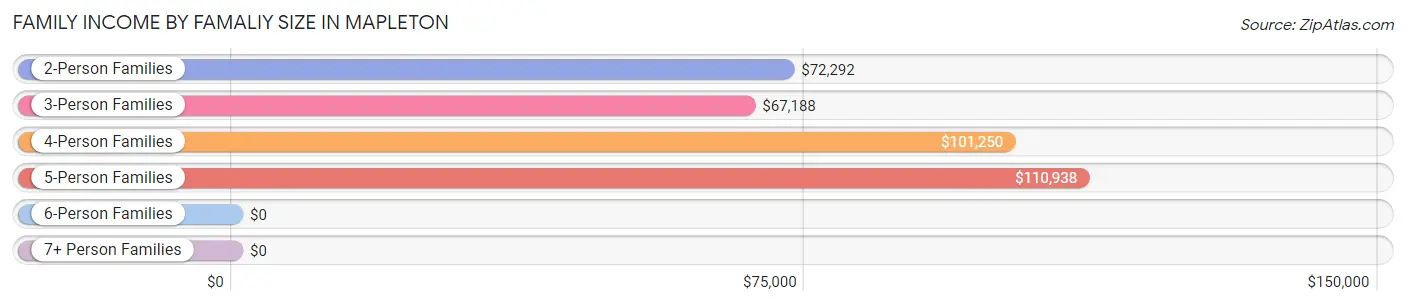
| Income Bracket | # Families | Median Income |
| 2-Person Families | 177 (68.3%) | $72,292 |
| 3-Person Families | 50 (19.3%) | $67,188 |
| 4-Person Families | 16 (6.2%) | $101,250 |
| 5-Person Families | 15 (5.8%) | $110,938 |
| 6-Person Families | 1 (0.4%) | $0 |
| 7+ Person Families | 0 (0.0%) | $0 |
| Total | 259 (100.0%) | $74,125 |
Family Income by Number of Earners in Mapleton
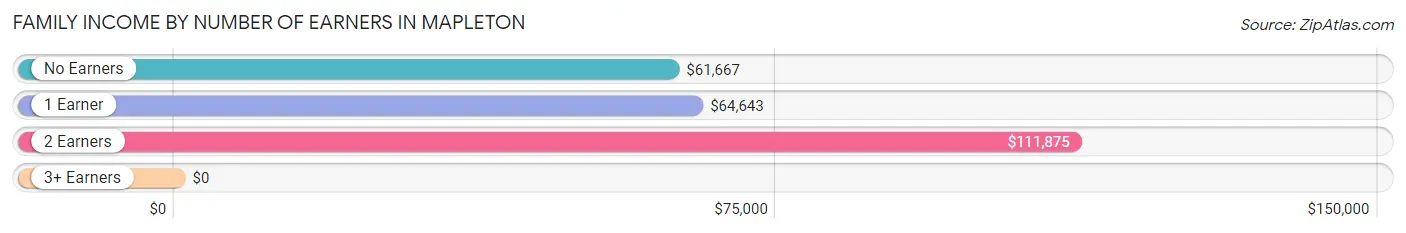
| Number of Earners | # Families | Median Income |
| No Earners | 62 (23.9%) | $61,667 |
| 1 Earner | 108 (41.7%) | $64,643 |
| 2 Earners | 78 (30.1%) | $111,875 |
| 3+ Earners | 11 (4.3%) | $0 |
| Total | 259 (100.0%) | $74,125 |
Household Income in Mapleton
Household Income Brackets in Mapleton
With 101 households falling in the category, the $50,000 to $74,999 income range is the most frequent in Mapleton, accounting for 20.7% of all households. In contrast, only 10 households (2.1%) fall into the less than $10,000 income bracket, making it the least populous group.
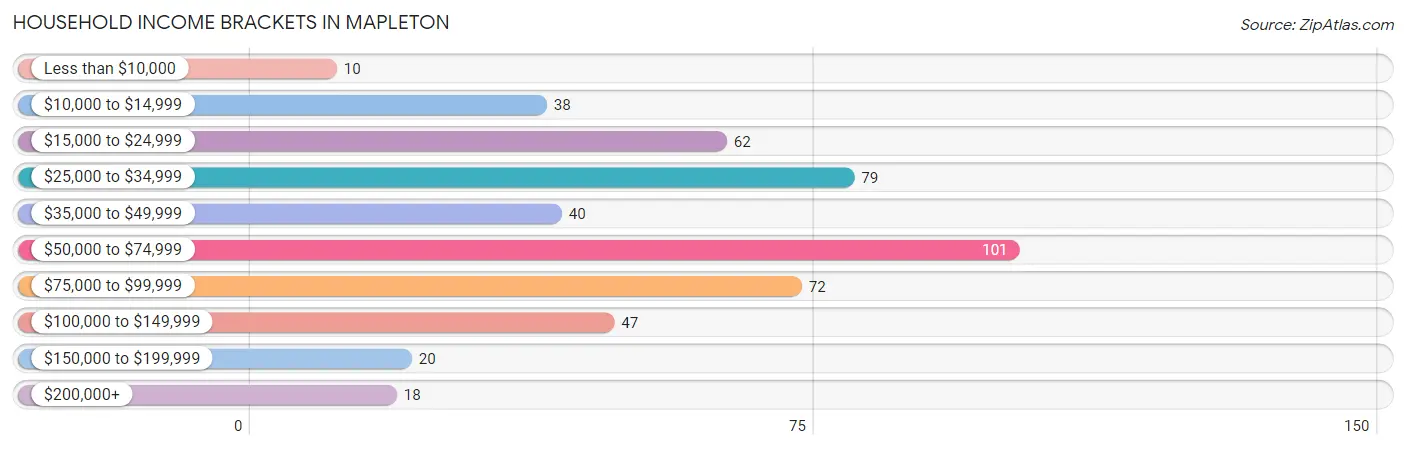
| Income Bracket | # Households | % Households |
| Less than $10,000 | 10 | 2.1% |
| $10,000 to $14,999 | 38 | 7.8% |
| $15,000 to $24,999 | 62 | 12.7% |
| $25,000 to $34,999 | 79 | 16.2% |
| $35,000 to $49,999 | 40 | 8.2% |
| $50,000 to $74,999 | 101 | 20.7% |
| $75,000 to $99,999 | 72 | 14.8% |
| $100,000 to $149,999 | 47 | 9.7% |
| $150,000 to $199,999 | 20 | 4.1% |
| $200,000+ | 18 | 3.7% |
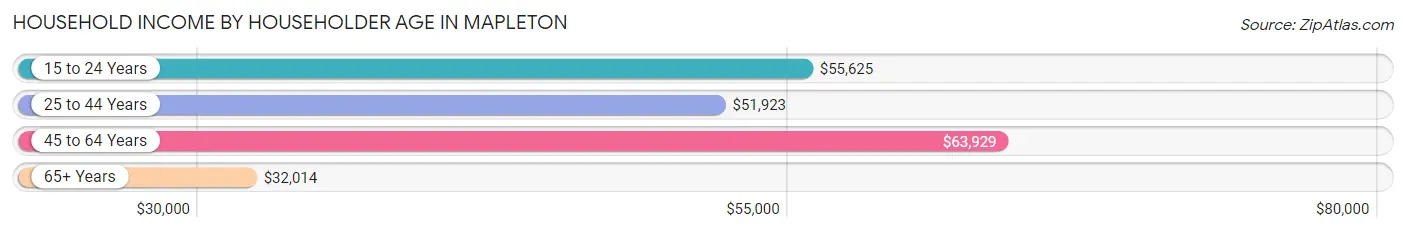
Household Income by Householder Age in Mapleton
The median household income in Mapleton is $51,648, with the highest median household income of $63,929 found in the 45 to 64 years age bracket for the primary householder. A total of 196 households (40.3%) fall into this category. Meanwhile, the 65+ years age bracket for the primary householder has the lowest median household income of $32,014, with 175 households (35.9%) in this group.
| Income Bracket | # Households | Median Income |
| 15 to 24 Years | 22 (4.5%) | $55,625 |
| 25 to 44 Years | 94 (19.3%) | $51,923 |
| 45 to 64 Years | 196 (40.3%) | $63,929 |
| 65+ Years | 175 (35.9%) | $32,014 |
| Total | 487 (100.0%) | $51,648 |
Poverty in Mapleton
Income Below Poverty by Sex and Age in Mapleton
With 10.4% poverty level for males and 11.5% for females among the residents of Mapleton, 6 to 11 year old males and 18 to 24 year old females are the most vulnerable to poverty, with 13 males (48.1%) and 9 females (40.9%) in their respective age groups living below the poverty level.
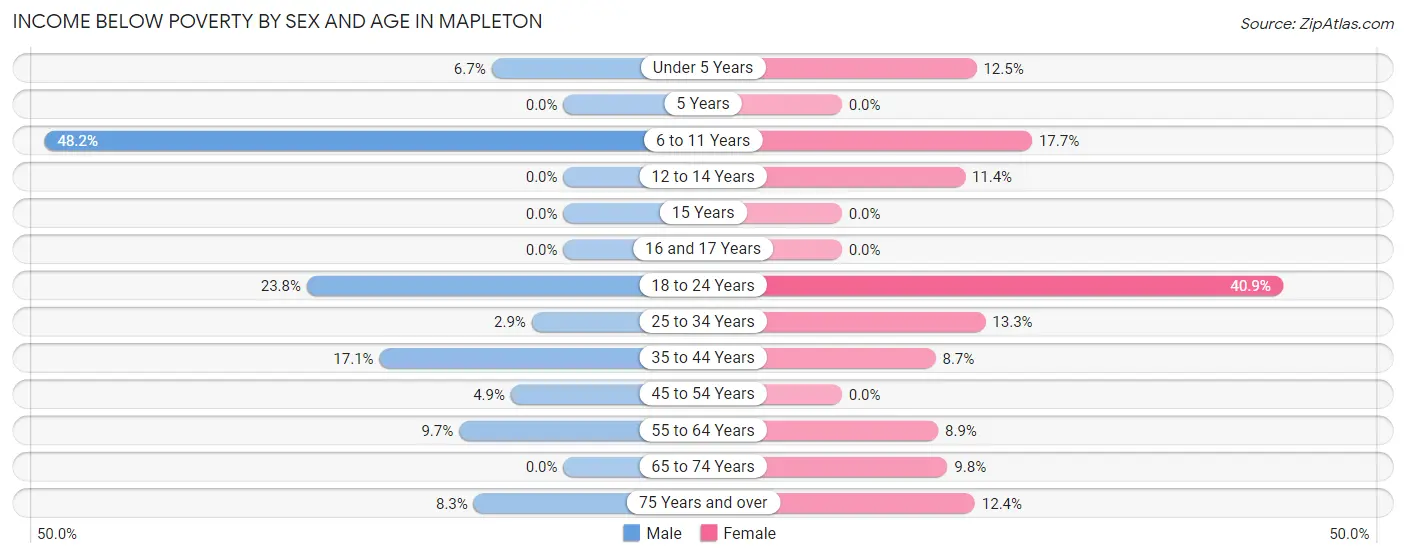
| Age Bracket | Male | Female |
| Under 5 Years | 2 (6.7%) | 2 (12.5%) |
| 5 Years | 0 (0.0%) | 0 (0.0%) |
| 6 to 11 Years | 13 (48.1%) | 3 (17.6%) |
| 12 to 14 Years | 0 (0.0%) | 4 (11.4%) |
| 15 Years | 0 (0.0%) | 0 (0.0%) |
| 16 and 17 Years | 0 (0.0%) | 0 (0.0%) |
| 18 to 24 Years | 5 (23.8%) | 9 (40.9%) |
| 25 to 34 Years | 1 (2.9%) | 6 (13.3%) |
| 35 to 44 Years | 7 (17.1%) | 4 (8.7%) |
| 45 to 54 Years | 2 (4.9%) | 0 (0.0%) |
| 55 to 64 Years | 9 (9.7%) | 11 (8.9%) |
| 65 to 74 Years | 0 (0.0%) | 5 (9.8%) |
| 75 Years and over | 3 (8.3%) | 10 (12.3%) |
| Total | 42 (10.4%) | 54 (11.5%) |
Income Above Poverty by Sex and Age in Mapleton
According to the poverty statistics in Mapleton, males aged 5 years and females aged 16 and 17 years are the age groups that are most secure financially, with 100.0% of males and 100.0% of females in these age groups living above the poverty line.
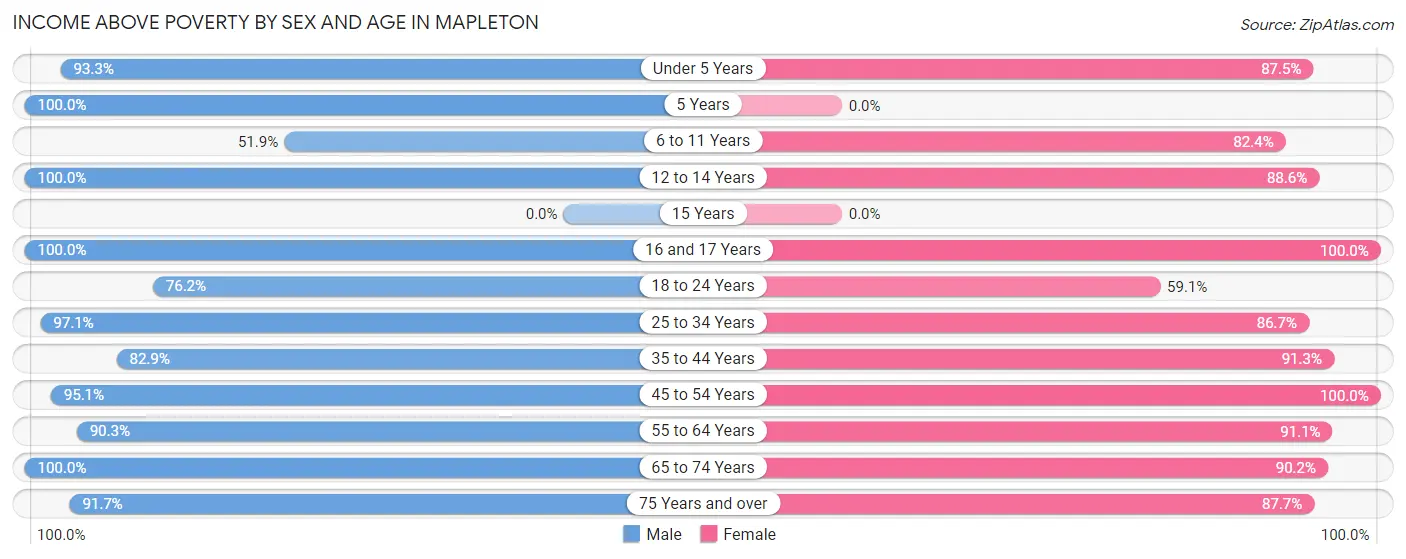
| Age Bracket | Male | Female |
| Under 5 Years | 28 (93.3%) | 14 (87.5%) |
| 5 Years | 7 (100.0%) | 0 (0.0%) |
| 6 to 11 Years | 14 (51.8%) | 14 (82.4%) |
| 12 to 14 Years | 1 (100.0%) | 31 (88.6%) |
| 15 Years | 0 (0.0%) | 0 (0.0%) |
| 16 and 17 Years | 9 (100.0%) | 3 (100.0%) |
| 18 to 24 Years | 16 (76.2%) | 13 (59.1%) |
| 25 to 34 Years | 33 (97.1%) | 39 (86.7%) |
| 35 to 44 Years | 34 (82.9%) | 42 (91.3%) |
| 45 to 54 Years | 39 (95.1%) | 30 (100.0%) |
| 55 to 64 Years | 84 (90.3%) | 112 (91.1%) |
| 65 to 74 Years | 64 (100.0%) | 46 (90.2%) |
| 75 Years and over | 33 (91.7%) | 71 (87.6%) |
| Total | 362 (89.6%) | 415 (88.5%) |
Income Below Poverty Among Married-Couple Families in Mapleton
The poverty statistics for married-couple families in Mapleton show that 3.4% or 7 of the total 207 families live below the poverty line. Families with 3 or 4 children have the highest poverty rate of 26.7%, comprising of 4 families. On the other hand, families with 1 or 2 children have the lowest poverty rate of 0.0%, which includes 0 families.
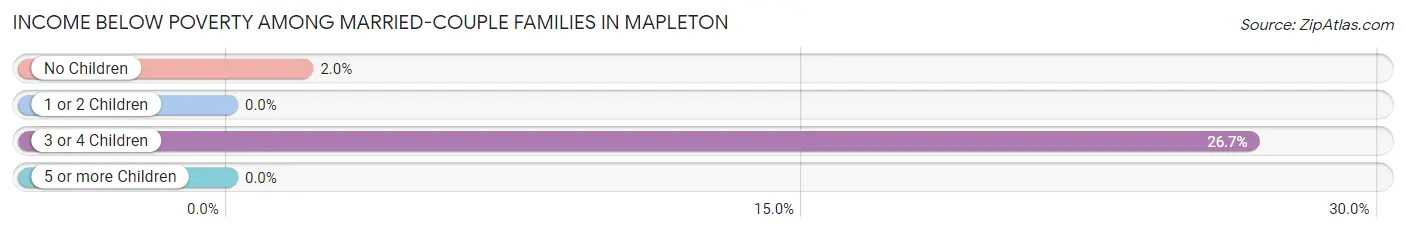
| Children | Above Poverty | Below Poverty |
| No Children | 149 (98.0%) | 3 (2.0%) |
| 1 or 2 Children | 40 (100.0%) | 0 (0.0%) |
| 3 or 4 Children | 11 (73.3%) | 4 (26.7%) |
| 5 or more Children | 0 (0.0%) | 0 (0.0%) |
| Total | 200 (96.6%) | 7 (3.4%) |
Income Below Poverty Among Single-Parent Households in Mapleton
According to the poverty data in Mapleton, 9.1% or 1 single-father households and 7.3% or 3 single-mother households are living below the poverty line. Among single-father households, those with 5 or more children have the highest poverty rate, with 1 households (100.0%) experiencing poverty. Likewise, among single-mother households, those with no children have the highest poverty rate, with 3 households (23.1%) falling below the poverty line.
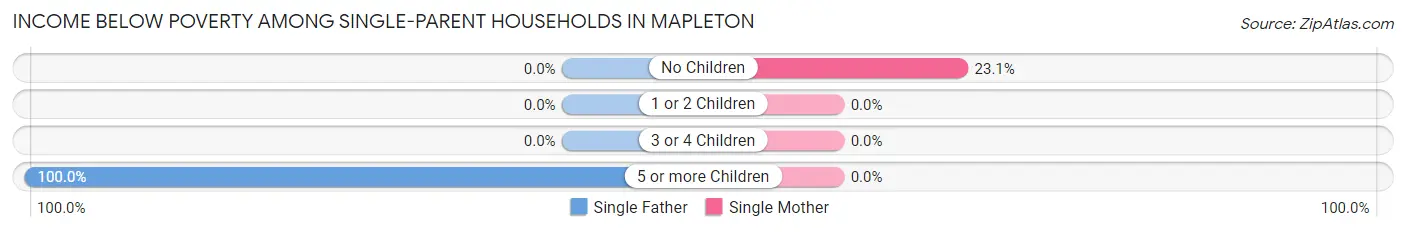
| Children | Single Father | Single Mother |
| No Children | 0 (0.0%) | 3 (23.1%) |
| 1 or 2 Children | 0 (0.0%) | 0 (0.0%) |
| 3 or 4 Children | 0 (0.0%) | 0 (0.0%) |
| 5 or more Children | 1 (100.0%) | 0 (0.0%) |
| Total | 1 (9.1%) | 3 (7.3%) |
Income Below Poverty Among Married-Couple vs Single-Parent Households in Mapleton
The poverty data for Mapleton shows that 7 of the married-couple family households (3.4%) and 4 of the single-parent households (7.7%) are living below the poverty level. Within the married-couple family households, those with 3 or 4 children have the highest poverty rate, with 4 households (26.7%) falling below the poverty line. Among the single-parent households, those with 5 or more children have the highest poverty rate, with 1 household (100.0%) living below poverty.
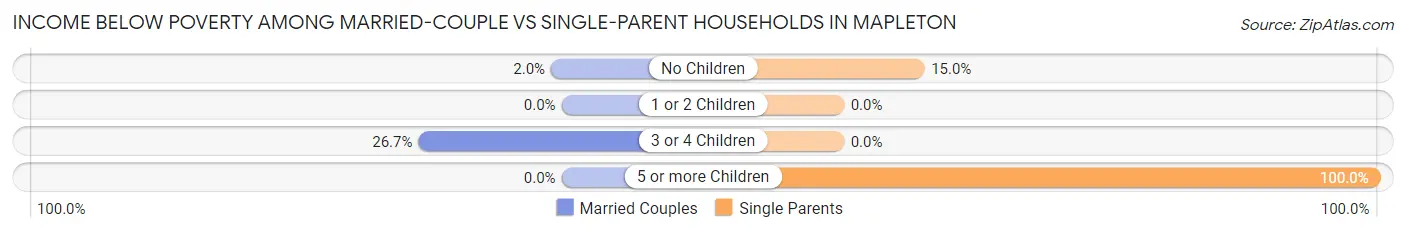
| Children | Married-Couple Families | Single-Parent Households |
| No Children | 3 (2.0%) | 3 (15.0%) |
| 1 or 2 Children | 0 (0.0%) | 0 (0.0%) |
| 3 or 4 Children | 4 (26.7%) | 0 (0.0%) |
| 5 or more Children | 0 (0.0%) | 1 (100.0%) |
| Total | 7 (3.4%) | 4 (7.7%) |
Race in Mapleton
The most populous races in Mapleton are White / Caucasian (885 | 95.9%), Two or more Races (38 | 4.1%), and Hispanic or Latino (35 | 3.8%).
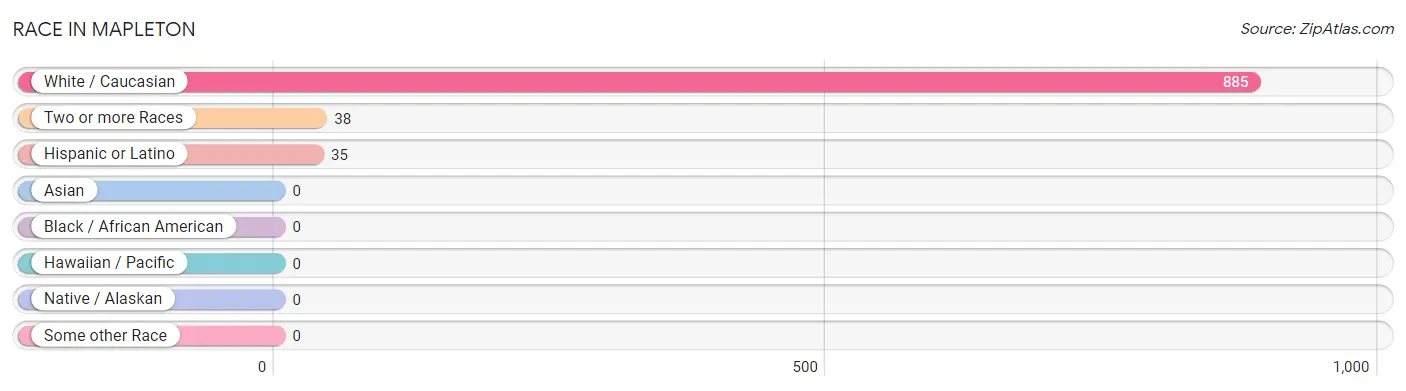
| Race | # Population | % Population |
| Asian | 0 | 0.0% |
| Black / African American | 0 | 0.0% |
| Hawaiian / Pacific | 0 | 0.0% |
| Hispanic or Latino | 35 | 3.8% |
| Native / Alaskan | 0 | 0.0% |
| White / Caucasian | 885 | 95.9% |
| Two or more Races | 38 | 4.1% |
| Some other Race | 0 | 0.0% |
| Total | 923 | 100.0% |
Ancestry in Mapleton
The most populous ancestries reported in Mapleton are German (422 | 45.7%), Irish (118 | 12.8%), English (52 | 5.6%), American (45 | 4.9%), and Swedish (43 | 4.7%), together accounting for 73.7% of all Mapleton residents.
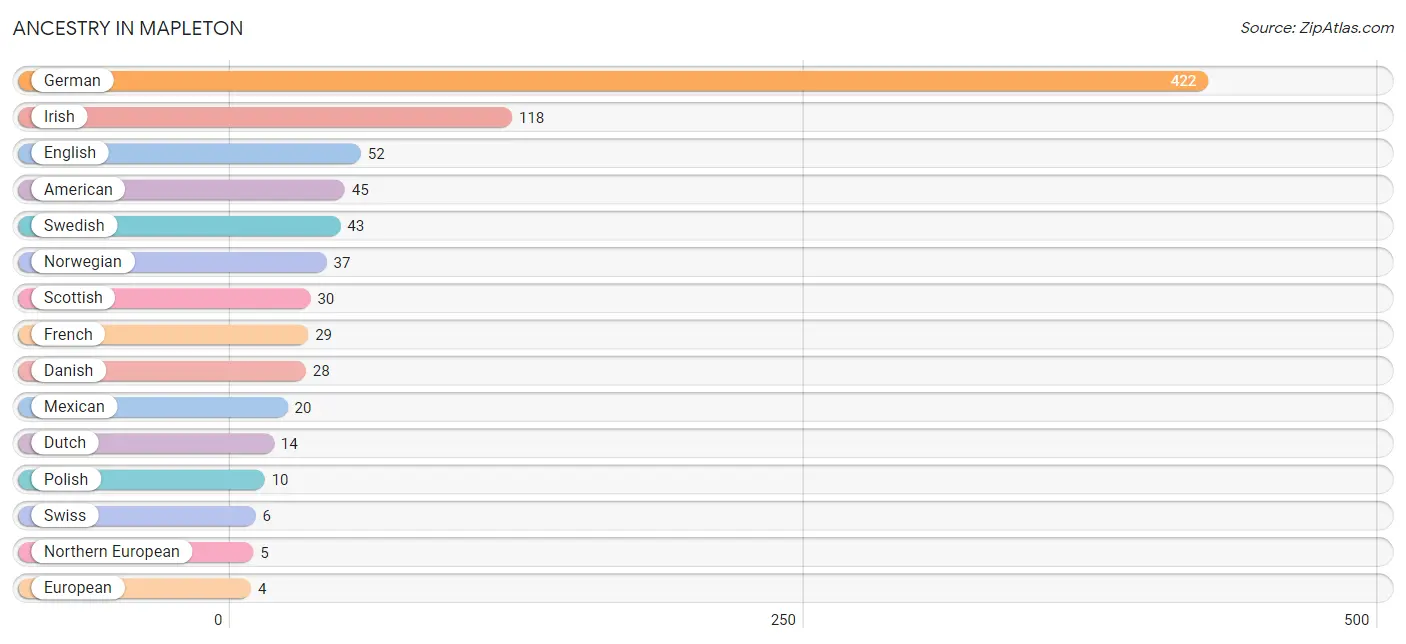
| Ancestry | # Population | % Population |
| American | 45 | 4.9% |
| Central American | 3 | 0.3% |
| Costa Rican | 3 | 0.3% |
| Danish | 28 | 3.0% |
| Dutch | 14 | 1.5% |
| English | 52 | 5.6% |
| European | 4 | 0.4% |
| French | 29 | 3.1% |
| French Canadian | 3 | 0.3% |
| German | 422 | 45.7% |
| Irish | 118 | 12.8% |
| Mexican | 20 | 2.2% |
| Northern European | 5 | 0.5% |
| Norwegian | 37 | 4.0% |
| Polish | 10 | 1.1% |
| Scottish | 30 | 3.3% |
| Swedish | 43 | 4.7% |
| Swiss | 6 | 0.6% | View All 18 Rows |
Immigrants in Mapleton
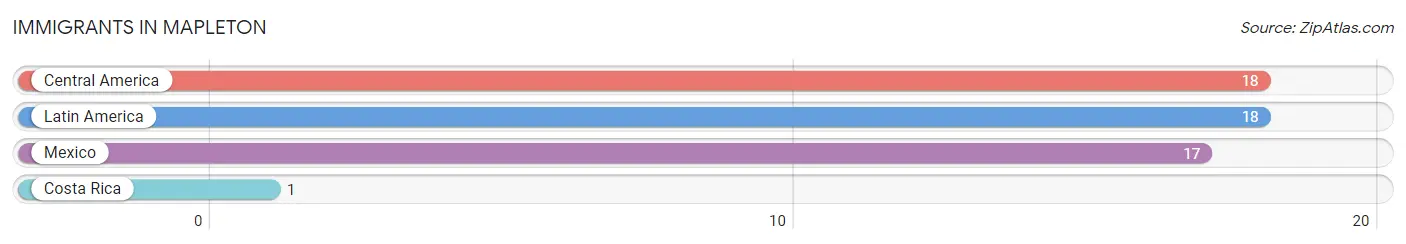
The most numerous immigrant groups reported in Mapleton came from Central America (18 | 1.9%), Latin America (18 | 1.9%), Mexico (17 | 1.8%), and Costa Rica (1 | 0.1%), together accounting for 5.8% of all Mapleton residents.
| Immigration Origin | # Population | % Population |
| Central America | 18 | 1.9% |
| Costa Rica | 1 | 0.1% |
| Latin America | 18 | 1.9% |
| Mexico | 17 | 1.8% | View All 4 Rows |
Sex and Age in Mapleton
Sex and Age in Mapleton
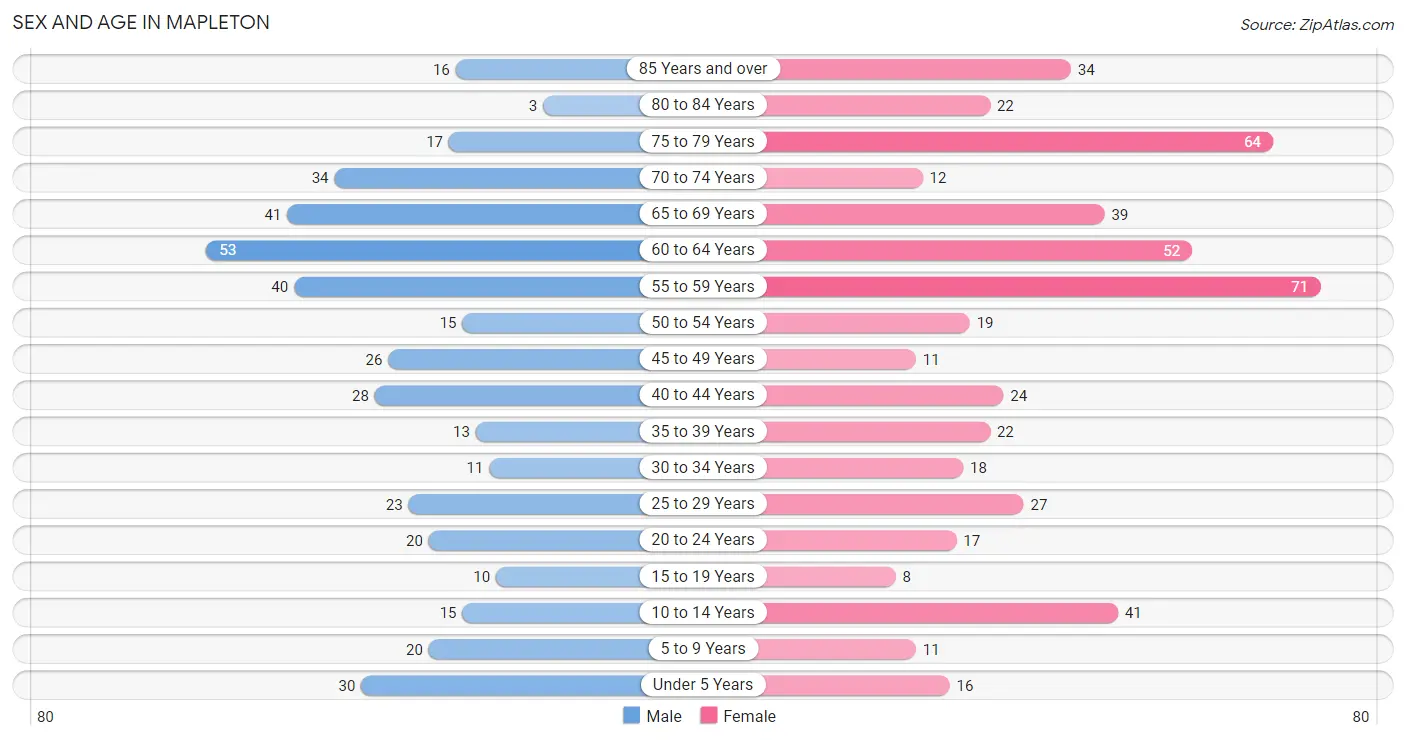
The most populous age groups in Mapleton are 60 to 64 Years (53 | 12.8%) for men and 55 to 59 Years (71 | 14.0%) for women.
| Age Bracket | Male | Female |
| Under 5 Years | 30 (7.2%) | 16 (3.2%) |
| 5 to 9 Years | 20 (4.8%) | 11 (2.2%) |
| 10 to 14 Years | 15 (3.6%) | 41 (8.1%) |
| 15 to 19 Years | 10 (2.4%) | 8 (1.6%) |
| 20 to 24 Years | 20 (4.8%) | 17 (3.4%) |
| 25 to 29 Years | 23 (5.5%) | 27 (5.3%) |
| 30 to 34 Years | 11 (2.6%) | 18 (3.5%) |
| 35 to 39 Years | 13 (3.1%) | 22 (4.3%) |
| 40 to 44 Years | 28 (6.8%) | 24 (4.7%) |
| 45 to 49 Years | 26 (6.3%) | 11 (2.2%) |
| 50 to 54 Years | 15 (3.6%) | 19 (3.7%) |
| 55 to 59 Years | 40 (9.6%) | 71 (14.0%) |
| 60 to 64 Years | 53 (12.8%) | 52 (10.2%) |
| 65 to 69 Years | 41 (9.9%) | 39 (7.7%) |
| 70 to 74 Years | 34 (8.2%) | 12 (2.4%) |
| 75 to 79 Years | 17 (4.1%) | 64 (12.6%) |
| 80 to 84 Years | 3 (0.7%) | 22 (4.3%) |
| 85 Years and over | 16 (3.9%) | 34 (6.7%) |
| Total | 415 (100.0%) | 508 (100.0%) |
Families and Households in Mapleton
Median Family Size in Mapleton
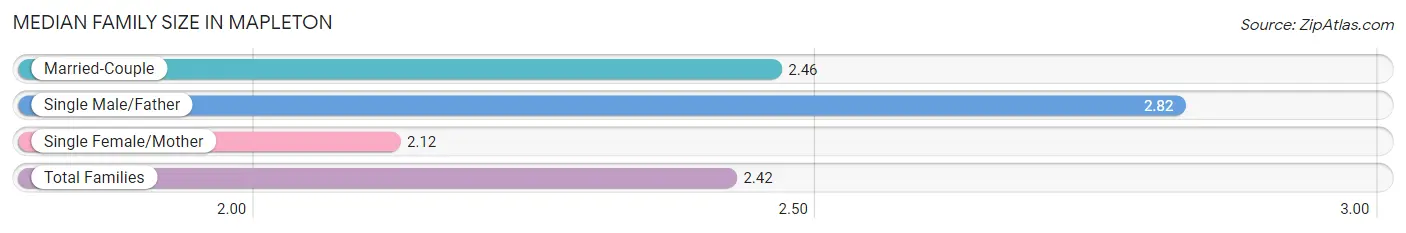
The median family size in Mapleton is 2.42 persons per family, with single male/father families (11 | 4.3%) accounting for the largest median family size of 2.82 persons per family. On the other hand, single female/mother families (41 | 15.8%) represent the smallest median family size with 2.12 persons per family.
| Family Type | # Families | Family Size |
| Married-Couple | 207 (79.9%) | 2.46 |
| Single Male/Father | 11 (4.3%) | 2.82 |
| Single Female/Mother | 41 (15.8%) | 2.12 |
| Total Families | 259 (100.0%) | 2.42 |
Median Household Size in Mapleton
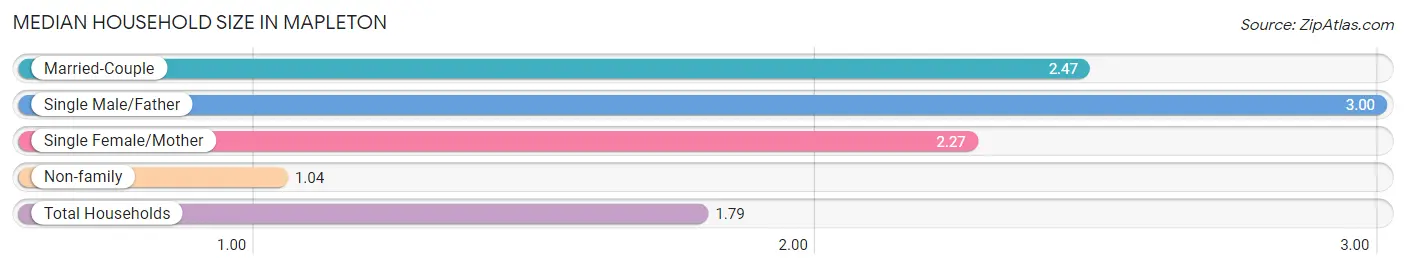
The median household size in Mapleton is 1.79 persons per household, with single male/father households (11 | 2.3%) accounting for the largest median household size of 3 persons per household. non-family households (228 | 46.8%) represent the smallest median household size with 1.04 persons per household.
| Household Type | # Households | Household Size |
| Married-Couple | 207 (42.5%) | 2.47 |
| Single Male/Father | 11 (2.3%) | 3.00 |
| Single Female/Mother | 41 (8.4%) | 2.27 |
| Non-family | 228 (46.8%) | 1.04 |
| Total Households | 487 (100.0%) | 1.79 |
Household Size by Marriage Status in Mapleton
Out of a total of 487 households in Mapleton, 259 (53.2%) are family households, while 228 (46.8%) are nonfamily households. The most numerous type of family households are 2-person households, comprising 170, and the most common type of nonfamily households are 1-person households, comprising 220.
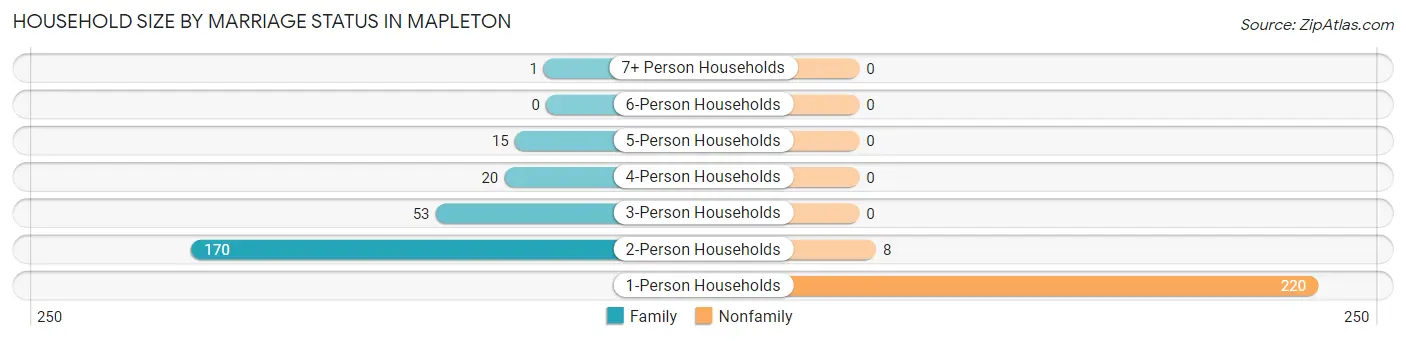
| Household Size | Family Households | Nonfamily Households |
| 1-Person Households | - | 220 (45.2%) |
| 2-Person Households | 170 (34.9%) | 8 (1.6%) |
| 3-Person Households | 53 (10.9%) | 0 (0.0%) |
| 4-Person Households | 20 (4.1%) | 0 (0.0%) |
| 5-Person Households | 15 (3.1%) | 0 (0.0%) |
| 6-Person Households | 0 (0.0%) | 0 (0.0%) |
| 7+ Person Households | 1 (0.2%) | 0 (0.0%) |
| Total | 259 (53.2%) | 228 (46.8%) |
Female Fertility in Mapleton
Fertility by Age in Mapleton
Average fertility rate in Mapleton is 155.0 births per 1,000 women. Women in the age bracket of 20 to 34 years have the highest fertility rate with 226.0 births per 1,000 women. Women in the age bracket of 20 to 34 years acount for 70.0% of all women with births.
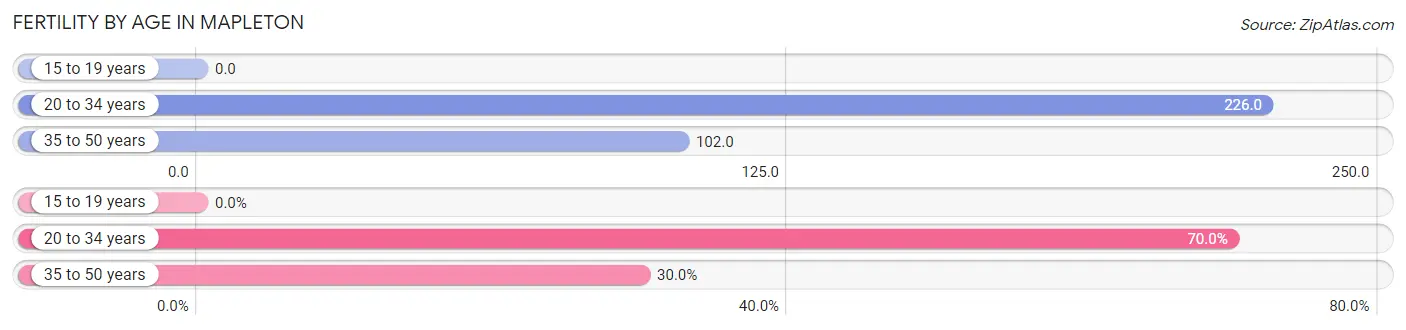
| Age Bracket | Women with Births | Births / 1,000 Women |
| 15 to 19 years | 0 (0.0%) | 0.0 |
| 20 to 34 years | 14 (70.0%) | 226.0 |
| 35 to 50 years | 6 (30.0%) | 102.0 |
| Total | 20 (100.0%) | 155.0 |
Fertility by Age by Marriage Status in Mapleton
60.0% of women with births (20) in Mapleton are married. The highest percentage of unmarried women with births falls into 20 to 34 years age bracket with 42.9% of them unmarried at the time of birth, while the lowest percentage of unmarried women with births belong to 35 to 50 years age bracket with 33.3% of them unmarried.
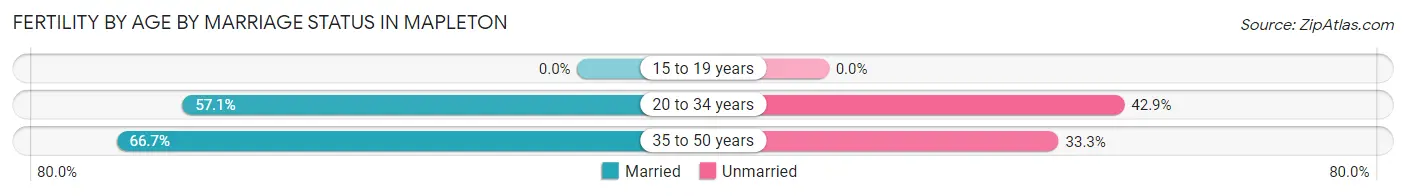
| Age Bracket | Married | Unmarried |
| 15 to 19 years | 0 (0.0%) | 0 (0.0%) |
| 20 to 34 years | 8 (57.1%) | 6 (42.9%) |
| 35 to 50 years | 4 (66.7%) | 2 (33.3%) |
| Total | 12 (60.0%) | 8 (40.0%) |
Fertility by Education in Mapleton

| Educational Attainment | Women with Births | Births / 1,000 Women |
| Less than High School | 0 (0.0%) | 0.0 |
| High School Diploma | 4 (20.0%) | 89.0 |
| College or Associate's Degree | 4 (20.0%) | 148.0 |
| Bachelor's Degree | 4 (20.0%) | 114.0 |
| Graduate Degree | 8 (40.0%) | 500.0 |
| Total | 20 (100.0%) | 155.0 |
Fertility by Education by Marriage Status in Mapleton
40.0% of women with births in Mapleton are unmarried. Women with the educational attainment of bachelor's degree are most likely to be married with 100.0% of them married at childbirth, while women with the educational attainment of high school diploma are least likely to be married with 100.0% of them unmarried at childbirth.
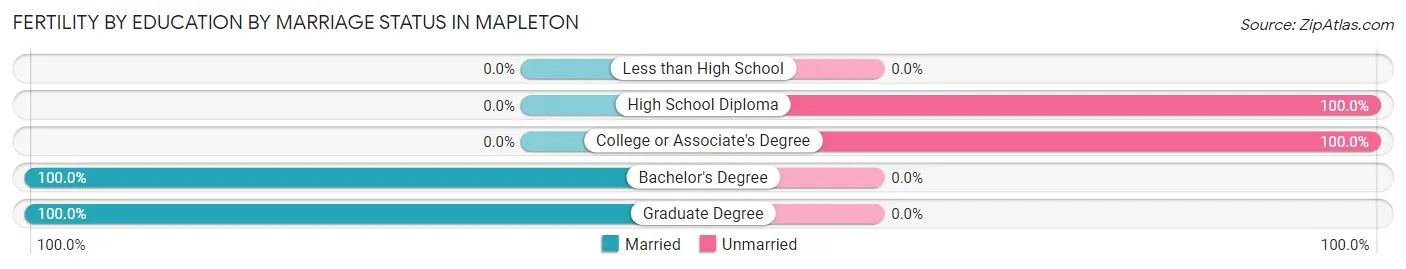
| Educational Attainment | Married | Unmarried |
| Less than High School | 0 (0.0%) | 0 (0.0%) |
| High School Diploma | 0 (0.0%) | 4 (100.0%) |
| College or Associate's Degree | 0 (0.0%) | 4 (100.0%) |
| Bachelor's Degree | 4 (100.0%) | 0 (0.0%) |
| Graduate Degree | 8 (100.0%) | 0 (0.0%) |
| Total | 12 (60.0%) | 8 (40.0%) |
Employment Characteristics in Mapleton
Employment by Class of Employer in Mapleton
Among the 380 employed individuals in Mapleton, private company employees (241 | 63.4%), local government employees (48 | 12.6%), and self-employed (not incorporated) (28 | 7.4%) make up the most common classes of employment.
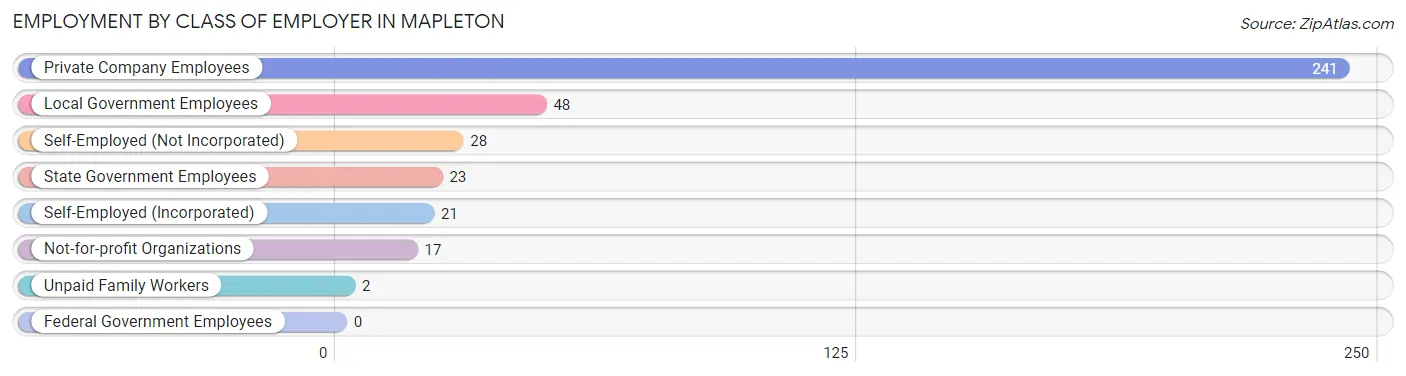
| Employer Class | # Employees | % Employees |
| Private Company Employees | 241 | 63.4% |
| Self-Employed (Incorporated) | 21 | 5.5% |
| Self-Employed (Not Incorporated) | 28 | 7.4% |
| Not-for-profit Organizations | 17 | 4.5% |
| Local Government Employees | 48 | 12.6% |
| State Government Employees | 23 | 6.0% |
| Federal Government Employees | 0 | 0.0% |
| Unpaid Family Workers | 2 | 0.5% |
| Total | 380 | 100.0% |
Employment Status by Age in Mapleton
According to the labor force statistics for Mapleton, out of the total population over 16 years of age (790), 51.4% or 406 individuals are in the labor force, with 2.5% or 10 of them unemployed. The age group with the highest labor force participation rate is 25 to 29 years, with 100.0% or 50 individuals in the labor force. Within the labor force, the 55 to 59 years age range has the highest percentage of unemployed individuals, with 8.8% or 6 of them being unemployed.
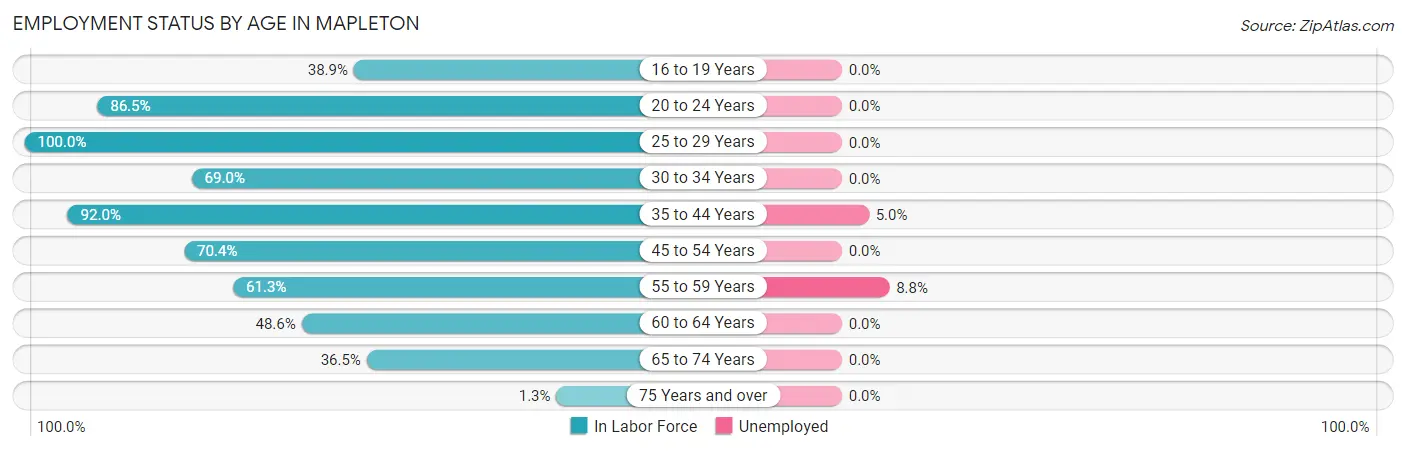
| Age Bracket | In Labor Force | Unemployed |
| 16 to 19 Years | 7 (38.9%) | 0 (0.0%) |
| 20 to 24 Years | 32 (86.5%) | 0 (0.0%) |
| 25 to 29 Years | 50 (100.0%) | 0 (0.0%) |
| 30 to 34 Years | 20 (69.0%) | 0 (0.0%) |
| 35 to 44 Years | 80 (92.0%) | 4 (5.0%) |
| 45 to 54 Years | 50 (70.4%) | 0 (0.0%) |
| 55 to 59 Years | 68 (61.3%) | 6 (8.8%) |
| 60 to 64 Years | 51 (48.6%) | 0 (0.0%) |
| 65 to 74 Years | 46 (36.5%) | 0 (0.0%) |
| 75 Years and over | 2 (1.3%) | 0 (0.0%) |
| Total | 406 (51.4%) | 10 (2.5%) |
Employment Status by Educational Attainment in Mapleton
According to labor force statistics for Mapleton, 70.4% of individuals (319) out of the total population between 25 and 64 years of age (453) are in the labor force, with 3.1% or 10 of them being unemployed. The group with the highest labor force participation rate are those with the educational attainment of bachelor's degree or higher, with 83.5% or 91 individuals in the labor force. Within the labor force, individuals with high school diploma education have the highest percentage of unemployment, with 6.4% or 6 of them being unemployed.
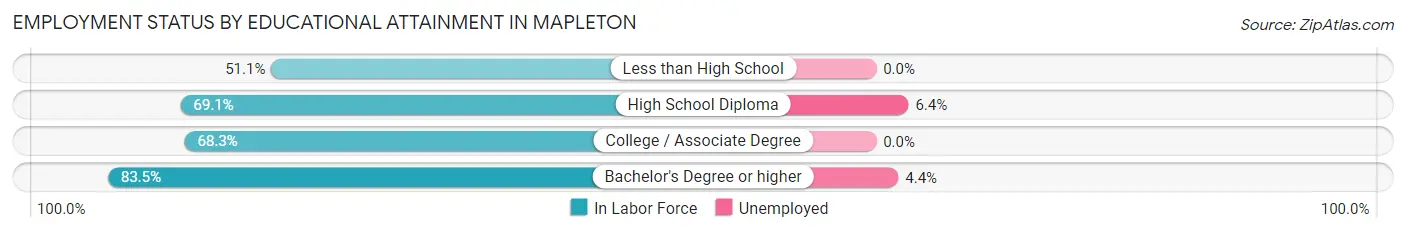
| Educational Attainment | In Labor Force | Unemployed |
| Less than High School | 24 (51.1%) | 0 (0.0%) |
| High School Diploma | 94 (69.1%) | 9 (6.4%) |
| College / Associate Degree | 110 (68.3%) | 0 (0.0%) |
| Bachelor's Degree or higher | 91 (83.5%) | 5 (4.4%) |
| Total | 319 (70.4%) | 14 (3.1%) |
Employment Occupations by Sex in Mapleton
Management, Business, Science and Arts Occupations
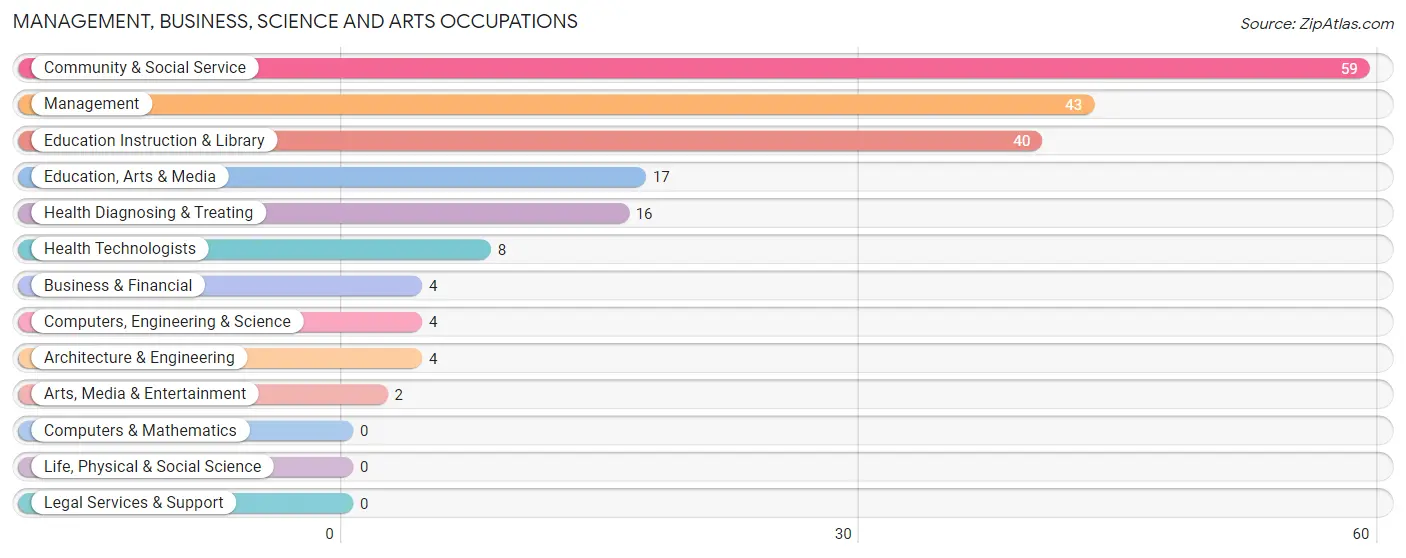
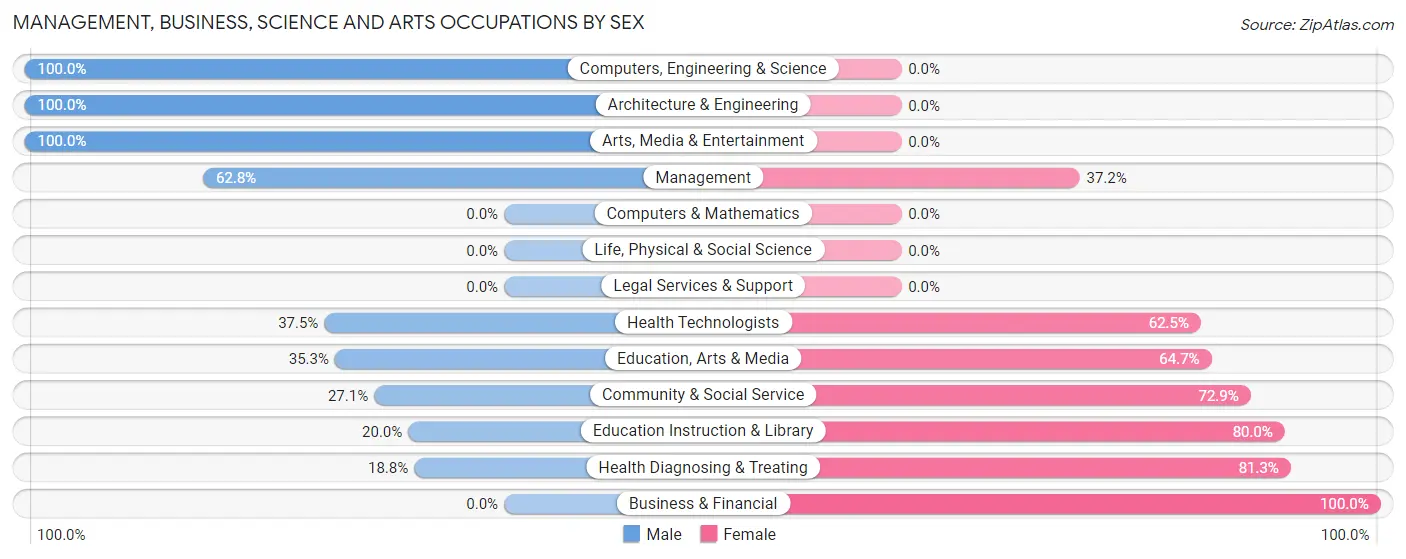
The most common Management, Business, Science and Arts occupations in Mapleton are Community & Social Service (59 | 14.9%), Management (43 | 10.9%), Education Instruction & Library (40 | 10.1%), Education, Arts & Media (17 | 4.3%), and Health Diagnosing & Treating (16 | 4.0%).
Management, Business, Science and Arts Occupations by Sex
Within the Management, Business, Science and Arts occupations in Mapleton, the most male-oriented occupations are Computers, Engineering & Science (100.0%), Architecture & Engineering (100.0%), and Arts, Media & Entertainment (100.0%), while the most female-oriented occupations are Business & Financial (100.0%), Health Diagnosing & Treating (81.2%), and Education Instruction & Library (80.0%).
| Occupation | Male | Female |
| Management | 27 (62.8%) | 16 (37.2%) |
| Business & Financial | 0 (0.0%) | 4 (100.0%) |
| Computers, Engineering & Science | 4 (100.0%) | 0 (0.0%) |
| Computers & Mathematics | 0 (0.0%) | 0 (0.0%) |
| Architecture & Engineering | 4 (100.0%) | 0 (0.0%) |
| Life, Physical & Social Science | 0 (0.0%) | 0 (0.0%) |
| Community & Social Service | 16 (27.1%) | 43 (72.9%) |
| Education, Arts & Media | 6 (35.3%) | 11 (64.7%) |
| Legal Services & Support | 0 (0.0%) | 0 (0.0%) |
| Education Instruction & Library | 8 (20.0%) | 32 (80.0%) |
| Arts, Media & Entertainment | 2 (100.0%) | 0 (0.0%) |
| Health Diagnosing & Treating | 3 (18.8%) | 13 (81.2%) |
| Health Technologists | 3 (37.5%) | 5 (62.5%) |
| Total (Category) | 50 (39.7%) | 76 (60.3%) |
| Total (Overall) | 203 (51.3%) | 193 (48.7%) |
Services Occupations
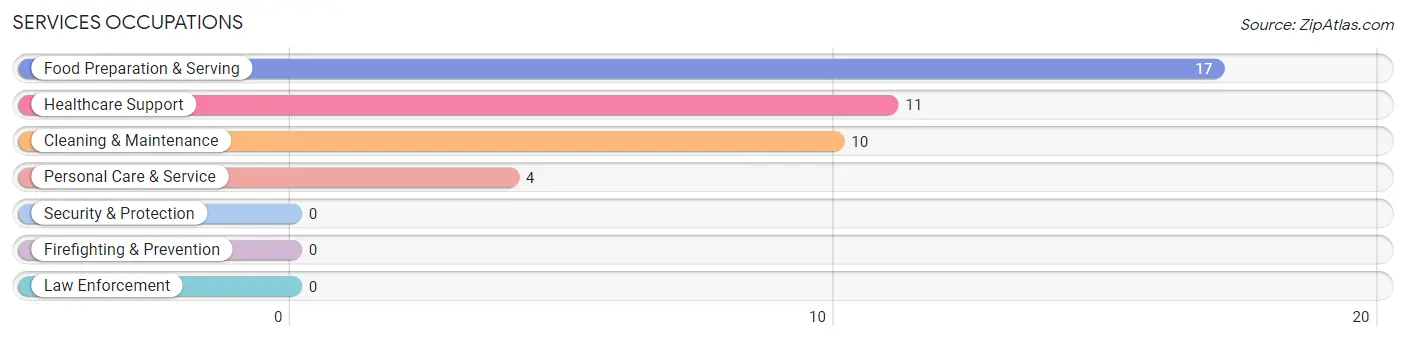
The most common Services occupations in Mapleton are Food Preparation & Serving (17 | 4.3%), Healthcare Support (11 | 2.8%), Cleaning & Maintenance (10 | 2.5%), and Personal Care & Service (4 | 1.0%).
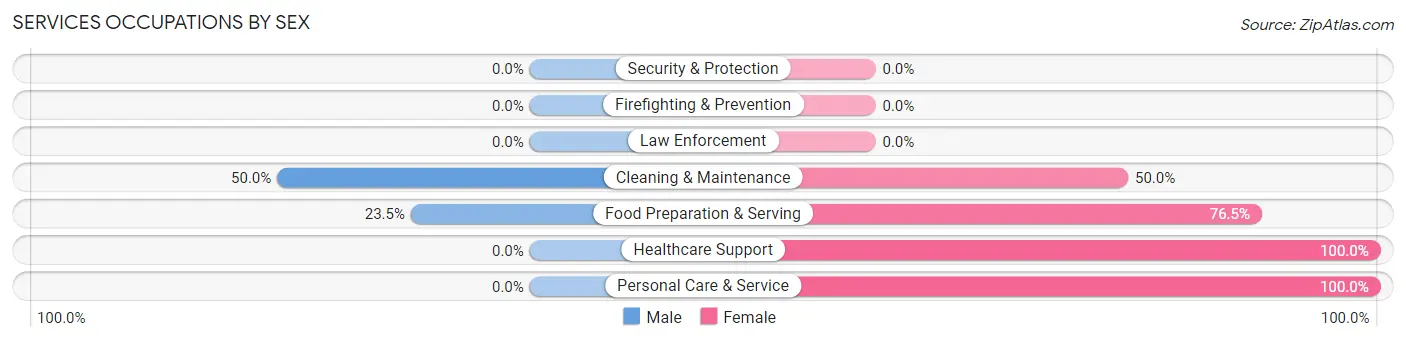
Services Occupations by Sex
Within the Services occupations in Mapleton, the most male-oriented occupations are Cleaning & Maintenance (50.0%), and Food Preparation & Serving (23.5%), while the most female-oriented occupations are Healthcare Support (100.0%), Personal Care & Service (100.0%), and Food Preparation & Serving (76.5%).
| Occupation | Male | Female |
| Healthcare Support | 0 (0.0%) | 11 (100.0%) |
| Security & Protection | 0 (0.0%) | 0 (0.0%) |
| Firefighting & Prevention | 0 (0.0%) | 0 (0.0%) |
| Law Enforcement | 0 (0.0%) | 0 (0.0%) |
| Food Preparation & Serving | 4 (23.5%) | 13 (76.5%) |
| Cleaning & Maintenance | 5 (50.0%) | 5 (50.0%) |
| Personal Care & Service | 0 (0.0%) | 4 (100.0%) |
| Total (Category) | 9 (21.4%) | 33 (78.6%) |
| Total (Overall) | 203 (51.3%) | 193 (48.7%) |
Sales and Office Occupations
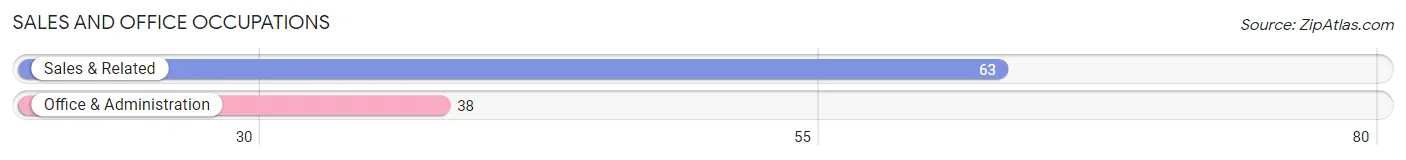
The most common Sales and Office occupations in Mapleton are Sales & Related (63 | 15.9%), and Office & Administration (38 | 9.6%).
Sales and Office Occupations by Sex
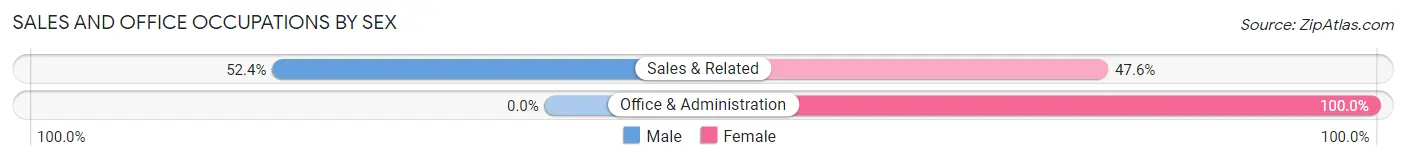
| Occupation | Male | Female |
| Sales & Related | 33 (52.4%) | 30 (47.6%) |
| Office & Administration | 0 (0.0%) | 38 (100.0%) |
| Total (Category) | 33 (32.7%) | 68 (67.3%) |
| Total (Overall) | 203 (51.3%) | 193 (48.7%) |
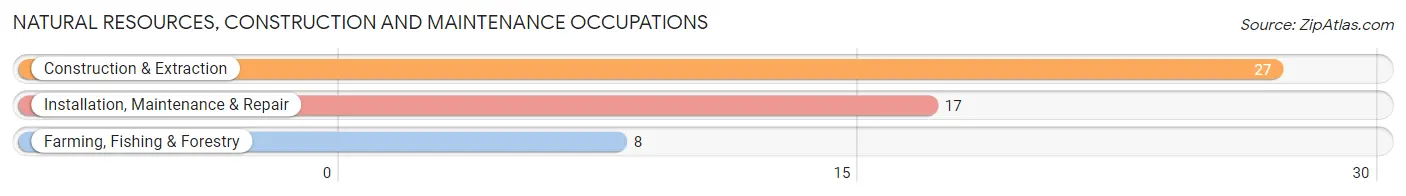
Natural Resources, Construction and Maintenance Occupations
The most common Natural Resources, Construction and Maintenance occupations in Mapleton are Construction & Extraction (27 | 6.8%), Installation, Maintenance & Repair (17 | 4.3%), and Farming, Fishing & Forestry (8 | 2.0%).
Natural Resources, Construction and Maintenance Occupations by Sex
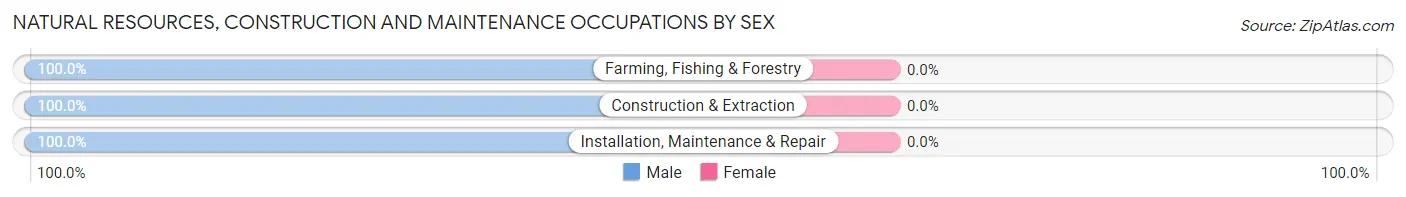
| Occupation | Male | Female |
| Farming, Fishing & Forestry | 8 (100.0%) | 0 (0.0%) |
| Construction & Extraction | 27 (100.0%) | 0 (0.0%) |
| Installation, Maintenance & Repair | 17 (100.0%) | 0 (0.0%) |
| Total (Category) | 52 (100.0%) | 0 (0.0%) |
| Total (Overall) | 203 (51.3%) | 193 (48.7%) |
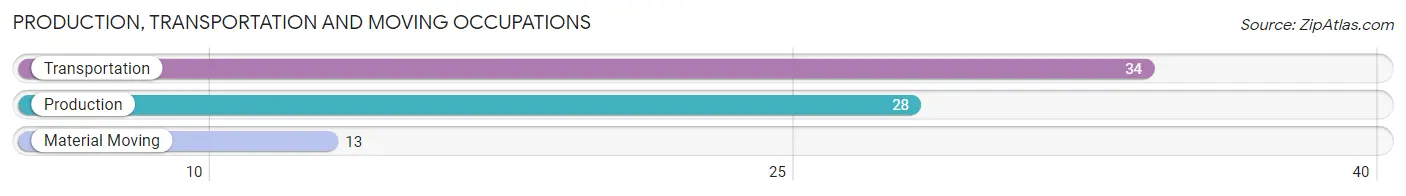
Production, Transportation and Moving Occupations
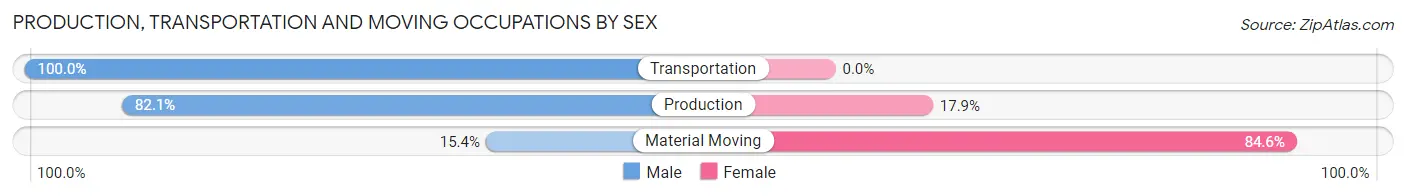
The most common Production, Transportation and Moving occupations in Mapleton are Transportation (34 | 8.6%), Production (28 | 7.1%), and Material Moving (13 | 3.3%).
Production, Transportation and Moving Occupations by Sex
| Occupation | Male | Female |
| Production | 23 (82.1%) | 5 (17.9%) |
| Transportation | 34 (100.0%) | 0 (0.0%) |
| Material Moving | 2 (15.4%) | 11 (84.6%) |
| Total (Category) | 59 (78.7%) | 16 (21.3%) |
| Total (Overall) | 203 (51.3%) | 193 (48.7%) |
Employment Industries by Sex in Mapleton
Employment Industries in Mapleton
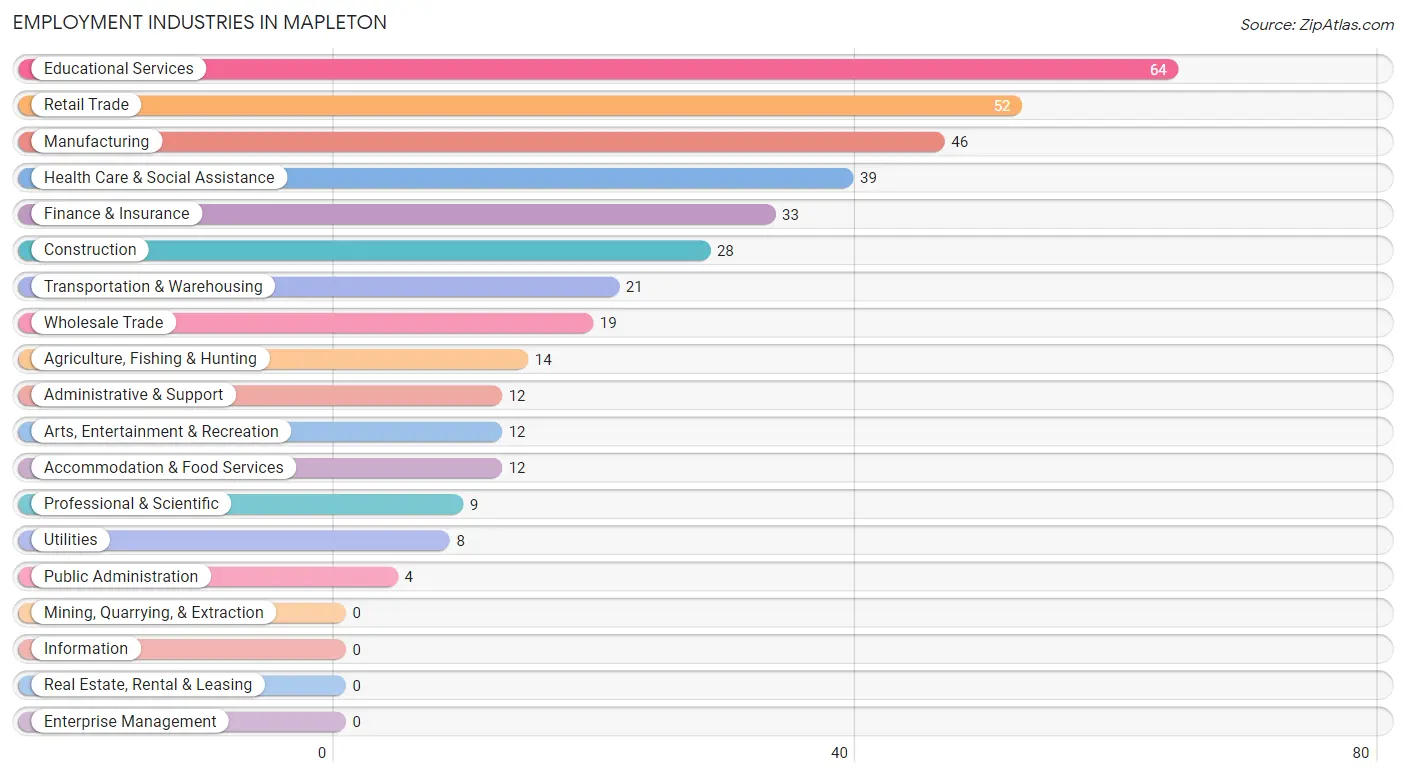
The major employment industries in Mapleton include Educational Services (64 | 16.2%), Retail Trade (52 | 13.1%), Manufacturing (46 | 11.6%), Health Care & Social Assistance (39 | 9.9%), and Finance & Insurance (33 | 8.3%).
Employment Industries by Sex in Mapleton
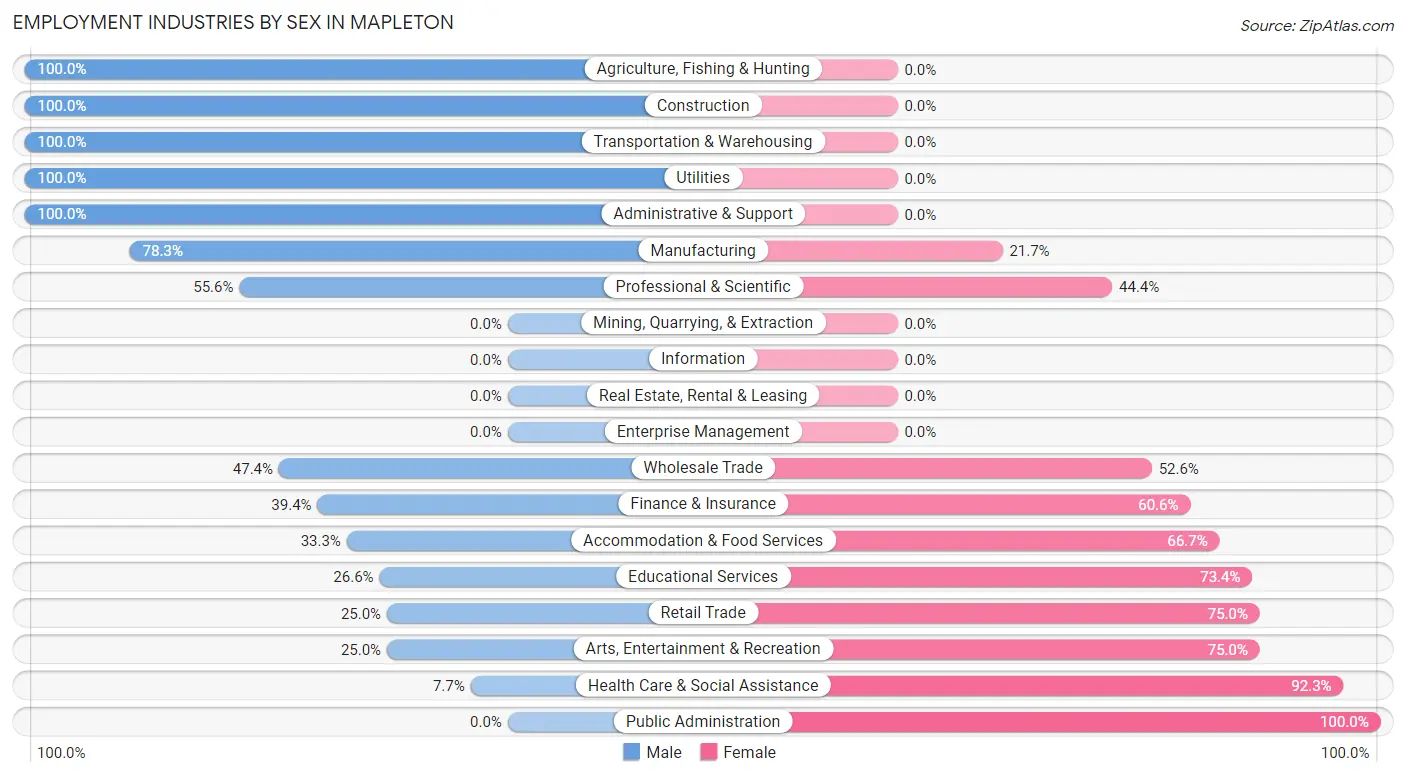
The Mapleton industries that see more men than women are Agriculture, Fishing & Hunting (100.0%), Construction (100.0%), and Transportation & Warehousing (100.0%), whereas the industries that tend to have a higher number of women are Public Administration (100.0%), Health Care & Social Assistance (92.3%), and Retail Trade (75.0%).
| Industry | Male | Female |
| Agriculture, Fishing & Hunting | 14 (100.0%) | 0 (0.0%) |
| Mining, Quarrying, & Extraction | 0 (0.0%) | 0 (0.0%) |
| Construction | 28 (100.0%) | 0 (0.0%) |
| Manufacturing | 36 (78.3%) | 10 (21.7%) |
| Wholesale Trade | 9 (47.4%) | 10 (52.6%) |
| Retail Trade | 13 (25.0%) | 39 (75.0%) |
| Transportation & Warehousing | 21 (100.0%) | 0 (0.0%) |
| Utilities | 8 (100.0%) | 0 (0.0%) |
| Information | 0 (0.0%) | 0 (0.0%) |
| Finance & Insurance | 13 (39.4%) | 20 (60.6%) |
| Real Estate, Rental & Leasing | 0 (0.0%) | 0 (0.0%) |
| Professional & Scientific | 5 (55.6%) | 4 (44.4%) |
| Enterprise Management | 0 (0.0%) | 0 (0.0%) |
| Administrative & Support | 12 (100.0%) | 0 (0.0%) |
| Educational Services | 17 (26.6%) | 47 (73.4%) |
| Health Care & Social Assistance | 3 (7.7%) | 36 (92.3%) |
| Arts, Entertainment & Recreation | 3 (25.0%) | 9 (75.0%) |
| Accommodation & Food Services | 4 (33.3%) | 8 (66.7%) |
| Public Administration | 0 (0.0%) | 4 (100.0%) |
| Total | 203 (51.3%) | 193 (48.7%) |
Education in Mapleton
School Enrollment in Mapleton
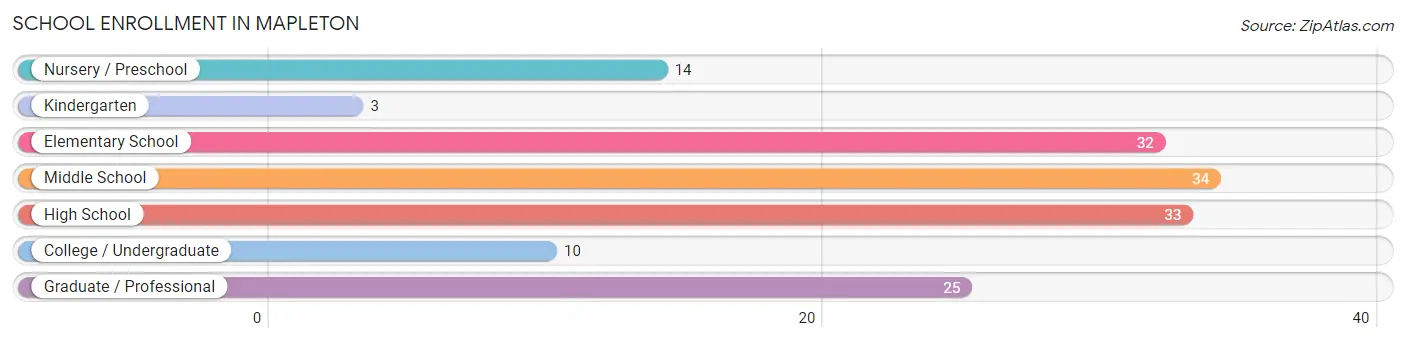
The most common levels of schooling among the 151 students in Mapleton are middle school (34 | 22.5%), high school (33 | 21.8%), and elementary school (32 | 21.2%).
| School Level | # Students | % Students |
| Nursery / Preschool | 14 | 9.3% |
| Kindergarten | 3 | 2.0% |
| Elementary School | 32 | 21.2% |
| Middle School | 34 | 22.5% |
| High School | 33 | 21.8% |
| College / Undergraduate | 10 | 6.6% |
| Graduate / Professional | 25 | 16.6% |
| Total | 151 | 100.0% |
School Enrollment by Age by Funding Source in Mapleton
Out of a total of 151 students who are enrolled in schools in Mapleton, 25 (16.6%) attend a private institution, while the remaining 126 (83.4%) are enrolled in public schools. The age group of 35 years and over has the highest likelihood of being enrolled in private schools, with 5 (62.5% in the age bracket) enrolled. Conversely, the age group of 5 to 9 year old has the lowest likelihood of being enrolled in a private school, with 31 (100.0% in the age bracket) attending a public institution.
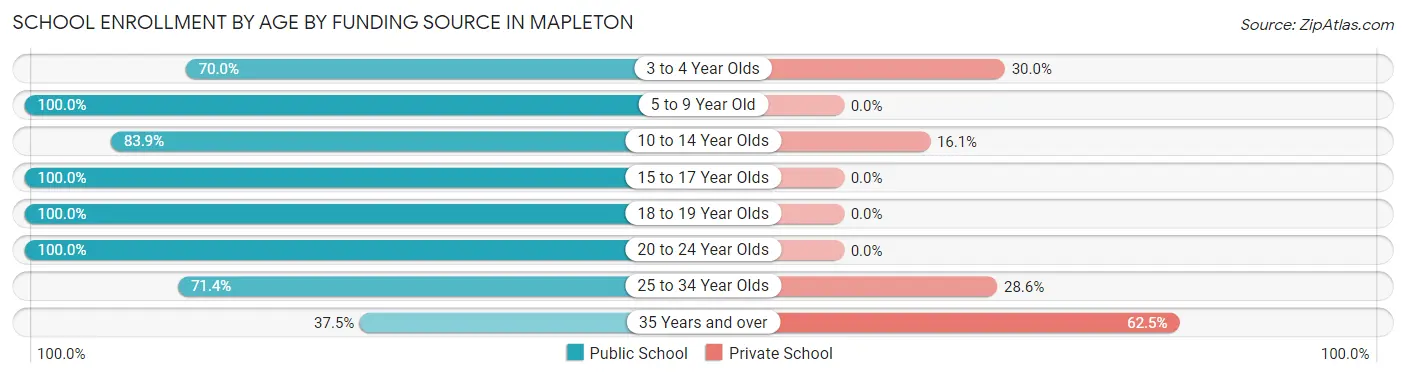
| Age Bracket | Public School | Private School |
| 3 to 4 Year Olds | 7 (70.0%) | 3 (30.0%) |
| 5 to 9 Year Old | 31 (100.0%) | 0 (0.0%) |
| 10 to 14 Year Olds | 47 (83.9%) | 9 (16.1%) |
| 15 to 17 Year Olds | 12 (100.0%) | 0 (0.0%) |
| 18 to 19 Year Olds | 4 (100.0%) | 0 (0.0%) |
| 20 to 24 Year Olds | 2 (100.0%) | 0 (0.0%) |
| 25 to 34 Year Olds | 20 (71.4%) | 8 (28.6%) |
| 35 Years and over | 3 (37.5%) | 5 (62.5%) |
| Total | 126 (83.4%) | 25 (16.6%) |
Educational Attainment by Field of Study in Mapleton
Education (77 | 51.3%), business (15 | 10.0%), bio, nature & agricultural (14 | 9.3%), science & technology (11 | 7.3%), and liberal arts & history (6 | 4.0%) are the most common fields of study among 150 individuals in Mapleton who have obtained a bachelor's degree or higher.
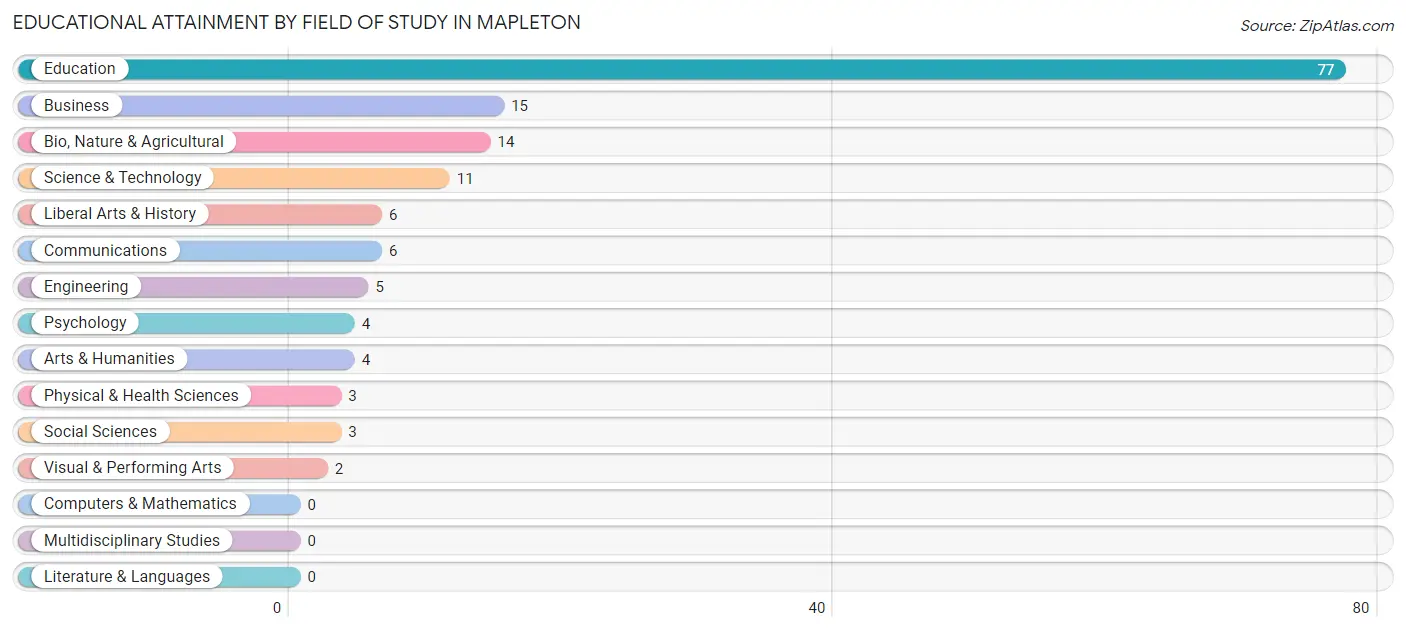
| Field of Study | # Graduates | % Graduates |
| Computers & Mathematics | 0 | 0.0% |
| Bio, Nature & Agricultural | 14 | 9.3% |
| Physical & Health Sciences | 3 | 2.0% |
| Psychology | 4 | 2.7% |
| Social Sciences | 3 | 2.0% |
| Engineering | 5 | 3.3% |
| Multidisciplinary Studies | 0 | 0.0% |
| Science & Technology | 11 | 7.3% |
| Business | 15 | 10.0% |
| Education | 77 | 51.3% |
| Literature & Languages | 0 | 0.0% |
| Liberal Arts & History | 6 | 4.0% |
| Visual & Performing Arts | 2 | 1.3% |
| Communications | 6 | 4.0% |
| Arts & Humanities | 4 | 2.7% |
| Total | 150 | 100.0% |
Transportation & Commute in Mapleton
Vehicle Availability by Sex in Mapleton
The most prevalent vehicle ownership categories in Mapleton are males with 2 vehicles (83, accounting for 43.7%) and females with 2 vehicles (72, making up 43.7%).
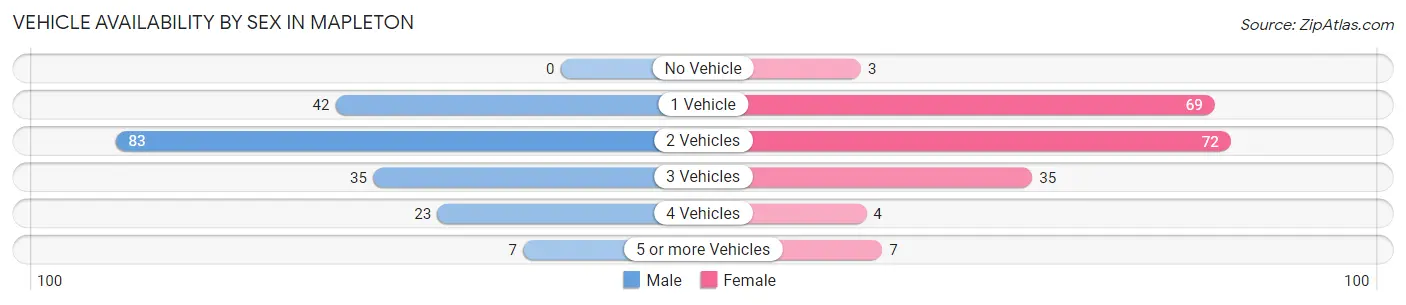
| Vehicles Available | Male | Female |
| No Vehicle | 0 (0.0%) | 3 (1.6%) |
| 1 Vehicle | 42 (22.1%) | 69 (36.3%) |
| 2 Vehicles | 83 (43.7%) | 72 (37.9%) |
| 3 Vehicles | 35 (18.4%) | 35 (18.4%) |
| 4 Vehicles | 23 (12.1%) | 4 (2.1%) |
| 5 or more Vehicles | 7 (3.7%) | 7 (3.7%) |
| Total | 190 (100.0%) | 190 (100.0%) |
Commute Time in Mapleton
The most frequently occuring commute durations in Mapleton are 5 to 9 minutes (87 commuters, 24.3%), less than 5 minutes (80 commuters, 22.4%), and 10 to 14 minutes (41 commuters, 11.5%).
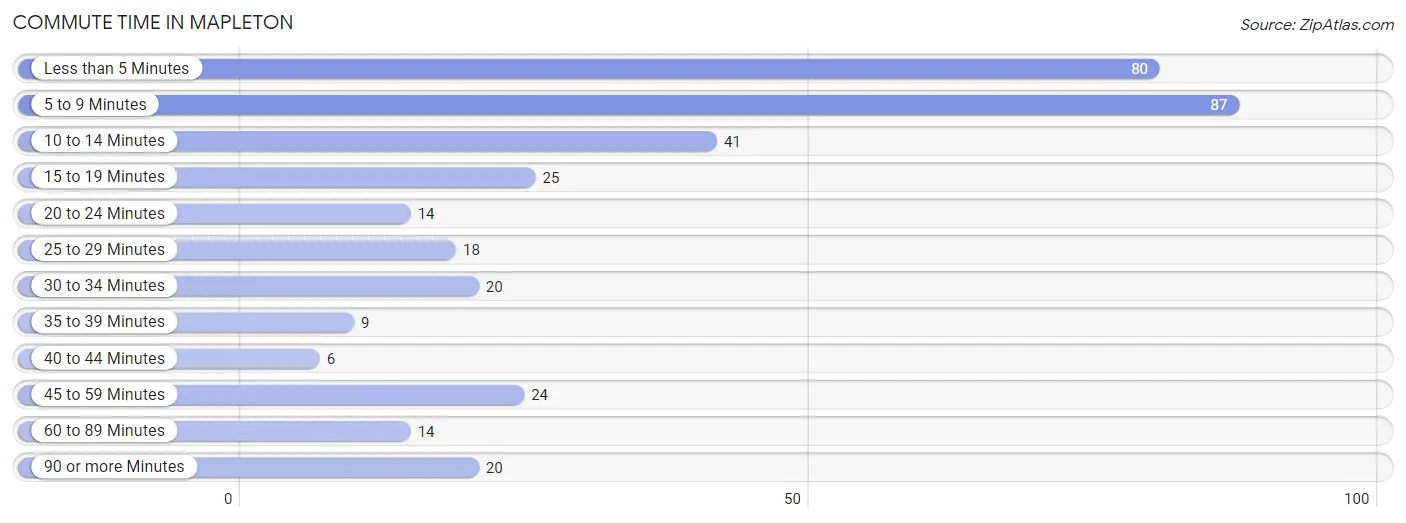
| Commute Time | # Commuters | % Commuters |
| Less than 5 Minutes | 80 | 22.4% |
| 5 to 9 Minutes | 87 | 24.3% |
| 10 to 14 Minutes | 41 | 11.5% |
| 15 to 19 Minutes | 25 | 7.0% |
| 20 to 24 Minutes | 14 | 3.9% |
| 25 to 29 Minutes | 18 | 5.0% |
| 30 to 34 Minutes | 20 | 5.6% |
| 35 to 39 Minutes | 9 | 2.5% |
| 40 to 44 Minutes | 6 | 1.7% |
| 45 to 59 Minutes | 24 | 6.7% |
| 60 to 89 Minutes | 14 | 3.9% |
| 90 or more Minutes | 20 | 5.6% |
Commute Time by Sex in Mapleton
The most common commute times in Mapleton are 5 to 9 minutes (43 commuters, 23.8%) for males and less than 5 minutes (44 commuters, 24.9%) for females.
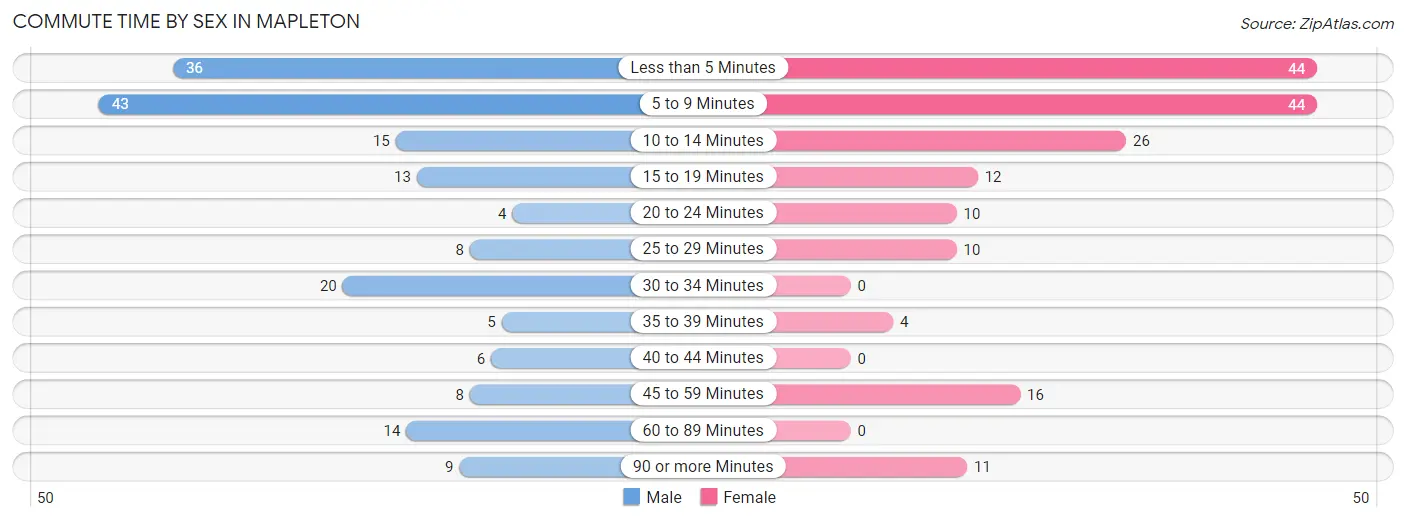
| Commute Time | Male | Female |
| Less than 5 Minutes | 36 (19.9%) | 44 (24.9%) |
| 5 to 9 Minutes | 43 (23.8%) | 44 (24.9%) |
| 10 to 14 Minutes | 15 (8.3%) | 26 (14.7%) |
| 15 to 19 Minutes | 13 (7.2%) | 12 (6.8%) |
| 20 to 24 Minutes | 4 (2.2%) | 10 (5.7%) |
| 25 to 29 Minutes | 8 (4.4%) | 10 (5.7%) |
| 30 to 34 Minutes | 20 (11.1%) | 0 (0.0%) |
| 35 to 39 Minutes | 5 (2.8%) | 4 (2.3%) |
| 40 to 44 Minutes | 6 (3.3%) | 0 (0.0%) |
| 45 to 59 Minutes | 8 (4.4%) | 16 (9.0%) |
| 60 to 89 Minutes | 14 (7.7%) | 0 (0.0%) |
| 90 or more Minutes | 9 (5.0%) | 11 (6.2%) |
Time of Departure to Work by Sex in Mapleton
The most frequent times of departure to work in Mapleton are 7:00 AM to 7:29 AM (37, 20.4%) for males and 7:30 AM to 7:59 AM (52, 29.4%) for females.
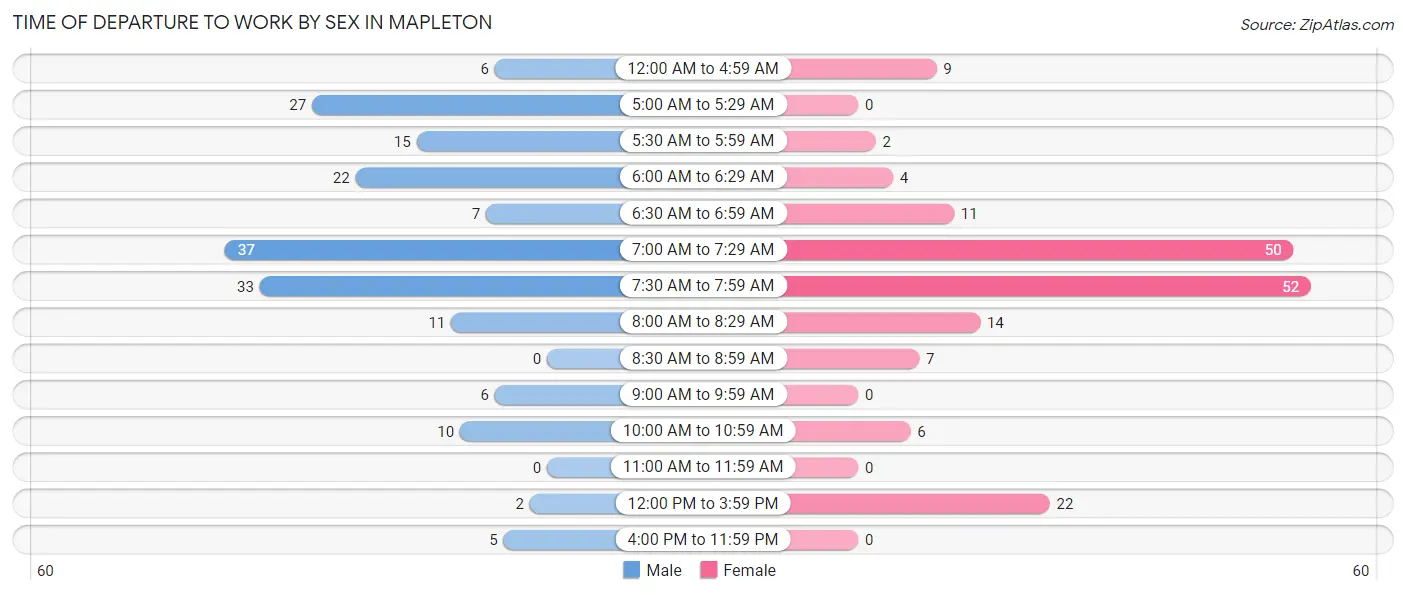
| Time of Departure | Male | Female |
| 12:00 AM to 4:59 AM | 6 (3.3%) | 9 (5.1%) |
| 5:00 AM to 5:29 AM | 27 (14.9%) | 0 (0.0%) |
| 5:30 AM to 5:59 AM | 15 (8.3%) | 2 (1.1%) |
| 6:00 AM to 6:29 AM | 22 (12.1%) | 4 (2.3%) |
| 6:30 AM to 6:59 AM | 7 (3.9%) | 11 (6.2%) |
| 7:00 AM to 7:29 AM | 37 (20.4%) | 50 (28.2%) |
| 7:30 AM to 7:59 AM | 33 (18.2%) | 52 (29.4%) |
| 8:00 AM to 8:29 AM | 11 (6.1%) | 14 (7.9%) |
| 8:30 AM to 8:59 AM | 0 (0.0%) | 7 (4.0%) |
| 9:00 AM to 9:59 AM | 6 (3.3%) | 0 (0.0%) |
| 10:00 AM to 10:59 AM | 10 (5.5%) | 6 (3.4%) |
| 11:00 AM to 11:59 AM | 0 (0.0%) | 0 (0.0%) |
| 12:00 PM to 3:59 PM | 2 (1.1%) | 22 (12.4%) |
| 4:00 PM to 11:59 PM | 5 (2.8%) | 0 (0.0%) |
| Total | 181 (100.0%) | 177 (100.0%) |
Housing Occupancy in Mapleton
Occupancy by Ownership in Mapleton
Of the total 487 dwellings in Mapleton, owner-occupied units account for 374 (76.8%), while renter-occupied units make up 113 (23.2%).
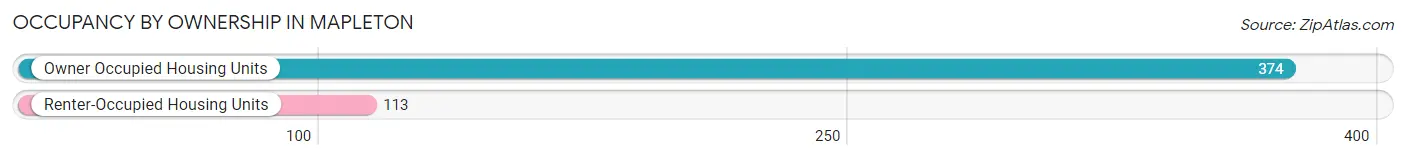
| Occupancy | # Housing Units | % Housing Units |
| Owner Occupied Housing Units | 374 | 76.8% |
| Renter-Occupied Housing Units | 113 | 23.2% |
| Total Occupied Housing Units | 487 | 100.0% |
Occupancy by Household Size in Mapleton
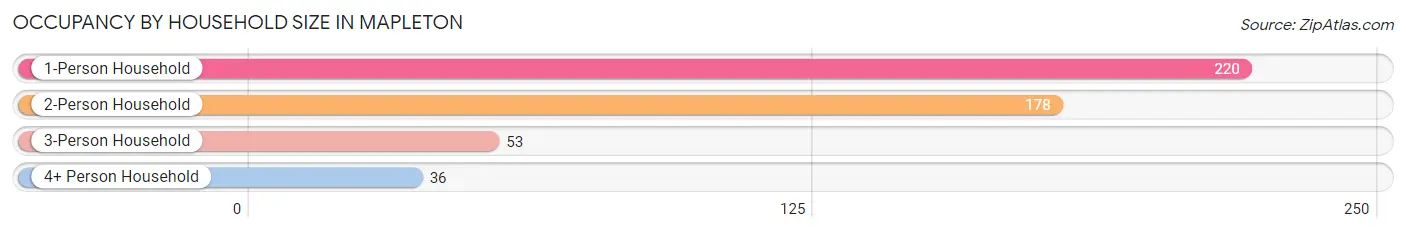
| Household Size | # Housing Units | % Housing Units |
| 1-Person Household | 220 | 45.2% |
| 2-Person Household | 178 | 36.5% |
| 3-Person Household | 53 | 10.9% |
| 4+ Person Household | 36 | 7.4% |
| Total Housing Units | 487 | 100.0% |
Occupancy by Ownership by Household Size in Mapleton
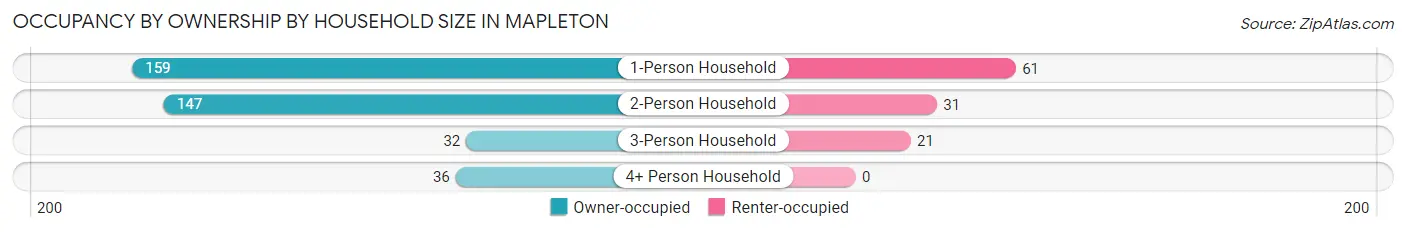
| Household Size | Owner-occupied | Renter-occupied |
| 1-Person Household | 159 (72.3%) | 61 (27.7%) |
| 2-Person Household | 147 (82.6%) | 31 (17.4%) |
| 3-Person Household | 32 (60.4%) | 21 (39.6%) |
| 4+ Person Household | 36 (100.0%) | 0 (0.0%) |
| Total Housing Units | 374 (76.8%) | 113 (23.2%) |
Occupancy by Educational Attainment in Mapleton
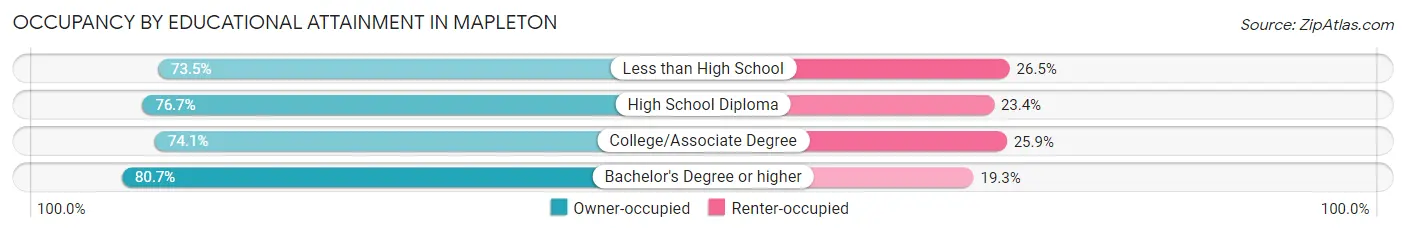
| Household Size | Owner-occupied | Renter-occupied |
| Less than High School | 25 (73.5%) | 9 (26.5%) |
| High School Diploma | 174 (76.6%) | 53 (23.4%) |
| College/Associate Degree | 83 (74.1%) | 29 (25.9%) |
| Bachelor's Degree or higher | 92 (80.7%) | 22 (19.3%) |
Occupancy by Age of Householder in Mapleton
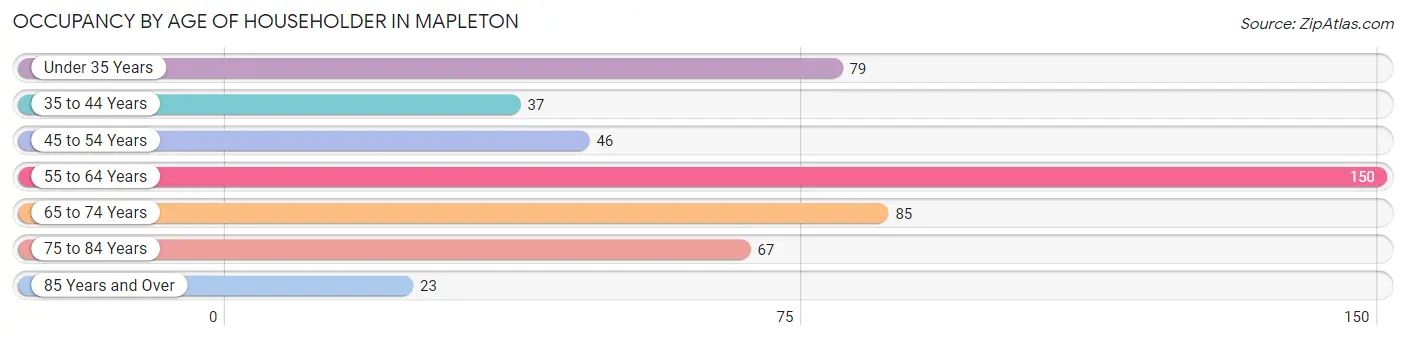
| Age Bracket | # Households | % Households |
| Under 35 Years | 79 | 16.2% |
| 35 to 44 Years | 37 | 7.6% |
| 45 to 54 Years | 46 | 9.5% |
| 55 to 64 Years | 150 | 30.8% |
| 65 to 74 Years | 85 | 17.4% |
| 75 to 84 Years | 67 | 13.8% |
| 85 Years and Over | 23 | 4.7% |
| Total | 487 | 100.0% |
Housing Finances in Mapleton
Median Income by Occupancy in Mapleton
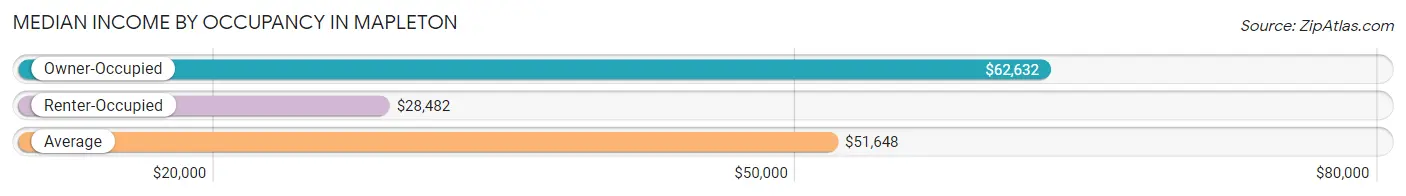
| Occupancy Type | # Households | Median Income |
| Owner-Occupied | 374 (76.8%) | $62,632 |
| Renter-Occupied | 113 (23.2%) | $28,482 |
| Average | 487 (100.0%) | $51,648 |
Occupancy by Householder Income Bracket in Mapleton
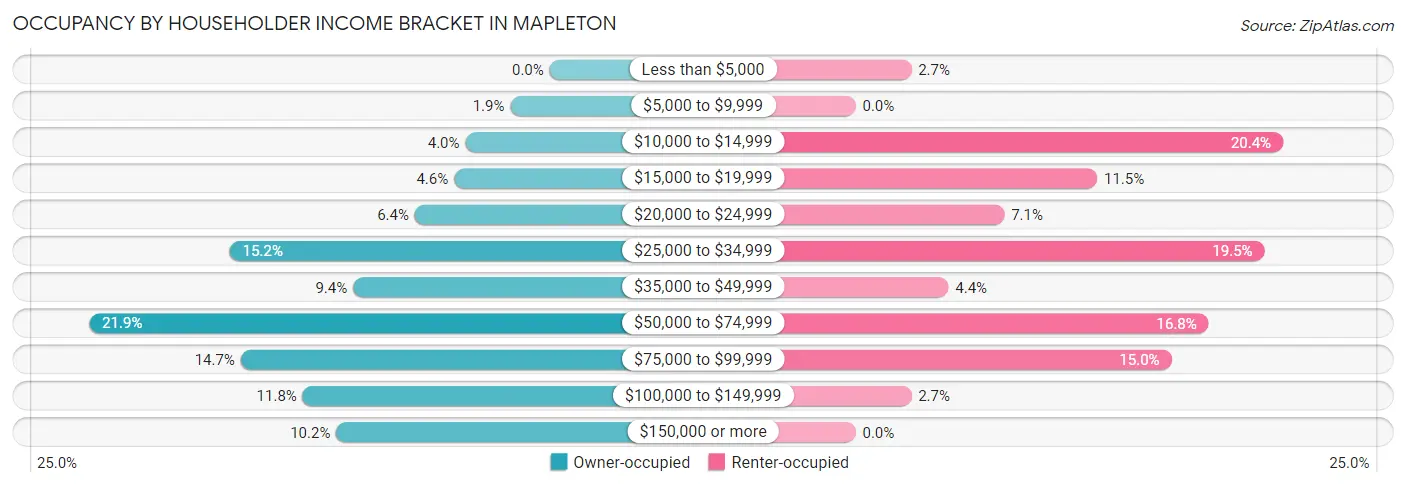
| Income Bracket | Owner-occupied | Renter-occupied |
| Less than $5,000 | 0 (0.0%) | 3 (2.6%) |
| $5,000 to $9,999 | 7 (1.9%) | 0 (0.0%) |
| $10,000 to $14,999 | 15 (4.0%) | 23 (20.3%) |
| $15,000 to $19,999 | 17 (4.5%) | 13 (11.5%) |
| $20,000 to $24,999 | 24 (6.4%) | 8 (7.1%) |
| $25,000 to $34,999 | 57 (15.2%) | 22 (19.5%) |
| $35,000 to $49,999 | 35 (9.4%) | 5 (4.4%) |
| $50,000 to $74,999 | 82 (21.9%) | 19 (16.8%) |
| $75,000 to $99,999 | 55 (14.7%) | 17 (15.0%) |
| $100,000 to $149,999 | 44 (11.8%) | 3 (2.6%) |
| $150,000 or more | 38 (10.2%) | 0 (0.0%) |
| Total | 374 (100.0%) | 113 (100.0%) |
Monthly Housing Cost Tiers in Mapleton
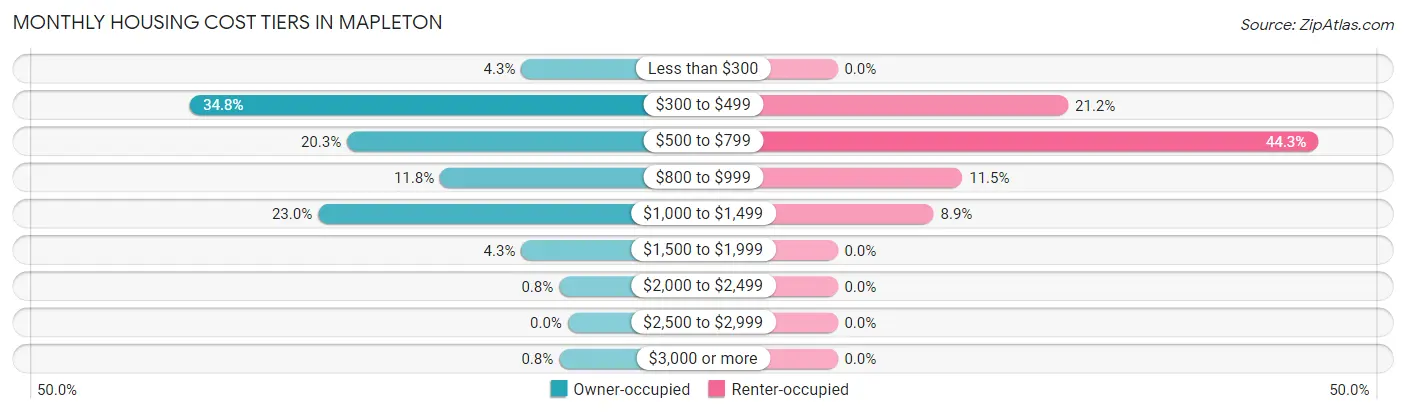
| Monthly Cost | Owner-occupied | Renter-occupied |
| Less than $300 | 16 (4.3%) | 0 (0.0%) |
| $300 to $499 | 130 (34.8%) | 24 (21.2%) |
| $500 to $799 | 76 (20.3%) | 50 (44.3%) |
| $800 to $999 | 44 (11.8%) | 13 (11.5%) |
| $1,000 to $1,499 | 86 (23.0%) | 10 (8.8%) |
| $1,500 to $1,999 | 16 (4.3%) | 0 (0.0%) |
| $2,000 to $2,499 | 3 (0.8%) | 0 (0.0%) |
| $2,500 to $2,999 | 0 (0.0%) | 0 (0.0%) |
| $3,000 or more | 3 (0.8%) | 0 (0.0%) |
| Total | 374 (100.0%) | 113 (100.0%) |
Physical Housing Characteristics in Mapleton
Housing Structures in Mapleton
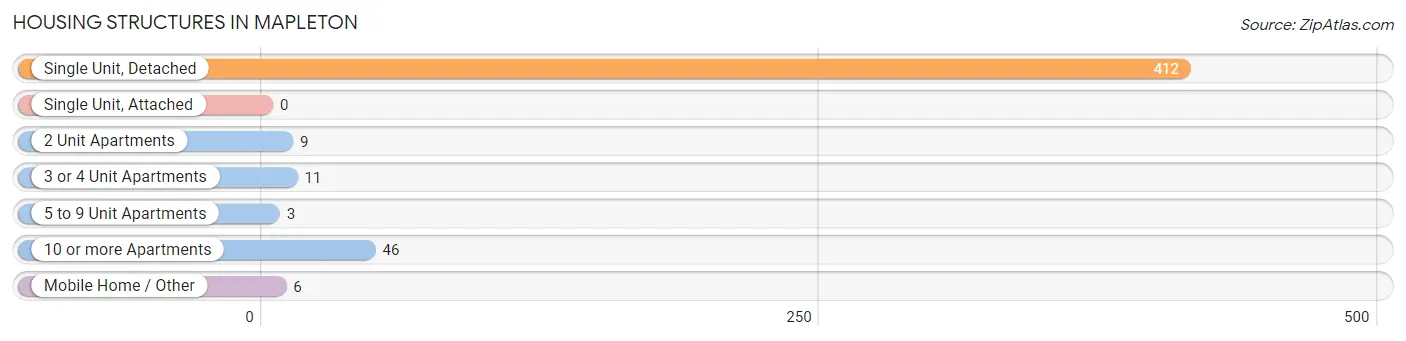
| Structure Type | # Housing Units | % Housing Units |
| Single Unit, Detached | 412 | 84.6% |
| Single Unit, Attached | 0 | 0.0% |
| 2 Unit Apartments | 9 | 1.8% |
| 3 or 4 Unit Apartments | 11 | 2.3% |
| 5 to 9 Unit Apartments | 3 | 0.6% |
| 10 or more Apartments | 46 | 9.5% |
| Mobile Home / Other | 6 | 1.2% |
| Total | 487 | 100.0% |
Housing Structures by Occupancy in Mapleton
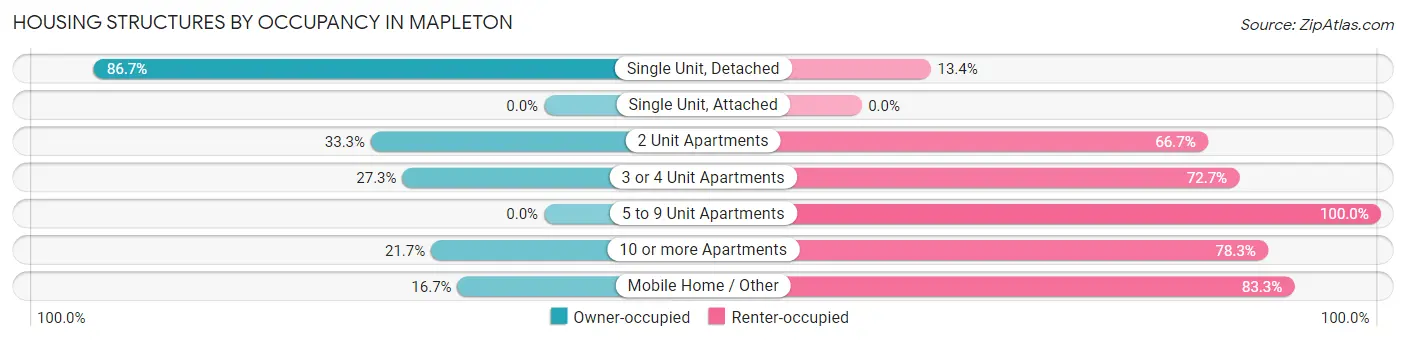
| Structure Type | Owner-occupied | Renter-occupied |
| Single Unit, Detached | 357 (86.7%) | 55 (13.4%) |
| Single Unit, Attached | 0 (0.0%) | 0 (0.0%) |
| 2 Unit Apartments | 3 (33.3%) | 6 (66.7%) |
| 3 or 4 Unit Apartments | 3 (27.3%) | 8 (72.7%) |
| 5 to 9 Unit Apartments | 0 (0.0%) | 3 (100.0%) |
| 10 or more Apartments | 10 (21.7%) | 36 (78.3%) |
| Mobile Home / Other | 1 (16.7%) | 5 (83.3%) |
| Total | 374 (76.8%) | 113 (23.2%) |
Housing Structures by Number of Rooms in Mapleton
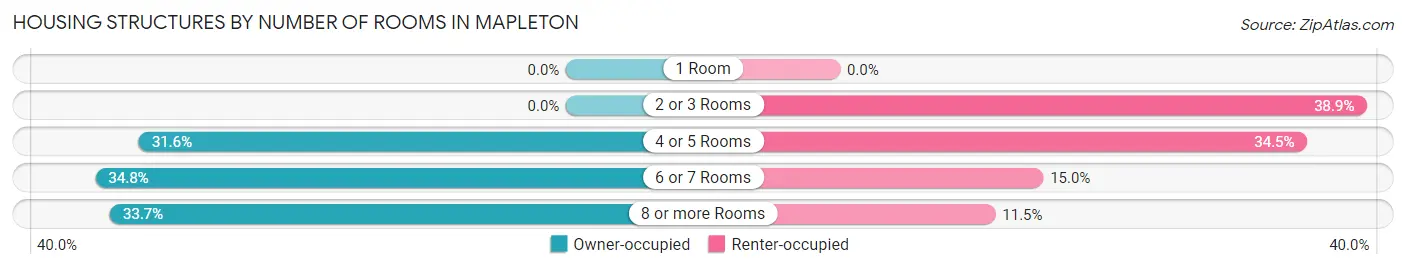
| Number of Rooms | Owner-occupied | Renter-occupied |
| 1 Room | 0 (0.0%) | 0 (0.0%) |
| 2 or 3 Rooms | 0 (0.0%) | 44 (38.9%) |
| 4 or 5 Rooms | 118 (31.6%) | 39 (34.5%) |
| 6 or 7 Rooms | 130 (34.8%) | 17 (15.0%) |
| 8 or more Rooms | 126 (33.7%) | 13 (11.5%) |
| Total | 374 (100.0%) | 113 (100.0%) |
Housing Structure by Heating Type in Mapleton
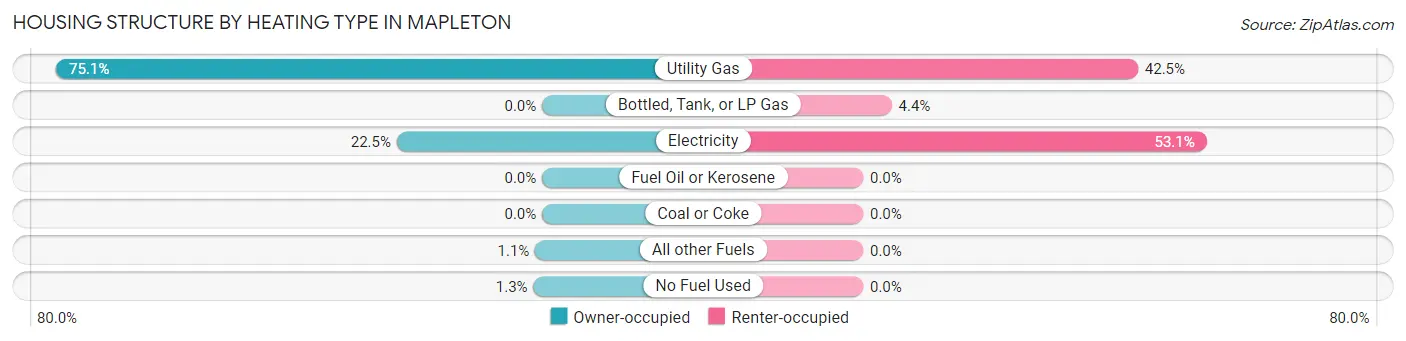
| Heating Type | Owner-occupied | Renter-occupied |
| Utility Gas | 281 (75.1%) | 48 (42.5%) |
| Bottled, Tank, or LP Gas | 0 (0.0%) | 5 (4.4%) |
| Electricity | 84 (22.5%) | 60 (53.1%) |
| Fuel Oil or Kerosene | 0 (0.0%) | 0 (0.0%) |
| Coal or Coke | 0 (0.0%) | 0 (0.0%) |
| All other Fuels | 4 (1.1%) | 0 (0.0%) |
| No Fuel Used | 5 (1.3%) | 0 (0.0%) |
| Total | 374 (100.0%) | 113 (100.0%) |
Household Vehicle Usage in Mapleton
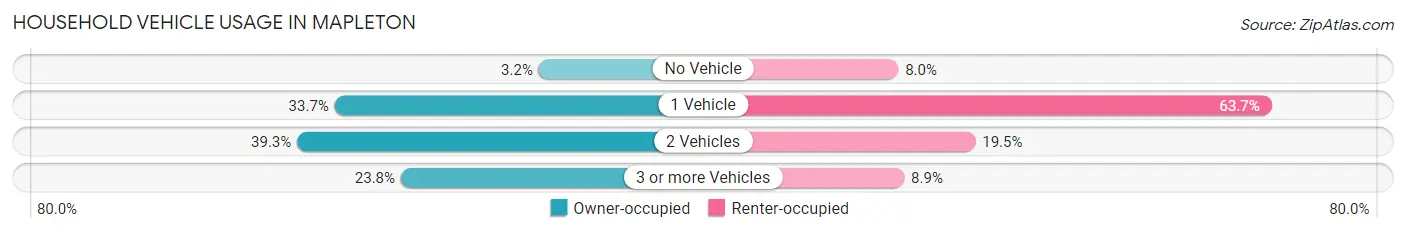
| Vehicles per Household | Owner-occupied | Renter-occupied |
| No Vehicle | 12 (3.2%) | 9 (8.0%) |
| 1 Vehicle | 126 (33.7%) | 72 (63.7%) |
| 2 Vehicles | 147 (39.3%) | 22 (19.5%) |
| 3 or more Vehicles | 89 (23.8%) | 10 (8.8%) |
| Total | 374 (100.0%) | 113 (100.0%) |
Real Estate & Mortgages in Mapleton
Real Estate and Mortgage Overview in Mapleton
| Characteristic | Without Mortgage | With Mortgage |
| Housing Units | 210 | 164 |
| Median Property Value | $90,000 | $124,300 |
| Median Household Income | $46,667 | $12 |
| Monthly Housing Costs | $449 | $3 |
| Real Estate Taxes | $1,134 | $3 |
Property Value by Mortgage Status in Mapleton
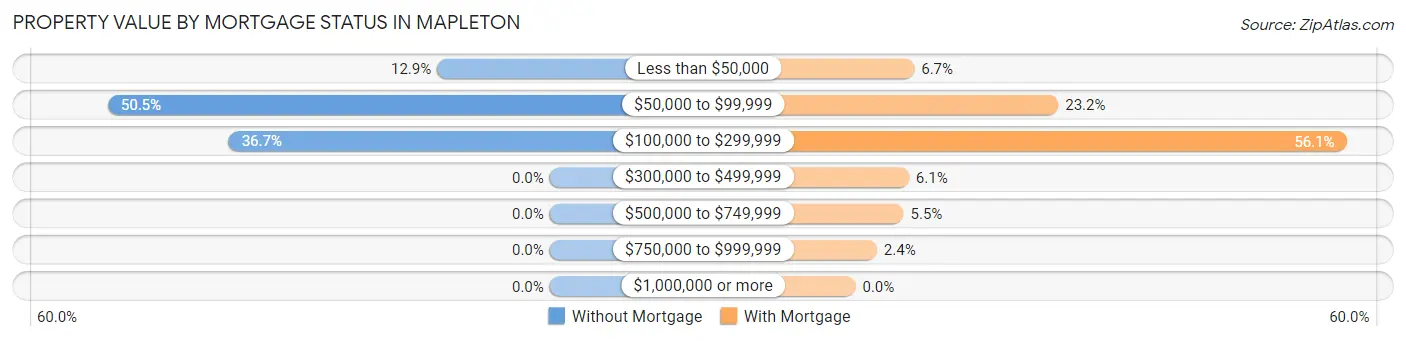
| Property Value | Without Mortgage | With Mortgage |
| Less than $50,000 | 27 (12.9%) | 11 (6.7%) |
| $50,000 to $99,999 | 106 (50.5%) | 38 (23.2%) |
| $100,000 to $299,999 | 77 (36.7%) | 92 (56.1%) |
| $300,000 to $499,999 | 0 (0.0%) | 10 (6.1%) |
| $500,000 to $749,999 | 0 (0.0%) | 9 (5.5%) |
| $750,000 to $999,999 | 0 (0.0%) | 4 (2.4%) |
| $1,000,000 or more | 0 (0.0%) | 0 (0.0%) |
| Total | 210 (100.0%) | 164 (100.0%) |
Household Income by Mortgage Status in Mapleton
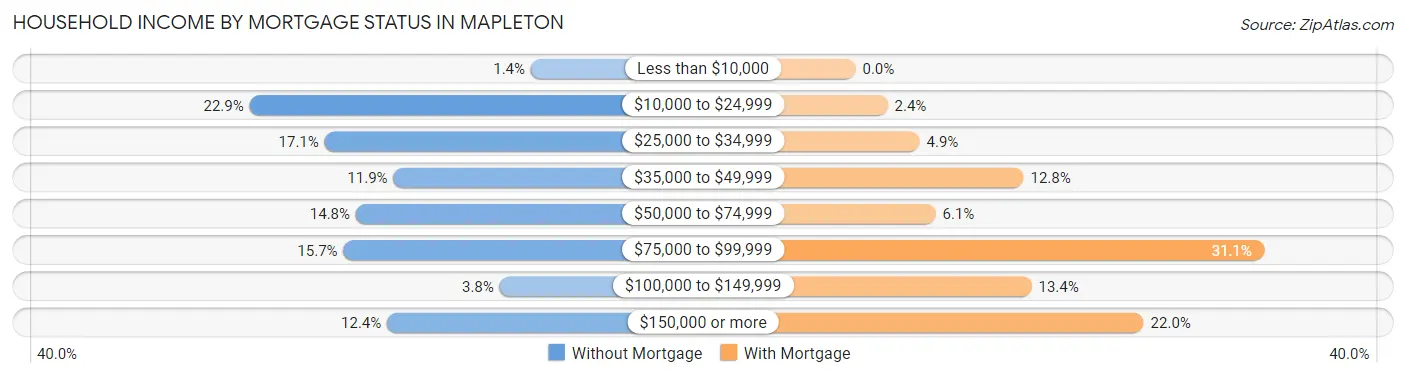
| Household Income | Without Mortgage | With Mortgage |
| Less than $10,000 | 3 (1.4%) | 0 (0.0%) |
| $10,000 to $24,999 | 48 (22.9%) | 4 (2.4%) |
| $25,000 to $34,999 | 36 (17.1%) | 8 (4.9%) |
| $35,000 to $49,999 | 25 (11.9%) | 21 (12.8%) |
| $50,000 to $74,999 | 31 (14.8%) | 10 (6.1%) |
| $75,000 to $99,999 | 33 (15.7%) | 51 (31.1%) |
| $100,000 to $149,999 | 8 (3.8%) | 22 (13.4%) |
| $150,000 or more | 26 (12.4%) | 36 (22.0%) |
| Total | 210 (100.0%) | 164 (100.0%) |
Property Value to Household Income Ratio in Mapleton
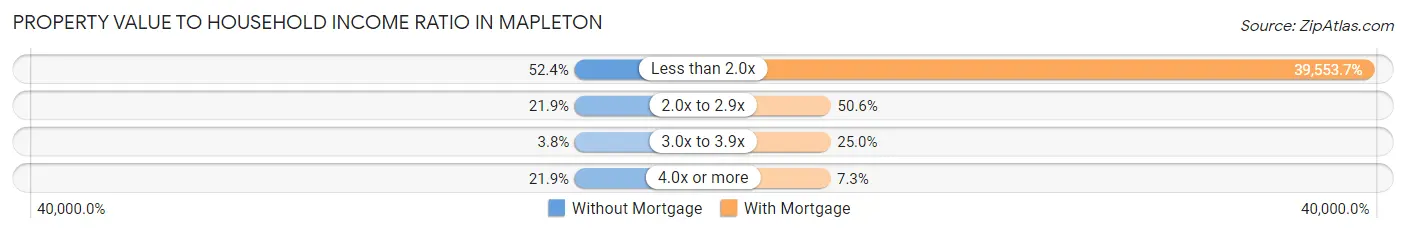
| Value-to-Income Ratio | Without Mortgage | With Mortgage |
| Less than 2.0x | 110 (52.4%) | 64,868 (39,553.7%) |
| 2.0x to 2.9x | 46 (21.9%) | 83 (50.6%) |
| 3.0x to 3.9x | 8 (3.8%) | 41 (25.0%) |
| 4.0x or more | 46 (21.9%) | 12 (7.3%) |
| Total | 210 (100.0%) | 164 (100.0%) |
Real Estate Taxes by Mortgage Status in Mapleton
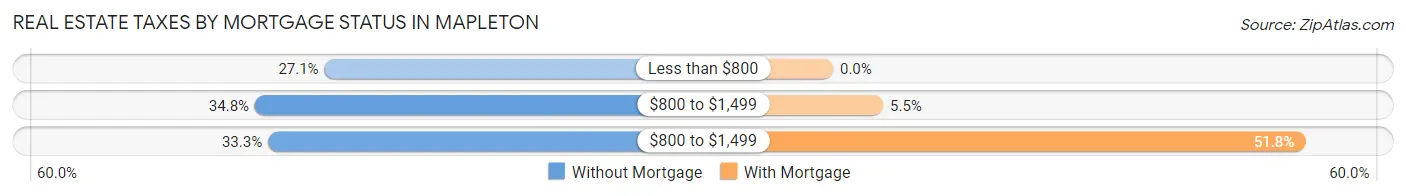
| Property Taxes | Without Mortgage | With Mortgage |
| Less than $800 | 57 (27.1%) | 0 (0.0%) |
| $800 to $1,499 | 73 (34.8%) | 9 (5.5%) |
| $800 to $1,499 | 70 (33.3%) | 85 (51.8%) |
| Total | 210 (100.0%) | 164 (100.0%) |
Health & Disability in Mapleton
Health Insurance Coverage by Age in Mapleton
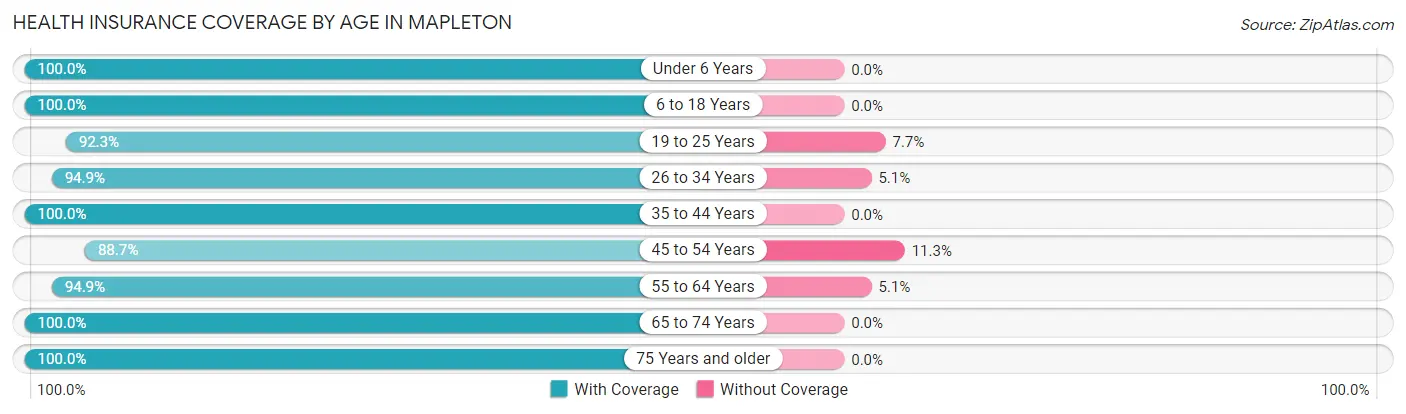
| Age Bracket | With Coverage | Without Coverage |
| Under 6 Years | 53 (100.0%) | 0 (0.0%) |
| 6 to 18 Years | 96 (100.0%) | 0 (0.0%) |
| 19 to 25 Years | 36 (92.3%) | 3 (7.7%) |
| 26 to 34 Years | 75 (94.9%) | 4 (5.1%) |
| 35 to 44 Years | 87 (100.0%) | 0 (0.0%) |
| 45 to 54 Years | 63 (88.7%) | 8 (11.3%) |
| 55 to 64 Years | 205 (94.9%) | 11 (5.1%) |
| 65 to 74 Years | 115 (100.0%) | 0 (0.0%) |
| 75 Years and older | 117 (100.0%) | 0 (0.0%) |
| Total | 847 (97.0%) | 26 (3.0%) |
Health Insurance Coverage by Citizenship Status in Mapleton
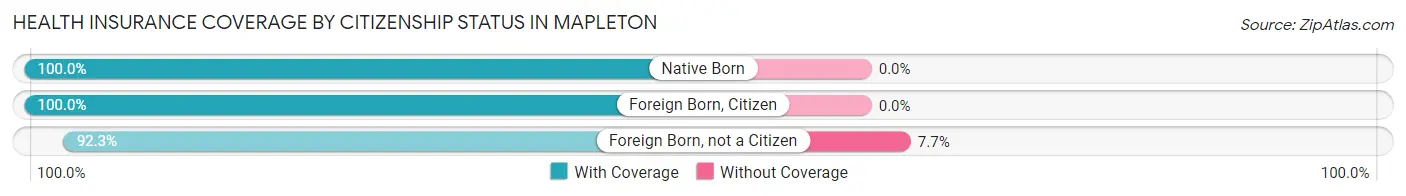
| Citizenship Status | With Coverage | Without Coverage |
| Native Born | 53 (100.0%) | 0 (0.0%) |
| Foreign Born, Citizen | 96 (100.0%) | 0 (0.0%) |
| Foreign Born, not a Citizen | 36 (92.3%) | 3 (7.7%) |
Health Insurance Coverage by Household Income in Mapleton
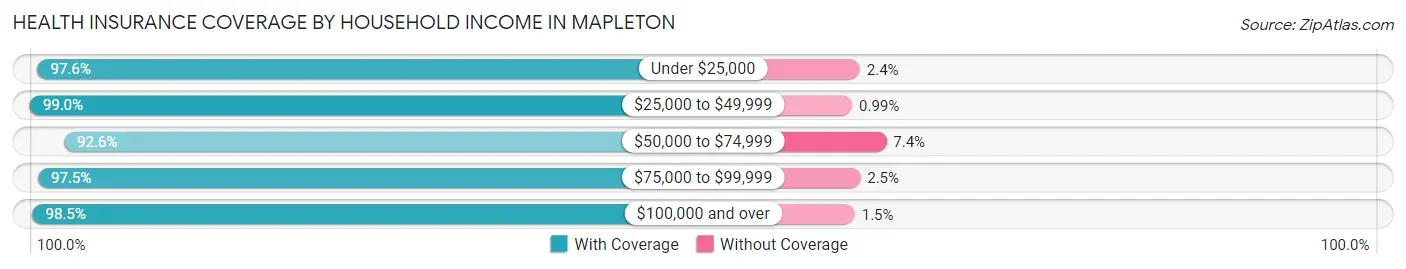
| Household Income | With Coverage | Without Coverage |
| Under $25,000 | 120 (97.6%) | 3 (2.4%) |
| $25,000 to $49,999 | 201 (99.0%) | 2 (1.0%) |
| $50,000 to $74,999 | 175 (92.6%) | 14 (7.4%) |
| $75,000 to $99,999 | 154 (97.5%) | 4 (2.5%) |
| $100,000 and over | 197 (98.5%) | 3 (1.5%) |
Public vs Private Health Insurance Coverage by Age in Mapleton
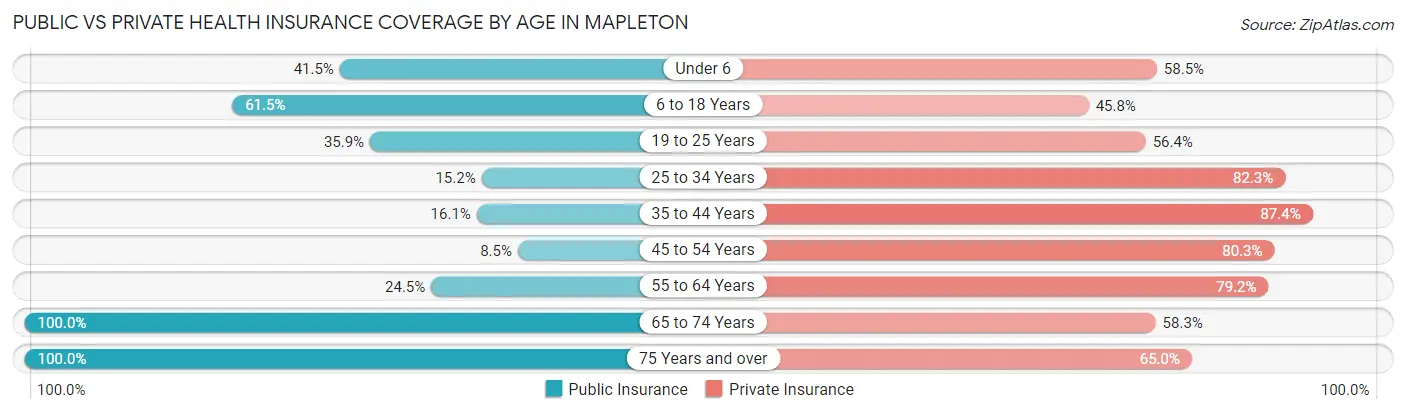
| Age Bracket | Public Insurance | Private Insurance |
| Under 6 | 22 (41.5%) | 31 (58.5%) |
| 6 to 18 Years | 59 (61.5%) | 44 (45.8%) |
| 19 to 25 Years | 14 (35.9%) | 22 (56.4%) |
| 25 to 34 Years | 12 (15.2%) | 65 (82.3%) |
| 35 to 44 Years | 14 (16.1%) | 76 (87.4%) |
| 45 to 54 Years | 6 (8.5%) | 57 (80.3%) |
| 55 to 64 Years | 53 (24.5%) | 171 (79.2%) |
| 65 to 74 Years | 115 (100.0%) | 67 (58.3%) |
| 75 Years and over | 117 (100.0%) | 76 (65.0%) |
| Total | 412 (47.2%) | 609 (69.8%) |
Disability Status by Sex by Age in Mapleton
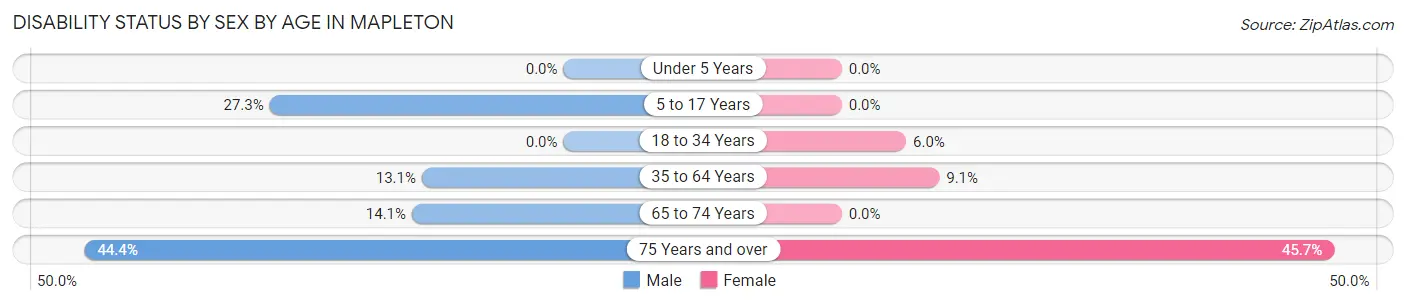
| Age Bracket | Male | Female |
| Under 5 Years | 0 (0.0%) | 0 (0.0%) |
| 5 to 17 Years | 12 (27.3%) | 0 (0.0%) |
| 18 to 34 Years | 0 (0.0%) | 4 (6.0%) |
| 35 to 64 Years | 23 (13.1%) | 18 (9.0%) |
| 65 to 74 Years | 9 (14.1%) | 0 (0.0%) |
| 75 Years and over | 16 (44.4%) | 37 (45.7%) |
Disability Class by Sex by Age in Mapleton
Disability Class: Hearing Difficulty
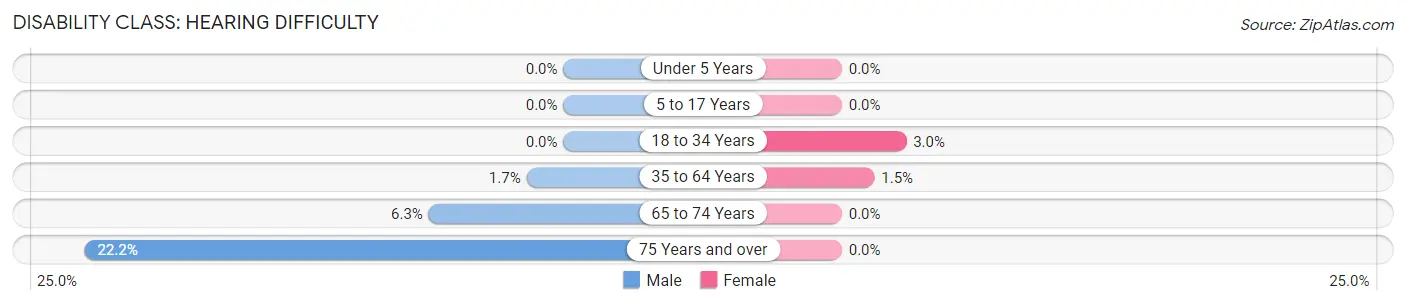
| Age Bracket | Male | Female |
| Under 5 Years | 0 (0.0%) | 0 (0.0%) |
| 5 to 17 Years | 0 (0.0%) | 0 (0.0%) |
| 18 to 34 Years | 0 (0.0%) | 2 (3.0%) |
| 35 to 64 Years | 3 (1.7%) | 3 (1.5%) |
| 65 to 74 Years | 4 (6.2%) | 0 (0.0%) |
| 75 Years and over | 8 (22.2%) | 0 (0.0%) |
Disability Class: Vision Difficulty
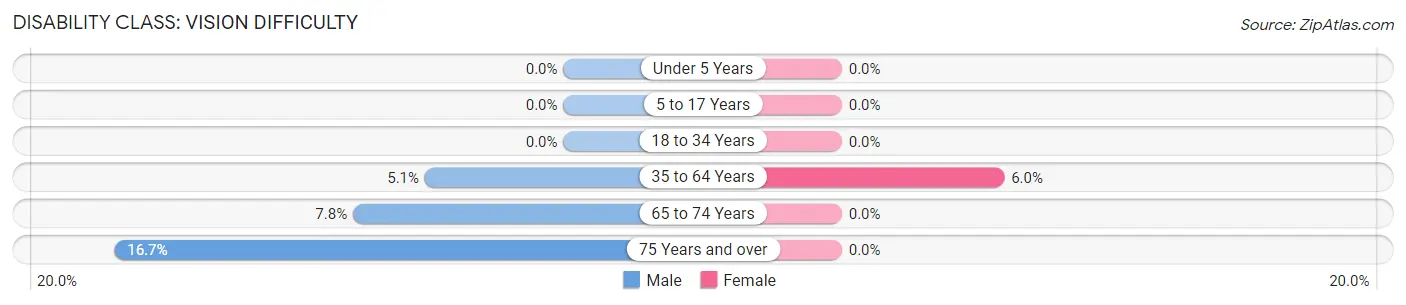
| Age Bracket | Male | Female |
| Under 5 Years | 0 (0.0%) | 0 (0.0%) |
| 5 to 17 Years | 0 (0.0%) | 0 (0.0%) |
| 18 to 34 Years | 0 (0.0%) | 0 (0.0%) |
| 35 to 64 Years | 9 (5.1%) | 12 (6.0%) |
| 65 to 74 Years | 5 (7.8%) | 0 (0.0%) |
| 75 Years and over | 6 (16.7%) | 0 (0.0%) |
Disability Class: Cognitive Difficulty
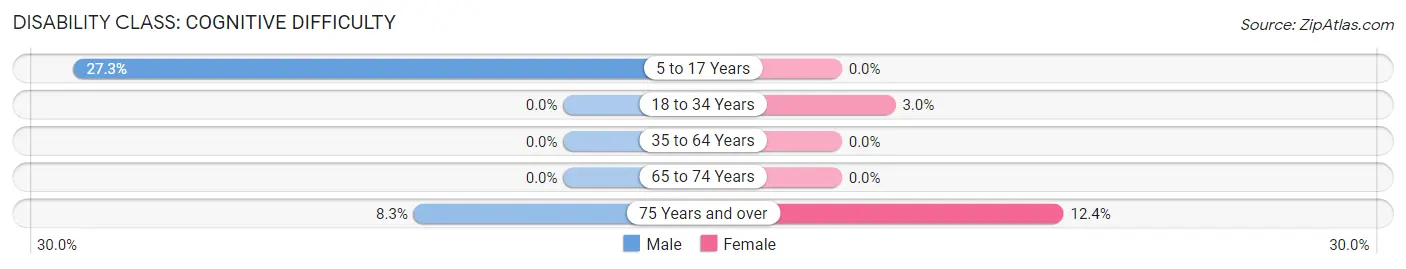
| Age Bracket | Male | Female |
| 5 to 17 Years | 12 (27.3%) | 0 (0.0%) |
| 18 to 34 Years | 0 (0.0%) | 2 (3.0%) |
| 35 to 64 Years | 0 (0.0%) | 0 (0.0%) |
| 65 to 74 Years | 0 (0.0%) | 0 (0.0%) |
| 75 Years and over | 3 (8.3%) | 10 (12.3%) |
Disability Class: Ambulatory Difficulty
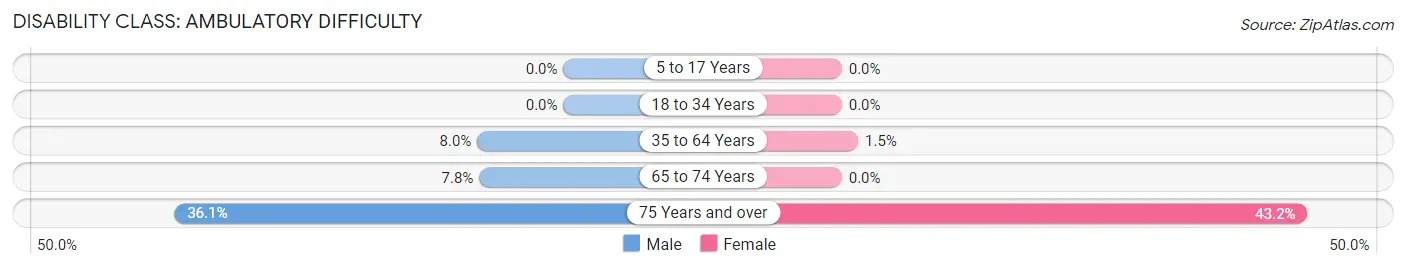
| Age Bracket | Male | Female |
| 5 to 17 Years | 0 (0.0%) | 0 (0.0%) |
| 18 to 34 Years | 0 (0.0%) | 0 (0.0%) |
| 35 to 64 Years | 14 (8.0%) | 3 (1.5%) |
| 65 to 74 Years | 5 (7.8%) | 0 (0.0%) |
| 75 Years and over | 13 (36.1%) | 35 (43.2%) |
Disability Class: Self-Care Difficulty
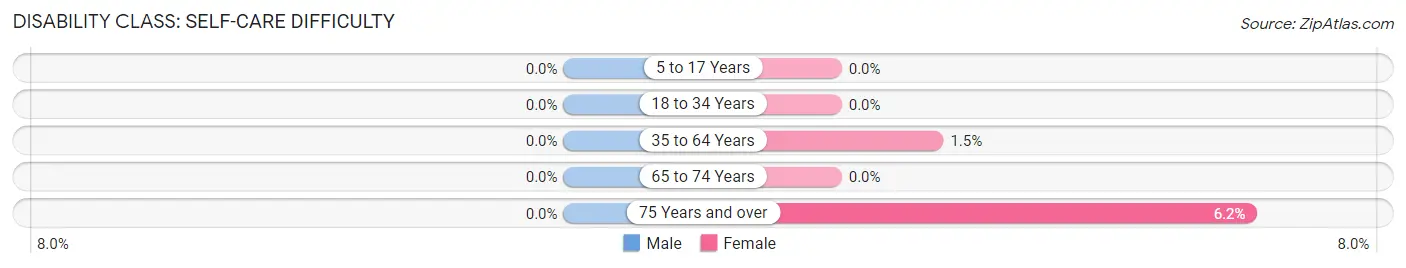
| Age Bracket | Male | Female |
| 5 to 17 Years | 0 (0.0%) | 0 (0.0%) |
| 18 to 34 Years | 0 (0.0%) | 0 (0.0%) |
| 35 to 64 Years | 0 (0.0%) | 3 (1.5%) |
| 65 to 74 Years | 0 (0.0%) | 0 (0.0%) |
| 75 Years and over | 0 (0.0%) | 5 (6.2%) |
Technology Access in Mapleton
Computing Device Access in Mapleton
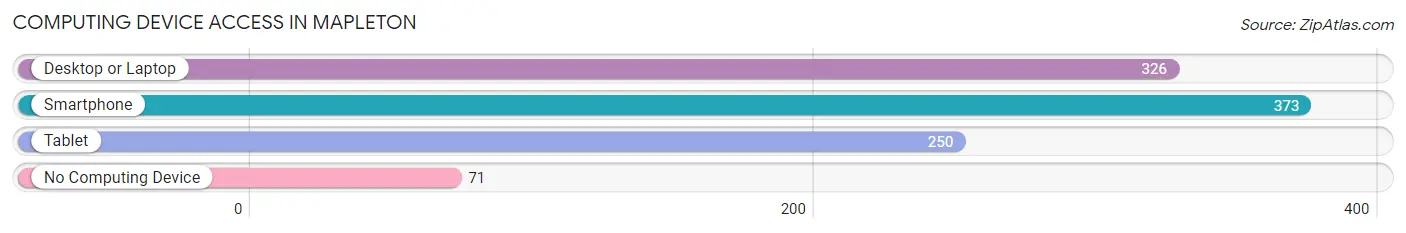
| Device Type | # Households | % Households |
| Desktop or Laptop | 326 | 66.9% |
| Smartphone | 373 | 76.6% |
| Tablet | 250 | 51.3% |
| No Computing Device | 71 | 14.6% |
| Total | 487 | 100.0% |
Internet Access in Mapleton
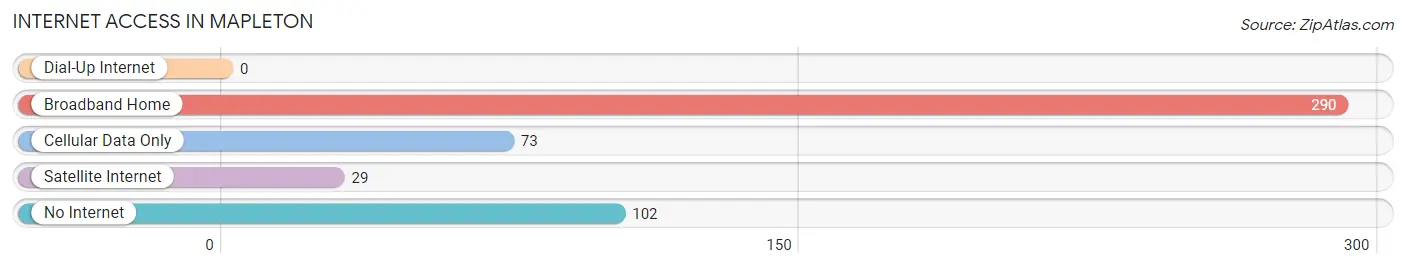
| Internet Type | # Households | % Households |
| Dial-Up Internet | 0 | 0.0% |
| Broadband Home | 290 | 59.6% |
| Cellular Data Only | 73 | 15.0% |
| Satellite Internet | 29 | 5.9% |
| No Internet | 102 | 20.9% |
| Total | 487 | 100.0% |
Mapleton Summary
Mapleton, Iowa is a small city located in Monona County in the northwest corner of the state. The city is situated along the Maple River, which is a tributary of the Big Sioux River. The city was founded in 1856 and has a population of 1,845 as of the 2020 census.
History
Mapleton was founded in 1856 by a group of settlers from Ohio. The settlers were attracted to the area due to its fertile soil and abundant natural resources. The city was named after the Maple River, which runs through the city. The first post office was established in 1857 and the first school was built in 1858.
The city was incorporated in 1872 and the first mayor was elected in 1873. The city grew rapidly in the late 19th century and early 20th century due to the railroad and the lumber industry. The city was also home to several manufacturing plants, including a flour mill, a brickyard, and a furniture factory.
Geography
Mapleton is located in Monona County in the northwest corner of Iowa. The city is situated along the Maple River, which is a tributary of the Big Sioux River. The city is located at an elevation of 1,072 feet above sea level. The city has a total area of 1.3 square miles, all of which is land.
The city is located in a humid continental climate zone, with hot summers and cold winters. The average annual temperature is 48°F, with an average high of 73°F in the summer and an average low of 24°F in the winter. The average annual precipitation is 33 inches.
Economy
Mapleton’s economy is largely based on agriculture and manufacturing. The city is home to several large farms, which produce corn, soybeans, and other crops. The city is also home to several manufacturing plants, including a flour mill, a brickyard, and a furniture factory.
The city is also home to several small businesses, including restaurants, retail stores, and service providers. The city is also home to several tourist attractions, including the Maple River State Park and the Monona County Historical Museum.
Demographics
As of the 2020 census, Mapleton had a population of 1,845. The racial makeup of the city was 97.2% White, 0.7% African American, 0.3% Native American, 0.2% Asian, 0.1% Pacific Islander, 0.4% from other races, and 1.1% from two or more races. Hispanic or Latino of any race were 1.3% of the population.
The median household income in Mapleton was $45,938, and the median family income was $51,938. The per capita income was $20,938. About 11.2% of the population was below the poverty line.
Mapleton is a small city with a rich history and a diverse economy. The city is home to several large farms, manufacturing plants, and small businesses. The city is also home to several tourist attractions, including the Maple River State Park and the Monona County Historical Museum. The city has a population of 1,845 as of the 2020 census and is a great place to live and work.
Common Questions
What is Per Capita Income in Mapleton?
Per Capita income in Mapleton is $38,198.
What is the Median Family Income in Mapleton?
Median Family Income in Mapleton is $74,125.
What is the Median Household income in Mapleton?
Median Household Income in Mapleton is $51,648.
What is Income or Wage Gap in Mapleton?
Income or Wage Gap in Mapleton is 33.6%.
Women in Mapleton earn 66.4 cents for every dollar earned by a man.
What is Inequality or Gini Index in Mapleton?
Inequality or Gini Index in Mapleton is 0.43.
What is the Total Population of Mapleton?
Total Population of Mapleton is 923.
What is the Total Male Population of Mapleton?
Total Male Population of Mapleton is 415.
What is the Total Female Population of Mapleton?
Total Female Population of Mapleton is 508.
What is the Ratio of Males per 100 Females in Mapleton?
There are 81.69 Males per 100 Females in Mapleton.
What is the Ratio of Females per 100 Males in Mapleton?
There are 122.41 Females per 100 Males in Mapleton.
What is the Median Population Age in Mapleton?
Median Population Age in Mapleton is 56.8 Years.
What is the Average Family Size in Mapleton
Average Family Size in Mapleton is 2.4 People.
What is the Average Household Size in Mapleton
Average Household Size in Mapleton is 1.8 People.
How Large is the Labor Force in Mapleton?
There are 406 People in the Labor Forcein in Mapleton.
What is the Percentage of People in the Labor Force in Mapleton?
51.4% of People are in the Labor Force in Mapleton.
What is the Unemployment Rate in Mapleton?
Unemployment Rate in Mapleton is 2.5%.