Lehigh, IA Map & Demographics
Lehigh Map
Lehigh Overview
$36,931
PER CAPITA INCOME
$71,250
AVG FAMILY INCOME
$56,667
AVG HOUSEHOLD INCOME
55.6%
WAGE / INCOME GAP [ % ]
44.4¢/ $1
WAGE / INCOME GAP [ $ ]
0.53
INEQUALITY / GINI INDEX
423
TOTAL POPULATION
217
MALE POPULATION
206
FEMALE POPULATION
105.34
MALES / 100 FEMALES
94.93
FEMALES / 100 MALES
42.1
MEDIAN AGE
2.9
AVG FAMILY SIZE
2.2
AVG HOUSEHOLD SIZE
215
LABOR FORCE [ PEOPLE ]
65.0%
PERCENT IN LABOR FORCE
4.7%
UNEMPLOYMENT RATE
Lehigh Zip Codes
Lehigh Area Codes
Income in Lehigh
Income Overview in Lehigh
Per Capita Income in Lehigh is $36,931, while median incomes of families and households are $71,250 and $56,667 respectively.
| Characteristic | Number | Measure |
| Per Capita Income | 423 | $36,931 |
| Median Family Income | 110 | $71,250 |
| Mean Family Income | 110 | $123,453 |
| Median Household Income | 188 | $56,667 |
| Mean Household Income | 188 | $91,072 |
| Income Deficit | 110 | $0 |
| Wage / Income Gap (%) | 423 | 55.62% |
| Wage / Income Gap ($) | 423 | 44.38¢ per $1 |
| Gini / Inequality Index | 423 | 0.53 |
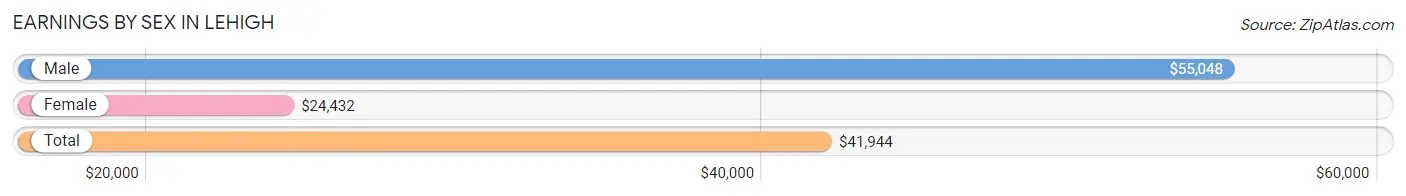
Earnings by Sex in Lehigh
Average Earnings in Lehigh are $41,944, $55,048 for men and $24,432 for women, a difference of 55.6%.
| Sex | Number | Average Earnings |
| Male | 127 (57.2%) | $55,048 |
| Female | 95 (42.8%) | $24,432 |
| Total | 222 (100.0%) | $41,944 |
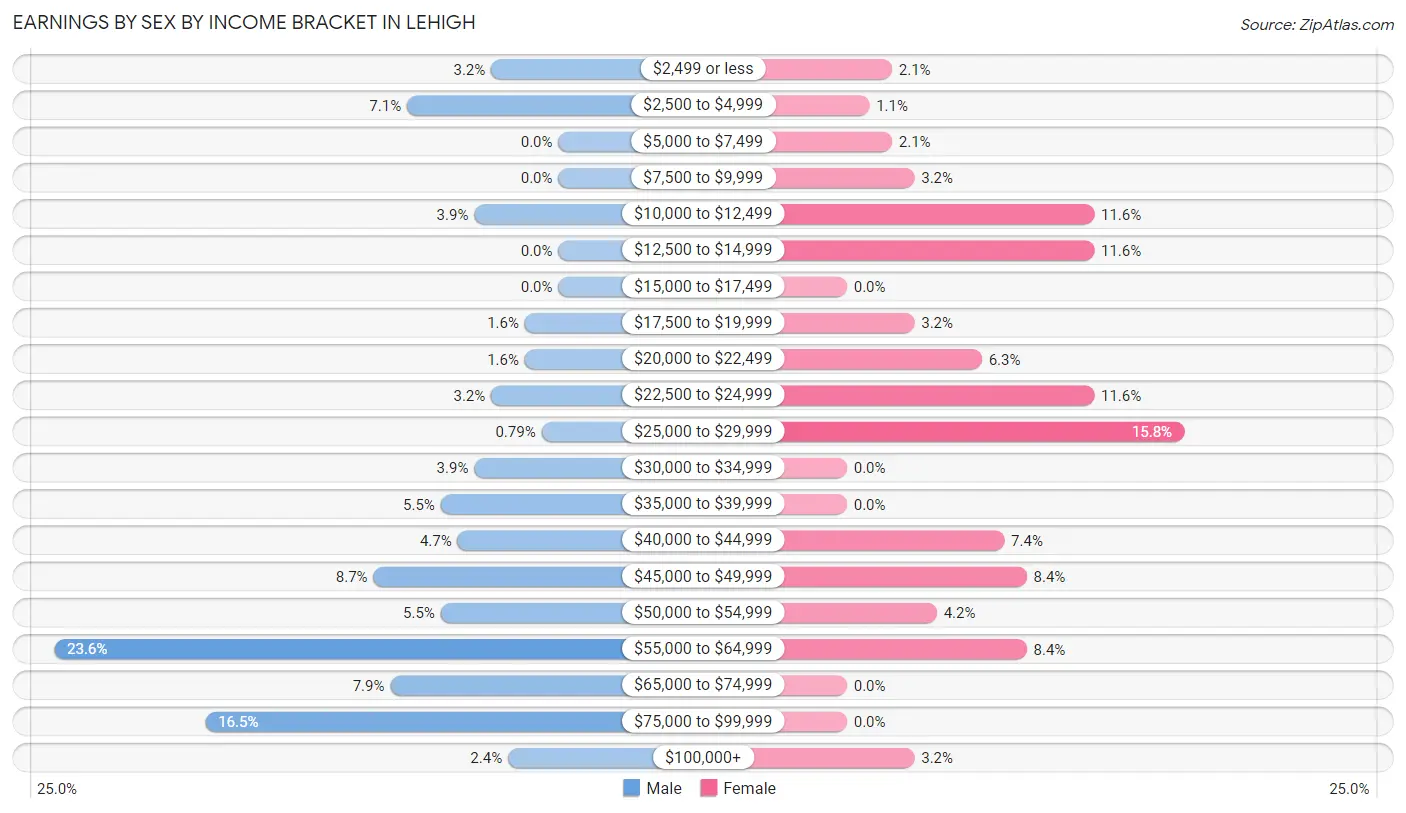
Earnings by Sex by Income Bracket in Lehigh
The most common earnings brackets in Lehigh are $55,000 to $64,999 for men (30 | 23.6%) and $25,000 to $29,999 for women (15 | 15.8%).
| Income | Male | Female |
| $2,499 or less | 4 (3.2%) | 2 (2.1%) |
| $2,500 to $4,999 | 9 (7.1%) | 1 (1.1%) |
| $5,000 to $7,499 | 0 (0.0%) | 2 (2.1%) |
| $7,500 to $9,999 | 0 (0.0%) | 3 (3.2%) |
| $10,000 to $12,499 | 5 (3.9%) | 11 (11.6%) |
| $12,500 to $14,999 | 0 (0.0%) | 11 (11.6%) |
| $15,000 to $17,499 | 0 (0.0%) | 0 (0.0%) |
| $17,500 to $19,999 | 2 (1.6%) | 3 (3.2%) |
| $20,000 to $22,499 | 2 (1.6%) | 6 (6.3%) |
| $22,500 to $24,999 | 4 (3.2%) | 11 (11.6%) |
| $25,000 to $29,999 | 1 (0.8%) | 15 (15.8%) |
| $30,000 to $34,999 | 5 (3.9%) | 0 (0.0%) |
| $35,000 to $39,999 | 7 (5.5%) | 0 (0.0%) |
| $40,000 to $44,999 | 6 (4.7%) | 7 (7.4%) |
| $45,000 to $49,999 | 11 (8.7%) | 8 (8.4%) |
| $50,000 to $54,999 | 7 (5.5%) | 4 (4.2%) |
| $55,000 to $64,999 | 30 (23.6%) | 8 (8.4%) |
| $65,000 to $74,999 | 10 (7.9%) | 0 (0.0%) |
| $75,000 to $99,999 | 21 (16.5%) | 0 (0.0%) |
| $100,000+ | 3 (2.4%) | 3 (3.2%) |
| Total | 127 (100.0%) | 95 (100.0%) |
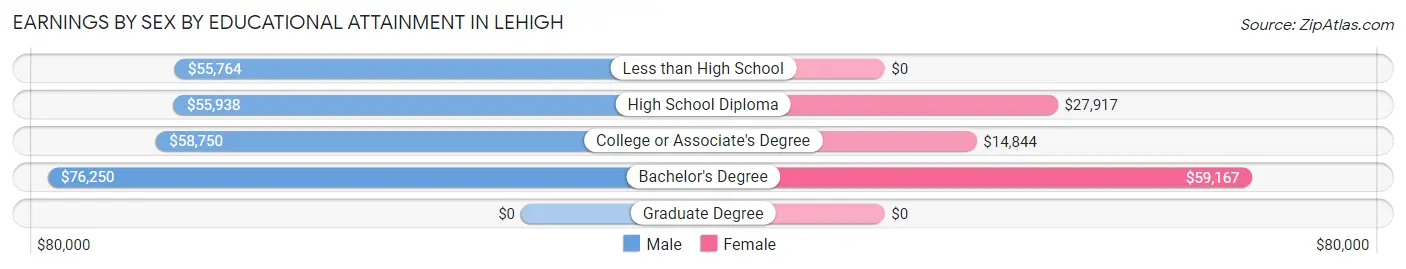
Earnings by Sex by Educational Attainment in Lehigh
Average earnings in Lehigh are $55,817 for men and $27,708 for women, a difference of 50.4%. Men with an educational attainment of bachelor's degree enjoy the highest average annual earnings of $76,250, while those with less than high school education earn the least with $55,764. Women with an educational attainment of bachelor's degree earn the most with the average annual earnings of $59,167, while those with college or associate's degree education have the smallest earnings of $14,844.
| Educational Attainment | Male Income | Female Income |
| Less than High School | $55,764 | $0 |
| High School Diploma | $55,938 | $27,917 |
| College or Associate's Degree | $58,750 | $14,844 |
| Bachelor's Degree | $76,250 | $59,167 |
| Graduate Degree | - | - |
| Total | $55,817 | $27,708 |
Family Income in Lehigh
Family Income Brackets in Lehigh
According to the Lehigh family income data, there are 22 families falling into the $50,000 to $74,999 income range, which is the most common income bracket and makes up 20.0% of all families. Conversely, the less than $10,000 income bracket is the least frequent group with only 2 families (1.8%) belonging to this category.
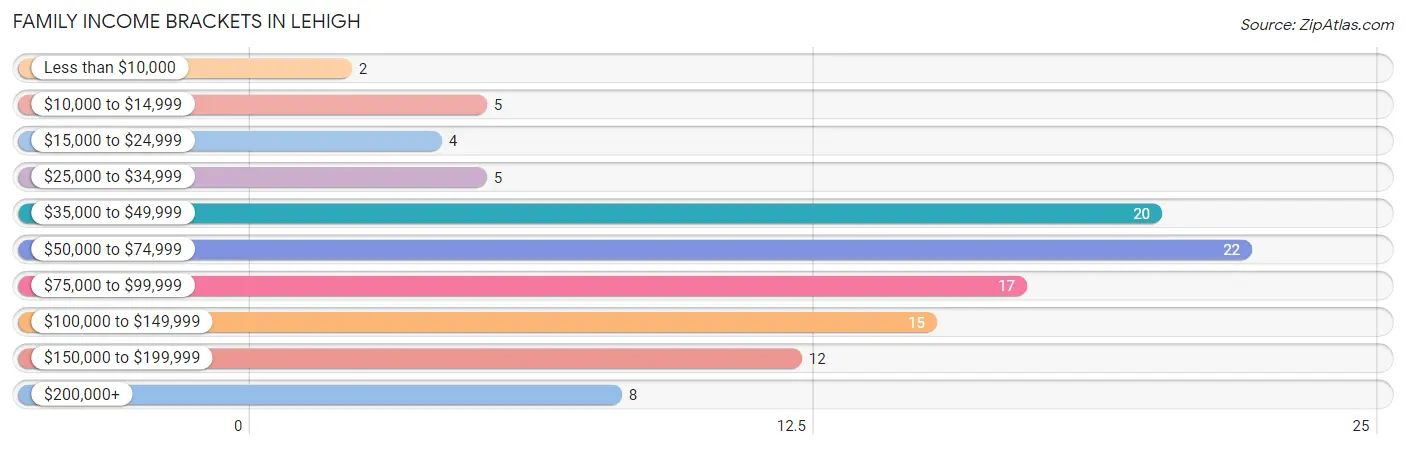
| Income Bracket | # Families | % Families |
| Less than $10,000 | 2 | 1.8% |
| $10,000 to $14,999 | 5 | 4.5% |
| $15,000 to $24,999 | 4 | 3.6% |
| $25,000 to $34,999 | 5 | 4.5% |
| $35,000 to $49,999 | 20 | 18.2% |
| $50,000 to $74,999 | 22 | 20.0% |
| $75,000 to $99,999 | 17 | 15.5% |
| $100,000 to $149,999 | 15 | 13.6% |
| $150,000 to $199,999 | 12 | 10.9% |
| $200,000+ | 8 | 7.3% |
Family Income by Famaliy Size in Lehigh
5-person families (17 | 15.4%) account for the highest median family income in Lehigh with $180,139 per family, while 5-person families (17 | 15.4%) have the highest median income of $36,028 per family member.
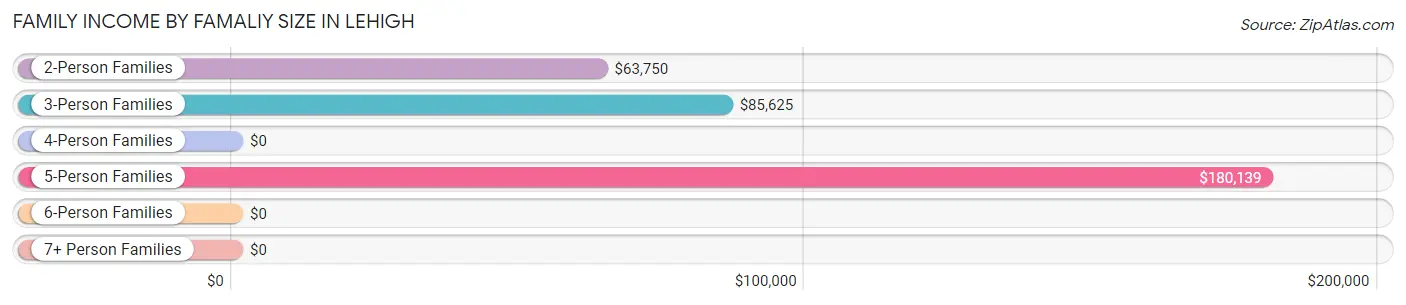
| Income Bracket | # Families | Median Income |
| 2-Person Families | 56 (50.9%) | $63,750 |
| 3-Person Families | 21 (19.1%) | $85,625 |
| 4-Person Families | 16 (14.5%) | $0 |
| 5-Person Families | 17 (15.4%) | $180,139 |
| 6-Person Families | 0 (0.0%) | $0 |
| 7+ Person Families | 0 (0.0%) | $0 |
| Total | 110 (100.0%) | $71,250 |
Family Income by Number of Earners in Lehigh
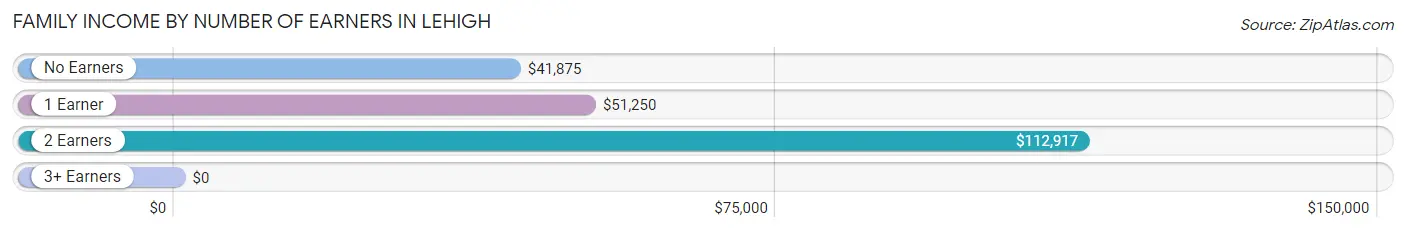
| Number of Earners | # Families | Median Income |
| No Earners | 25 (22.7%) | $41,875 |
| 1 Earner | 32 (29.1%) | $51,250 |
| 2 Earners | 31 (28.2%) | $112,917 |
| 3+ Earners | 22 (20.0%) | $0 |
| Total | 110 (100.0%) | $71,250 |
Household Income in Lehigh
Household Income Brackets in Lehigh
With 42 households falling in the category, the $50,000 to $74,999 income range is the most frequent in Lehigh, accounting for 22.3% of all households. In contrast, only 8 households (4.3%) fall into the $10,000 to $14,999 income bracket, making it the least populous group.
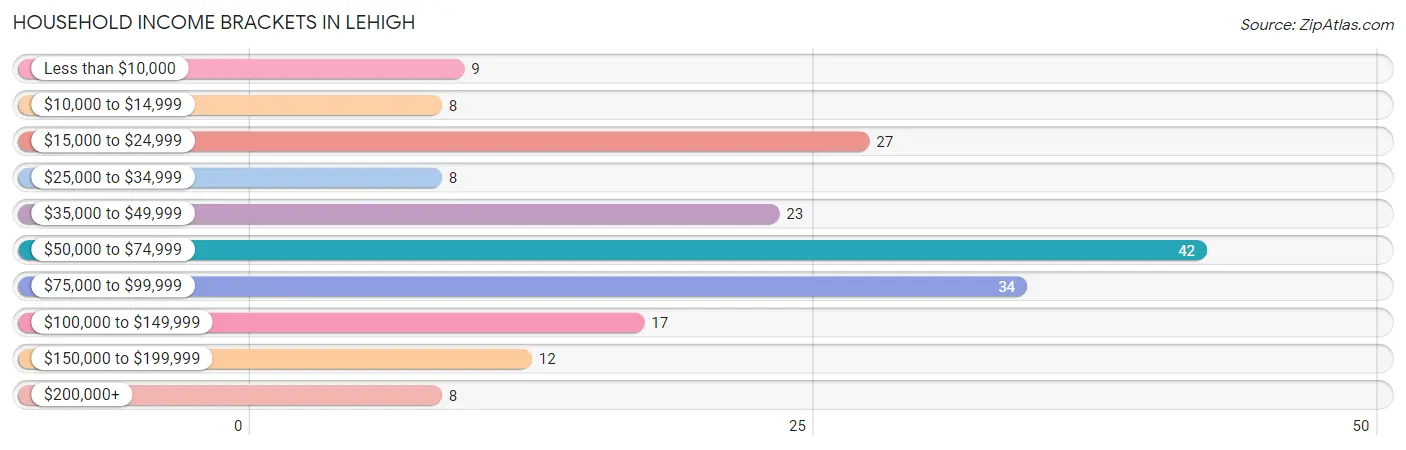
| Income Bracket | # Households | % Households |
| Less than $10,000 | 9 | 4.8% |
| $10,000 to $14,999 | 8 | 4.3% |
| $15,000 to $24,999 | 27 | 14.4% |
| $25,000 to $34,999 | 8 | 4.3% |
| $35,000 to $49,999 | 23 | 12.2% |
| $50,000 to $74,999 | 42 | 22.3% |
| $75,000 to $99,999 | 34 | 18.1% |
| $100,000 to $149,999 | 17 | 9.0% |
| $150,000 to $199,999 | 12 | 6.4% |
| $200,000+ | 8 | 4.3% |
Household Income by Householder Age in Lehigh
The median household income in Lehigh is $56,667, with the highest median household income of $84,375 found in the 45 to 64 years age bracket for the primary householder. A total of 53 households (28.2%) fall into this category. Meanwhile, the 15 to 24 years age bracket for the primary householder has the lowest median household income of $0, with 5 households (2.7%) in this group.
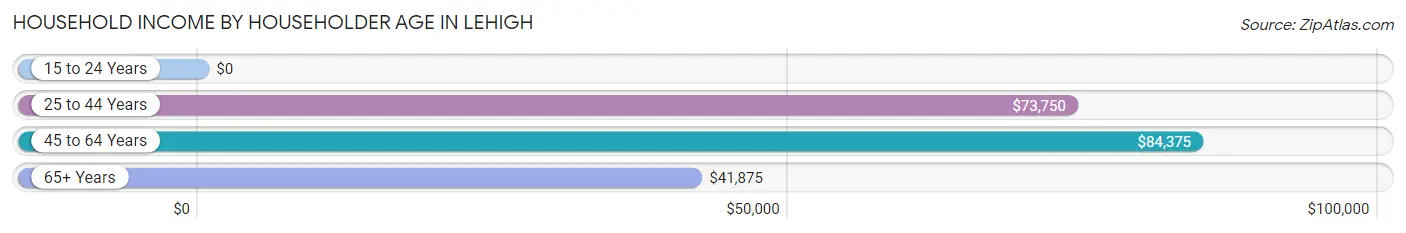
| Income Bracket | # Households | Median Income |
| 15 to 24 Years | 5 (2.7%) | $0 |
| 25 to 44 Years | 67 (35.6%) | $73,750 |
| 45 to 64 Years | 53 (28.2%) | $84,375 |
| 65+ Years | 63 (33.5%) | $41,875 |
| Total | 188 (100.0%) | $56,667 |
Poverty in Lehigh
Income Below Poverty by Sex and Age in Lehigh
With 12.0% poverty level for males and 16.0% for females among the residents of Lehigh, 5 year old males and 25 to 34 year old females are the most vulnerable to poverty, with 7 males (77.8%) and 14 females (58.3%) in their respective age groups living below the poverty level.
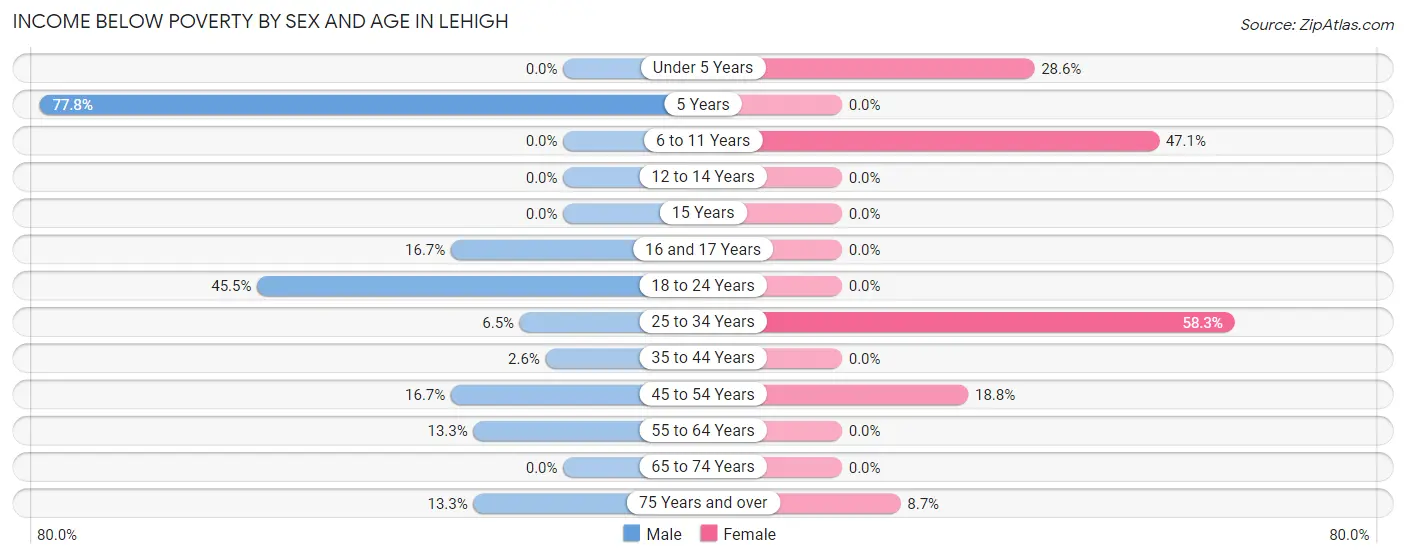
| Age Bracket | Male | Female |
| Under 5 Years | 0 (0.0%) | 6 (28.6%) |
| 5 Years | 7 (77.8%) | 0 (0.0%) |
| 6 to 11 Years | 0 (0.0%) | 8 (47.1%) |
| 12 to 14 Years | 0 (0.0%) | 0 (0.0%) |
| 15 Years | 0 (0.0%) | 0 (0.0%) |
| 16 and 17 Years | 1 (16.7%) | 0 (0.0%) |
| 18 to 24 Years | 5 (45.5%) | 0 (0.0%) |
| 25 to 34 Years | 2 (6.5%) | 14 (58.3%) |
| 35 to 44 Years | 1 (2.6%) | 0 (0.0%) |
| 45 to 54 Years | 4 (16.7%) | 3 (18.8%) |
| 55 to 64 Years | 4 (13.3%) | 0 (0.0%) |
| 65 to 74 Years | 0 (0.0%) | 0 (0.0%) |
| 75 Years and over | 2 (13.3%) | 2 (8.7%) |
| Total | 26 (12.0%) | 33 (16.0%) |
Income Above Poverty by Sex and Age in Lehigh
According to the poverty statistics in Lehigh, males aged 6 to 11 years and females aged 5 years are the age groups that are most secure financially, with 100.0% of males and 100.0% of females in these age groups living above the poverty line.
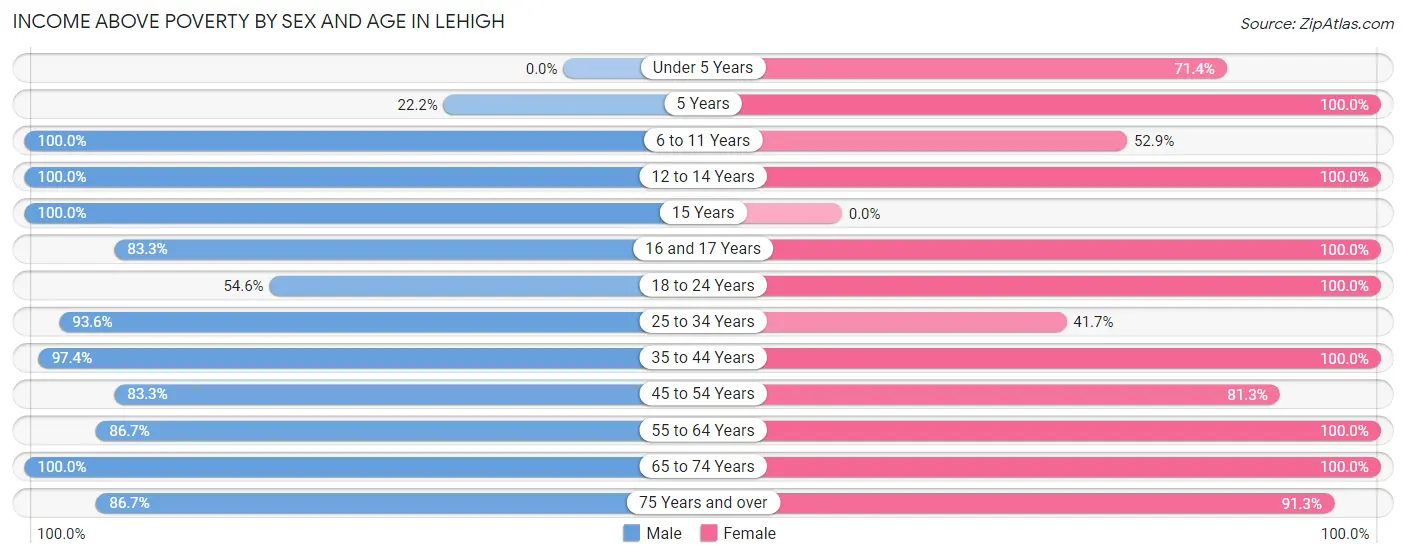
| Age Bracket | Male | Female |
| Under 5 Years | 0 (0.0%) | 15 (71.4%) |
| 5 Years | 2 (22.2%) | 12 (100.0%) |
| 6 to 11 Years | 13 (100.0%) | 9 (52.9%) |
| 12 to 14 Years | 5 (100.0%) | 13 (100.0%) |
| 15 Years | 2 (100.0%) | 0 (0.0%) |
| 16 and 17 Years | 5 (83.3%) | 2 (100.0%) |
| 18 to 24 Years | 6 (54.5%) | 11 (100.0%) |
| 25 to 34 Years | 29 (93.5%) | 10 (41.7%) |
| 35 to 44 Years | 37 (97.4%) | 19 (100.0%) |
| 45 to 54 Years | 20 (83.3%) | 13 (81.2%) |
| 55 to 64 Years | 26 (86.7%) | 24 (100.0%) |
| 65 to 74 Years | 33 (100.0%) | 24 (100.0%) |
| 75 Years and over | 13 (86.7%) | 21 (91.3%) |
| Total | 191 (88.0%) | 173 (84.0%) |
Income Below Poverty Among Married-Couple Families in Lehigh
The poverty statistics for married-couple families in Lehigh show that 2.5% or 2 of the total 81 families live below the poverty line. Families with no children have the highest poverty rate of 4.3%, comprising of 2 families. On the other hand, families with 1 or 2 children have the lowest poverty rate of 0.0%, which includes 0 families.
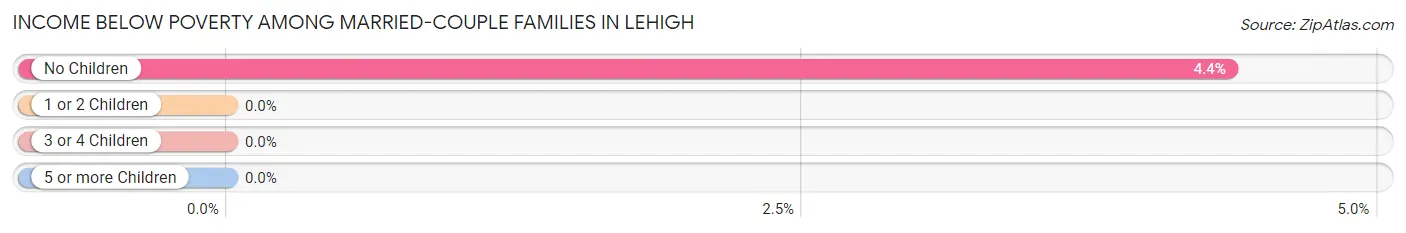
| Children | Above Poverty | Below Poverty |
| No Children | 44 (95.7%) | 2 (4.3%) |
| 1 or 2 Children | 27 (100.0%) | 0 (0.0%) |
| 3 or 4 Children | 8 (100.0%) | 0 (0.0%) |
| 5 or more Children | 0 (0.0%) | 0 (0.0%) |
| Total | 79 (97.5%) | 2 (2.5%) |
Income Below Poverty Among Single-Parent Households in Lehigh
According to the poverty data in Lehigh, 20.0% or 2 single-father households and 42.1% or 8 single-mother households are living below the poverty line. Among single-father households, those with no children have the highest poverty rate, with 2 households (50.0%) experiencing poverty. Likewise, among single-mother households, those with 1 or 2 children have the highest poverty rate, with 3 households (100.0%) falling below the poverty line.
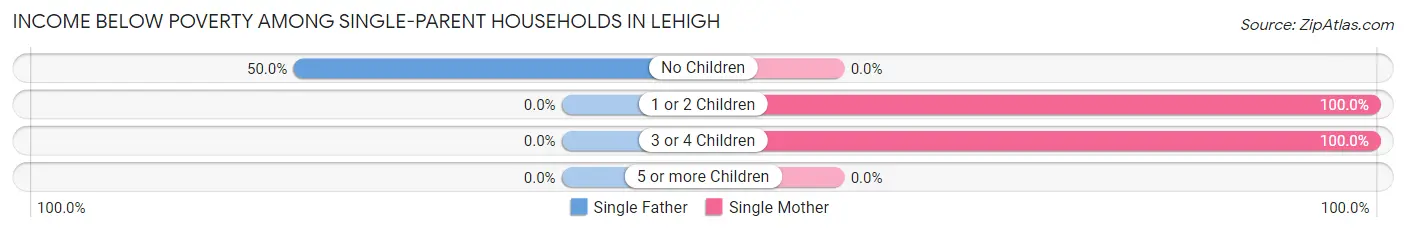
| Children | Single Father | Single Mother |
| No Children | 2 (50.0%) | 0 (0.0%) |
| 1 or 2 Children | 0 (0.0%) | 3 (100.0%) |
| 3 or 4 Children | 0 (0.0%) | 5 (100.0%) |
| 5 or more Children | 0 (0.0%) | 0 (0.0%) |
| Total | 2 (20.0%) | 8 (42.1%) |
Income Below Poverty Among Married-Couple vs Single-Parent Households in Lehigh
The poverty data for Lehigh shows that 2 of the married-couple family households (2.5%) and 10 of the single-parent households (34.5%) are living below the poverty level. Within the married-couple family households, those with no children have the highest poverty rate, with 2 households (4.3%) falling below the poverty line. Among the single-parent households, those with 1 or 2 children have the highest poverty rate, with 3 household (60.0%) living below poverty.
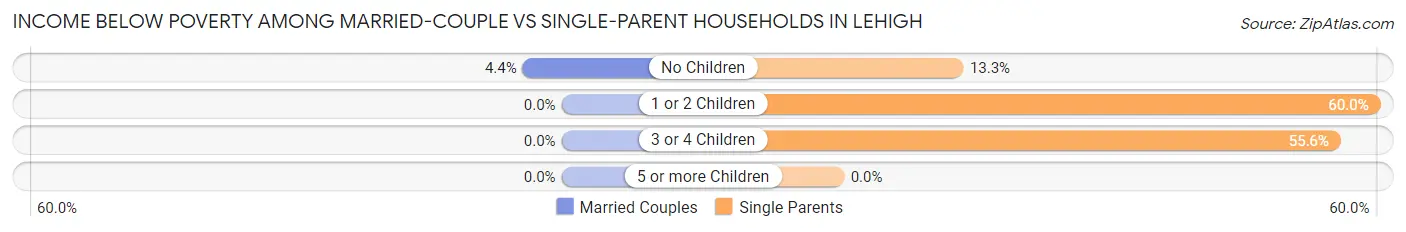
| Children | Married-Couple Families | Single-Parent Households |
| No Children | 2 (4.3%) | 2 (13.3%) |
| 1 or 2 Children | 0 (0.0%) | 3 (60.0%) |
| 3 or 4 Children | 0 (0.0%) | 5 (55.6%) |
| 5 or more Children | 0 (0.0%) | 0 (0.0%) |
| Total | 2 (2.5%) | 10 (34.5%) |
Race in Lehigh
The most populous races in Lehigh are White / Caucasian (422 | 99.8%), and Two or more Races (1 | 0.2%).
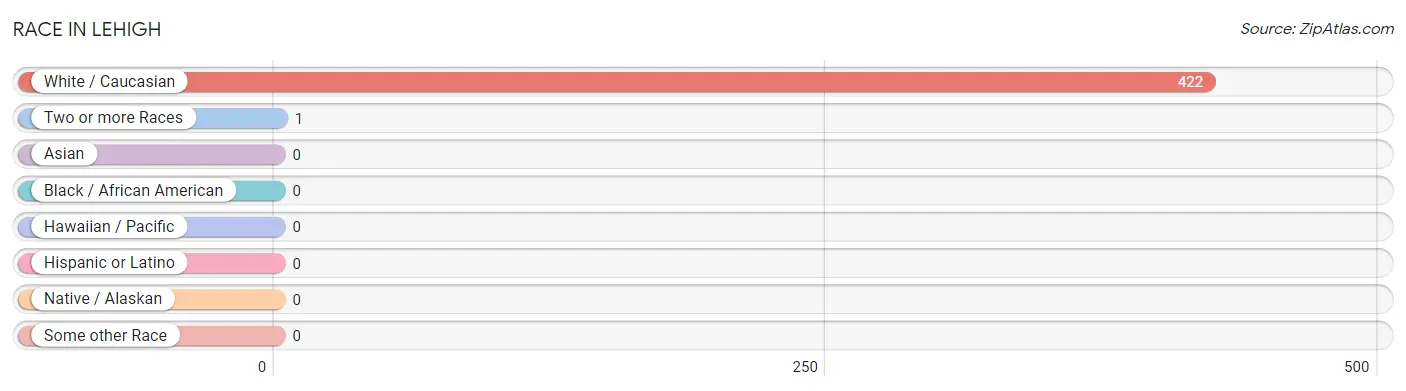
| Race | # Population | % Population |
| Asian | 0 | 0.0% |
| Black / African American | 0 | 0.0% |
| Hawaiian / Pacific | 0 | 0.0% |
| Hispanic or Latino | 0 | 0.0% |
| Native / Alaskan | 0 | 0.0% |
| White / Caucasian | 422 | 99.8% |
| Two or more Races | 1 | 0.2% |
| Some other Race | 0 | 0.0% |
| Total | 423 | 100.0% |
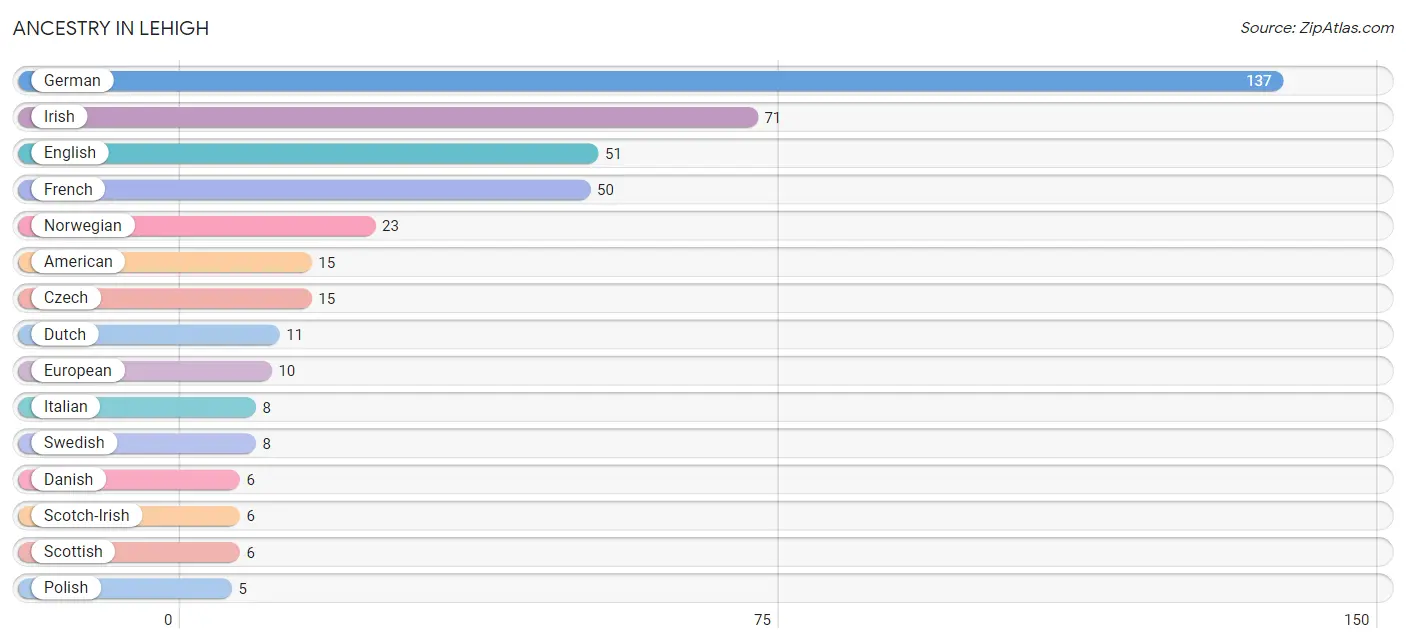
Ancestry in Lehigh
The most populous ancestries reported in Lehigh are German (137 | 32.4%), Irish (71 | 16.8%), English (51 | 12.1%), French (50 | 11.8%), and Norwegian (23 | 5.4%), together accounting for 78.5% of all Lehigh residents.
| Ancestry | # Population | % Population |
| American | 15 | 3.5% |
| Austrian | 2 | 0.5% |
| British | 2 | 0.5% |
| Bulgarian | 2 | 0.5% |
| Czech | 15 | 3.5% |
| Danish | 6 | 1.4% |
| Dutch | 11 | 2.6% |
| English | 51 | 12.1% |
| European | 10 | 2.4% |
| French | 50 | 11.8% |
| German | 137 | 32.4% |
| Irish | 71 | 16.8% |
| Italian | 8 | 1.9% |
| Norwegian | 23 | 5.4% |
| Polish | 5 | 1.2% |
| Romanian | 3 | 0.7% |
| Scotch-Irish | 6 | 1.4% |
| Scottish | 6 | 1.4% |
| Sioux | 1 | 0.2% |
| Slavic | 1 | 0.2% |
| Swedish | 8 | 1.9% | View All 21 Rows |
Immigrants in Lehigh

| Immigration Origin | # Population | % Population | View All 0 Rows |
Sex and Age in Lehigh
Sex and Age in Lehigh
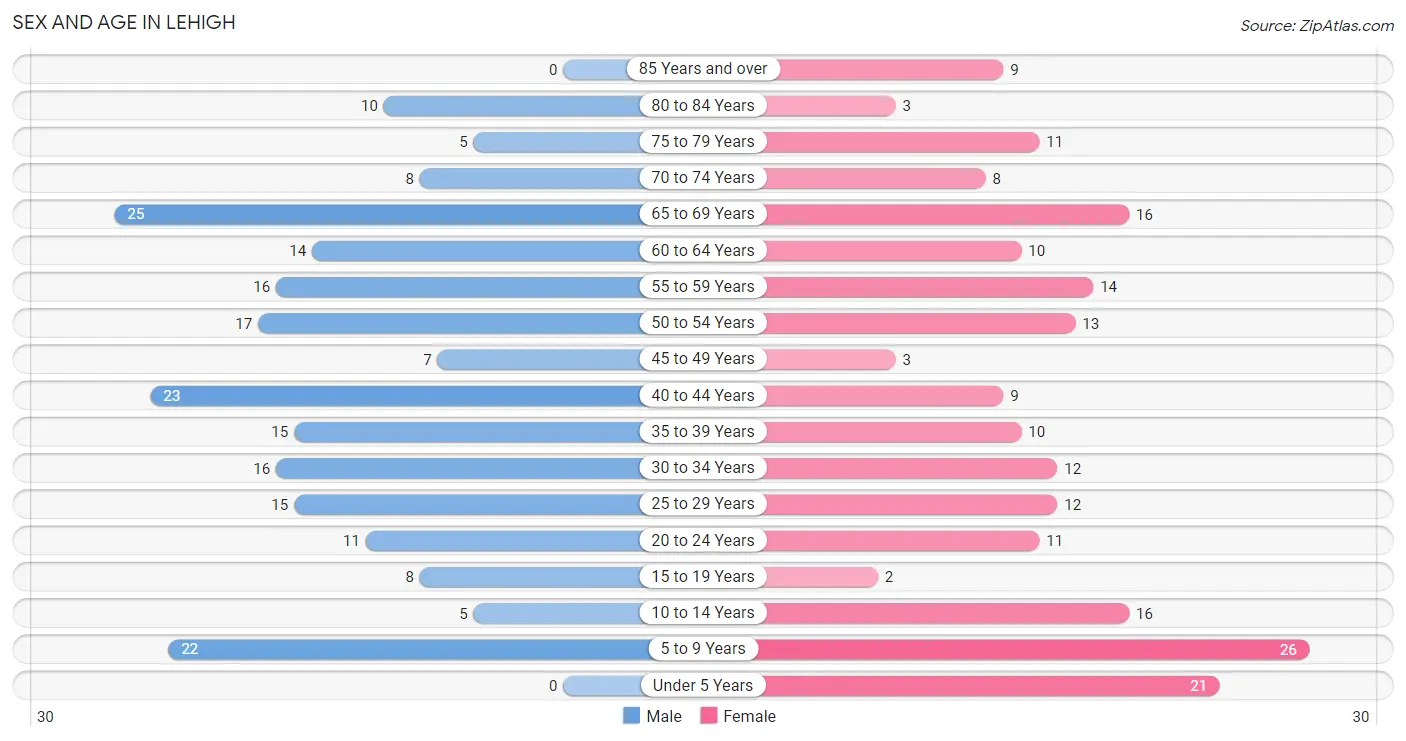
The most populous age groups in Lehigh are 65 to 69 Years (25 | 11.5%) for men and 5 to 9 Years (26 | 12.6%) for women.
| Age Bracket | Male | Female |
| Under 5 Years | 0 (0.0%) | 21 (10.2%) |
| 5 to 9 Years | 22 (10.1%) | 26 (12.6%) |
| 10 to 14 Years | 5 (2.3%) | 16 (7.8%) |
| 15 to 19 Years | 8 (3.7%) | 2 (1.0%) |
| 20 to 24 Years | 11 (5.1%) | 11 (5.3%) |
| 25 to 29 Years | 15 (6.9%) | 12 (5.8%) |
| 30 to 34 Years | 16 (7.4%) | 12 (5.8%) |
| 35 to 39 Years | 15 (6.9%) | 10 (4.9%) |
| 40 to 44 Years | 23 (10.6%) | 9 (4.4%) |
| 45 to 49 Years | 7 (3.2%) | 3 (1.5%) |
| 50 to 54 Years | 17 (7.8%) | 13 (6.3%) |
| 55 to 59 Years | 16 (7.4%) | 14 (6.8%) |
| 60 to 64 Years | 14 (6.5%) | 10 (4.9%) |
| 65 to 69 Years | 25 (11.5%) | 16 (7.8%) |
| 70 to 74 Years | 8 (3.7%) | 8 (3.9%) |
| 75 to 79 Years | 5 (2.3%) | 11 (5.3%) |
| 80 to 84 Years | 10 (4.6%) | 3 (1.5%) |
| 85 Years and over | 0 (0.0%) | 9 (4.4%) |
| Total | 217 (100.0%) | 206 (100.0%) |
Families and Households in Lehigh
Median Family Size in Lehigh
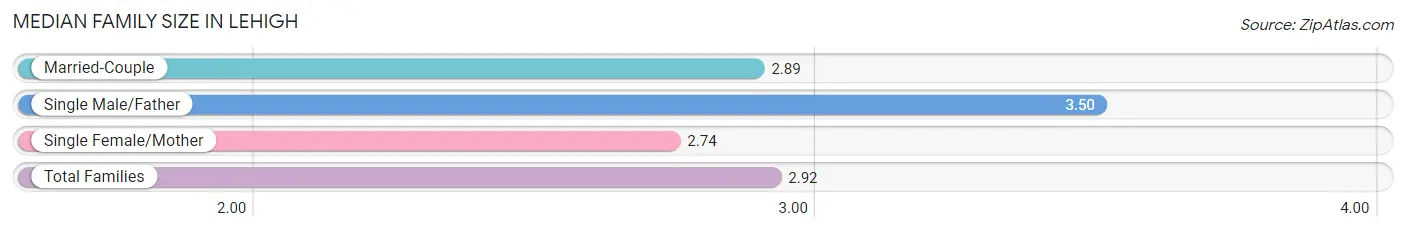
The median family size in Lehigh is 2.92 persons per family, with single male/father families (10 | 9.1%) accounting for the largest median family size of 3.5 persons per family. On the other hand, single female/mother families (19 | 17.3%) represent the smallest median family size with 2.74 persons per family.
| Family Type | # Families | Family Size |
| Married-Couple | 81 (73.6%) | 2.89 |
| Single Male/Father | 10 (9.1%) | 3.50 |
| Single Female/Mother | 19 (17.3%) | 2.74 |
| Total Families | 110 (100.0%) | 2.92 |
Median Household Size in Lehigh
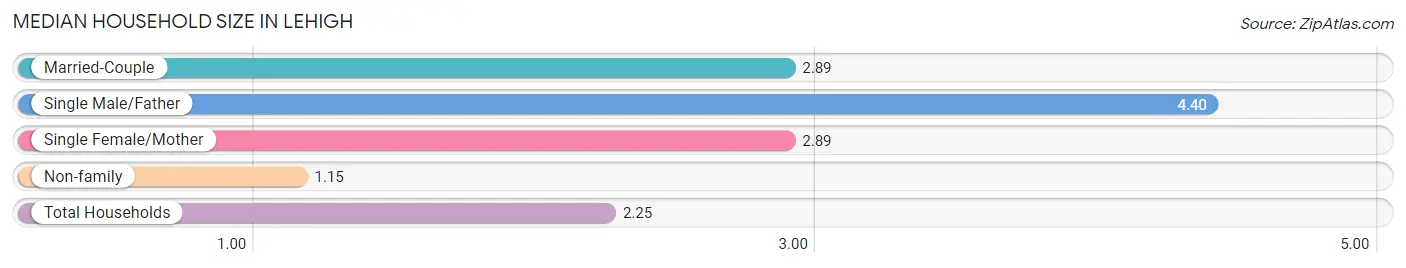
The median household size in Lehigh is 2.25 persons per household, with single male/father households (10 | 5.3%) accounting for the largest median household size of 4.4 persons per household. non-family households (78 | 41.5%) represent the smallest median household size with 1.15 persons per household.
| Household Type | # Households | Household Size |
| Married-Couple | 81 (43.1%) | 2.89 |
| Single Male/Father | 10 (5.3%) | 4.40 |
| Single Female/Mother | 19 (10.1%) | 2.89 |
| Non-family | 78 (41.5%) | 1.15 |
| Total Households | 188 (100.0%) | 2.25 |
Household Size by Marriage Status in Lehigh
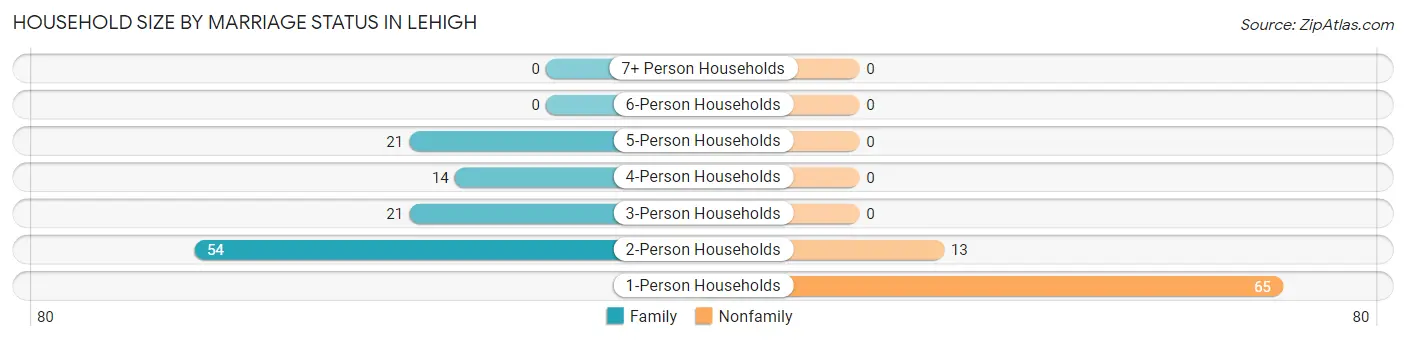
Out of a total of 188 households in Lehigh, 110 (58.5%) are family households, while 78 (41.5%) are nonfamily households. The most numerous type of family households are 2-person households, comprising 54, and the most common type of nonfamily households are 1-person households, comprising 65.
| Household Size | Family Households | Nonfamily Households |
| 1-Person Households | - | 65 (34.6%) |
| 2-Person Households | 54 (28.7%) | 13 (6.9%) |
| 3-Person Households | 21 (11.2%) | 0 (0.0%) |
| 4-Person Households | 14 (7.4%) | 0 (0.0%) |
| 5-Person Households | 21 (11.2%) | 0 (0.0%) |
| 6-Person Households | 0 (0.0%) | 0 (0.0%) |
| 7+ Person Households | 0 (0.0%) | 0 (0.0%) |
| Total | 110 (58.5%) | 78 (41.5%) |
Female Fertility in Lehigh
Fertility by Age in Lehigh
Average fertility rate in Lehigh is 136.0 births per 1,000 women. Women in the age bracket of 20 to 34 years have the highest fertility rate with 229.0 births per 1,000 women. Women in the age bracket of 20 to 34 years acount for 100.0% of all women with births.
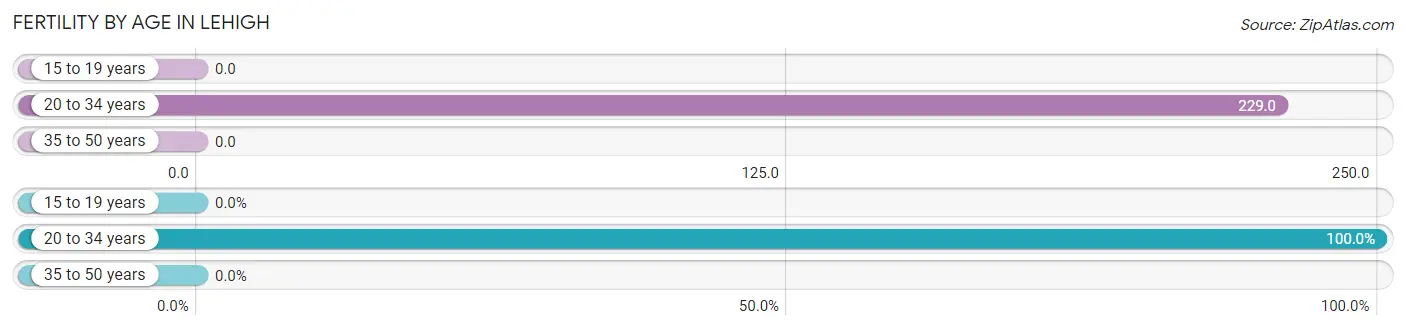
| Age Bracket | Women with Births | Births / 1,000 Women |
| 15 to 19 years | 0 (0.0%) | 0.0 |
| 20 to 34 years | 8 (100.0%) | 229.0 |
| 35 to 50 years | 0 (0.0%) | 0.0 |
| Total | 8 (100.0%) | 136.0 |
Fertility by Age by Marriage Status in Lehigh
25.0% of women with births (8) in Lehigh are married. The highest percentage of unmarried women with births falls into 20 to 34 years age bracket with 75.0% of them unmarried at the time of birth, while the lowest percentage of unmarried women with births belong to 20 to 34 years age bracket with 75.0% of them unmarried.
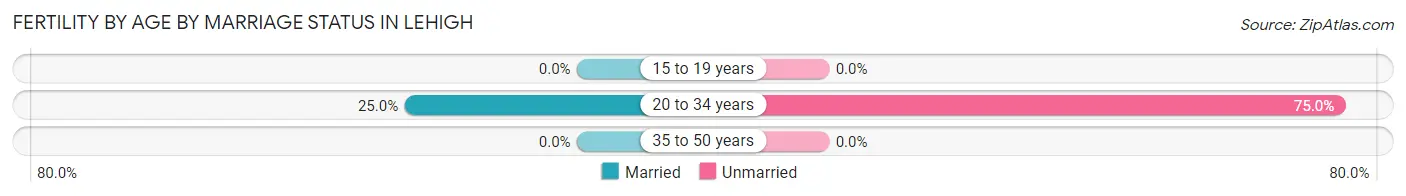
| Age Bracket | Married | Unmarried |
| 15 to 19 years | 0 (0.0%) | 0 (0.0%) |
| 20 to 34 years | 2 (25.0%) | 6 (75.0%) |
| 35 to 50 years | 0 (0.0%) | 0 (0.0%) |
| Total | 2 (25.0%) | 6 (75.0%) |
Fertility by Education in Lehigh
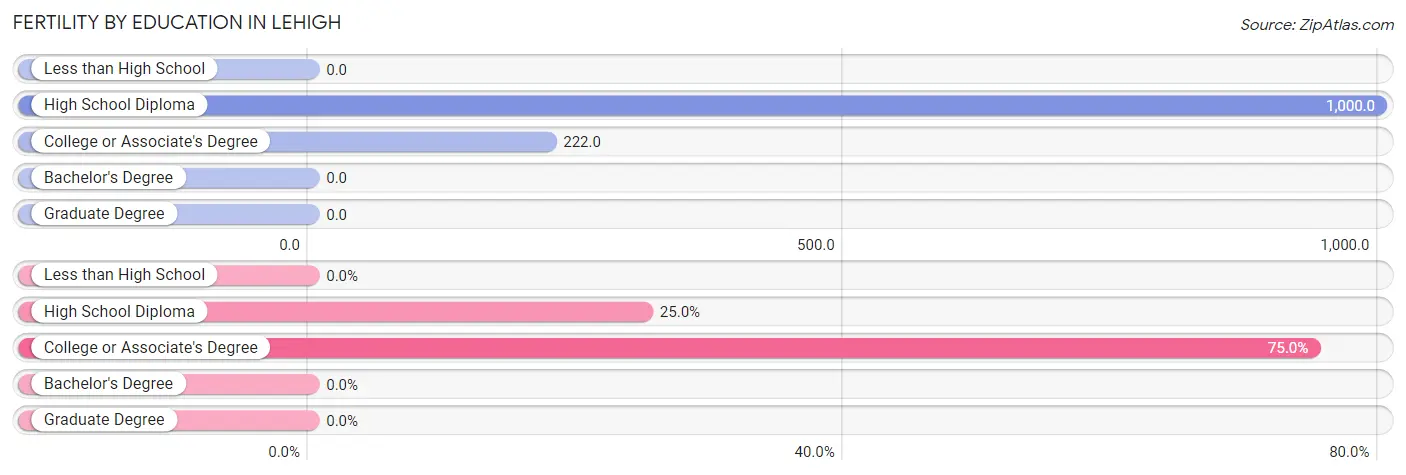
| Educational Attainment | Women with Births | Births / 1,000 Women |
| Less than High School | 0 (0.0%) | 0.0 |
| High School Diploma | 2 (25.0%) | 1,000.0 |
| College or Associate's Degree | 6 (75.0%) | 222.0 |
| Bachelor's Degree | 0 (0.0%) | 0.0 |
| Graduate Degree | 0 (0.0%) | 0.0 |
| Total | 8 (100.0%) | 136.0 |
Fertility by Education by Marriage Status in Lehigh
75.0% of women with births in Lehigh are unmarried. Women with the educational attainment of high school diploma are most likely to be married with 100.0% of them married at childbirth, while women with the educational attainment of college or associate's degree are least likely to be married with 100.0% of them unmarried at childbirth.
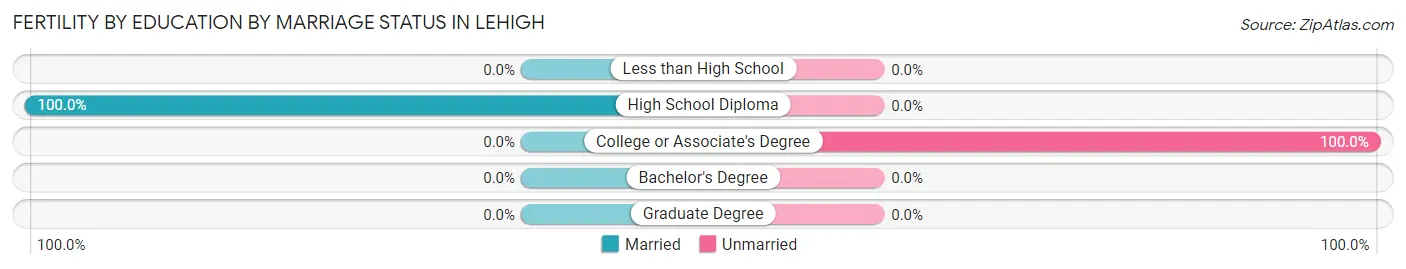
| Educational Attainment | Married | Unmarried |
| Less than High School | 0 (0.0%) | 0 (0.0%) |
| High School Diploma | 2 (100.0%) | 0 (0.0%) |
| College or Associate's Degree | 0 (0.0%) | 6 (100.0%) |
| Bachelor's Degree | 0 (0.0%) | 0 (0.0%) |
| Graduate Degree | 0 (0.0%) | 0 (0.0%) |
| Total | 2 (25.0%) | 6 (75.0%) |
Employment Characteristics in Lehigh
Employment by Class of Employer in Lehigh
Among the 205 employed individuals in Lehigh, private company employees (147 | 71.7%), local government employees (17 | 8.3%), and state government employees (17 | 8.3%) make up the most common classes of employment.
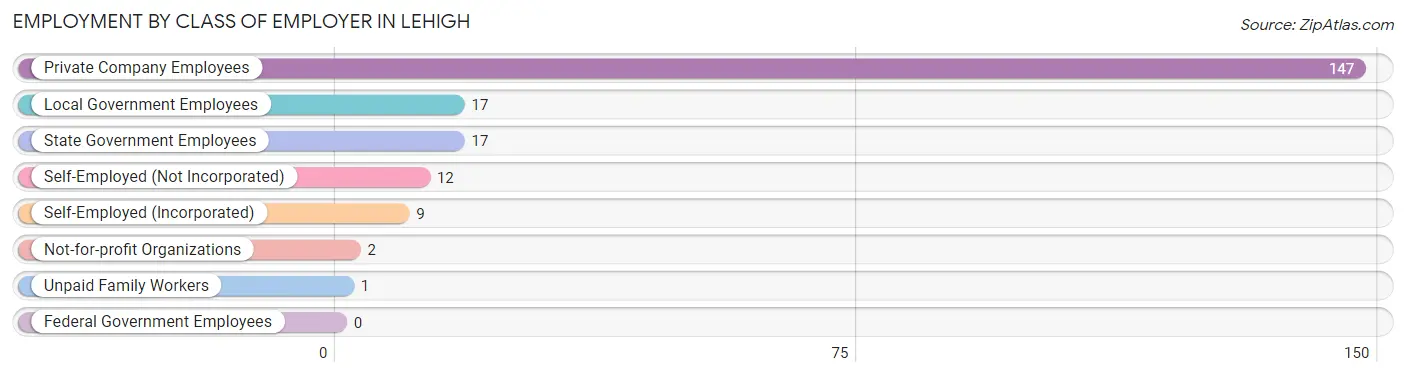
| Employer Class | # Employees | % Employees |
| Private Company Employees | 147 | 71.7% |
| Self-Employed (Incorporated) | 9 | 4.4% |
| Self-Employed (Not Incorporated) | 12 | 5.9% |
| Not-for-profit Organizations | 2 | 1.0% |
| Local Government Employees | 17 | 8.3% |
| State Government Employees | 17 | 8.3% |
| Federal Government Employees | 0 | 0.0% |
| Unpaid Family Workers | 1 | 0.5% |
| Total | 205 | 100.0% |
Employment Status by Age in Lehigh
According to the labor force statistics for Lehigh, out of the total population over 16 years of age (331), 65.0% or 215 individuals are in the labor force, with 4.7% or 10 of them unemployed. The age group with the highest labor force participation rate is 20 to 24 years, with 100.0% or 22 individuals in the labor force. Within the labor force, the 45 to 54 years age range has the highest percentage of unemployed individuals, with 12.5% or 4 of them being unemployed.
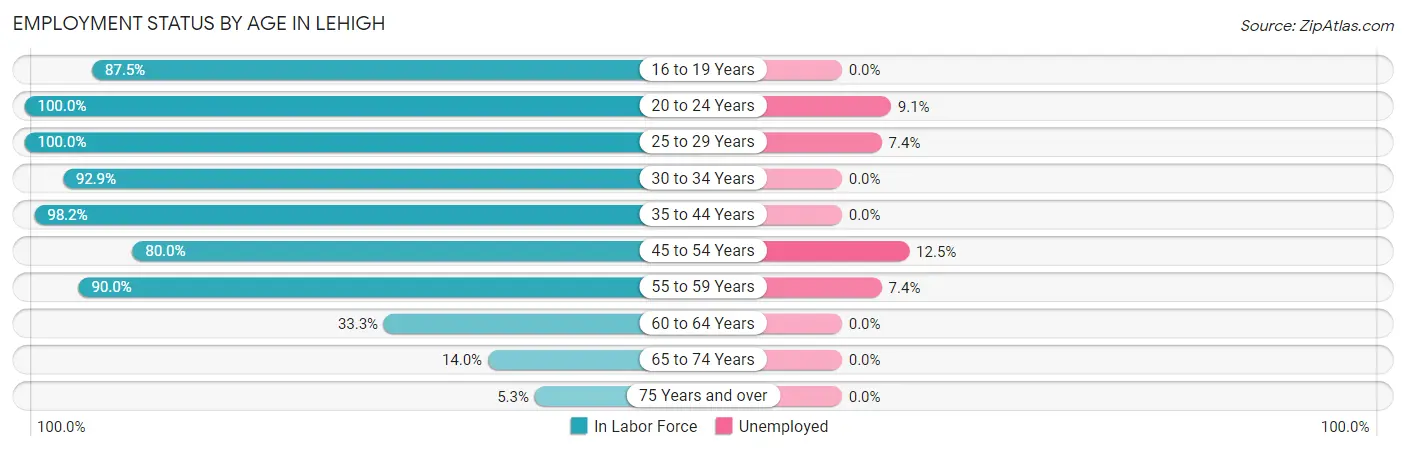
| Age Bracket | In Labor Force | Unemployed |
| 16 to 19 Years | 7 (87.5%) | 0 (0.0%) |
| 20 to 24 Years | 22 (100.0%) | 2 (9.1%) |
| 25 to 29 Years | 27 (100.0%) | 2 (7.4%) |
| 30 to 34 Years | 26 (92.9%) | 0 (0.0%) |
| 35 to 44 Years | 56 (98.2%) | 0 (0.0%) |
| 45 to 54 Years | 32 (80.0%) | 4 (12.5%) |
| 55 to 59 Years | 27 (90.0%) | 2 (7.4%) |
| 60 to 64 Years | 8 (33.3%) | 0 (0.0%) |
| 65 to 74 Years | 8 (14.0%) | 0 (0.0%) |
| 75 Years and over | 2 (5.3%) | 0 (0.0%) |
| Total | 215 (65.0%) | 10 (4.7%) |
Employment Status by Educational Attainment in Lehigh
According to labor force statistics for Lehigh, 85.4% of individuals (176) out of the total population between 25 and 64 years of age (206) are in the labor force, with 4.5% or 8 of them being unemployed. The group with the highest labor force participation rate are those with the educational attainment of less than high school, with 100.0% or 29 individuals in the labor force. Within the labor force, individuals with bachelor's degree or higher education have the highest percentage of unemployment, with 14.3% or 4 of them being unemployed.
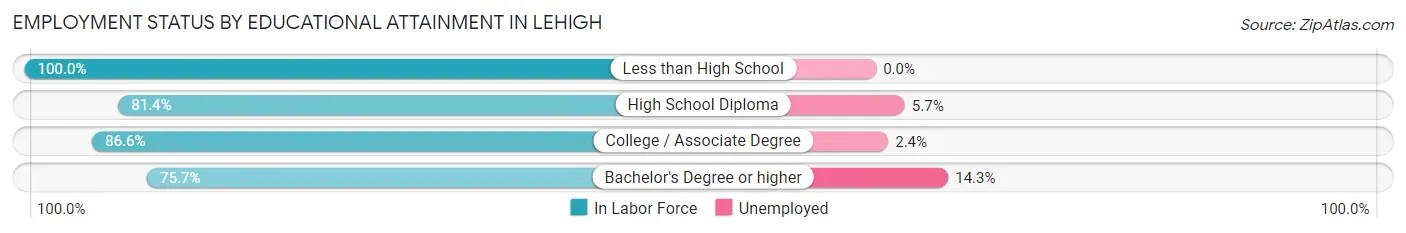
| Educational Attainment | In Labor Force | Unemployed |
| Less than High School | 29 (100.0%) | 0 (0.0%) |
| High School Diploma | 35 (81.4%) | 2 (5.7%) |
| College / Associate Degree | 84 (86.6%) | 2 (2.4%) |
| Bachelor's Degree or higher | 28 (75.7%) | 5 (14.3%) |
| Total | 176 (85.4%) | 9 (4.5%) |
Employment Occupations by Sex in Lehigh
Management, Business, Science and Arts Occupations
The most common Management, Business, Science and Arts occupations in Lehigh are Management (29 | 14.1%), Community & Social Service (17 | 8.3%), Education Instruction & Library (14 | 6.8%), Computers, Engineering & Science (10 | 4.9%), and Architecture & Engineering (8 | 3.9%).
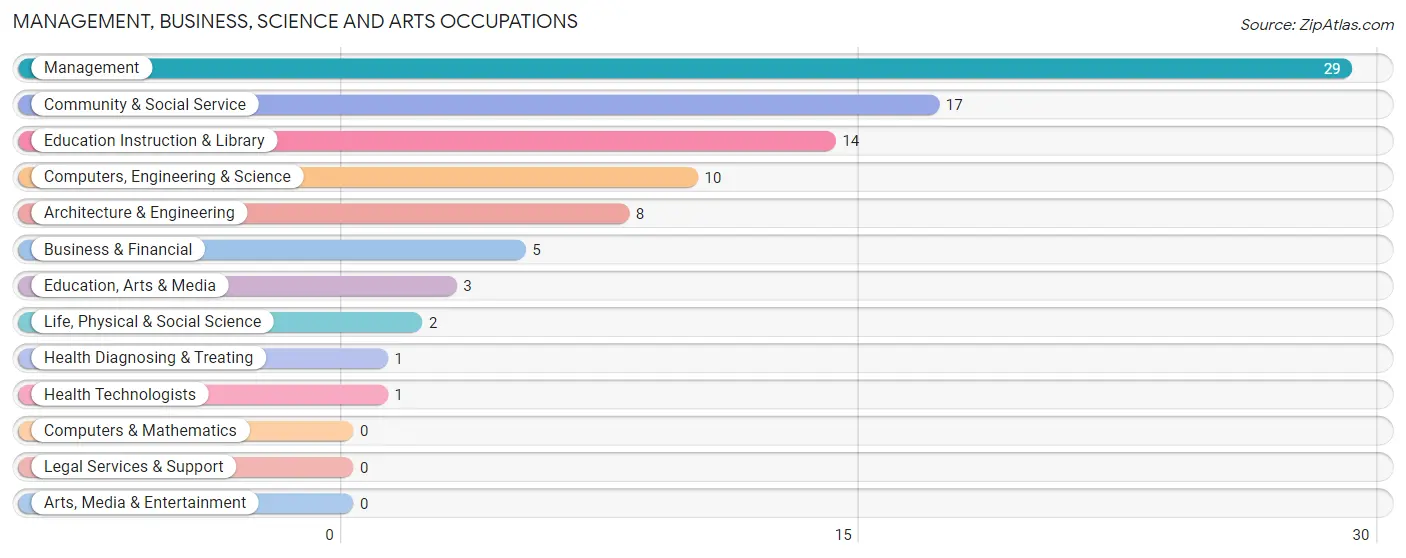
Management, Business, Science and Arts Occupations by Sex
Within the Management, Business, Science and Arts occupations in Lehigh, the most male-oriented occupations are Architecture & Engineering (100.0%), Computers, Engineering & Science (80.0%), and Business & Financial (60.0%), while the most female-oriented occupations are Life, Physical & Social Science (100.0%), Education, Arts & Media (100.0%), and Health Diagnosing & Treating (100.0%).
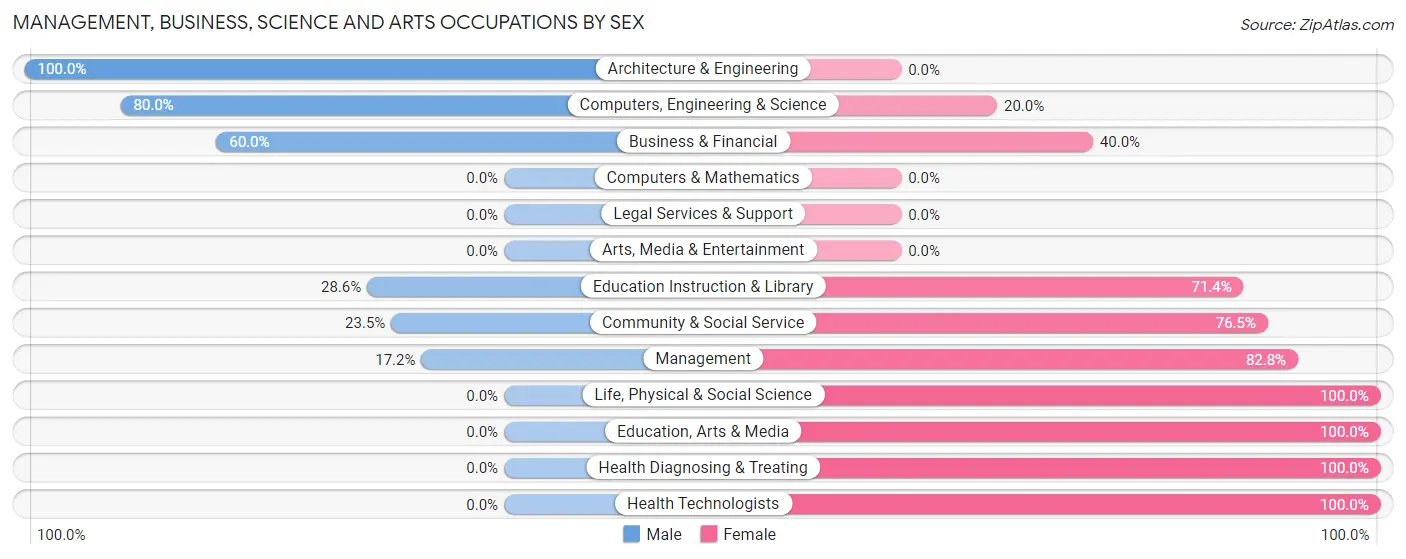
| Occupation | Male | Female |
| Management | 5 (17.2%) | 24 (82.8%) |
| Business & Financial | 3 (60.0%) | 2 (40.0%) |
| Computers, Engineering & Science | 8 (80.0%) | 2 (20.0%) |
| Computers & Mathematics | 0 (0.0%) | 0 (0.0%) |
| Architecture & Engineering | 8 (100.0%) | 0 (0.0%) |
| Life, Physical & Social Science | 0 (0.0%) | 2 (100.0%) |
| Community & Social Service | 4 (23.5%) | 13 (76.5%) |
| Education, Arts & Media | 0 (0.0%) | 3 (100.0%) |
| Legal Services & Support | 0 (0.0%) | 0 (0.0%) |
| Education Instruction & Library | 4 (28.6%) | 10 (71.4%) |
| Arts, Media & Entertainment | 0 (0.0%) | 0 (0.0%) |
| Health Diagnosing & Treating | 0 (0.0%) | 1 (100.0%) |
| Health Technologists | 0 (0.0%) | 1 (100.0%) |
| Total (Category) | 20 (32.3%) | 42 (67.7%) |
| Total (Overall) | 118 (57.6%) | 87 (42.4%) |
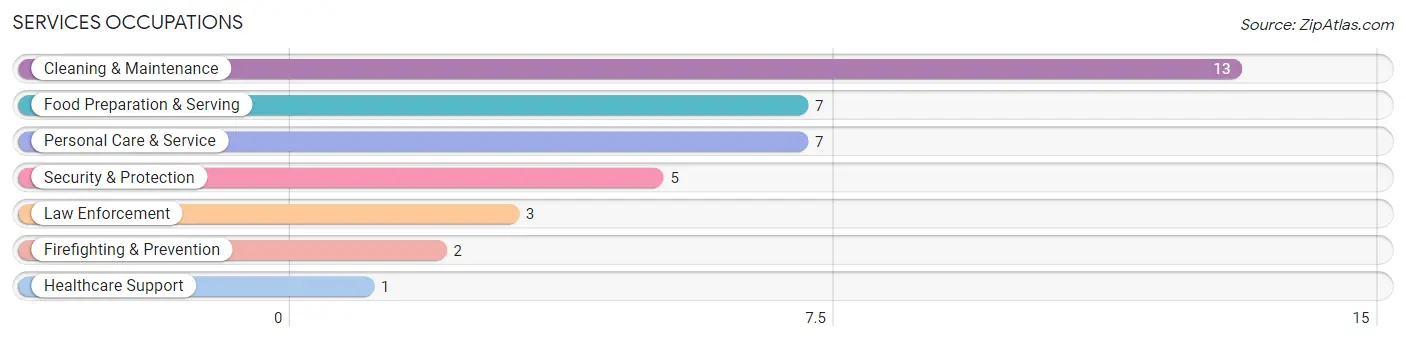
Services Occupations
The most common Services occupations in Lehigh are Cleaning & Maintenance (13 | 6.3%), Food Preparation & Serving (7 | 3.4%), Personal Care & Service (7 | 3.4%), Security & Protection (5 | 2.4%), and Law Enforcement (3 | 1.5%).
Services Occupations by Sex
Within the Services occupations in Lehigh, the most male-oriented occupations are Firefighting & Prevention (100.0%), Security & Protection (40.0%), and Cleaning & Maintenance (38.5%), while the most female-oriented occupations are Healthcare Support (100.0%), Law Enforcement (100.0%), and Personal Care & Service (100.0%).
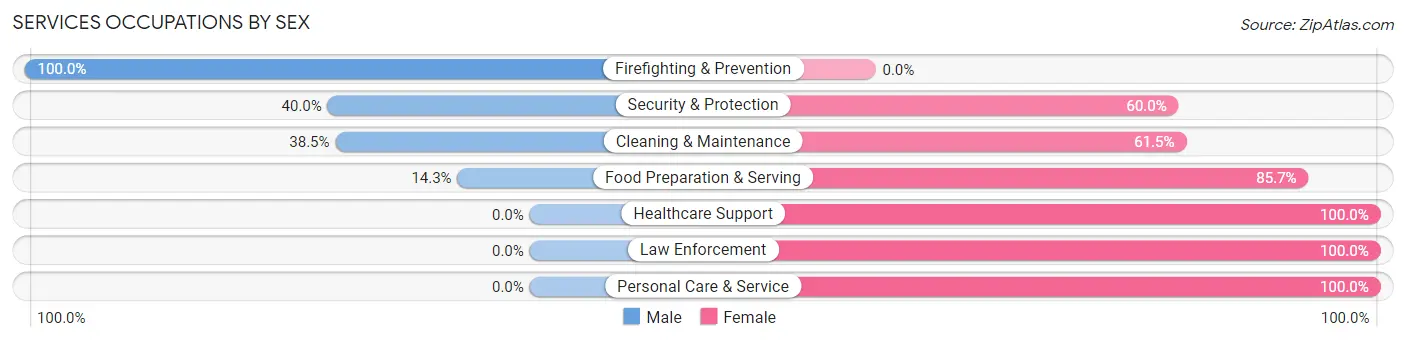
| Occupation | Male | Female |
| Healthcare Support | 0 (0.0%) | 1 (100.0%) |
| Security & Protection | 2 (40.0%) | 3 (60.0%) |
| Firefighting & Prevention | 2 (100.0%) | 0 (0.0%) |
| Law Enforcement | 0 (0.0%) | 3 (100.0%) |
| Food Preparation & Serving | 1 (14.3%) | 6 (85.7%) |
| Cleaning & Maintenance | 5 (38.5%) | 8 (61.5%) |
| Personal Care & Service | 0 (0.0%) | 7 (100.0%) |
| Total (Category) | 8 (24.2%) | 25 (75.8%) |
| Total (Overall) | 118 (57.6%) | 87 (42.4%) |
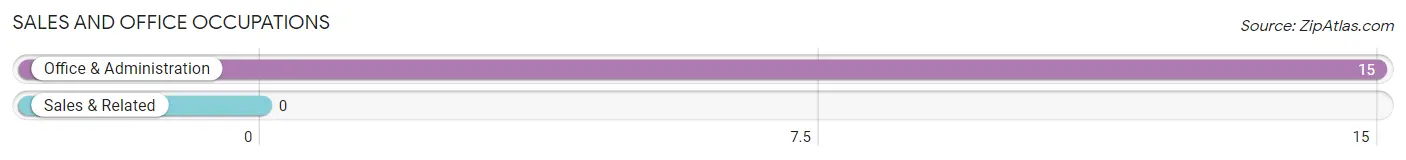
Sales and Office Occupations
The most common Sales and Office occupations in Lehigh are , and Office & Administration (15 | 7.3%).
Sales and Office Occupations by Sex
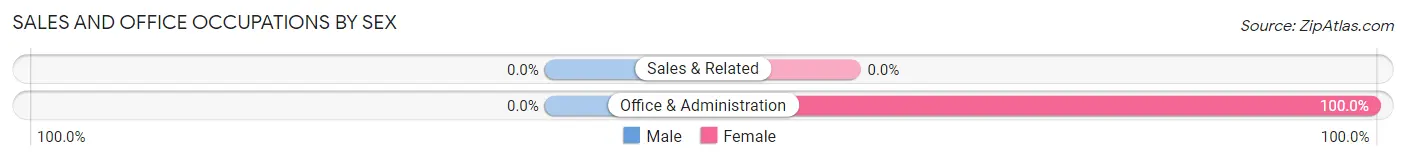
| Occupation | Male | Female |
| Sales & Related | 0 (0.0%) | 0 (0.0%) |
| Office & Administration | 0 (0.0%) | 15 (100.0%) |
| Total (Category) | 0 (0.0%) | 15 (100.0%) |
| Total (Overall) | 118 (57.6%) | 87 (42.4%) |
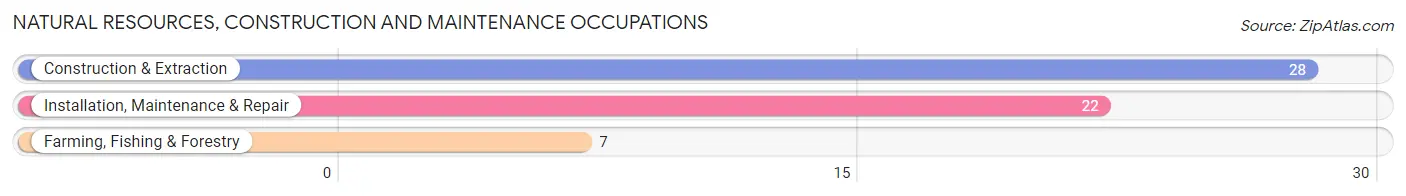
Natural Resources, Construction and Maintenance Occupations
The most common Natural Resources, Construction and Maintenance occupations in Lehigh are Construction & Extraction (28 | 13.7%), Installation, Maintenance & Repair (22 | 10.7%), and Farming, Fishing & Forestry (7 | 3.4%).
Natural Resources, Construction and Maintenance Occupations by Sex
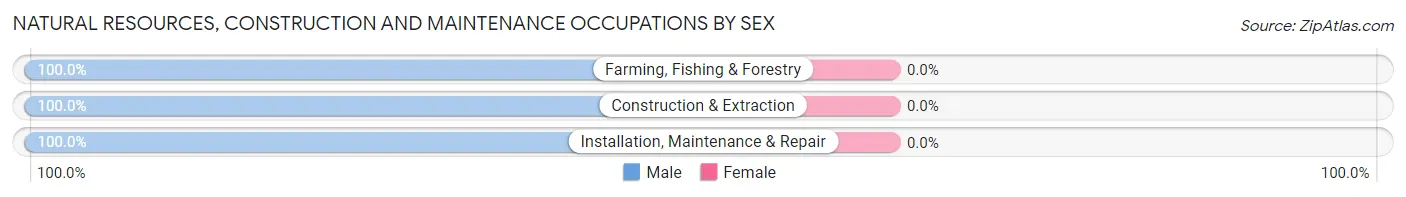
| Occupation | Male | Female |
| Farming, Fishing & Forestry | 7 (100.0%) | 0 (0.0%) |
| Construction & Extraction | 28 (100.0%) | 0 (0.0%) |
| Installation, Maintenance & Repair | 22 (100.0%) | 0 (0.0%) |
| Total (Category) | 57 (100.0%) | 0 (0.0%) |
| Total (Overall) | 118 (57.6%) | 87 (42.4%) |
Production, Transportation and Moving Occupations
The most common Production, Transportation and Moving occupations in Lehigh are Material Moving (24 | 11.7%), Production (9 | 4.4%), and Transportation (5 | 2.4%).
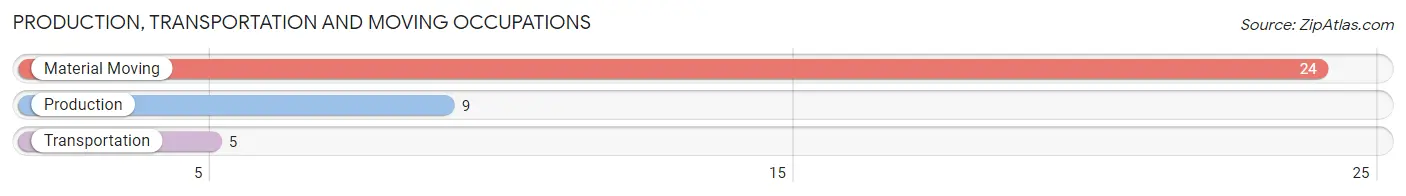
Production, Transportation and Moving Occupations by Sex
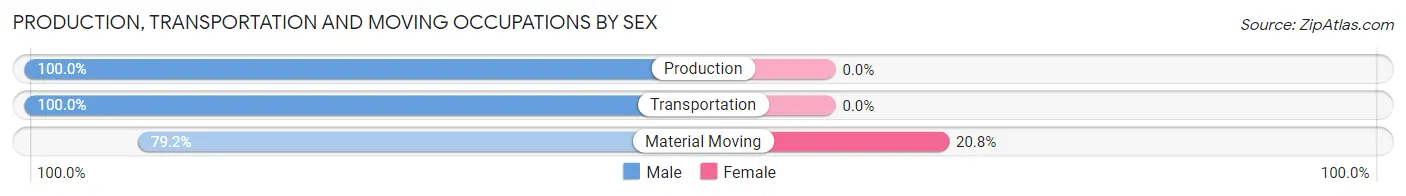
| Occupation | Male | Female |
| Production | 9 (100.0%) | 0 (0.0%) |
| Transportation | 5 (100.0%) | 0 (0.0%) |
| Material Moving | 19 (79.2%) | 5 (20.8%) |
| Total (Category) | 33 (86.8%) | 5 (13.2%) |
| Total (Overall) | 118 (57.6%) | 87 (42.4%) |
Employment Industries by Sex in Lehigh
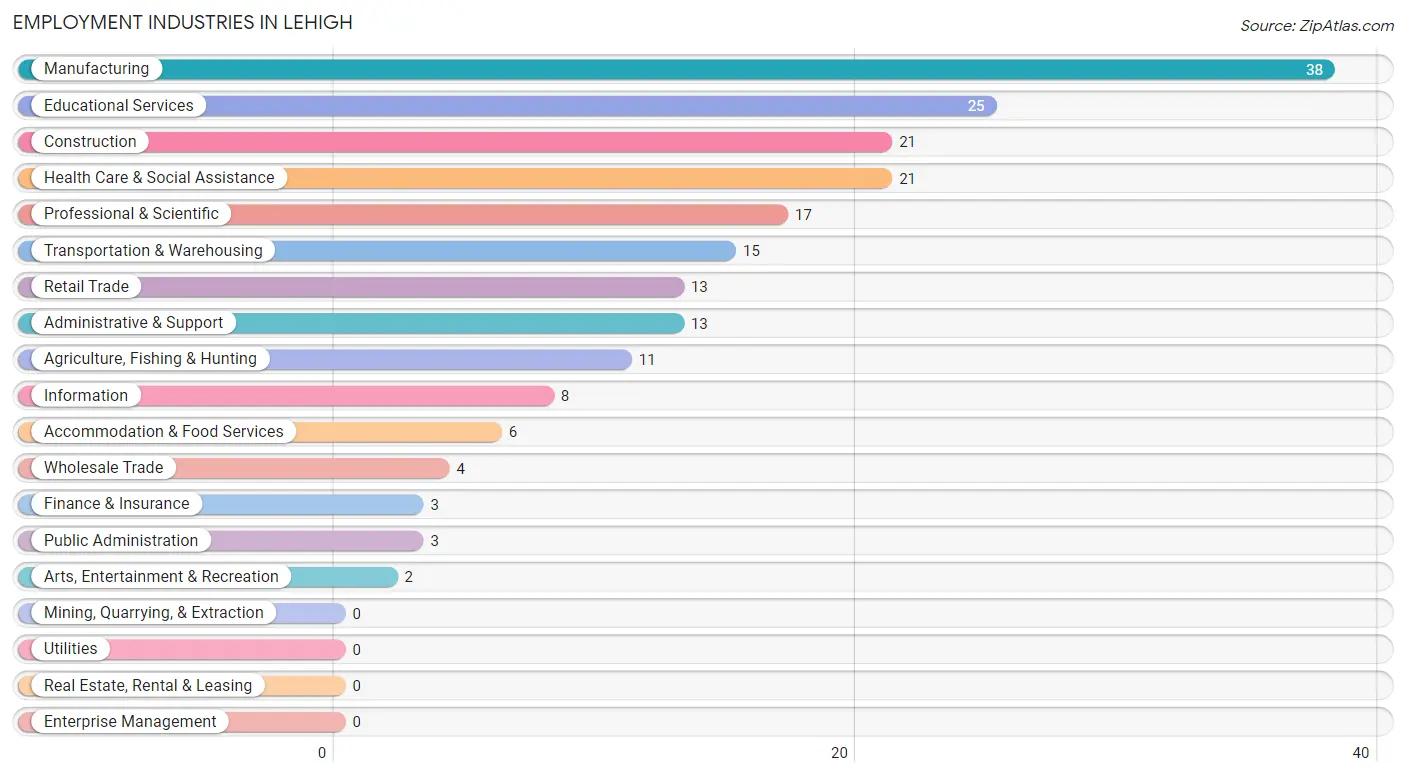
Employment Industries in Lehigh
The major employment industries in Lehigh include Manufacturing (38 | 18.5%), Educational Services (25 | 12.2%), Construction (21 | 10.2%), Health Care & Social Assistance (21 | 10.2%), and Professional & Scientific (17 | 8.3%).
Employment Industries by Sex in Lehigh
The Lehigh industries that see more men than women are Agriculture, Fishing & Hunting (100.0%), Construction (100.0%), and Wholesale Trade (100.0%), whereas the industries that tend to have a higher number of women are Information (100.0%), Finance & Insurance (100.0%), and Health Care & Social Assistance (100.0%).
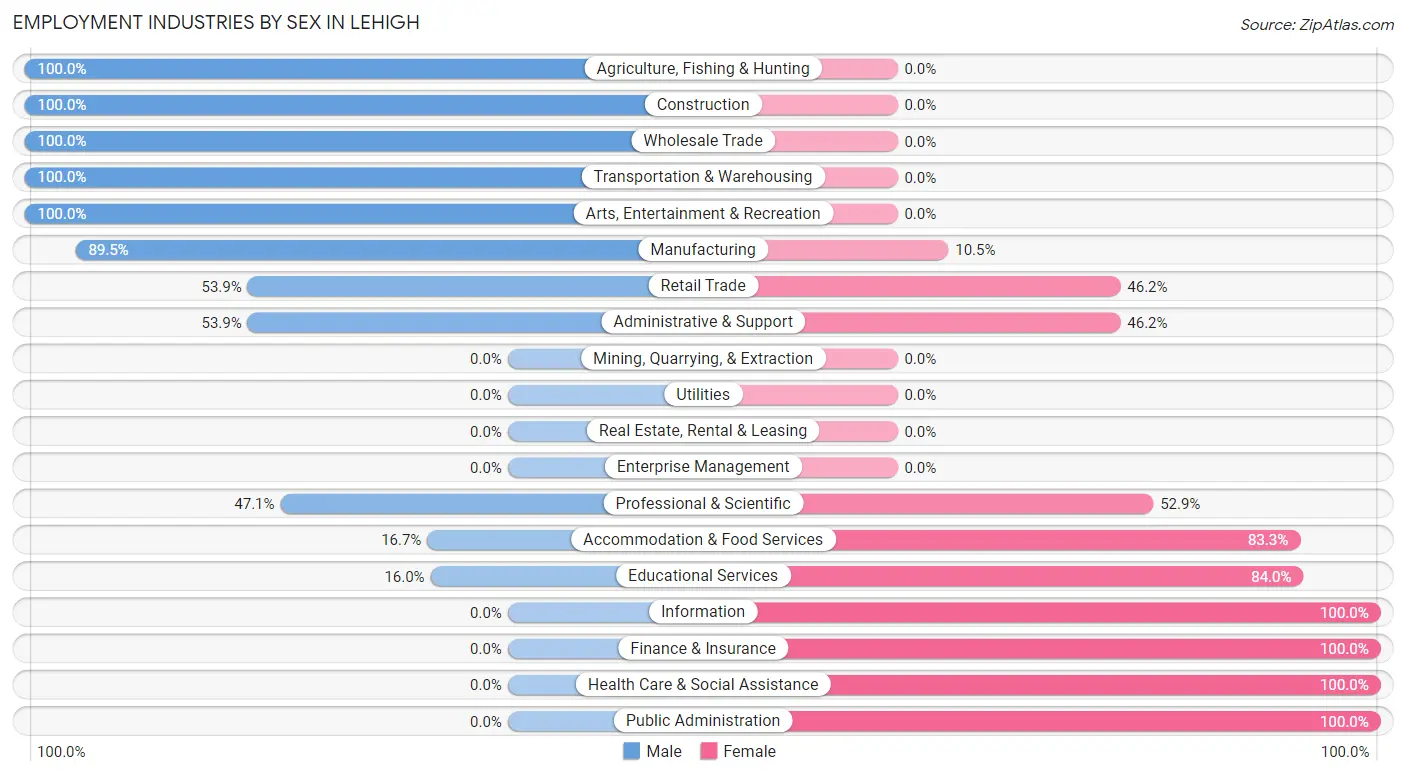
| Industry | Male | Female |
| Agriculture, Fishing & Hunting | 11 (100.0%) | 0 (0.0%) |
| Mining, Quarrying, & Extraction | 0 (0.0%) | 0 (0.0%) |
| Construction | 21 (100.0%) | 0 (0.0%) |
| Manufacturing | 34 (89.5%) | 4 (10.5%) |
| Wholesale Trade | 4 (100.0%) | 0 (0.0%) |
| Retail Trade | 7 (53.8%) | 6 (46.2%) |
| Transportation & Warehousing | 15 (100.0%) | 0 (0.0%) |
| Utilities | 0 (0.0%) | 0 (0.0%) |
| Information | 0 (0.0%) | 8 (100.0%) |
| Finance & Insurance | 0 (0.0%) | 3 (100.0%) |
| Real Estate, Rental & Leasing | 0 (0.0%) | 0 (0.0%) |
| Professional & Scientific | 8 (47.1%) | 9 (52.9%) |
| Enterprise Management | 0 (0.0%) | 0 (0.0%) |
| Administrative & Support | 7 (53.8%) | 6 (46.2%) |
| Educational Services | 4 (16.0%) | 21 (84.0%) |
| Health Care & Social Assistance | 0 (0.0%) | 21 (100.0%) |
| Arts, Entertainment & Recreation | 2 (100.0%) | 0 (0.0%) |
| Accommodation & Food Services | 1 (16.7%) | 5 (83.3%) |
| Public Administration | 0 (0.0%) | 3 (100.0%) |
| Total | 118 (57.6%) | 87 (42.4%) |
Education in Lehigh
School Enrollment in Lehigh
The most common levels of schooling among the 77 students in Lehigh are middle school (21 | 27.3%), elementary school (18 | 23.4%), and nursery / preschool (12 | 15.6%).
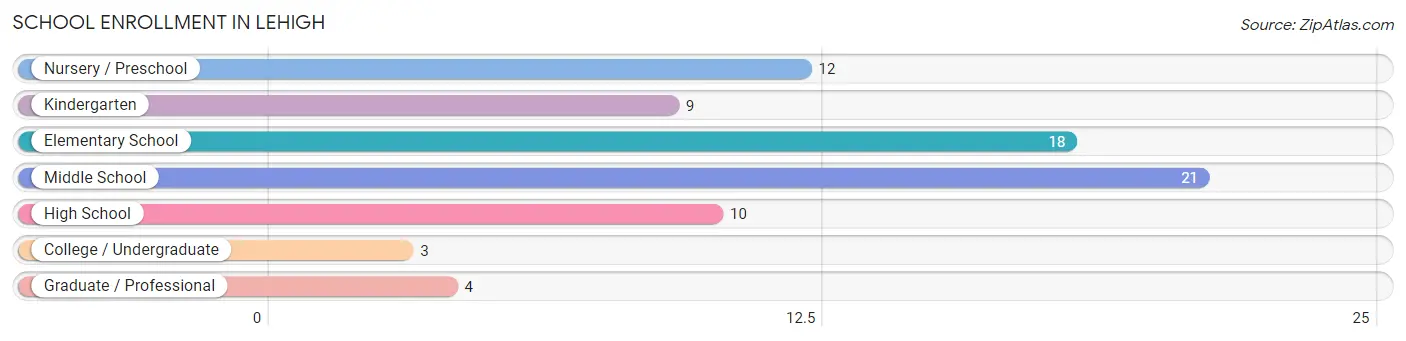
| School Level | # Students | % Students |
| Nursery / Preschool | 12 | 15.6% |
| Kindergarten | 9 | 11.7% |
| Elementary School | 18 | 23.4% |
| Middle School | 21 | 27.3% |
| High School | 10 | 13.0% |
| College / Undergraduate | 3 | 3.9% |
| Graduate / Professional | 4 | 5.2% |
| Total | 77 | 100.0% |
School Enrollment by Age by Funding Source in Lehigh
Out of a total of 77 students who are enrolled in schools in Lehigh, 3 (3.9%) attend a private institution, while the remaining 74 (96.1%) are enrolled in public schools. The age group of 5 to 9 year old has the highest likelihood of being enrolled in private schools, with 3 (8.6% in the age bracket) enrolled. Conversely, the age group of 3 to 4 year olds has the lowest likelihood of being enrolled in a private school, with 4 (100.0% in the age bracket) attending a public institution.
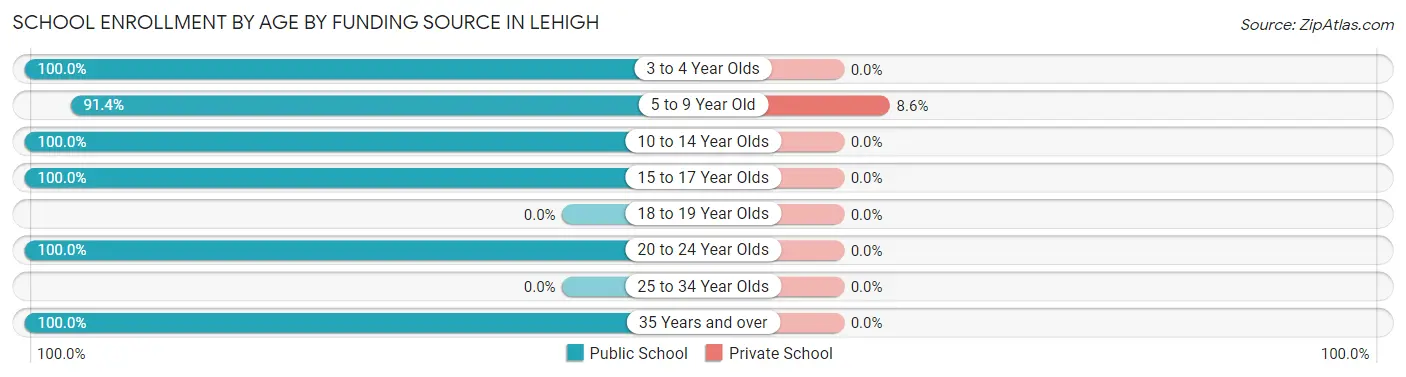
| Age Bracket | Public School | Private School |
| 3 to 4 Year Olds | 4 (100.0%) | 0 (0.0%) |
| 5 to 9 Year Old | 32 (91.4%) | 3 (8.6%) |
| 10 to 14 Year Olds | 21 (100.0%) | 0 (0.0%) |
| 15 to 17 Year Olds | 10 (100.0%) | 0 (0.0%) |
| 18 to 19 Year Olds | 0 (0.0%) | 0 (0.0%) |
| 20 to 24 Year Olds | 3 (100.0%) | 0 (0.0%) |
| 25 to 34 Year Olds | 0 (0.0%) | 0 (0.0%) |
| 35 Years and over | 4 (100.0%) | 0 (0.0%) |
| Total | 74 (96.1%) | 3 (3.9%) |
Educational Attainment by Field of Study in Lehigh
Bio, nature & agricultural (14 | 26.9%), arts & humanities (12 | 23.1%), science & technology (11 | 21.1%), education (5 | 9.6%), and computers & mathematics (4 | 7.7%) are the most common fields of study among 52 individuals in Lehigh who have obtained a bachelor's degree or higher.
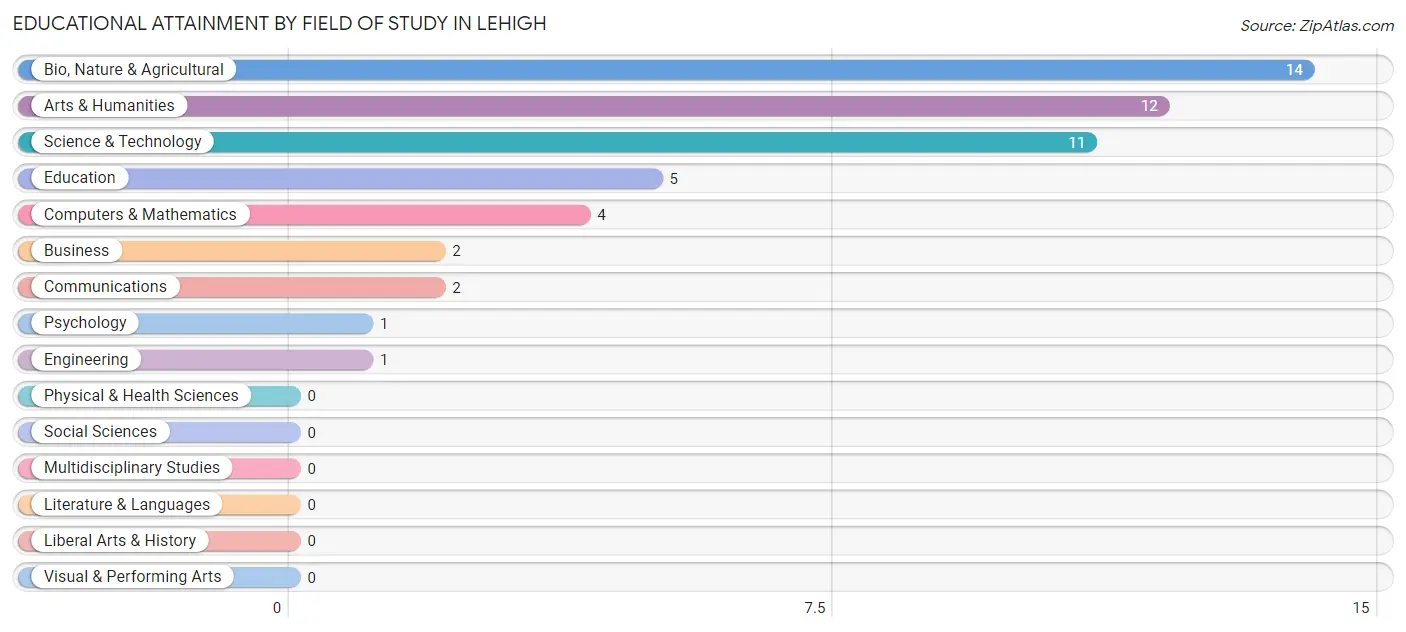
| Field of Study | # Graduates | % Graduates |
| Computers & Mathematics | 4 | 7.7% |
| Bio, Nature & Agricultural | 14 | 26.9% |
| Physical & Health Sciences | 0 | 0.0% |
| Psychology | 1 | 1.9% |
| Social Sciences | 0 | 0.0% |
| Engineering | 1 | 1.9% |
| Multidisciplinary Studies | 0 | 0.0% |
| Science & Technology | 11 | 21.1% |
| Business | 2 | 3.8% |
| Education | 5 | 9.6% |
| Literature & Languages | 0 | 0.0% |
| Liberal Arts & History | 0 | 0.0% |
| Visual & Performing Arts | 0 | 0.0% |
| Communications | 2 | 3.8% |
| Arts & Humanities | 12 | 23.1% |
| Total | 52 | 100.0% |
Transportation & Commute in Lehigh
Vehicle Availability by Sex in Lehigh
The most prevalent vehicle ownership categories in Lehigh are males with 4 vehicles (33, accounting for 28.0%) and females with 4 vehicles (36, making up 37.9%).
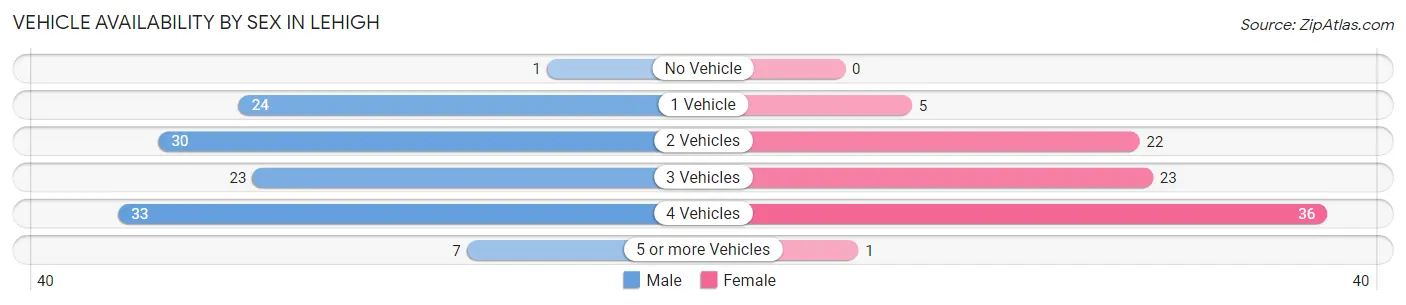
| Vehicles Available | Male | Female |
| No Vehicle | 1 (0.9%) | 0 (0.0%) |
| 1 Vehicle | 24 (20.3%) | 5 (5.8%) |
| 2 Vehicles | 30 (25.4%) | 22 (25.3%) |
| 3 Vehicles | 23 (19.5%) | 23 (26.4%) |
| 4 Vehicles | 33 (28.0%) | 36 (41.4%) |
| 5 or more Vehicles | 7 (5.9%) | 1 (1.1%) |
| Total | 118 (100.0%) | 87 (100.0%) |
Commute Time in Lehigh
The most frequently occuring commute durations in Lehigh are 20 to 24 minutes (52 commuters, 26.3%), 30 to 34 minutes (51 commuters, 25.8%), and 45 to 59 minutes (26 commuters, 13.1%).
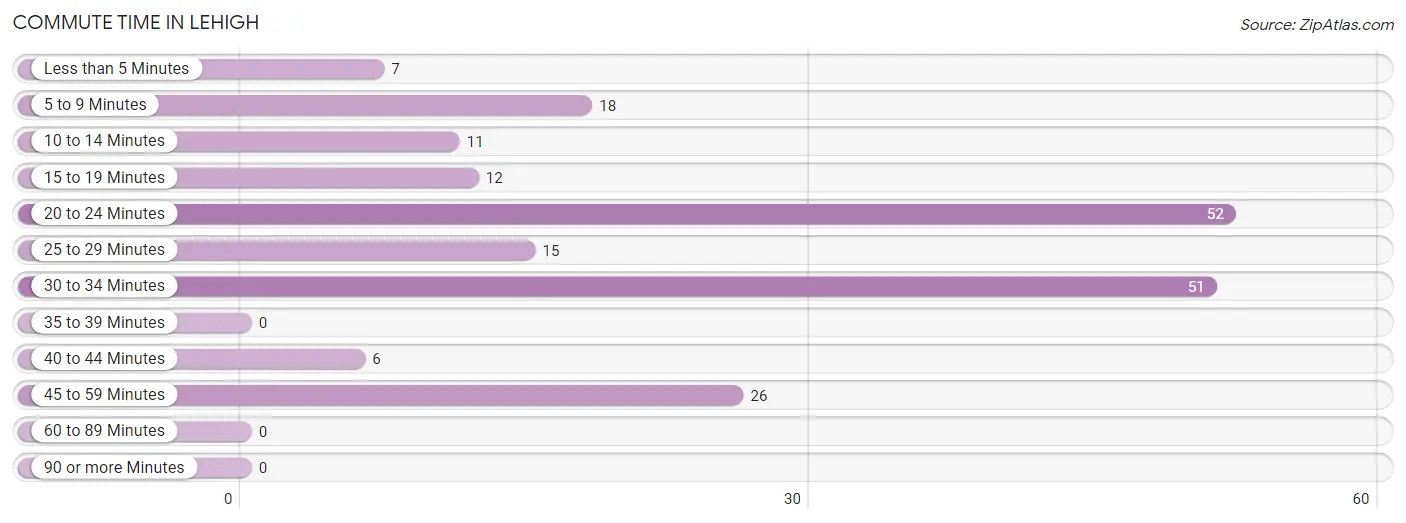
| Commute Time | # Commuters | % Commuters |
| Less than 5 Minutes | 7 | 3.5% |
| 5 to 9 Minutes | 18 | 9.1% |
| 10 to 14 Minutes | 11 | 5.6% |
| 15 to 19 Minutes | 12 | 6.1% |
| 20 to 24 Minutes | 52 | 26.3% |
| 25 to 29 Minutes | 15 | 7.6% |
| 30 to 34 Minutes | 51 | 25.8% |
| 35 to 39 Minutes | 0 | 0.0% |
| 40 to 44 Minutes | 6 | 3.0% |
| 45 to 59 Minutes | 26 | 13.1% |
| 60 to 89 Minutes | 0 | 0.0% |
| 90 or more Minutes | 0 | 0.0% |
Commute Time by Sex in Lehigh
The most common commute times in Lehigh are 20 to 24 minutes (35 commuters, 29.9%) for males and 30 to 34 minutes (22 commuters, 27.2%) for females.
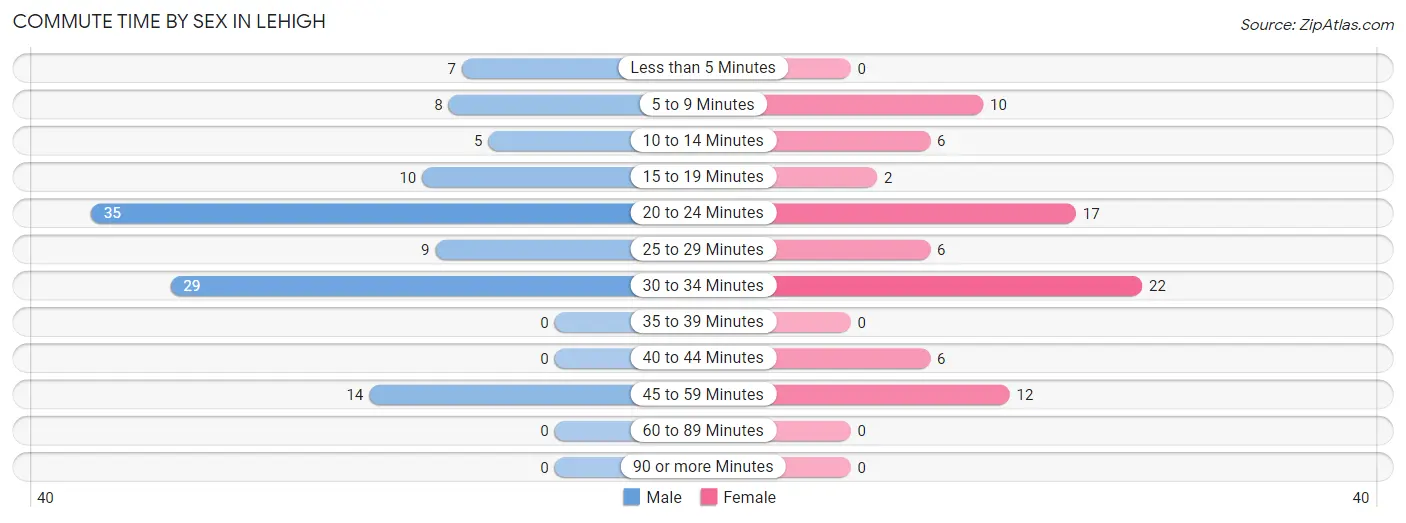
| Commute Time | Male | Female |
| Less than 5 Minutes | 7 (6.0%) | 0 (0.0%) |
| 5 to 9 Minutes | 8 (6.8%) | 10 (12.3%) |
| 10 to 14 Minutes | 5 (4.3%) | 6 (7.4%) |
| 15 to 19 Minutes | 10 (8.6%) | 2 (2.5%) |
| 20 to 24 Minutes | 35 (29.9%) | 17 (21.0%) |
| 25 to 29 Minutes | 9 (7.7%) | 6 (7.4%) |
| 30 to 34 Minutes | 29 (24.8%) | 22 (27.2%) |
| 35 to 39 Minutes | 0 (0.0%) | 0 (0.0%) |
| 40 to 44 Minutes | 0 (0.0%) | 6 (7.4%) |
| 45 to 59 Minutes | 14 (12.0%) | 12 (14.8%) |
| 60 to 89 Minutes | 0 (0.0%) | 0 (0.0%) |
| 90 or more Minutes | 0 (0.0%) | 0 (0.0%) |
Time of Departure to Work by Sex in Lehigh
The most frequent times of departure to work in Lehigh are 6:30 AM to 6:59 AM (21, 17.9%) for males and 7:00 AM to 7:29 AM (25, 30.9%) for females.
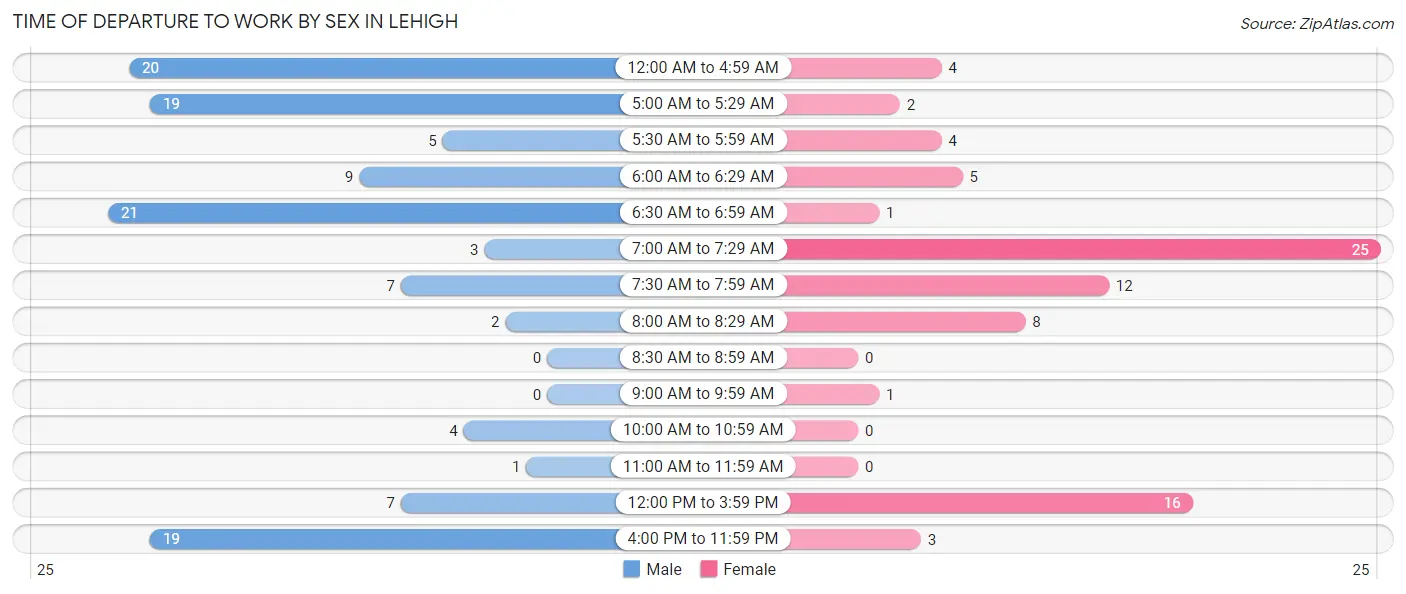
| Time of Departure | Male | Female |
| 12:00 AM to 4:59 AM | 20 (17.1%) | 4 (4.9%) |
| 5:00 AM to 5:29 AM | 19 (16.2%) | 2 (2.5%) |
| 5:30 AM to 5:59 AM | 5 (4.3%) | 4 (4.9%) |
| 6:00 AM to 6:29 AM | 9 (7.7%) | 5 (6.2%) |
| 6:30 AM to 6:59 AM | 21 (17.9%) | 1 (1.2%) |
| 7:00 AM to 7:29 AM | 3 (2.6%) | 25 (30.9%) |
| 7:30 AM to 7:59 AM | 7 (6.0%) | 12 (14.8%) |
| 8:00 AM to 8:29 AM | 2 (1.7%) | 8 (9.9%) |
| 8:30 AM to 8:59 AM | 0 (0.0%) | 0 (0.0%) |
| 9:00 AM to 9:59 AM | 0 (0.0%) | 1 (1.2%) |
| 10:00 AM to 10:59 AM | 4 (3.4%) | 0 (0.0%) |
| 11:00 AM to 11:59 AM | 1 (0.9%) | 0 (0.0%) |
| 12:00 PM to 3:59 PM | 7 (6.0%) | 16 (19.8%) |
| 4:00 PM to 11:59 PM | 19 (16.2%) | 3 (3.7%) |
| Total | 117 (100.0%) | 81 (100.0%) |
Housing Occupancy in Lehigh
Occupancy by Ownership in Lehigh
Of the total 188 dwellings in Lehigh, owner-occupied units account for 146 (77.7%), while renter-occupied units make up 42 (22.3%).
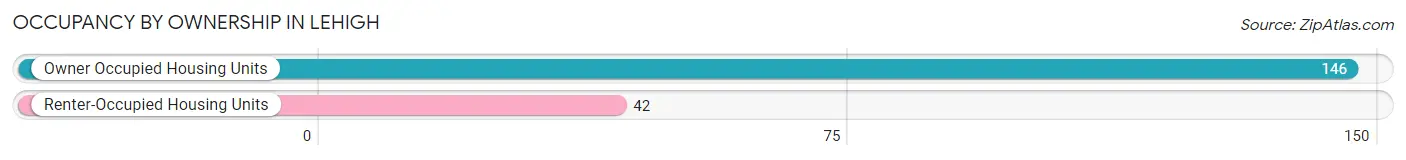
| Occupancy | # Housing Units | % Housing Units |
| Owner Occupied Housing Units | 146 | 77.7% |
| Renter-Occupied Housing Units | 42 | 22.3% |
| Total Occupied Housing Units | 188 | 100.0% |
Occupancy by Household Size in Lehigh
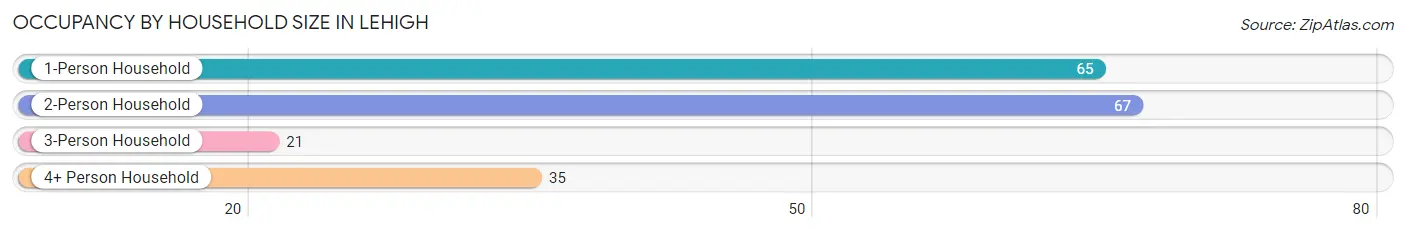
| Household Size | # Housing Units | % Housing Units |
| 1-Person Household | 65 | 34.6% |
| 2-Person Household | 67 | 35.6% |
| 3-Person Household | 21 | 11.2% |
| 4+ Person Household | 35 | 18.6% |
| Total Housing Units | 188 | 100.0% |
Occupancy by Ownership by Household Size in Lehigh
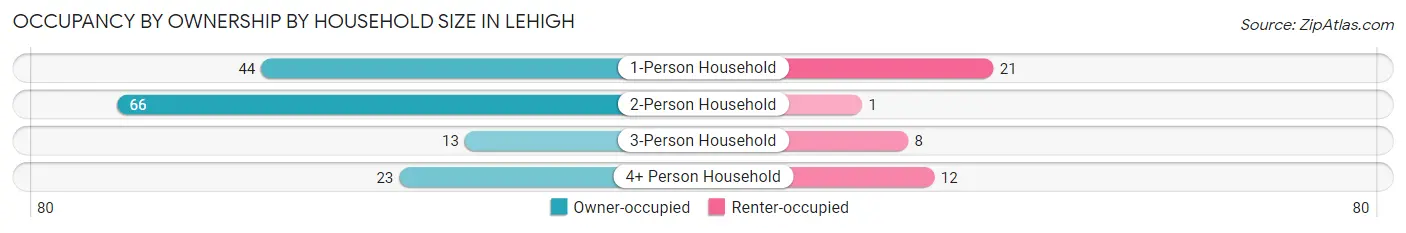
| Household Size | Owner-occupied | Renter-occupied |
| 1-Person Household | 44 (67.7%) | 21 (32.3%) |
| 2-Person Household | 66 (98.5%) | 1 (1.5%) |
| 3-Person Household | 13 (61.9%) | 8 (38.1%) |
| 4+ Person Household | 23 (65.7%) | 12 (34.3%) |
| Total Housing Units | 146 (77.7%) | 42 (22.3%) |
Occupancy by Educational Attainment in Lehigh
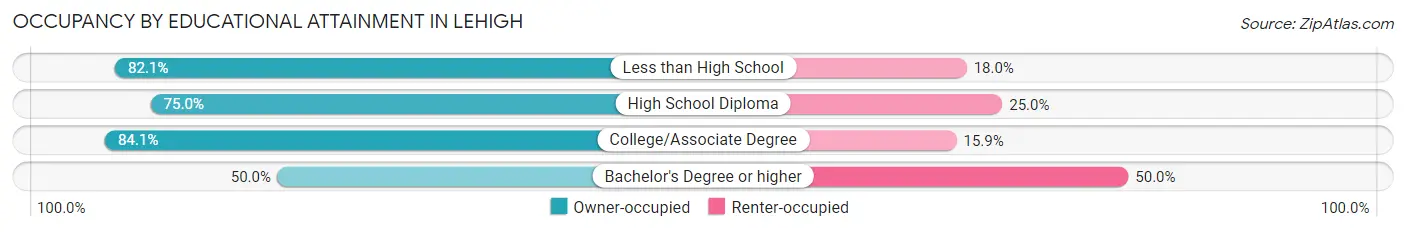
| Household Size | Owner-occupied | Renter-occupied |
| Less than High School | 32 (82.1%) | 7 (17.9%) |
| High School Diploma | 48 (75.0%) | 16 (25.0%) |
| College/Associate Degree | 58 (84.1%) | 11 (15.9%) |
| Bachelor's Degree or higher | 8 (50.0%) | 8 (50.0%) |
Occupancy by Age of Householder in Lehigh
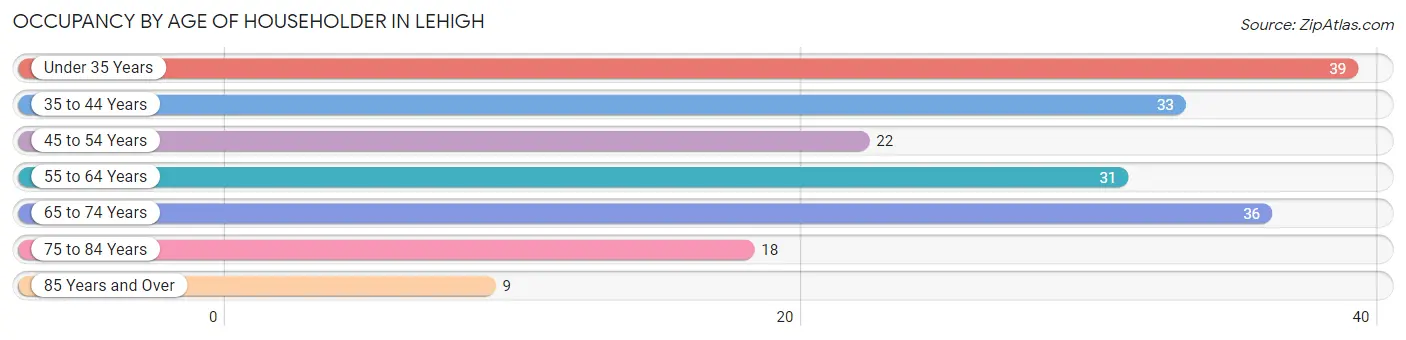
| Age Bracket | # Households | % Households |
| Under 35 Years | 39 | 20.7% |
| 35 to 44 Years | 33 | 17.5% |
| 45 to 54 Years | 22 | 11.7% |
| 55 to 64 Years | 31 | 16.5% |
| 65 to 74 Years | 36 | 19.2% |
| 75 to 84 Years | 18 | 9.6% |
| 85 Years and Over | 9 | 4.8% |
| Total | 188 | 100.0% |
Housing Finances in Lehigh
Median Income by Occupancy in Lehigh
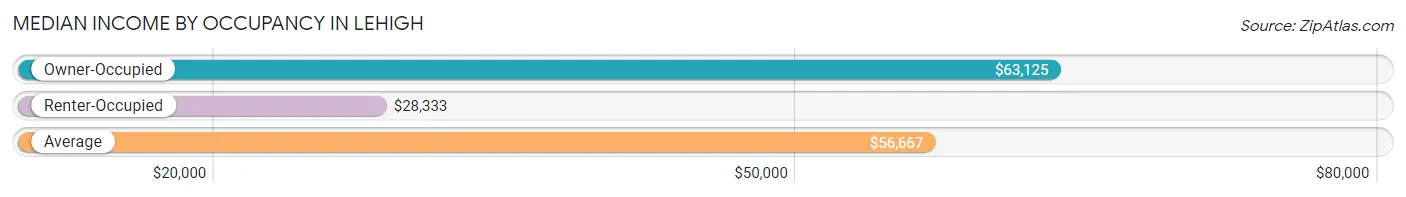
| Occupancy Type | # Households | Median Income |
| Owner-Occupied | 146 (77.7%) | $63,125 |
| Renter-Occupied | 42 (22.3%) | $28,333 |
| Average | 188 (100.0%) | $56,667 |
Occupancy by Householder Income Bracket in Lehigh
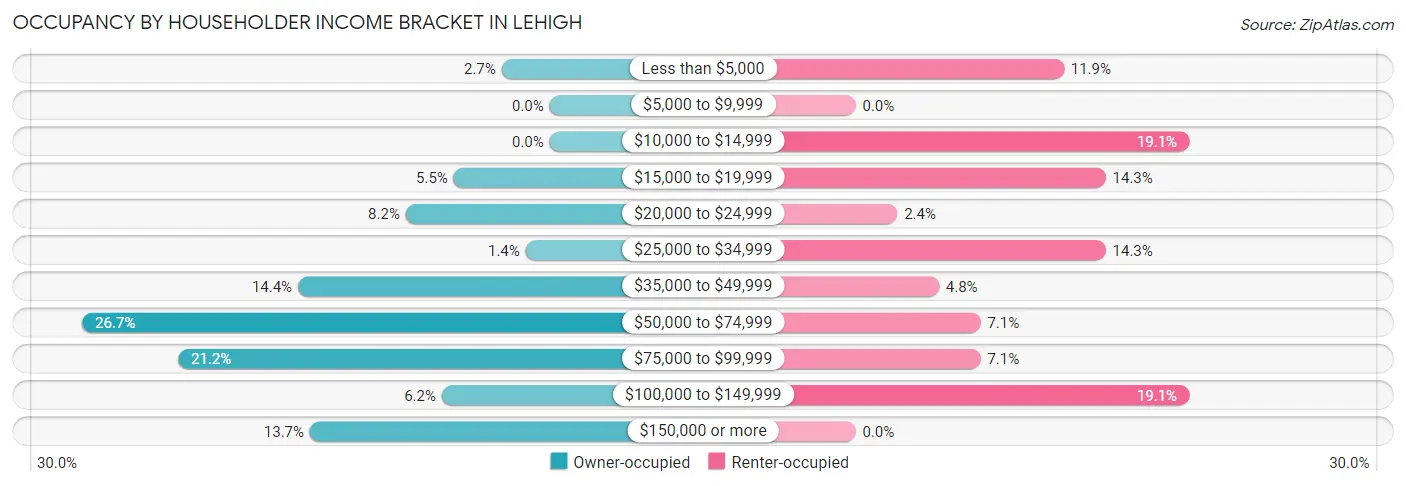
| Income Bracket | Owner-occupied | Renter-occupied |
| Less than $5,000 | 4 (2.7%) | 5 (11.9%) |
| $5,000 to $9,999 | 0 (0.0%) | 0 (0.0%) |
| $10,000 to $14,999 | 0 (0.0%) | 8 (19.1%) |
| $15,000 to $19,999 | 8 (5.5%) | 6 (14.3%) |
| $20,000 to $24,999 | 12 (8.2%) | 1 (2.4%) |
| $25,000 to $34,999 | 2 (1.4%) | 6 (14.3%) |
| $35,000 to $49,999 | 21 (14.4%) | 2 (4.8%) |
| $50,000 to $74,999 | 39 (26.7%) | 3 (7.1%) |
| $75,000 to $99,999 | 31 (21.2%) | 3 (7.1%) |
| $100,000 to $149,999 | 9 (6.2%) | 8 (19.1%) |
| $150,000 or more | 20 (13.7%) | 0 (0.0%) |
| Total | 146 (100.0%) | 42 (100.0%) |
Monthly Housing Cost Tiers in Lehigh
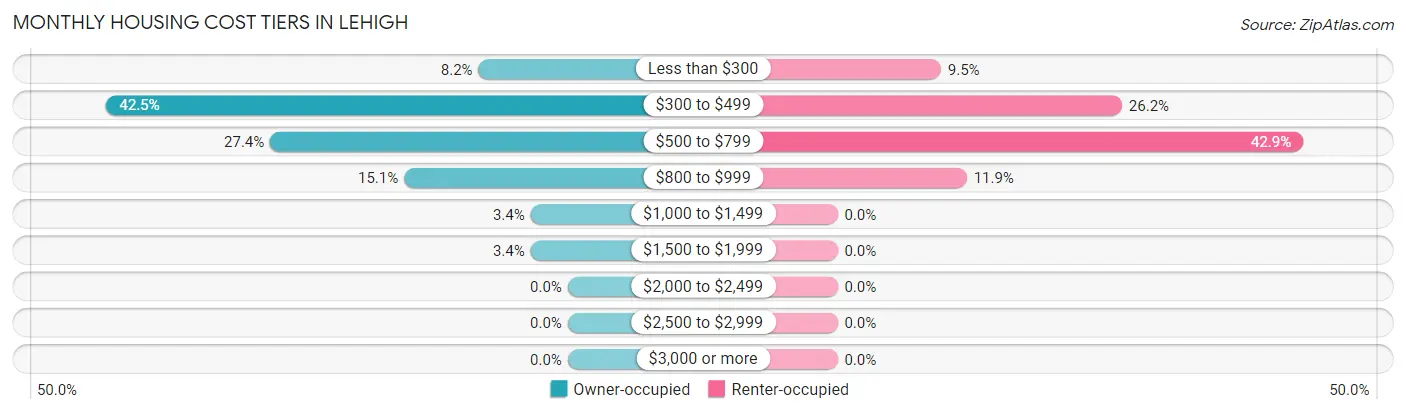
| Monthly Cost | Owner-occupied | Renter-occupied |
| Less than $300 | 12 (8.2%) | 4 (9.5%) |
| $300 to $499 | 62 (42.5%) | 11 (26.2%) |
| $500 to $799 | 40 (27.4%) | 18 (42.9%) |
| $800 to $999 | 22 (15.1%) | 5 (11.9%) |
| $1,000 to $1,499 | 5 (3.4%) | 0 (0.0%) |
| $1,500 to $1,999 | 5 (3.4%) | 0 (0.0%) |
| $2,000 to $2,499 | 0 (0.0%) | 0 (0.0%) |
| $2,500 to $2,999 | 0 (0.0%) | 0 (0.0%) |
| $3,000 or more | 0 (0.0%) | 0 (0.0%) |
| Total | 146 (100.0%) | 42 (100.0%) |
Physical Housing Characteristics in Lehigh
Housing Structures in Lehigh
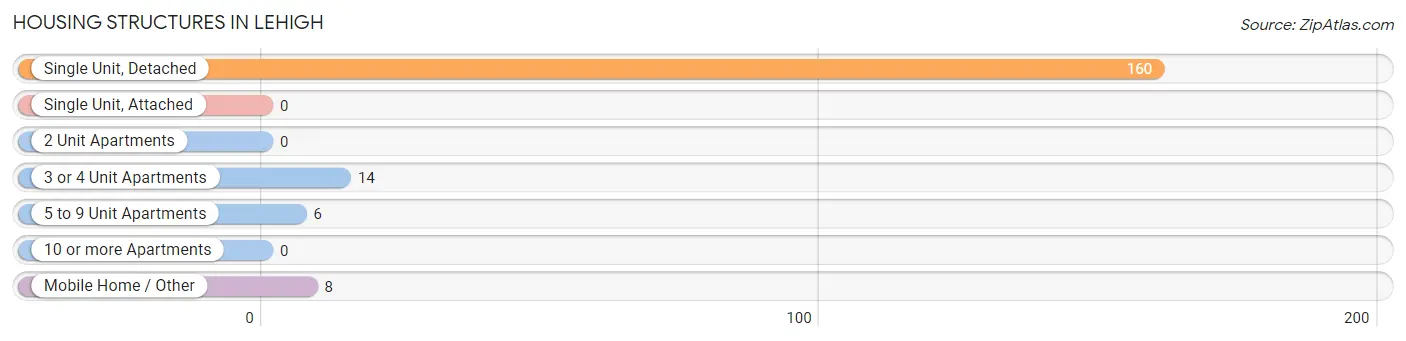
| Structure Type | # Housing Units | % Housing Units |
| Single Unit, Detached | 160 | 85.1% |
| Single Unit, Attached | 0 | 0.0% |
| 2 Unit Apartments | 0 | 0.0% |
| 3 or 4 Unit Apartments | 14 | 7.4% |
| 5 to 9 Unit Apartments | 6 | 3.2% |
| 10 or more Apartments | 0 | 0.0% |
| Mobile Home / Other | 8 | 4.3% |
| Total | 188 | 100.0% |
Housing Structures by Occupancy in Lehigh
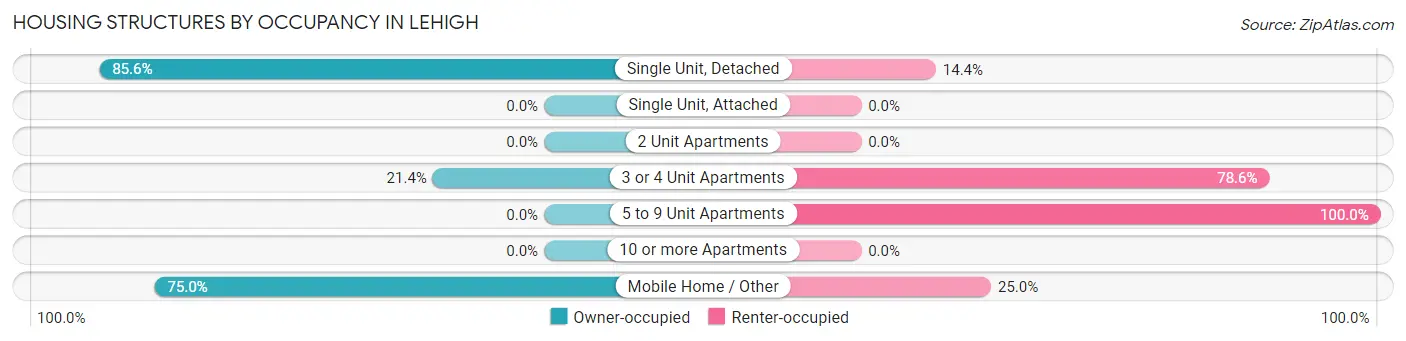
| Structure Type | Owner-occupied | Renter-occupied |
| Single Unit, Detached | 137 (85.6%) | 23 (14.4%) |
| Single Unit, Attached | 0 (0.0%) | 0 (0.0%) |
| 2 Unit Apartments | 0 (0.0%) | 0 (0.0%) |
| 3 or 4 Unit Apartments | 3 (21.4%) | 11 (78.6%) |
| 5 to 9 Unit Apartments | 0 (0.0%) | 6 (100.0%) |
| 10 or more Apartments | 0 (0.0%) | 0 (0.0%) |
| Mobile Home / Other | 6 (75.0%) | 2 (25.0%) |
| Total | 146 (77.7%) | 42 (22.3%) |
Housing Structures by Number of Rooms in Lehigh
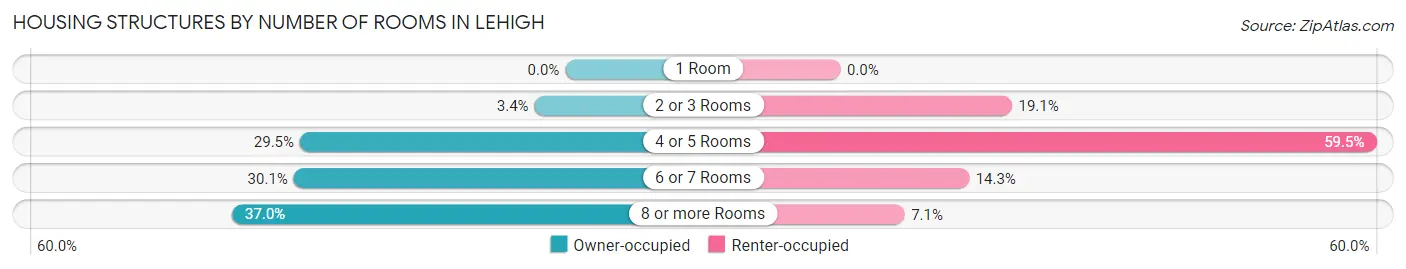
| Number of Rooms | Owner-occupied | Renter-occupied |
| 1 Room | 0 (0.0%) | 0 (0.0%) |
| 2 or 3 Rooms | 5 (3.4%) | 8 (19.1%) |
| 4 or 5 Rooms | 43 (29.4%) | 25 (59.5%) |
| 6 or 7 Rooms | 44 (30.1%) | 6 (14.3%) |
| 8 or more Rooms | 54 (37.0%) | 3 (7.1%) |
| Total | 146 (100.0%) | 42 (100.0%) |
Housing Structure by Heating Type in Lehigh
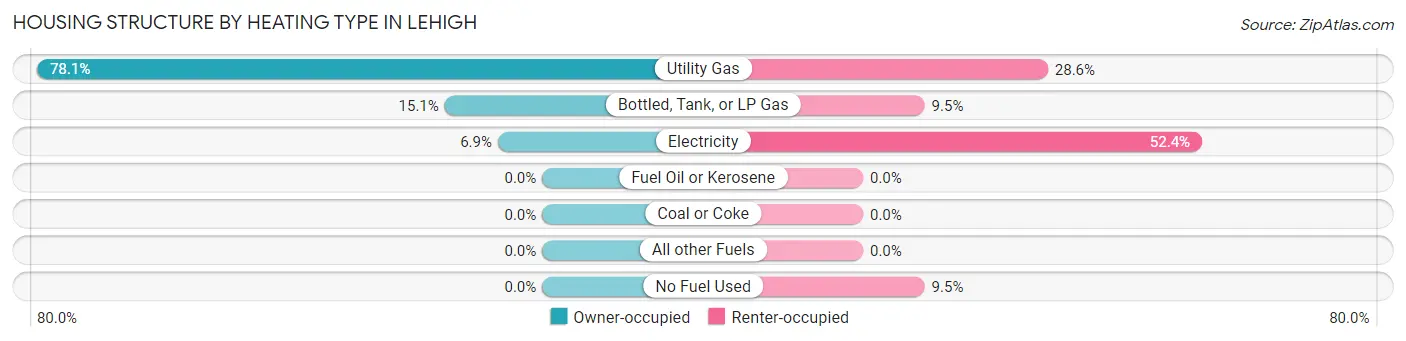
| Heating Type | Owner-occupied | Renter-occupied |
| Utility Gas | 114 (78.1%) | 12 (28.6%) |
| Bottled, Tank, or LP Gas | 22 (15.1%) | 4 (9.5%) |
| Electricity | 10 (6.9%) | 22 (52.4%) |
| Fuel Oil or Kerosene | 0 (0.0%) | 0 (0.0%) |
| Coal or Coke | 0 (0.0%) | 0 (0.0%) |
| All other Fuels | 0 (0.0%) | 0 (0.0%) |
| No Fuel Used | 0 (0.0%) | 4 (9.5%) |
| Total | 146 (100.0%) | 42 (100.0%) |
Household Vehicle Usage in Lehigh
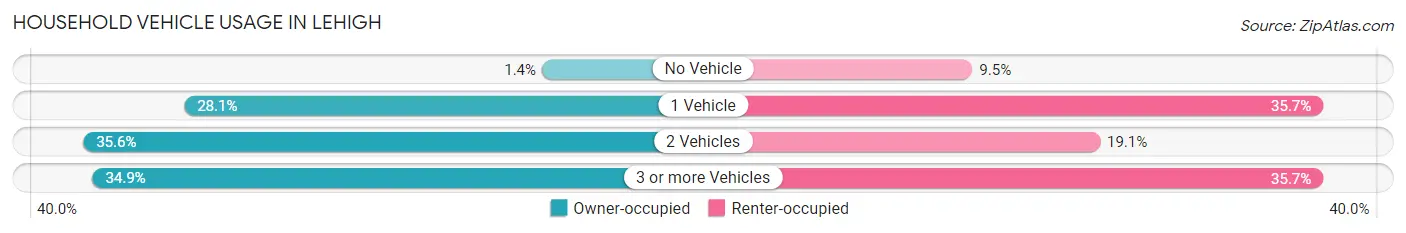
| Vehicles per Household | Owner-occupied | Renter-occupied |
| No Vehicle | 2 (1.4%) | 4 (9.5%) |
| 1 Vehicle | 41 (28.1%) | 15 (35.7%) |
| 2 Vehicles | 52 (35.6%) | 8 (19.1%) |
| 3 or more Vehicles | 51 (34.9%) | 15 (35.7%) |
| Total | 146 (100.0%) | 42 (100.0%) |
Real Estate & Mortgages in Lehigh
Real Estate and Mortgage Overview in Lehigh
| Characteristic | Without Mortgage | With Mortgage |
| Housing Units | 108 | 38 |
| Median Property Value | $62,900 | $113,500 |
| Median Household Income | $55,556 | $9 |
| Monthly Housing Costs | $429 | $0 |
| Real Estate Taxes | $980 | $4 |
Property Value by Mortgage Status in Lehigh
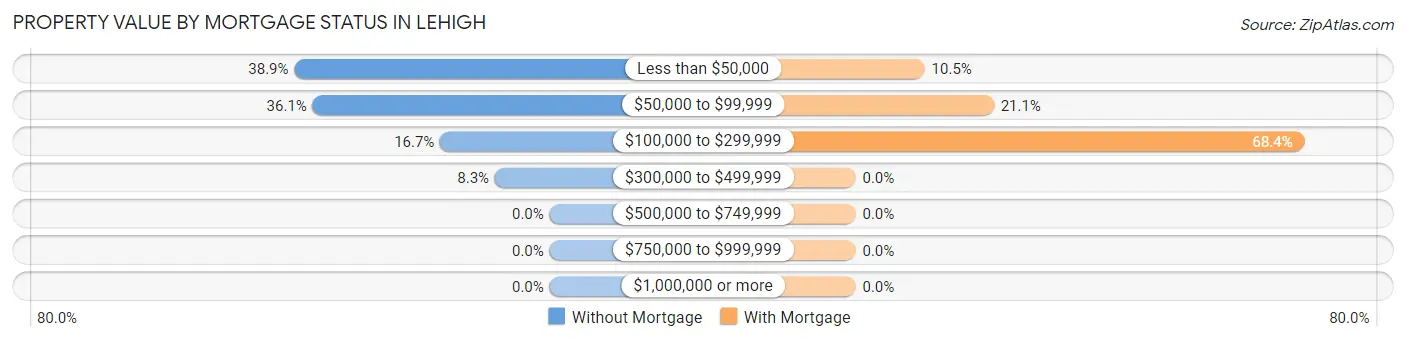
| Property Value | Without Mortgage | With Mortgage |
| Less than $50,000 | 42 (38.9%) | 4 (10.5%) |
| $50,000 to $99,999 | 39 (36.1%) | 8 (21.0%) |
| $100,000 to $299,999 | 18 (16.7%) | 26 (68.4%) |
| $300,000 to $499,999 | 9 (8.3%) | 0 (0.0%) |
| $500,000 to $749,999 | 0 (0.0%) | 0 (0.0%) |
| $750,000 to $999,999 | 0 (0.0%) | 0 (0.0%) |
| $1,000,000 or more | 0 (0.0%) | 0 (0.0%) |
| Total | 108 (100.0%) | 38 (100.0%) |
Household Income by Mortgage Status in Lehigh
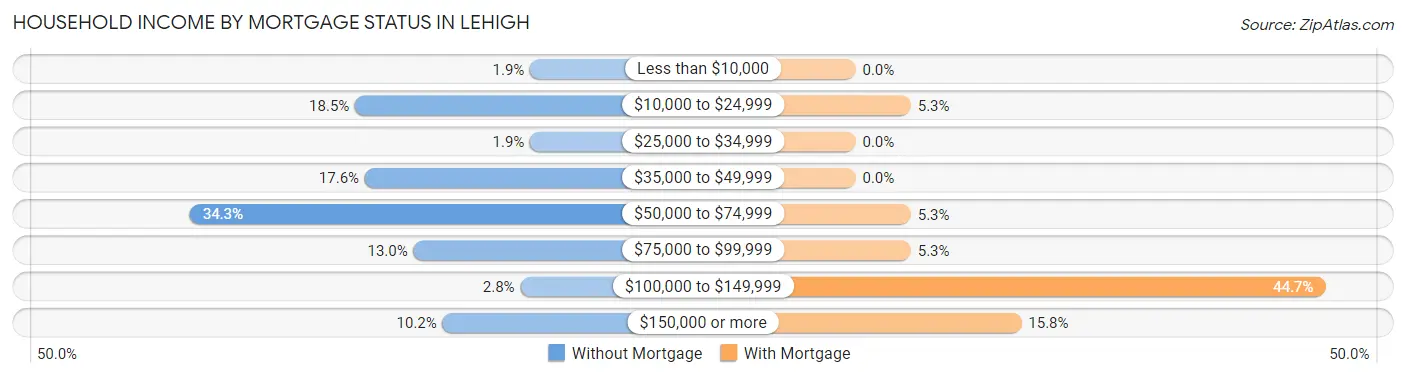
| Household Income | Without Mortgage | With Mortgage |
| Less than $10,000 | 2 (1.8%) | 0 (0.0%) |
| $10,000 to $24,999 | 20 (18.5%) | 2 (5.3%) |
| $25,000 to $34,999 | 2 (1.8%) | 0 (0.0%) |
| $35,000 to $49,999 | 19 (17.6%) | 0 (0.0%) |
| $50,000 to $74,999 | 37 (34.3%) | 2 (5.3%) |
| $75,000 to $99,999 | 14 (13.0%) | 2 (5.3%) |
| $100,000 to $149,999 | 3 (2.8%) | 17 (44.7%) |
| $150,000 or more | 11 (10.2%) | 6 (15.8%) |
| Total | 108 (100.0%) | 38 (100.0%) |
Property Value to Household Income Ratio in Lehigh
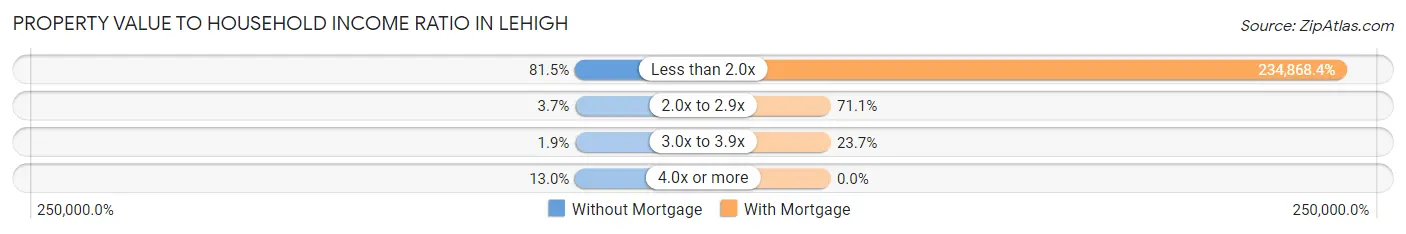
| Value-to-Income Ratio | Without Mortgage | With Mortgage |
| Less than 2.0x | 88 (81.5%) | 89,250 (234,868.4%) |
| 2.0x to 2.9x | 4 (3.7%) | 27 (71.1%) |
| 3.0x to 3.9x | 2 (1.8%) | 9 (23.7%) |
| 4.0x or more | 14 (13.0%) | 0 (0.0%) |
| Total | 108 (100.0%) | 38 (100.0%) |
Real Estate Taxes by Mortgage Status in Lehigh
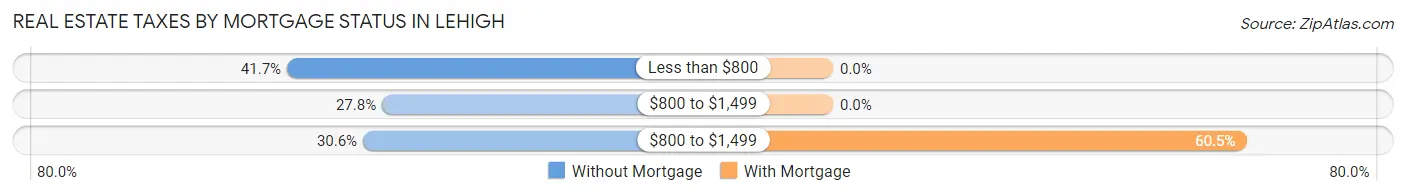
| Property Taxes | Without Mortgage | With Mortgage |
| Less than $800 | 45 (41.7%) | 0 (0.0%) |
| $800 to $1,499 | 30 (27.8%) | 0 (0.0%) |
| $800 to $1,499 | 33 (30.6%) | 23 (60.5%) |
| Total | 108 (100.0%) | 38 (100.0%) |
Health & Disability in Lehigh
Health Insurance Coverage by Age in Lehigh
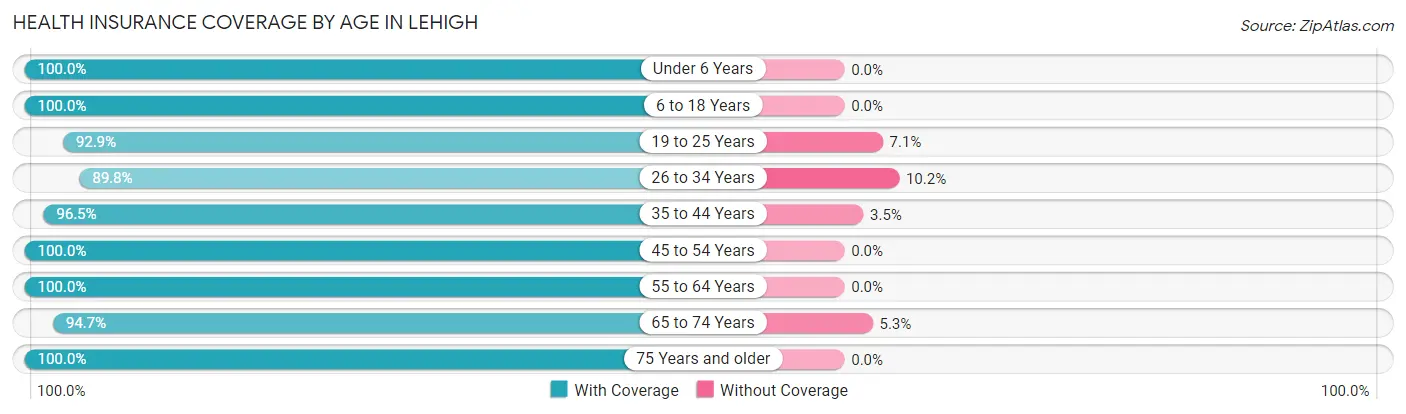
| Age Bracket | With Coverage | Without Coverage |
| Under 6 Years | 42 (100.0%) | 0 (0.0%) |
| 6 to 18 Years | 58 (100.0%) | 0 (0.0%) |
| 19 to 25 Years | 26 (92.9%) | 2 (7.1%) |
| 26 to 34 Years | 44 (89.8%) | 5 (10.2%) |
| 35 to 44 Years | 55 (96.5%) | 2 (3.5%) |
| 45 to 54 Years | 40 (100.0%) | 0 (0.0%) |
| 55 to 64 Years | 54 (100.0%) | 0 (0.0%) |
| 65 to 74 Years | 54 (94.7%) | 3 (5.3%) |
| 75 Years and older | 38 (100.0%) | 0 (0.0%) |
| Total | 411 (97.2%) | 12 (2.8%) |
Health Insurance Coverage by Citizenship Status in Lehigh
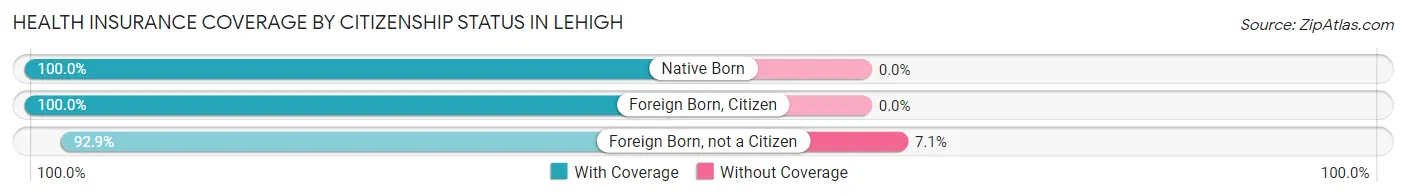
| Citizenship Status | With Coverage | Without Coverage |
| Native Born | 42 (100.0%) | 0 (0.0%) |
| Foreign Born, Citizen | 58 (100.0%) | 0 (0.0%) |
| Foreign Born, not a Citizen | 26 (92.9%) | 2 (7.1%) |
Health Insurance Coverage by Household Income in Lehigh
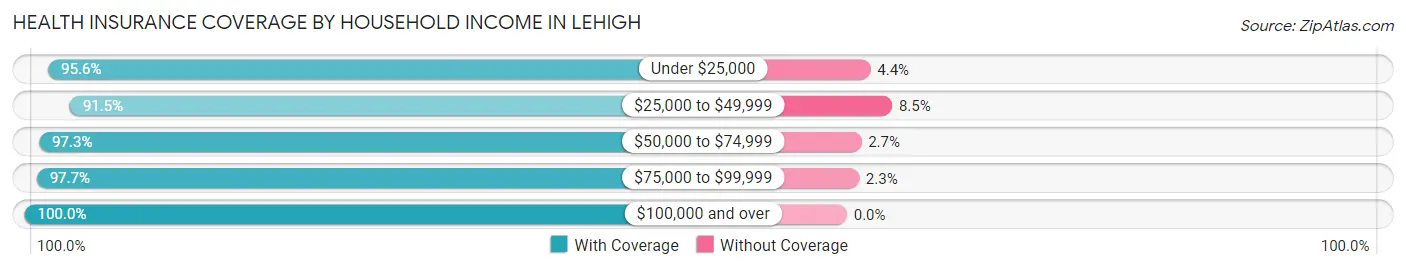
| Household Income | With Coverage | Without Coverage |
| Under $25,000 | 65 (95.6%) | 3 (4.4%) |
| $25,000 to $49,999 | 54 (91.5%) | 5 (8.5%) |
| $50,000 to $74,999 | 72 (97.3%) | 2 (2.7%) |
| $75,000 to $99,999 | 86 (97.7%) | 2 (2.3%) |
| $100,000 and over | 134 (100.0%) | 0 (0.0%) |
Public vs Private Health Insurance Coverage by Age in Lehigh
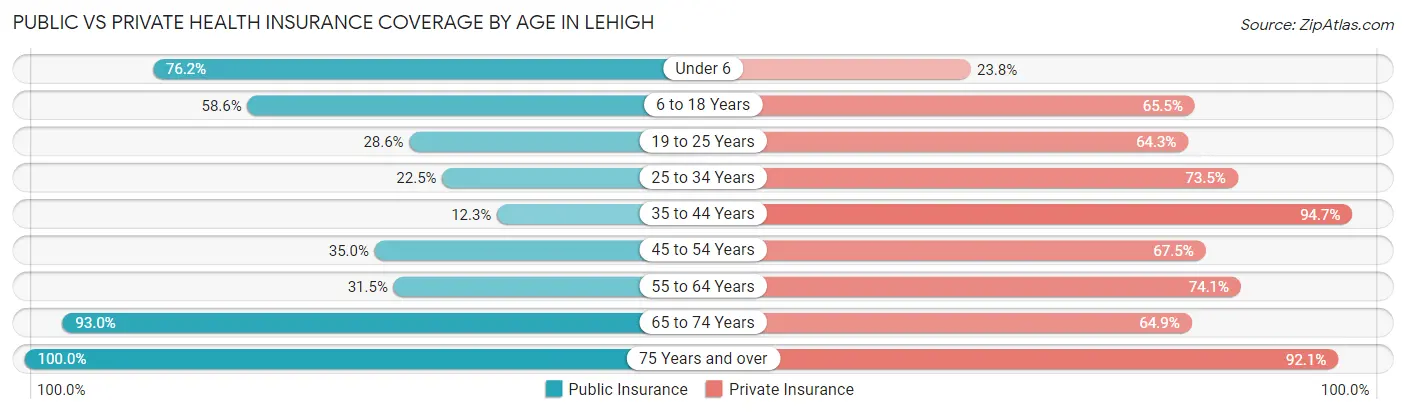
| Age Bracket | Public Insurance | Private Insurance |
| Under 6 | 32 (76.2%) | 10 (23.8%) |
| 6 to 18 Years | 34 (58.6%) | 38 (65.5%) |
| 19 to 25 Years | 8 (28.6%) | 18 (64.3%) |
| 25 to 34 Years | 11 (22.5%) | 36 (73.5%) |
| 35 to 44 Years | 7 (12.3%) | 54 (94.7%) |
| 45 to 54 Years | 14 (35.0%) | 27 (67.5%) |
| 55 to 64 Years | 17 (31.5%) | 40 (74.1%) |
| 65 to 74 Years | 53 (93.0%) | 37 (64.9%) |
| 75 Years and over | 38 (100.0%) | 35 (92.1%) |
| Total | 214 (50.6%) | 295 (69.7%) |
Disability Status by Sex by Age in Lehigh
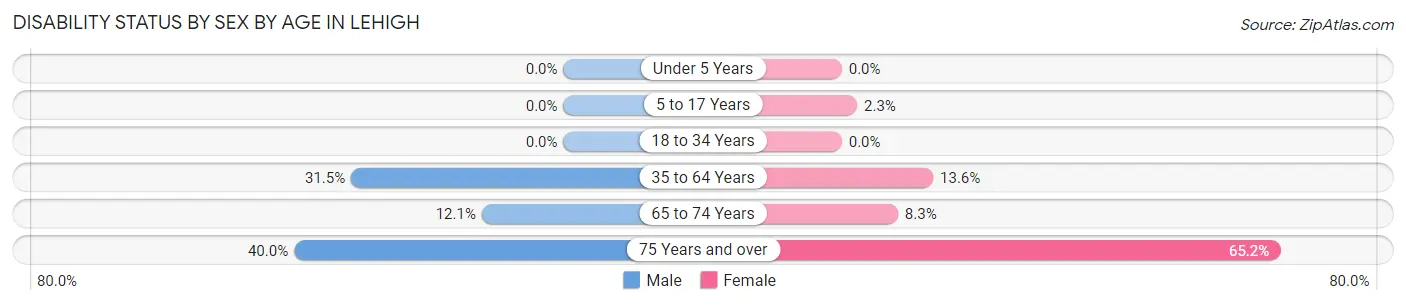
| Age Bracket | Male | Female |
| Under 5 Years | 0 (0.0%) | 0 (0.0%) |
| 5 to 17 Years | 0 (0.0%) | 1 (2.3%) |
| 18 to 34 Years | 0 (0.0%) | 0 (0.0%) |
| 35 to 64 Years | 29 (31.5%) | 8 (13.6%) |
| 65 to 74 Years | 4 (12.1%) | 2 (8.3%) |
| 75 Years and over | 6 (40.0%) | 15 (65.2%) |
Disability Class by Sex by Age in Lehigh
Disability Class: Hearing Difficulty
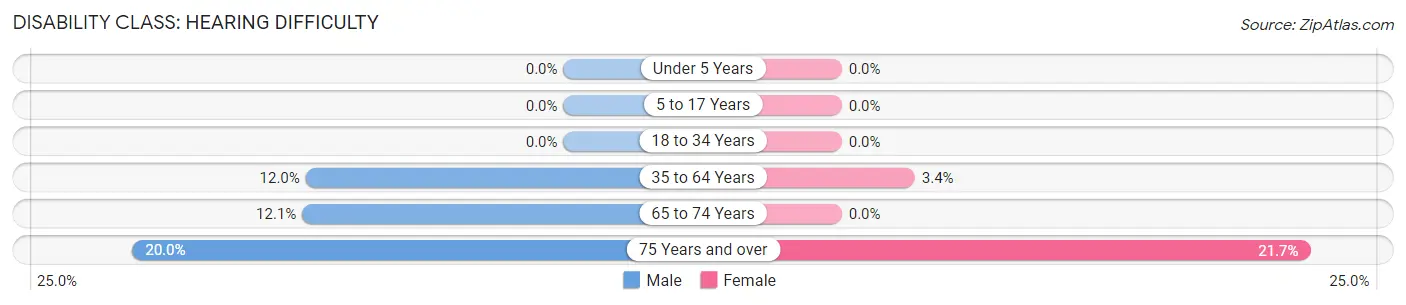
| Age Bracket | Male | Female |
| Under 5 Years | 0 (0.0%) | 0 (0.0%) |
| 5 to 17 Years | 0 (0.0%) | 0 (0.0%) |
| 18 to 34 Years | 0 (0.0%) | 0 (0.0%) |
| 35 to 64 Years | 11 (12.0%) | 2 (3.4%) |
| 65 to 74 Years | 4 (12.1%) | 0 (0.0%) |
| 75 Years and over | 3 (20.0%) | 5 (21.7%) |
Disability Class: Vision Difficulty
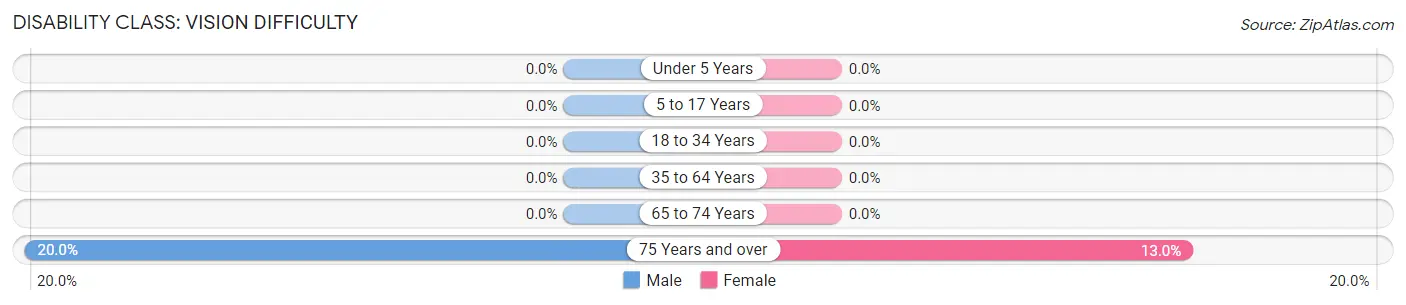
| Age Bracket | Male | Female |
| Under 5 Years | 0 (0.0%) | 0 (0.0%) |
| 5 to 17 Years | 0 (0.0%) | 0 (0.0%) |
| 18 to 34 Years | 0 (0.0%) | 0 (0.0%) |
| 35 to 64 Years | 0 (0.0%) | 0 (0.0%) |
| 65 to 74 Years | 0 (0.0%) | 0 (0.0%) |
| 75 Years and over | 3 (20.0%) | 3 (13.0%) |
Disability Class: Cognitive Difficulty
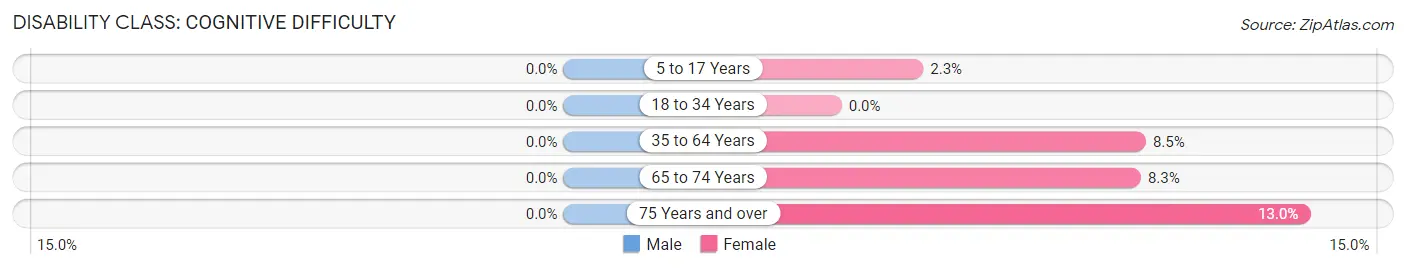
| Age Bracket | Male | Female |
| 5 to 17 Years | 0 (0.0%) | 1 (2.3%) |
| 18 to 34 Years | 0 (0.0%) | 0 (0.0%) |
| 35 to 64 Years | 0 (0.0%) | 5 (8.5%) |
| 65 to 74 Years | 0 (0.0%) | 2 (8.3%) |
| 75 Years and over | 0 (0.0%) | 3 (13.0%) |
Disability Class: Ambulatory Difficulty
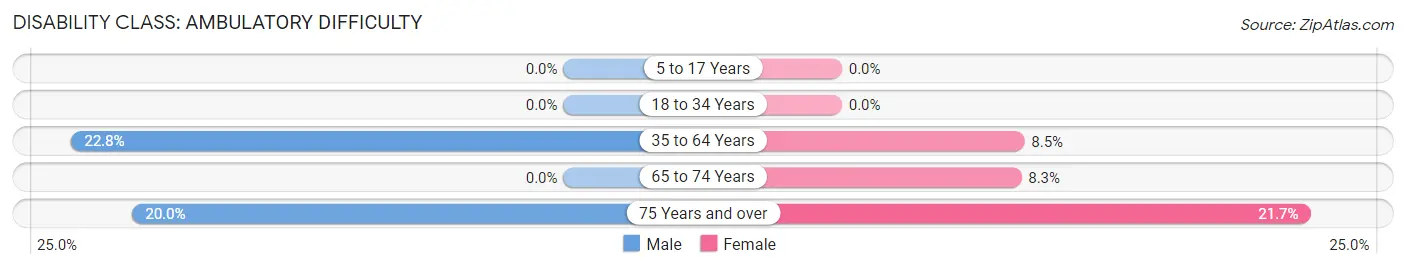
| Age Bracket | Male | Female |
| 5 to 17 Years | 0 (0.0%) | 0 (0.0%) |
| 18 to 34 Years | 0 (0.0%) | 0 (0.0%) |
| 35 to 64 Years | 21 (22.8%) | 5 (8.5%) |
| 65 to 74 Years | 0 (0.0%) | 2 (8.3%) |
| 75 Years and over | 3 (20.0%) | 5 (21.7%) |
Disability Class: Self-Care Difficulty
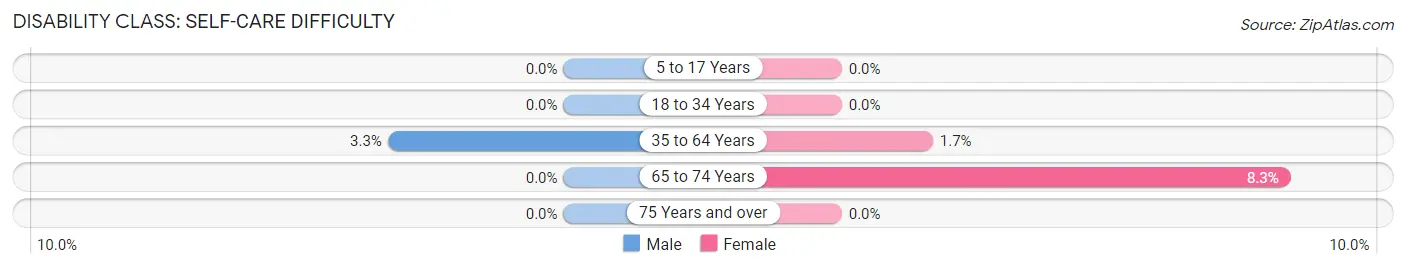
| Age Bracket | Male | Female |
| 5 to 17 Years | 0 (0.0%) | 0 (0.0%) |
| 18 to 34 Years | 0 (0.0%) | 0 (0.0%) |
| 35 to 64 Years | 3 (3.3%) | 1 (1.7%) |
| 65 to 74 Years | 0 (0.0%) | 2 (8.3%) |
| 75 Years and over | 0 (0.0%) | 0 (0.0%) |
Technology Access in Lehigh
Computing Device Access in Lehigh
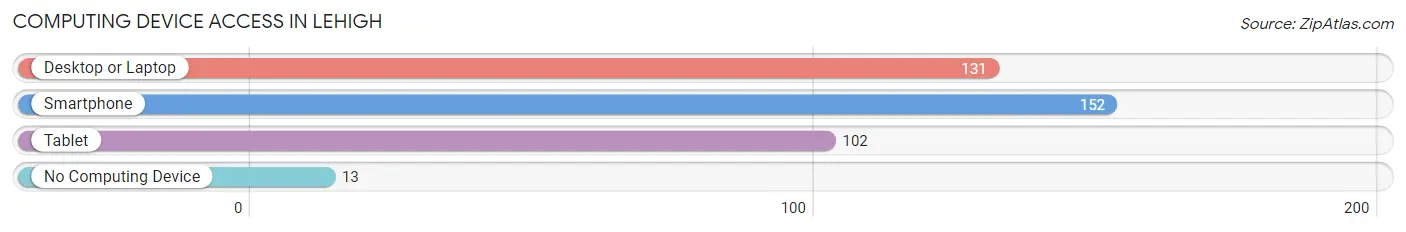
| Device Type | # Households | % Households |
| Desktop or Laptop | 131 | 69.7% |
| Smartphone | 152 | 80.8% |
| Tablet | 102 | 54.3% |
| No Computing Device | 13 | 6.9% |
| Total | 188 | 100.0% |
Internet Access in Lehigh
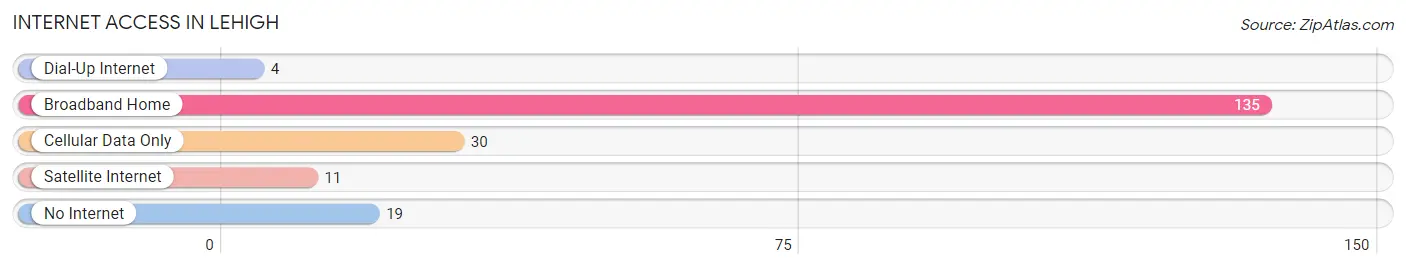
| Internet Type | # Households | % Households |
| Dial-Up Internet | 4 | 2.1% |
| Broadband Home | 135 | 71.8% |
| Cellular Data Only | 30 | 16.0% |
| Satellite Internet | 11 | 5.9% |
| No Internet | 19 | 10.1% |
| Total | 188 | 100.0% |
Lehigh Summary
Lehigh, Iowa is a small city located in Webster County, Iowa. It is situated on the banks of the Des Moines River, and is part of the Fort Dodge, Iowa Metropolitan Statistical Area. The city has a population of 1,845 people, according to the 2010 census.
History
Lehigh was founded in 1856 by a group of settlers from Lehigh, Pennsylvania. The settlers were attracted to the area by the abundance of coal in the area, and the city was named after their hometown. The city was incorporated in 1876, and the first post office was established in 1877.
The city grew rapidly in the late 19th century, and by the early 20th century, it had become a major coal mining center. The coal industry was the main source of employment for the city, and it was also the main source of revenue for the city. The coal industry declined in the mid-20th century, and the city's population began to decline as well.
Geography
Lehigh is located in the northwest corner of Webster County, Iowa. It is situated on the banks of the Des Moines River, and is bordered by the cities of Fort Dodge, Iowa to the east, and Humboldt, Iowa to the west. The city has a total area of 1.2 square miles, all of which is land.
The city has a humid continental climate, with cold winters and hot, humid summers. The average annual temperature is 48.3 degrees Fahrenheit, and the average annual precipitation is 33.3 inches.
Economy
Lehigh's economy is largely based on agriculture and manufacturing. The city is home to several manufacturing companies, including a steel mill, a paper mill, and a plastics factory. The city also has a number of small businesses, including restaurants, retail stores, and service providers.
The city is also home to a number of agricultural businesses, including dairy farms, grain elevators, and livestock operations. The city is also home to a number of recreational businesses, including golf courses, parks, and campgrounds.
Demographics
Lehigh has a population of 1,845 people, according to the 2010 census. The population is predominantly white, with a small minority population. The median household income is $41,944, and the median age is 41.7 years.
The city has a high rate of homeownership, with 73.3% of the population owning their own homes. The city also has a high rate of educational attainment, with 87.3% of the population having at least a high school diploma.
Conclusion
Lehigh, Iowa is a small city located in Webster County, Iowa. It is situated on the banks of the Des Moines River, and is part of the Fort Dodge, Iowa Metropolitan Statistical Area. The city has a population of 1,845 people, according to the 2010 census. The city's economy is largely based on agriculture and manufacturing, and the city has a high rate of homeownership and educational attainment. Lehigh is a small city with a rich history and a bright future.
Common Questions
What is Per Capita Income in Lehigh?
Per Capita income in Lehigh is $36,931.
What is the Median Family Income in Lehigh?
Median Family Income in Lehigh is $71,250.
What is the Median Household income in Lehigh?
Median Household Income in Lehigh is $56,667.
What is Income or Wage Gap in Lehigh?
Income or Wage Gap in Lehigh is 55.6%.
Women in Lehigh earn 44.4 cents for every dollar earned by a man.
What is Inequality or Gini Index in Lehigh?
Inequality or Gini Index in Lehigh is 0.53.
What is the Total Population of Lehigh?
Total Population of Lehigh is 423.
What is the Total Male Population of Lehigh?
Total Male Population of Lehigh is 217.
What is the Total Female Population of Lehigh?
Total Female Population of Lehigh is 206.
What is the Ratio of Males per 100 Females in Lehigh?
There are 105.34 Males per 100 Females in Lehigh.
What is the Ratio of Females per 100 Males in Lehigh?
There are 94.93 Females per 100 Males in Lehigh.
What is the Median Population Age in Lehigh?
Median Population Age in Lehigh is 42.1 Years.
What is the Average Family Size in Lehigh
Average Family Size in Lehigh is 2.9 People.
What is the Average Household Size in Lehigh
Average Household Size in Lehigh is 2.2 People.
How Large is the Labor Force in Lehigh?
There are 215 People in the Labor Forcein in Lehigh.
What is the Percentage of People in the Labor Force in Lehigh?
65.0% of People are in the Labor Force in Lehigh.
What is the Unemployment Rate in Lehigh?
Unemployment Rate in Lehigh is 4.7%.