Lake Park, IA Map & Demographics
Lake Park Map
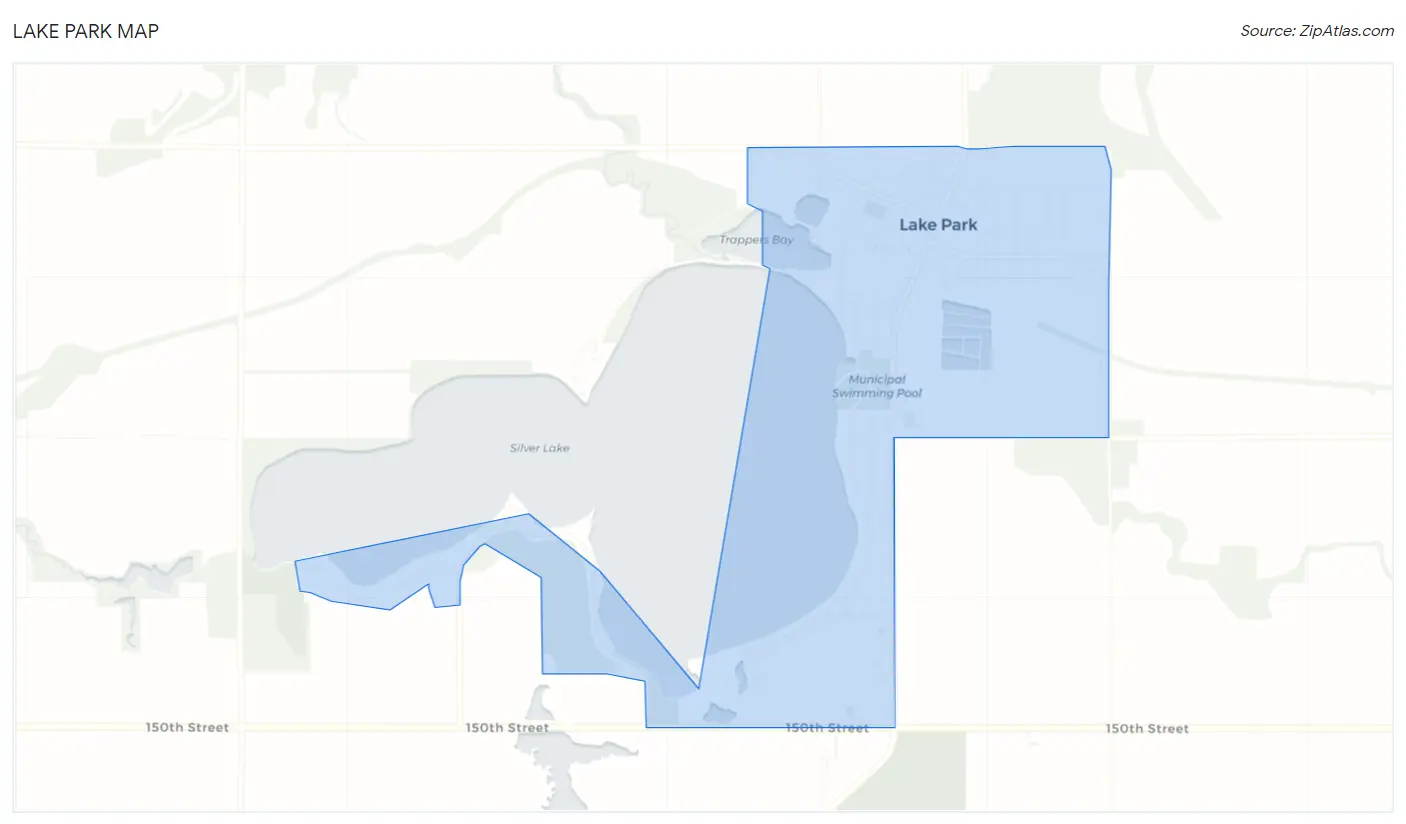
Lake Park Overview
$36,319
PER CAPITA INCOME
$83,672
AVG FAMILY INCOME
$75,476
AVG HOUSEHOLD INCOME
36.4%
WAGE / INCOME GAP [ % ]
63.6¢/ $1
WAGE / INCOME GAP [ $ ]
0.36
INEQUALITY / GINI INDEX
1,223
TOTAL POPULATION
609
MALE POPULATION
614
FEMALE POPULATION
99.19
MALES / 100 FEMALES
100.82
FEMALES / 100 MALES
40.1
MEDIAN AGE
3.0
AVG FAMILY SIZE
2.3
AVG HOUSEHOLD SIZE
673
LABOR FORCE [ PEOPLE ]
69.6%
PERCENT IN LABOR FORCE
0.4%
UNEMPLOYMENT RATE
Lake Park Zip Codes
Lake Park Area Codes
Income in Lake Park
Income Overview in Lake Park
Per Capita Income in Lake Park is $36,319, while median incomes of families and households are $83,672 and $75,476 respectively.
| Characteristic | Number | Measure |
| Per Capita Income | 1,223 | $36,319 |
| Median Family Income | 305 | $83,672 |
| Mean Family Income | 305 | $100,650 |
| Median Household Income | 512 | $75,476 |
| Mean Household Income | 512 | $84,907 |
| Income Deficit | 305 | $0 |
| Wage / Income Gap (%) | 1,223 | 36.45% |
| Wage / Income Gap ($) | 1,223 | 63.55¢ per $1 |
| Gini / Inequality Index | 1,223 | 0.36 |
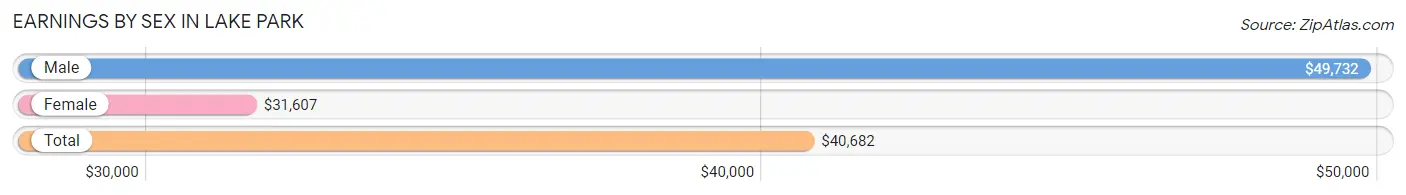
Earnings by Sex in Lake Park
Average Earnings in Lake Park are $40,682, $49,732 for men and $31,607 for women, a difference of 36.4%.
| Sex | Number | Average Earnings |
| Male | 401 (55.1%) | $49,732 |
| Female | 327 (44.9%) | $31,607 |
| Total | 728 (100.0%) | $40,682 |
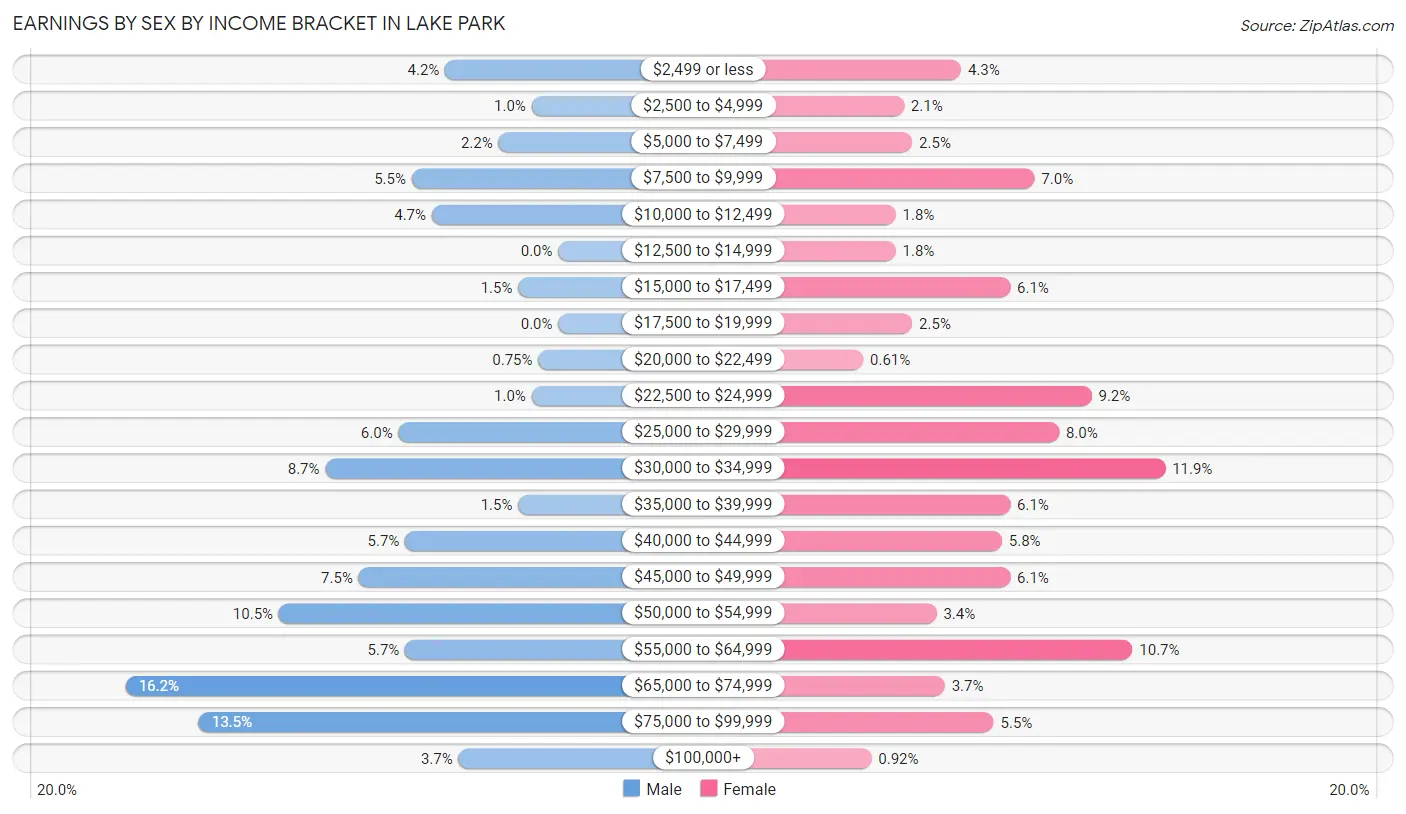
Earnings by Sex by Income Bracket in Lake Park
The most common earnings brackets in Lake Park are $65,000 to $74,999 for men (65 | 16.2%) and $30,000 to $34,999 for women (39 | 11.9%).
| Income | Male | Female |
| $2,499 or less | 17 (4.2%) | 14 (4.3%) |
| $2,500 to $4,999 | 4 (1.0%) | 7 (2.1%) |
| $5,000 to $7,499 | 9 (2.2%) | 8 (2.5%) |
| $7,500 to $9,999 | 22 (5.5%) | 23 (7.0%) |
| $10,000 to $12,499 | 19 (4.7%) | 6 (1.8%) |
| $12,500 to $14,999 | 0 (0.0%) | 6 (1.8%) |
| $15,000 to $17,499 | 6 (1.5%) | 20 (6.1%) |
| $17,500 to $19,999 | 0 (0.0%) | 8 (2.5%) |
| $20,000 to $22,499 | 3 (0.7%) | 2 (0.6%) |
| $22,500 to $24,999 | 4 (1.0%) | 30 (9.2%) |
| $25,000 to $29,999 | 24 (6.0%) | 26 (8.0%) |
| $30,000 to $34,999 | 35 (8.7%) | 39 (11.9%) |
| $35,000 to $39,999 | 6 (1.5%) | 20 (6.1%) |
| $40,000 to $44,999 | 23 (5.7%) | 19 (5.8%) |
| $45,000 to $49,999 | 30 (7.5%) | 20 (6.1%) |
| $50,000 to $54,999 | 42 (10.5%) | 11 (3.4%) |
| $55,000 to $64,999 | 23 (5.7%) | 35 (10.7%) |
| $65,000 to $74,999 | 65 (16.2%) | 12 (3.7%) |
| $75,000 to $99,999 | 54 (13.5%) | 18 (5.5%) |
| $100,000+ | 15 (3.7%) | 3 (0.9%) |
| Total | 401 (100.0%) | 327 (100.0%) |
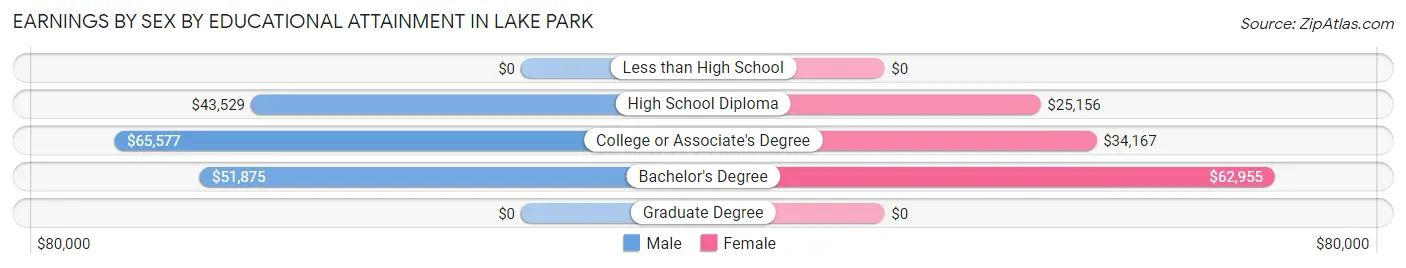
Earnings by Sex by Educational Attainment in Lake Park
Average earnings in Lake Park are $52,083 for men and $33,984 for women, a difference of 34.7%. Men with an educational attainment of college or associate's degree enjoy the highest average annual earnings of $65,577, while those with high school diploma education earn the least with $43,529. Women with an educational attainment of bachelor's degree earn the most with the average annual earnings of $62,955, while those with high school diploma education have the smallest earnings of $25,156.
| Educational Attainment | Male Income | Female Income |
| Less than High School | - | - |
| High School Diploma | $43,529 | $25,156 |
| College or Associate's Degree | $65,577 | $34,167 |
| Bachelor's Degree | $51,875 | $62,955 |
| Graduate Degree | - | - |
| Total | $52,083 | $33,984 |
Family Income in Lake Park
Family Income Brackets in Lake Park
According to the Lake Park family income data, there are 79 families falling into the $100,000 to $149,999 income range, which is the most common income bracket and makes up 25.9% of all families.
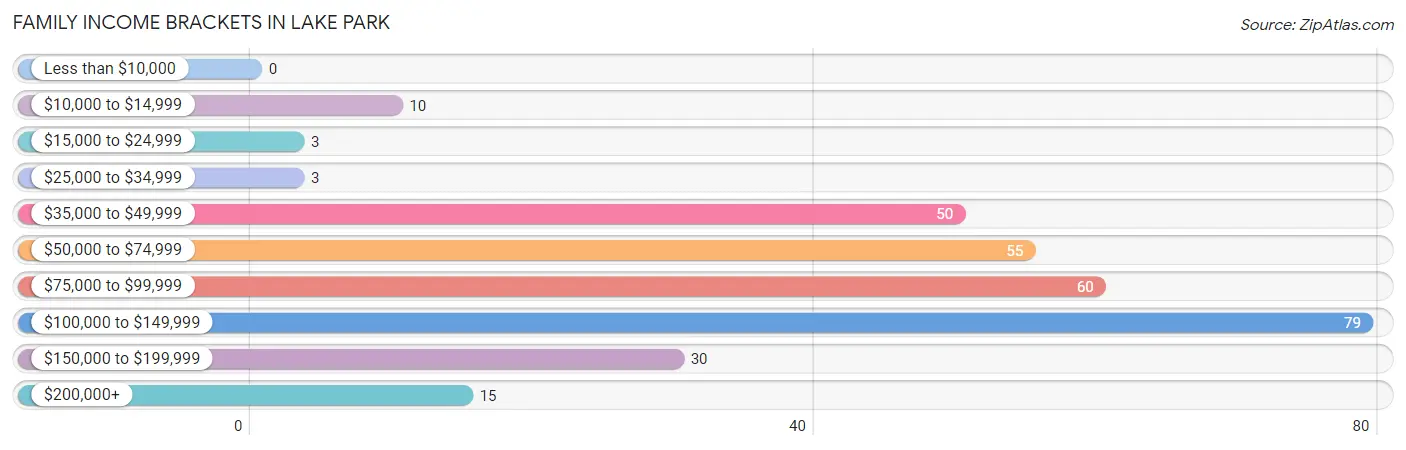
| Income Bracket | # Families | % Families |
| Less than $10,000 | 0 | 0.0% |
| $10,000 to $14,999 | 10 | 3.3% |
| $15,000 to $24,999 | 3 | 1.0% |
| $25,000 to $34,999 | 3 | 1.0% |
| $35,000 to $49,999 | 50 | 16.4% |
| $50,000 to $74,999 | 55 | 18.0% |
| $75,000 to $99,999 | 60 | 19.7% |
| $100,000 to $149,999 | 79 | 25.9% |
| $150,000 to $199,999 | 30 | 9.8% |
| $200,000+ | 15 | 4.9% |
Family Income by Famaliy Size in Lake Park
6-person families (14 | 4.6%) account for the highest median family income in Lake Park with $123,438 per family, while 2-person families (157 | 51.5%) have the highest median income of $36,160 per family member.
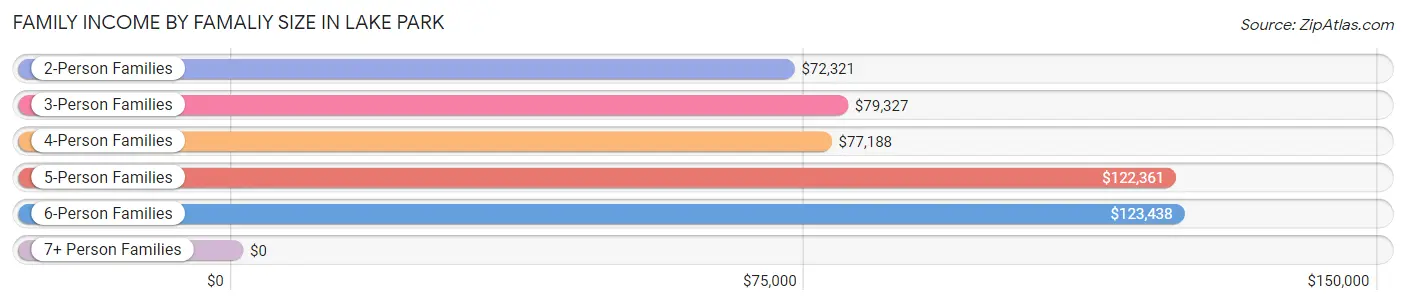
| Income Bracket | # Families | Median Income |
| 2-Person Families | 157 (51.5%) | $72,321 |
| 3-Person Families | 53 (17.4%) | $79,327 |
| 4-Person Families | 60 (19.7%) | $77,188 |
| 5-Person Families | 21 (6.9%) | $122,361 |
| 6-Person Families | 14 (4.6%) | $123,438 |
| 7+ Person Families | 0 (0.0%) | $0 |
| Total | 305 (100.0%) | $83,672 |
Family Income by Number of Earners in Lake Park
The median family income in Lake Park is $83,672, with families comprising 3+ earners (29) having the highest median family income of $103,542, while families with 1 earner (72) have the lowest median family income of $48,542, accounting for 9.5% and 23.6% of families, respectively.
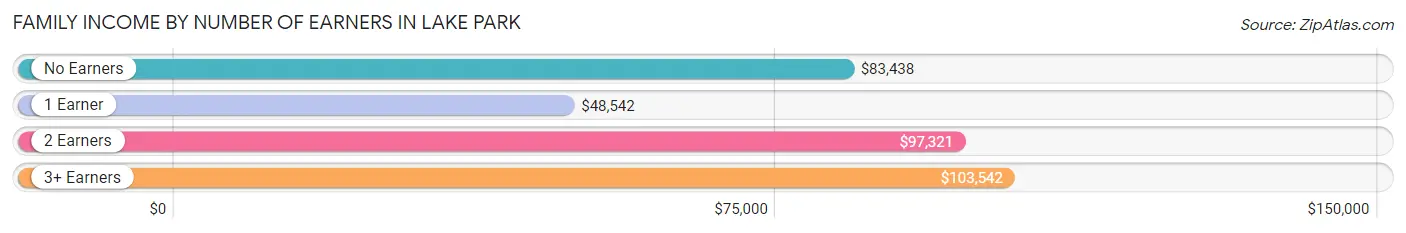
| Number of Earners | # Families | Median Income |
| No Earners | 47 (15.4%) | $83,438 |
| 1 Earner | 72 (23.6%) | $48,542 |
| 2 Earners | 157 (51.5%) | $97,321 |
| 3+ Earners | 29 (9.5%) | $103,542 |
| Total | 305 (100.0%) | $83,672 |
Household Income in Lake Park
Household Income Brackets in Lake Park
With 114 households falling in the category, the $100,000 to $149,999 income range is the most frequent in Lake Park, accounting for 22.3% of all households. In contrast, only 8 households (1.6%) fall into the less than $10,000 income bracket, making it the least populous group.
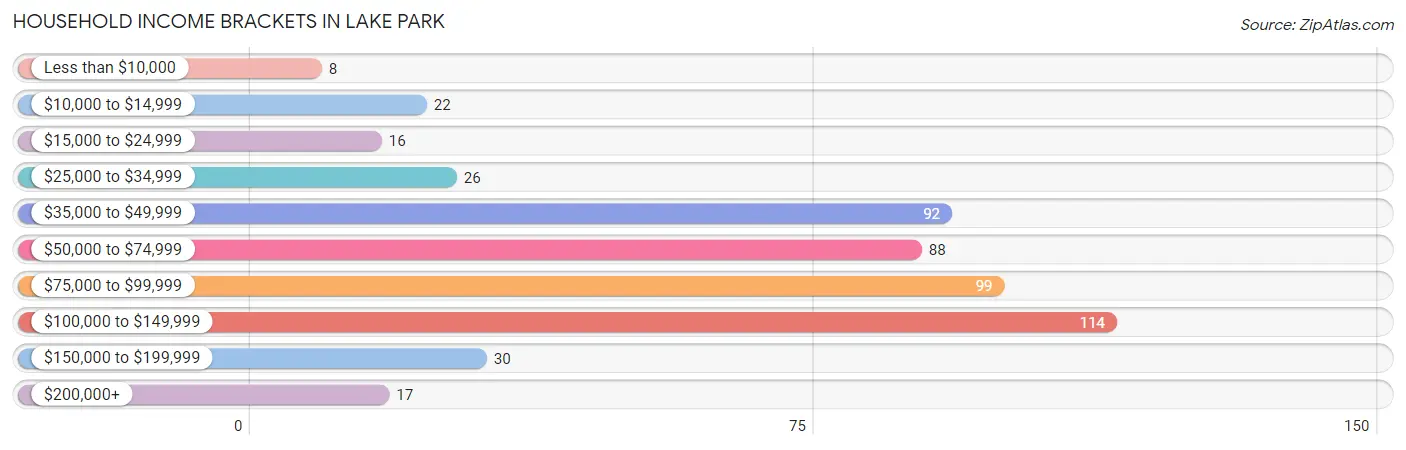
| Income Bracket | # Households | % Households |
| Less than $10,000 | 8 | 1.6% |
| $10,000 to $14,999 | 22 | 4.3% |
| $15,000 to $24,999 | 16 | 3.1% |
| $25,000 to $34,999 | 26 | 5.1% |
| $35,000 to $49,999 | 92 | 18.0% |
| $50,000 to $74,999 | 88 | 17.2% |
| $75,000 to $99,999 | 99 | 19.3% |
| $100,000 to $149,999 | 114 | 22.3% |
| $150,000 to $199,999 | 30 | 5.9% |
| $200,000+ | 17 | 3.3% |
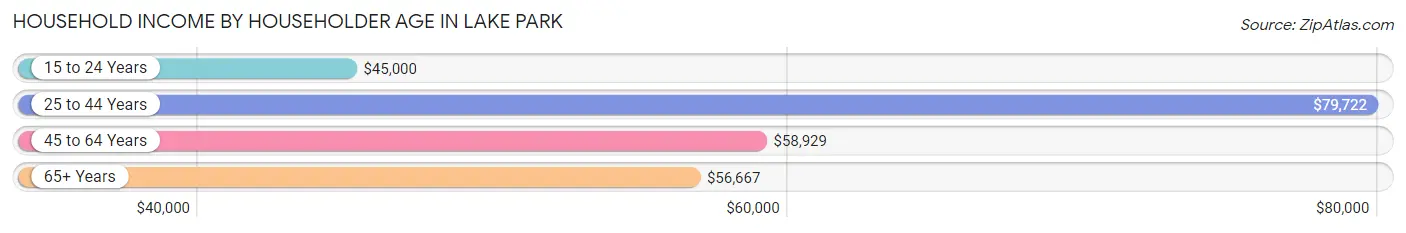
Household Income by Householder Age in Lake Park
The median household income in Lake Park is $75,476, with the highest median household income of $79,722 found in the 25 to 44 years age bracket for the primary householder. A total of 194 households (37.9%) fall into this category. Meanwhile, the 15 to 24 years age bracket for the primary householder has the lowest median household income of $45,000, with 8 households (1.6%) in this group.
| Income Bracket | # Households | Median Income |
| 15 to 24 Years | 8 (1.6%) | $45,000 |
| 25 to 44 Years | 194 (37.9%) | $79,722 |
| 45 to 64 Years | 130 (25.4%) | $58,929 |
| 65+ Years | 180 (35.2%) | $56,667 |
| Total | 512 (100.0%) | $75,476 |
Poverty in Lake Park
Income Below Poverty by Sex and Age in Lake Park
With 6.7% poverty level for males and 4.7% for females among the residents of Lake Park, 25 to 34 year old males and 45 to 54 year old females are the most vulnerable to poverty, with 15 males (18.3%) and 11 females (22.0%) in their respective age groups living below the poverty level.
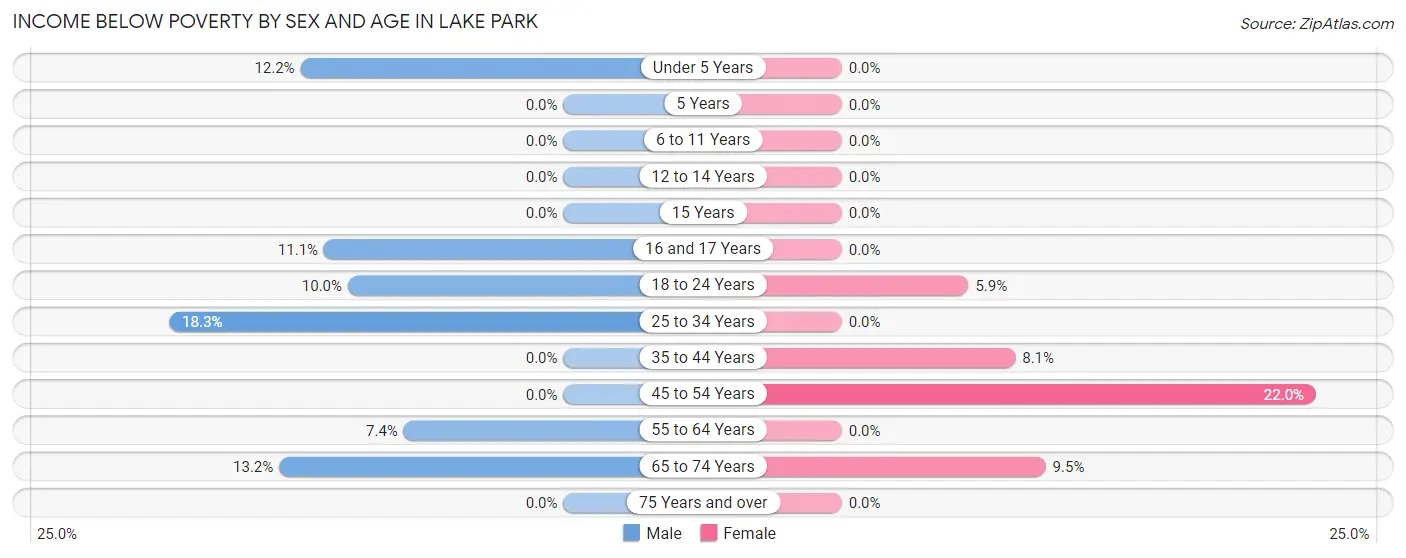
| Age Bracket | Male | Female |
| Under 5 Years | 5 (12.2%) | 0 (0.0%) |
| 5 Years | 0 (0.0%) | 0 (0.0%) |
| 6 to 11 Years | 0 (0.0%) | 0 (0.0%) |
| 12 to 14 Years | 0 (0.0%) | 0 (0.0%) |
| 15 Years | 0 (0.0%) | 0 (0.0%) |
| 16 and 17 Years | 3 (11.1%) | 0 (0.0%) |
| 18 to 24 Years | 1 (10.0%) | 3 (5.9%) |
| 25 to 34 Years | 15 (18.3%) | 0 (0.0%) |
| 35 to 44 Years | 0 (0.0%) | 7 (8.1%) |
| 45 to 54 Years | 0 (0.0%) | 11 (22.0%) |
| 55 to 64 Years | 4 (7.4%) | 0 (0.0%) |
| 65 to 74 Years | 12 (13.2%) | 7 (9.5%) |
| 75 Years and over | 0 (0.0%) | 0 (0.0%) |
| Total | 40 (6.7%) | 28 (4.7%) |
Income Above Poverty by Sex and Age in Lake Park
According to the poverty statistics in Lake Park, males aged 5 years and females aged under 5 years are the age groups that are most secure financially, with 100.0% of males and 100.0% of females in these age groups living above the poverty line.
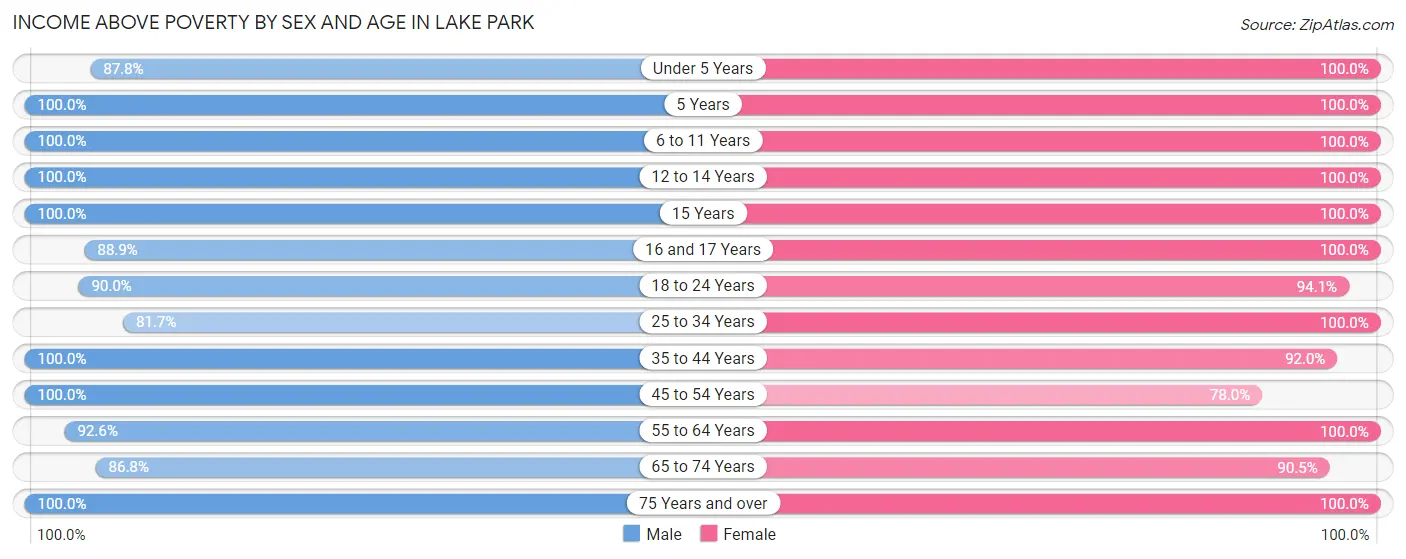
| Age Bracket | Male | Female |
| Under 5 Years | 36 (87.8%) | 28 (100.0%) |
| 5 Years | 8 (100.0%) | 29 (100.0%) |
| 6 to 11 Years | 58 (100.0%) | 42 (100.0%) |
| 12 to 14 Years | 7 (100.0%) | 23 (100.0%) |
| 15 Years | 3 (100.0%) | 17 (100.0%) |
| 16 and 17 Years | 24 (88.9%) | 3 (100.0%) |
| 18 to 24 Years | 9 (90.0%) | 48 (94.1%) |
| 25 to 34 Years | 67 (81.7%) | 61 (100.0%) |
| 35 to 44 Years | 130 (100.0%) | 80 (91.9%) |
| 45 to 54 Years | 45 (100.0%) | 39 (78.0%) |
| 55 to 64 Years | 50 (92.6%) | 72 (100.0%) |
| 65 to 74 Years | 79 (86.8%) | 67 (90.5%) |
| 75 Years and over | 43 (100.0%) | 58 (100.0%) |
| Total | 559 (93.3%) | 567 (95.3%) |
Income Below Poverty Among Married-Couple Families in Lake Park
The poverty statistics for married-couple families in Lake Park show that 3.8% or 10 of the total 261 families live below the poverty line. Families with no children have the highest poverty rate of 5.8%, comprising of 9 families. On the other hand, families with 3 or 4 children have the lowest poverty rate of 0.0%, which includes 0 families.
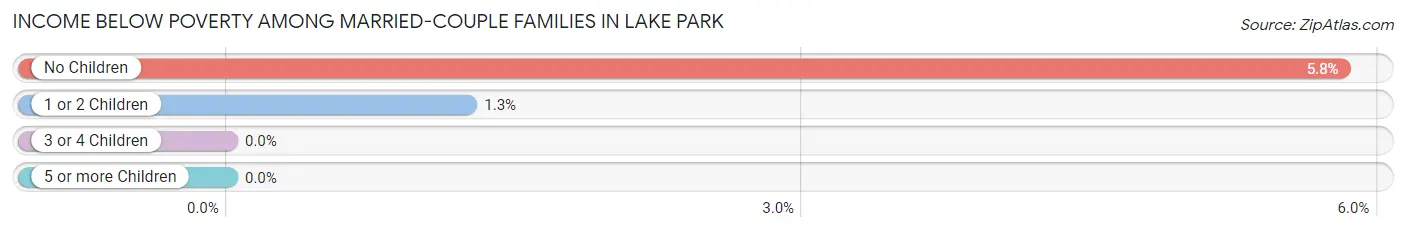
| Children | Above Poverty | Below Poverty |
| No Children | 146 (94.2%) | 9 (5.8%) |
| 1 or 2 Children | 79 (98.8%) | 1 (1.3%) |
| 3 or 4 Children | 26 (100.0%) | 0 (0.0%) |
| 5 or more Children | 0 (0.0%) | 0 (0.0%) |
| Total | 251 (96.2%) | 10 (3.8%) |
Income Below Poverty Among Single-Parent Households in Lake Park
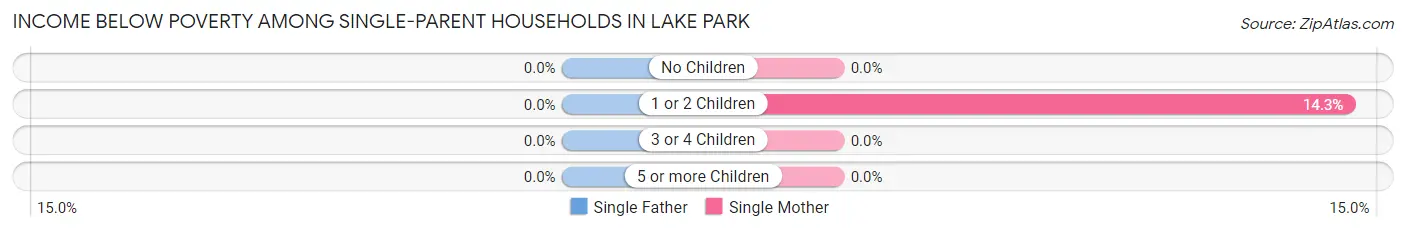
| Children | Single Father | Single Mother |
| No Children | 0 (0.0%) | 0 (0.0%) |
| 1 or 2 Children | 0 (0.0%) | 3 (14.3%) |
| 3 or 4 Children | 0 (0.0%) | 0 (0.0%) |
| 5 or more Children | 0 (0.0%) | 0 (0.0%) |
| Total | 0 (0.0%) | 3 (9.7%) |
Income Below Poverty Among Married-Couple vs Single-Parent Households in Lake Park
The poverty data for Lake Park shows that 10 of the married-couple family households (3.8%) and 3 of the single-parent households (6.8%) are living below the poverty level. Within the married-couple family households, those with no children have the highest poverty rate, with 9 households (5.8%) falling below the poverty line. Among the single-parent households, those with 1 or 2 children have the highest poverty rate, with 3 household (10.0%) living below poverty.
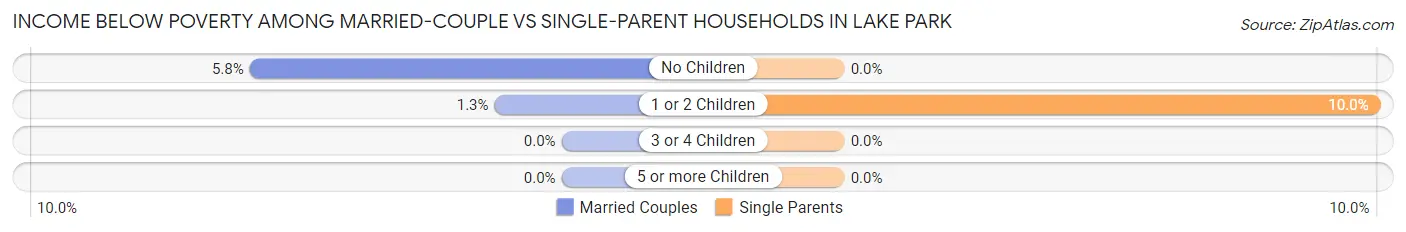
| Children | Married-Couple Families | Single-Parent Households |
| No Children | 9 (5.8%) | 0 (0.0%) |
| 1 or 2 Children | 1 (1.3%) | 3 (10.0%) |
| 3 or 4 Children | 0 (0.0%) | 0 (0.0%) |
| 5 or more Children | 0 (0.0%) | 0 (0.0%) |
| Total | 10 (3.8%) | 3 (6.8%) |
Race in Lake Park
The most populous races in Lake Park are White / Caucasian (1,183 | 96.7%), Hispanic or Latino (42 | 3.4%), and Two or more Races (32 | 2.6%).
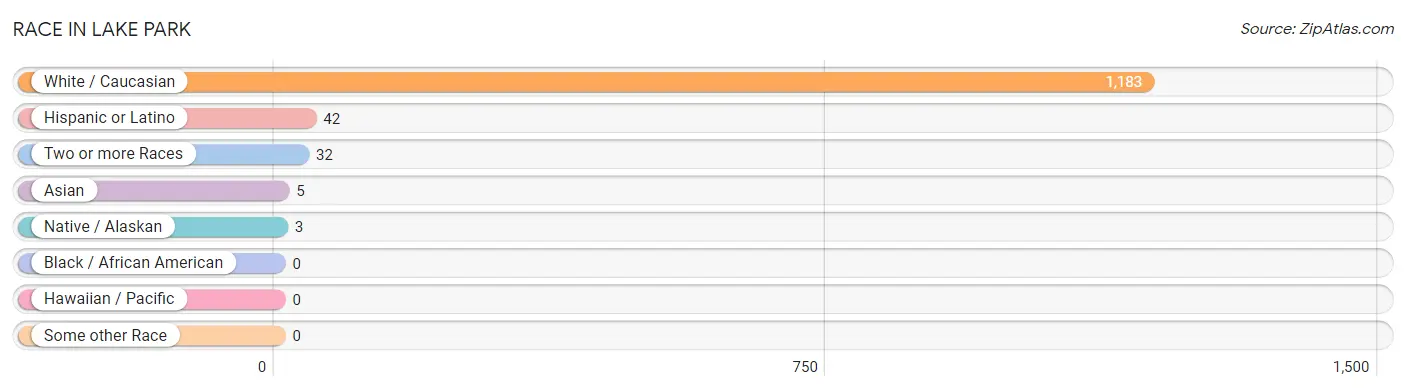
| Race | # Population | % Population |
| Asian | 5 | 0.4% |
| Black / African American | 0 | 0.0% |
| Hawaiian / Pacific | 0 | 0.0% |
| Hispanic or Latino | 42 | 3.4% |
| Native / Alaskan | 3 | 0.3% |
| White / Caucasian | 1,183 | 96.7% |
| Two or more Races | 32 | 2.6% |
| Some other Race | 0 | 0.0% |
| Total | 1,223 | 100.0% |
Ancestry in Lake Park
The most populous ancestries reported in Lake Park are German (477 | 39.0%), Dutch (111 | 9.1%), Irish (89 | 7.3%), Italian (83 | 6.8%), and English (69 | 5.6%), together accounting for 67.8% of all Lake Park residents.
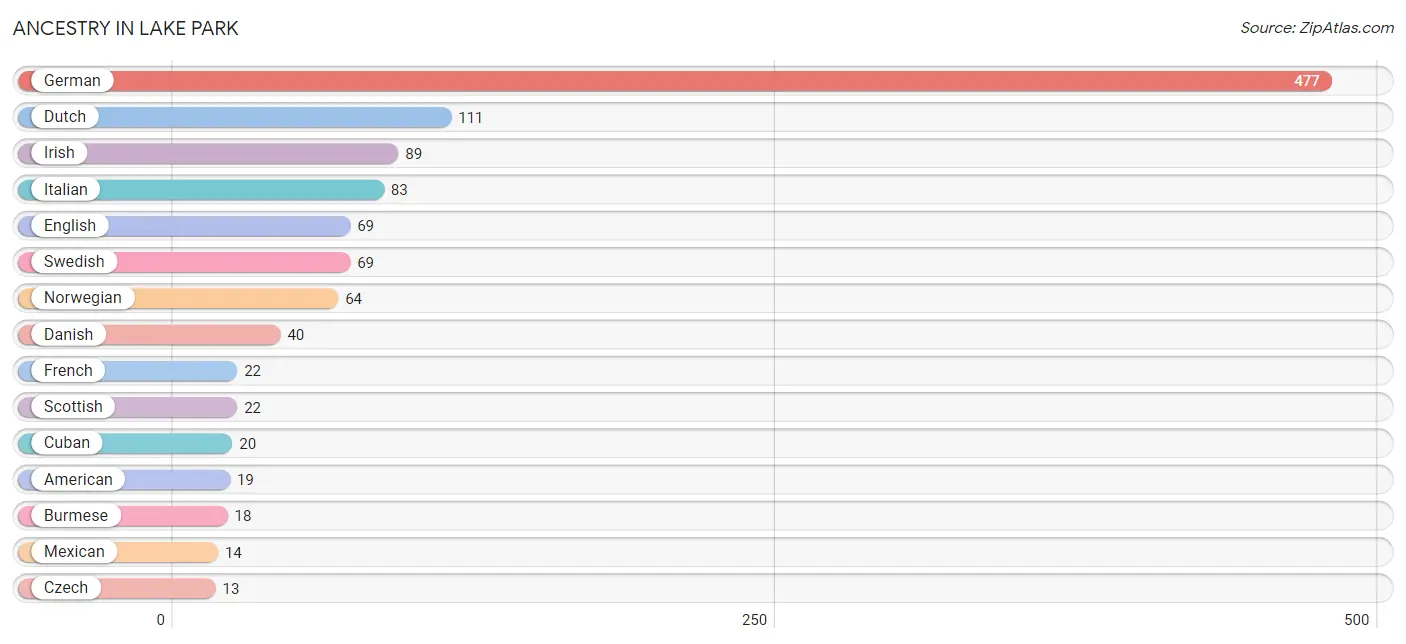
| Ancestry | # Population | % Population |
| American | 19 | 1.5% |
| Austrian | 3 | 0.3% |
| Burmese | 18 | 1.5% |
| Chippewa | 2 | 0.2% |
| Cuban | 20 | 1.6% |
| Czech | 13 | 1.1% |
| Danish | 40 | 3.3% |
| Dutch | 111 | 9.1% |
| English | 69 | 5.6% |
| European | 6 | 0.5% |
| French | 22 | 1.8% |
| German | 477 | 39.0% |
| Irish | 89 | 7.3% |
| Italian | 83 | 6.8% |
| Mexican | 14 | 1.1% |
| Norwegian | 64 | 5.2% |
| Pennsylvania German | 4 | 0.3% |
| Polish | 13 | 1.1% |
| Portuguese | 4 | 0.3% |
| Puerto Rican | 8 | 0.6% |
| Scandinavian | 12 | 1.0% |
| Scottish | 22 | 1.8% |
| Sioux | 2 | 0.2% |
| Swedish | 69 | 5.6% |
| Welsh | 12 | 1.0% | View All 25 Rows |
Immigrants in Lake Park
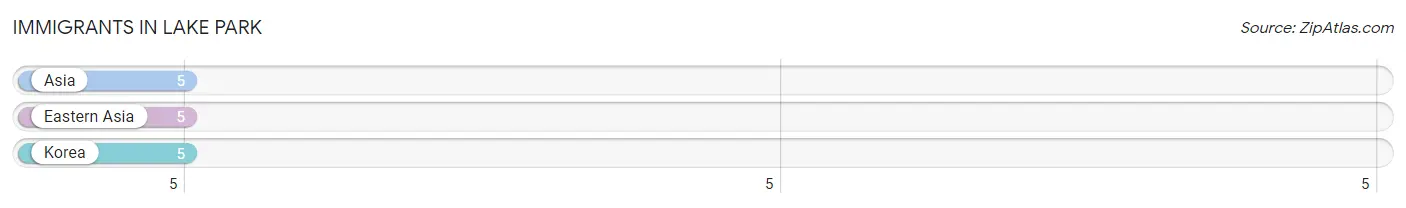
The most numerous immigrant groups reported in Lake Park came from Asia (5 | 0.4%), Eastern Asia (5 | 0.4%), and Korea (5 | 0.4%), together accounting for 1.2% of all Lake Park residents.
| Immigration Origin | # Population | % Population |
| Asia | 5 | 0.4% |
| Eastern Asia | 5 | 0.4% |
| Korea | 5 | 0.4% | View All 3 Rows |
Sex and Age in Lake Park
Sex and Age in Lake Park
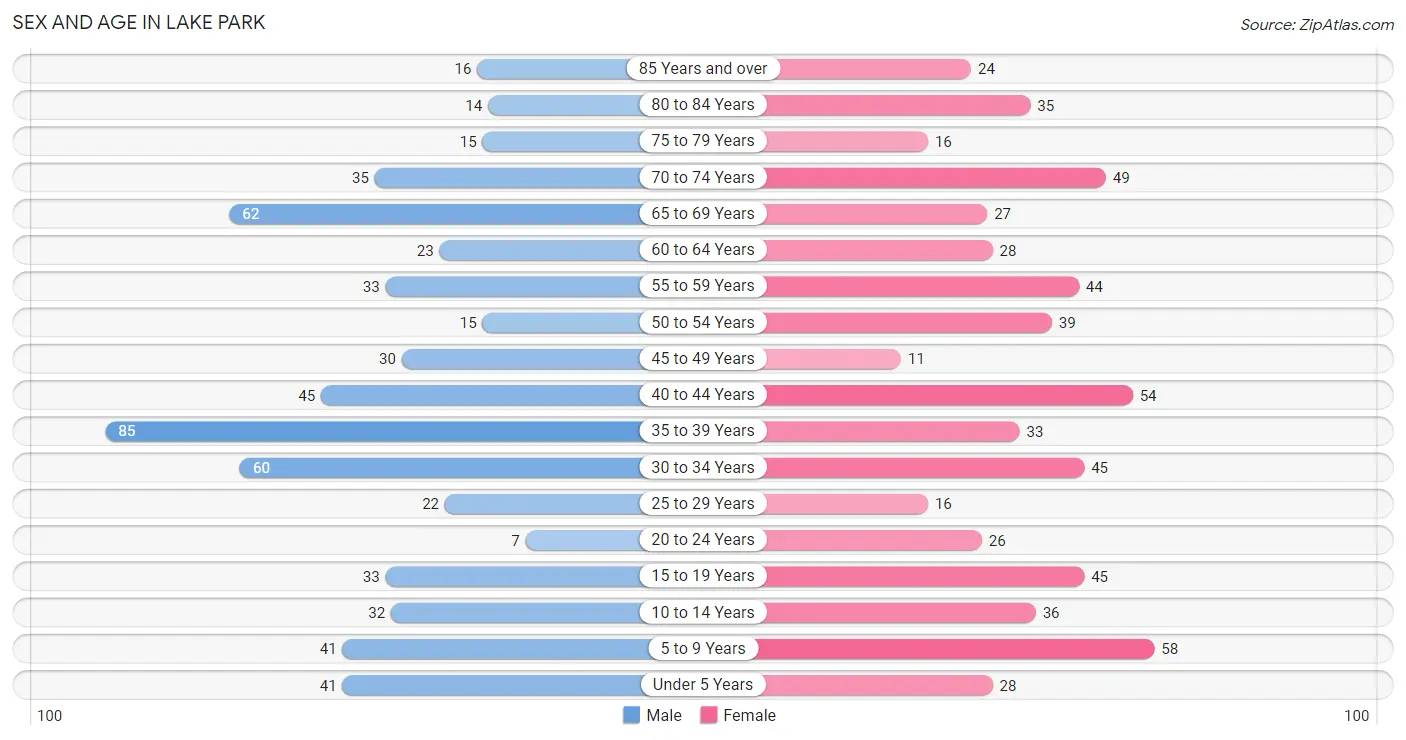
The most populous age groups in Lake Park are 35 to 39 Years (85 | 14.0%) for men and 5 to 9 Years (58 | 9.5%) for women.
| Age Bracket | Male | Female |
| Under 5 Years | 41 (6.7%) | 28 (4.6%) |
| 5 to 9 Years | 41 (6.7%) | 58 (9.5%) |
| 10 to 14 Years | 32 (5.2%) | 36 (5.9%) |
| 15 to 19 Years | 33 (5.4%) | 45 (7.3%) |
| 20 to 24 Years | 7 (1.1%) | 26 (4.2%) |
| 25 to 29 Years | 22 (3.6%) | 16 (2.6%) |
| 30 to 34 Years | 60 (9.9%) | 45 (7.3%) |
| 35 to 39 Years | 85 (14.0%) | 33 (5.4%) |
| 40 to 44 Years | 45 (7.4%) | 54 (8.8%) |
| 45 to 49 Years | 30 (4.9%) | 11 (1.8%) |
| 50 to 54 Years | 15 (2.5%) | 39 (6.4%) |
| 55 to 59 Years | 33 (5.4%) | 44 (7.2%) |
| 60 to 64 Years | 23 (3.8%) | 28 (4.6%) |
| 65 to 69 Years | 62 (10.2%) | 27 (4.4%) |
| 70 to 74 Years | 35 (5.8%) | 49 (8.0%) |
| 75 to 79 Years | 15 (2.5%) | 16 (2.6%) |
| 80 to 84 Years | 14 (2.3%) | 35 (5.7%) |
| 85 Years and over | 16 (2.6%) | 24 (3.9%) |
| Total | 609 (100.0%) | 614 (100.0%) |
Families and Households in Lake Park
Median Family Size in Lake Park
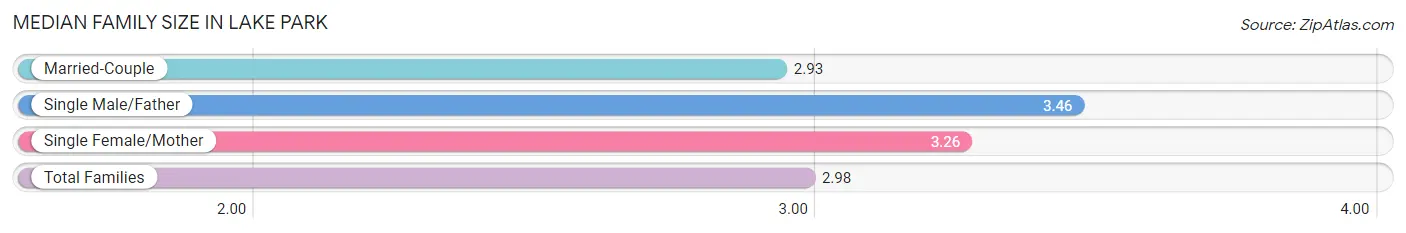
The median family size in Lake Park is 2.98 persons per family, with single male/father families (13 | 4.3%) accounting for the largest median family size of 3.46 persons per family. On the other hand, married-couple families (261 | 85.6%) represent the smallest median family size with 2.93 persons per family.
| Family Type | # Families | Family Size |
| Married-Couple | 261 (85.6%) | 2.93 |
| Single Male/Father | 13 (4.3%) | 3.46 |
| Single Female/Mother | 31 (10.2%) | 3.26 |
| Total Families | 305 (100.0%) | 2.98 |
Median Household Size in Lake Park
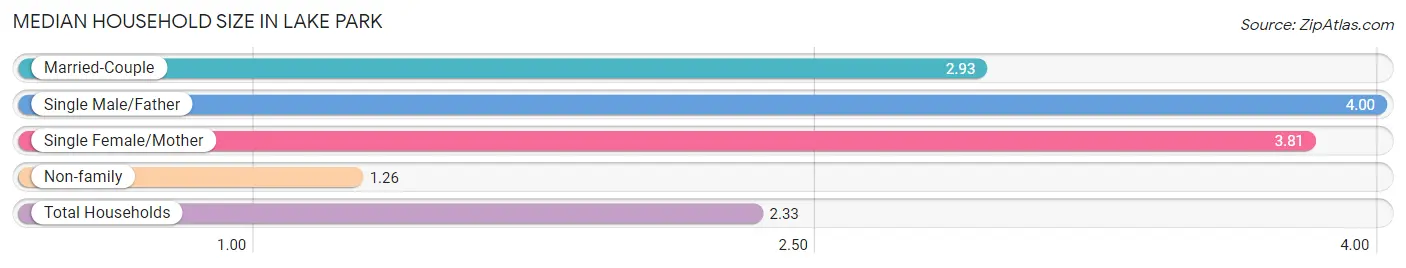
The median household size in Lake Park is 2.33 persons per household, with single male/father households (13 | 2.5%) accounting for the largest median household size of 4 persons per household. non-family households (207 | 40.4%) represent the smallest median household size with 1.26 persons per household.
| Household Type | # Households | Household Size |
| Married-Couple | 261 (51.0%) | 2.93 |
| Single Male/Father | 13 (2.5%) | 4.00 |
| Single Female/Mother | 31 (6.0%) | 3.81 |
| Non-family | 207 (40.4%) | 1.26 |
| Total Households | 512 (100.0%) | 2.33 |
Household Size by Marriage Status in Lake Park
Out of a total of 512 households in Lake Park, 305 (59.6%) are family households, while 207 (40.4%) are nonfamily households. The most numerous type of family households are 2-person households, comprising 157, and the most common type of nonfamily households are 1-person households, comprising 142.
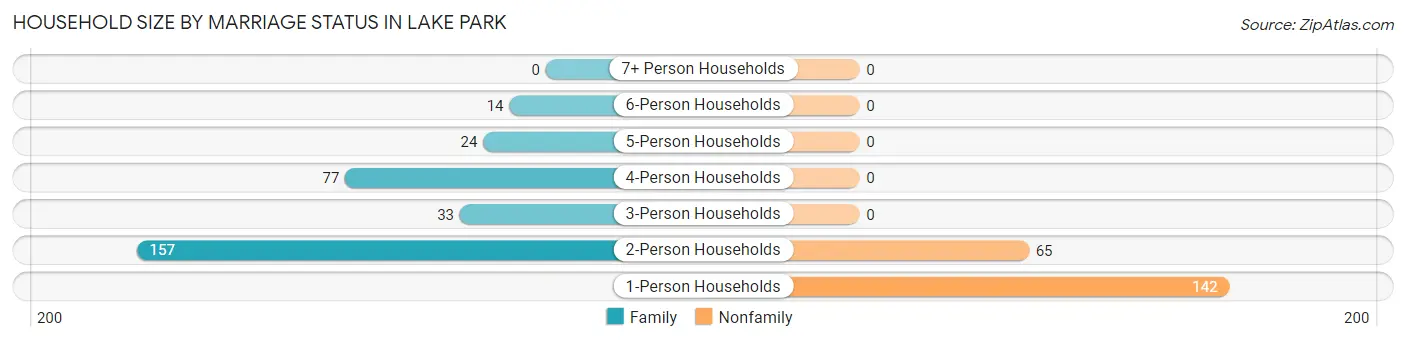
| Household Size | Family Households | Nonfamily Households |
| 1-Person Households | - | 142 (27.7%) |
| 2-Person Households | 157 (30.7%) | 65 (12.7%) |
| 3-Person Households | 33 (6.5%) | 0 (0.0%) |
| 4-Person Households | 77 (15.0%) | 0 (0.0%) |
| 5-Person Households | 24 (4.7%) | 0 (0.0%) |
| 6-Person Households | 14 (2.7%) | 0 (0.0%) |
| 7+ Person Households | 0 (0.0%) | 0 (0.0%) |
| Total | 305 (59.6%) | 207 (40.4%) |
Female Fertility in Lake Park
Fertility by Age in Lake Park
Average fertility rate in Lake Park is 85.0 births per 1,000 women. Women in the age bracket of 20 to 34 years have the highest fertility rate with 184.0 births per 1,000 women. Women in the age bracket of 20 to 34 years acount for 80.0% of all women with births.
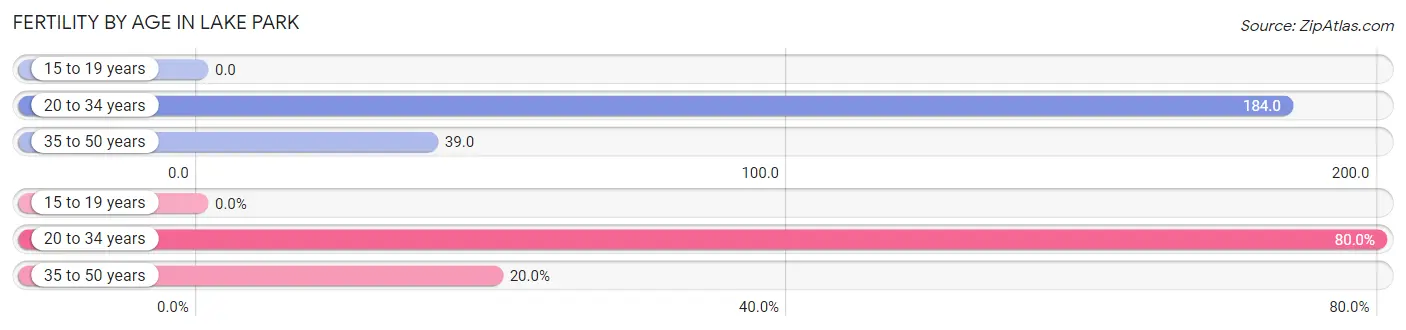
| Age Bracket | Women with Births | Births / 1,000 Women |
| 15 to 19 years | 0 (0.0%) | 0.0 |
| 20 to 34 years | 16 (80.0%) | 184.0 |
| 35 to 50 years | 4 (20.0%) | 39.0 |
| Total | 20 (100.0%) | 85.0 |
Fertility by Age by Marriage Status in Lake Park
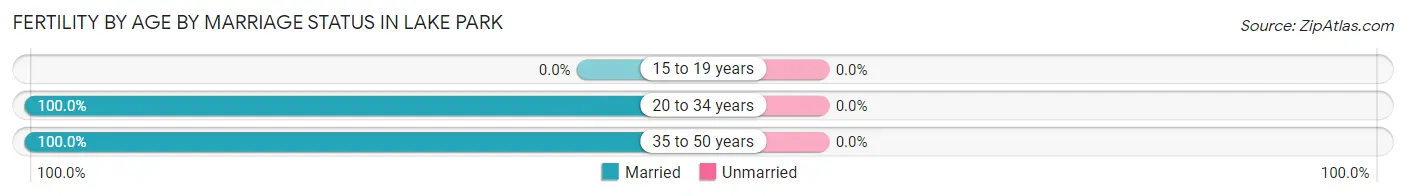
| Age Bracket | Married | Unmarried |
| 15 to 19 years | 0 (0.0%) | 0 (0.0%) |
| 20 to 34 years | 16 (100.0%) | 0 (0.0%) |
| 35 to 50 years | 4 (100.0%) | 0 (0.0%) |
| Total | 20 (100.0%) | 0 (0.0%) |
Fertility by Education in Lake Park
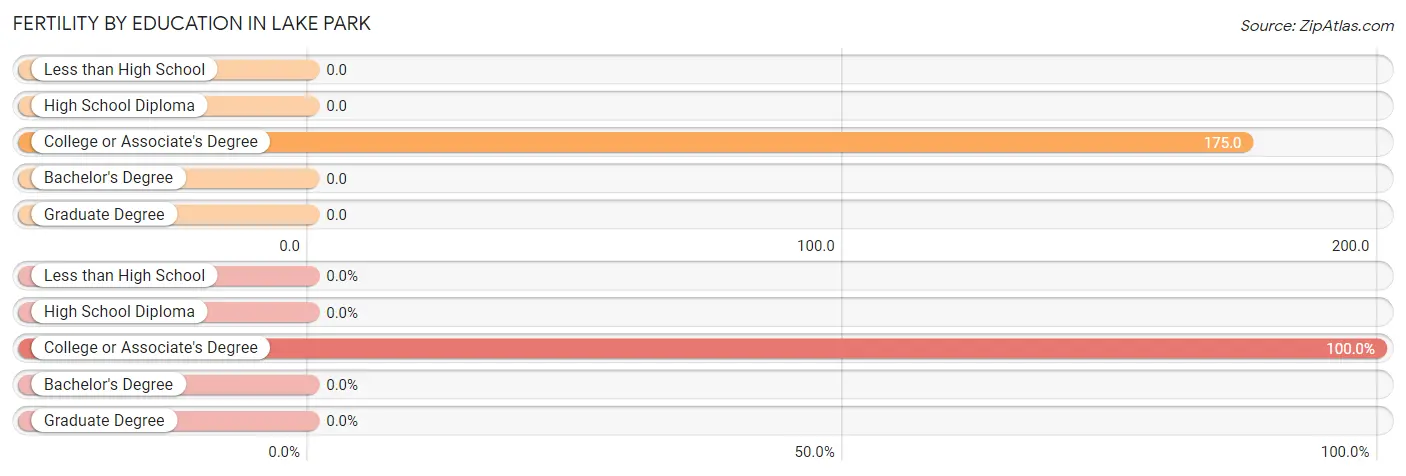
| Educational Attainment | Women with Births | Births / 1,000 Women |
| Less than High School | 0 (0.0%) | 0.0 |
| High School Diploma | 0 (0.0%) | 0.0 |
| College or Associate's Degree | 20 (100.0%) | 175.0 |
| Bachelor's Degree | 0 (0.0%) | 0.0 |
| Graduate Degree | 0 (0.0%) | 0.0 |
| Total | 20 (100.0%) | 85.0 |
Fertility by Education by Marriage Status in Lake Park
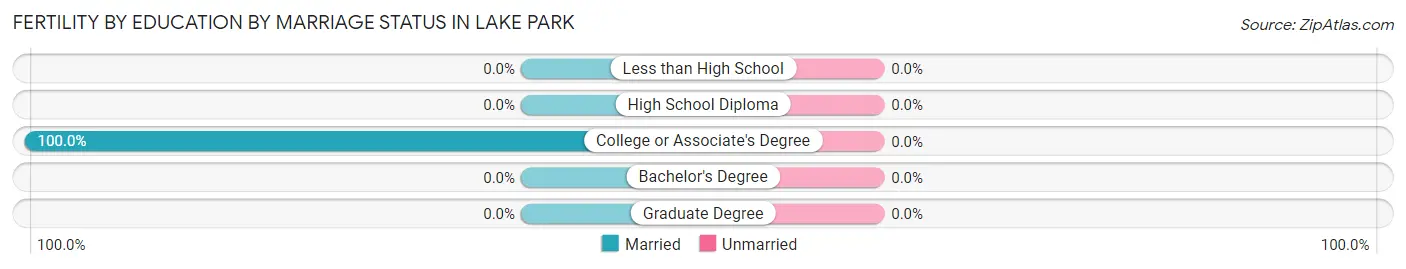
| Educational Attainment | Married | Unmarried |
| Less than High School | 0 (0.0%) | 0 (0.0%) |
| High School Diploma | 0 (0.0%) | 0 (0.0%) |
| College or Associate's Degree | 20 (100.0%) | 0 (0.0%) |
| Bachelor's Degree | 0 (0.0%) | 0 (0.0%) |
| Graduate Degree | 0 (0.0%) | 0 (0.0%) |
| Total | 20 (100.0%) | 0 (0.0%) |
Employment Characteristics in Lake Park
Employment by Class of Employer in Lake Park
Among the 665 employed individuals in Lake Park, private company employees (512 | 77.0%), local government employees (72 | 10.8%), and self-employed (not incorporated) (31 | 4.7%) make up the most common classes of employment.
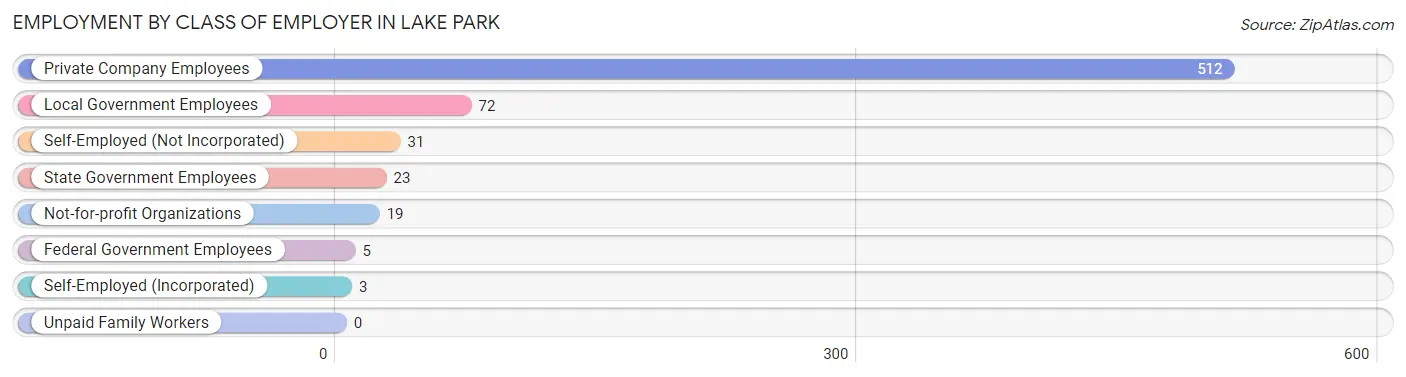
| Employer Class | # Employees | % Employees |
| Private Company Employees | 512 | 77.0% |
| Self-Employed (Incorporated) | 3 | 0.4% |
| Self-Employed (Not Incorporated) | 31 | 4.7% |
| Not-for-profit Organizations | 19 | 2.9% |
| Local Government Employees | 72 | 10.8% |
| State Government Employees | 23 | 3.5% |
| Federal Government Employees | 5 | 0.7% |
| Unpaid Family Workers | 0 | 0.0% |
| Total | 665 | 100.0% |
Employment Status by Age in Lake Park
According to the labor force statistics for Lake Park, out of the total population over 16 years of age (967), 69.6% or 673 individuals are in the labor force, with 0.4% or 3 of them unemployed. The age group with the highest labor force participation rate is 25 to 29 years, with 100.0% or 38 individuals in the labor force. Within the labor force, the 65 to 74 years age range has the highest percentage of unemployed individuals, with 3.8% or 3 of them being unemployed.
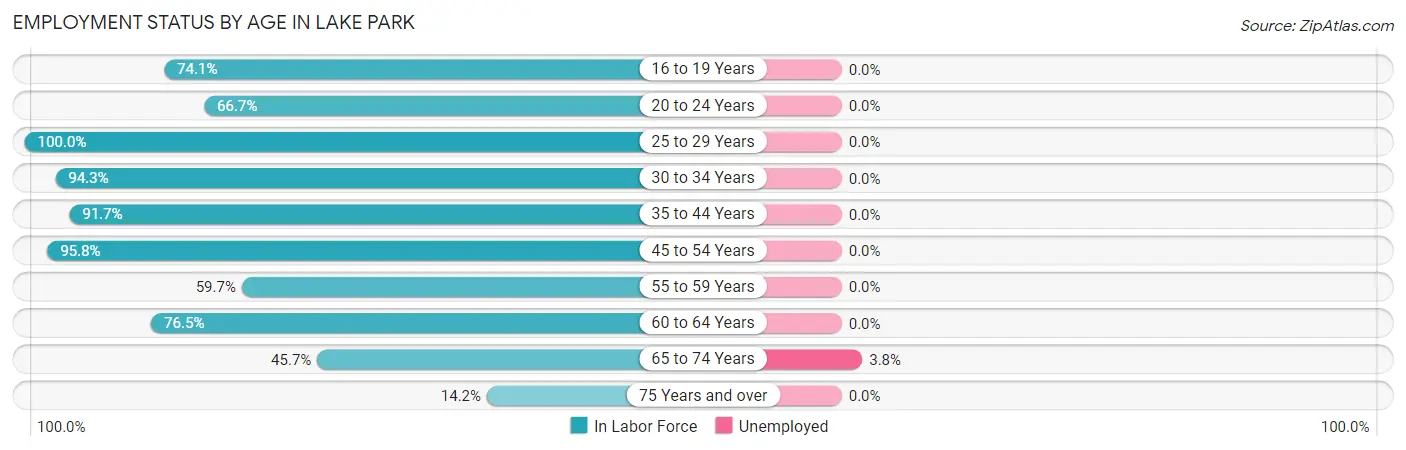
| Age Bracket | In Labor Force | Unemployed |
| 16 to 19 Years | 43 (74.1%) | 0 (0.0%) |
| 20 to 24 Years | 22 (66.7%) | 0 (0.0%) |
| 25 to 29 Years | 38 (100.0%) | 0 (0.0%) |
| 30 to 34 Years | 99 (94.3%) | 0 (0.0%) |
| 35 to 44 Years | 199 (91.7%) | 0 (0.0%) |
| 45 to 54 Years | 91 (95.8%) | 0 (0.0%) |
| 55 to 59 Years | 46 (59.7%) | 0 (0.0%) |
| 60 to 64 Years | 39 (76.5%) | 0 (0.0%) |
| 65 to 74 Years | 79 (45.7%) | 3 (3.8%) |
| 75 Years and over | 17 (14.2%) | 0 (0.0%) |
| Total | 673 (69.6%) | 3 (0.4%) |
Employment Status by Educational Attainment in Lake Park
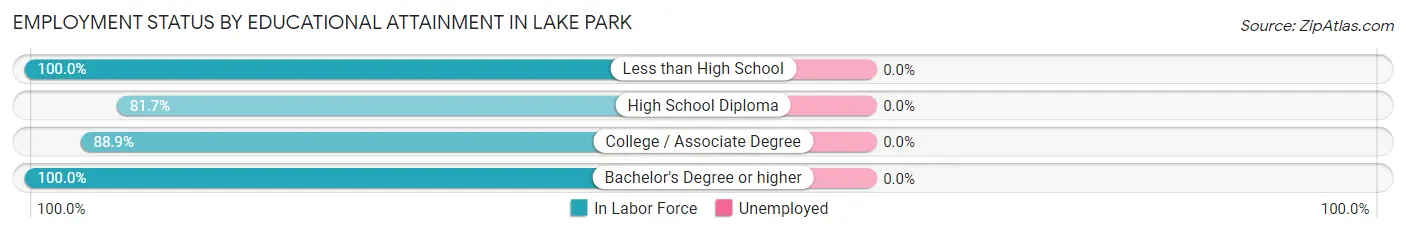
| Educational Attainment | In Labor Force | Unemployed |
| Less than High School | 3 (100.0%) | 0 (0.0%) |
| High School Diploma | 174 (81.7%) | 0 (0.0%) |
| College / Associate Degree | 257 (88.9%) | 0 (0.0%) |
| Bachelor's Degree or higher | 78 (100.0%) | 0 (0.0%) |
| Total | 512 (87.8%) | 0 (0.0%) |
Employment Occupations by Sex in Lake Park
Management, Business, Science and Arts Occupations
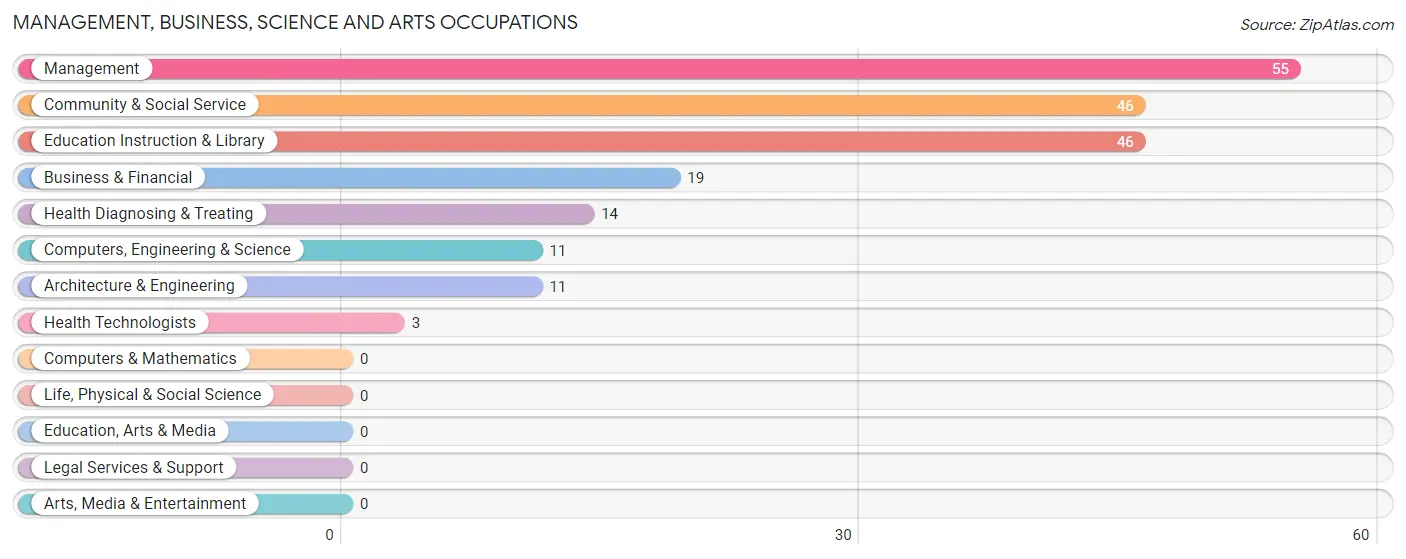
The most common Management, Business, Science and Arts occupations in Lake Park are Management (55 | 8.2%), Community & Social Service (46 | 6.9%), Education Instruction & Library (46 | 6.9%), Business & Financial (19 | 2.8%), and Health Diagnosing & Treating (14 | 2.1%).
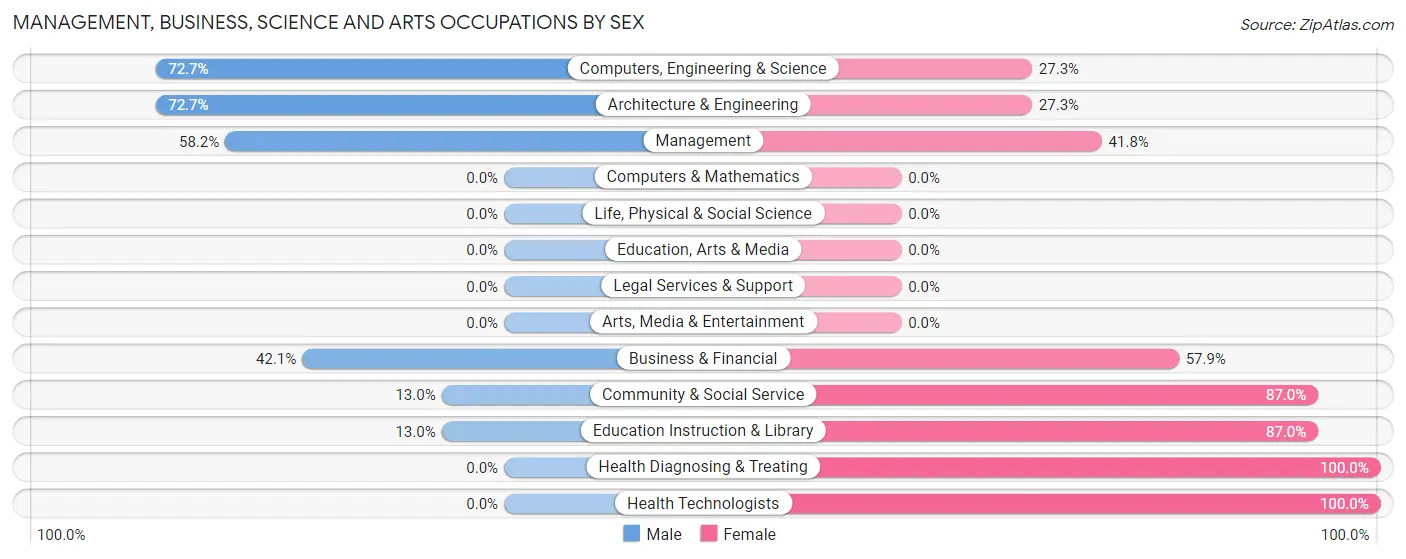
Management, Business, Science and Arts Occupations by Sex
Within the Management, Business, Science and Arts occupations in Lake Park, the most male-oriented occupations are Computers, Engineering & Science (72.7%), Architecture & Engineering (72.7%), and Management (58.2%), while the most female-oriented occupations are Health Diagnosing & Treating (100.0%), Health Technologists (100.0%), and Community & Social Service (87.0%).
| Occupation | Male | Female |
| Management | 32 (58.2%) | 23 (41.8%) |
| Business & Financial | 8 (42.1%) | 11 (57.9%) |
| Computers, Engineering & Science | 8 (72.7%) | 3 (27.3%) |
| Computers & Mathematics | 0 (0.0%) | 0 (0.0%) |
| Architecture & Engineering | 8 (72.7%) | 3 (27.3%) |
| Life, Physical & Social Science | 0 (0.0%) | 0 (0.0%) |
| Community & Social Service | 6 (13.0%) | 40 (87.0%) |
| Education, Arts & Media | 0 (0.0%) | 0 (0.0%) |
| Legal Services & Support | 0 (0.0%) | 0 (0.0%) |
| Education Instruction & Library | 6 (13.0%) | 40 (87.0%) |
| Arts, Media & Entertainment | 0 (0.0%) | 0 (0.0%) |
| Health Diagnosing & Treating | 0 (0.0%) | 14 (100.0%) |
| Health Technologists | 0 (0.0%) | 3 (100.0%) |
| Total (Category) | 54 (37.2%) | 91 (62.8%) |
| Total (Overall) | 377 (56.3%) | 293 (43.7%) |
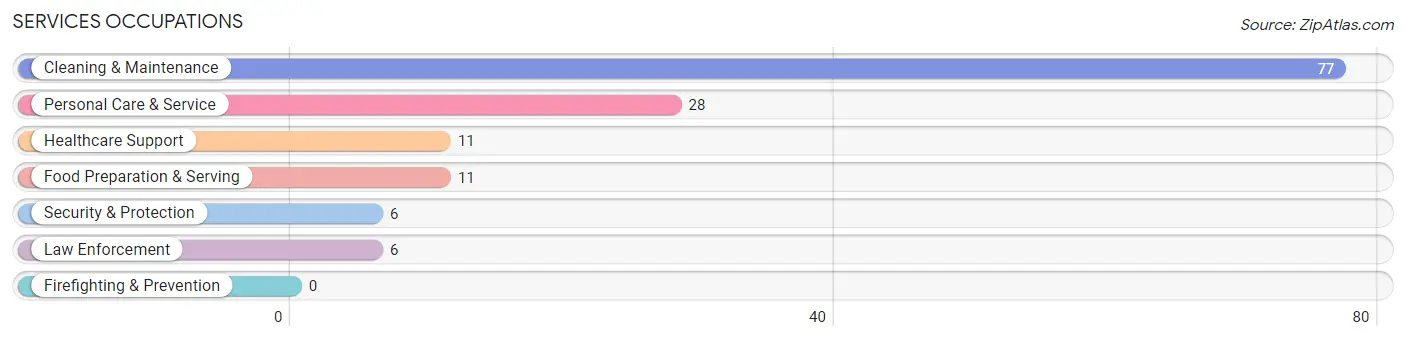
Services Occupations
The most common Services occupations in Lake Park are Cleaning & Maintenance (77 | 11.5%), Personal Care & Service (28 | 4.2%), Healthcare Support (11 | 1.6%), Food Preparation & Serving (11 | 1.6%), and Security & Protection (6 | 0.9%).
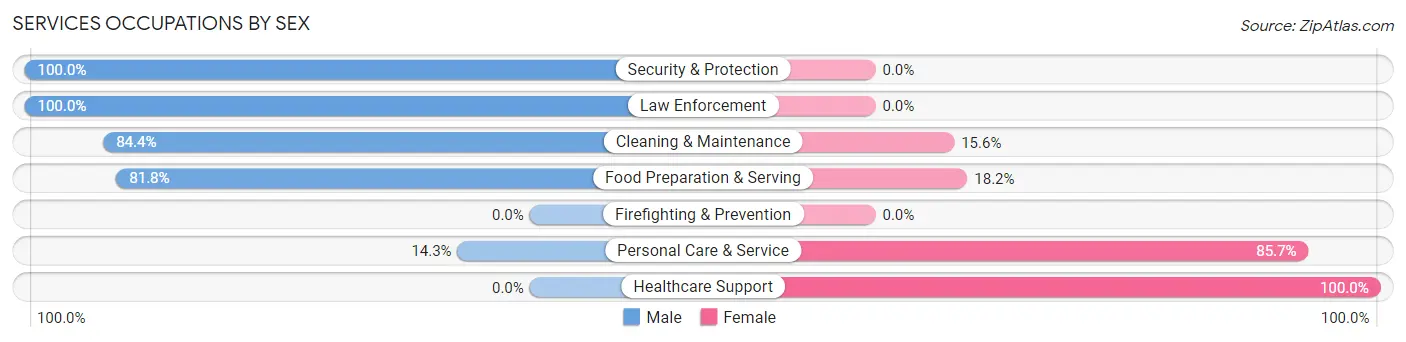
Services Occupations by Sex
Within the Services occupations in Lake Park, the most male-oriented occupations are Security & Protection (100.0%), Law Enforcement (100.0%), and Cleaning & Maintenance (84.4%), while the most female-oriented occupations are Healthcare Support (100.0%), Personal Care & Service (85.7%), and Food Preparation & Serving (18.2%).
| Occupation | Male | Female |
| Healthcare Support | 0 (0.0%) | 11 (100.0%) |
| Security & Protection | 6 (100.0%) | 0 (0.0%) |
| Firefighting & Prevention | 0 (0.0%) | 0 (0.0%) |
| Law Enforcement | 6 (100.0%) | 0 (0.0%) |
| Food Preparation & Serving | 9 (81.8%) | 2 (18.2%) |
| Cleaning & Maintenance | 65 (84.4%) | 12 (15.6%) |
| Personal Care & Service | 4 (14.3%) | 24 (85.7%) |
| Total (Category) | 84 (63.2%) | 49 (36.8%) |
| Total (Overall) | 377 (56.3%) | 293 (43.7%) |
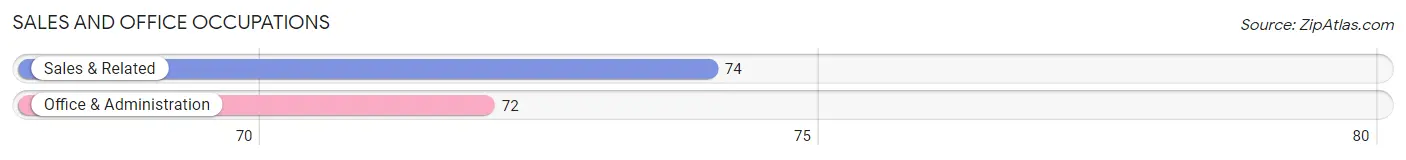
Sales and Office Occupations
The most common Sales and Office occupations in Lake Park are Sales & Related (74 | 11.0%), and Office & Administration (72 | 10.7%).
Sales and Office Occupations by Sex
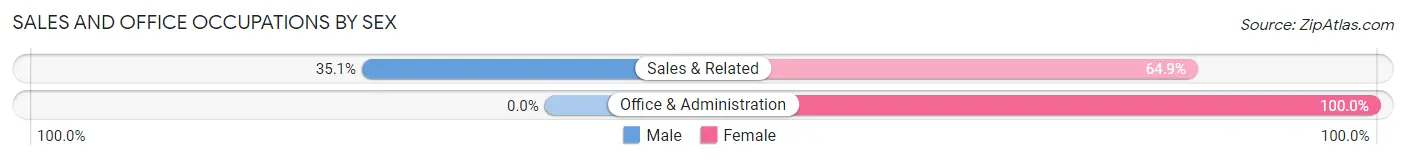
| Occupation | Male | Female |
| Sales & Related | 26 (35.1%) | 48 (64.9%) |
| Office & Administration | 0 (0.0%) | 72 (100.0%) |
| Total (Category) | 26 (17.8%) | 120 (82.2%) |
| Total (Overall) | 377 (56.3%) | 293 (43.7%) |
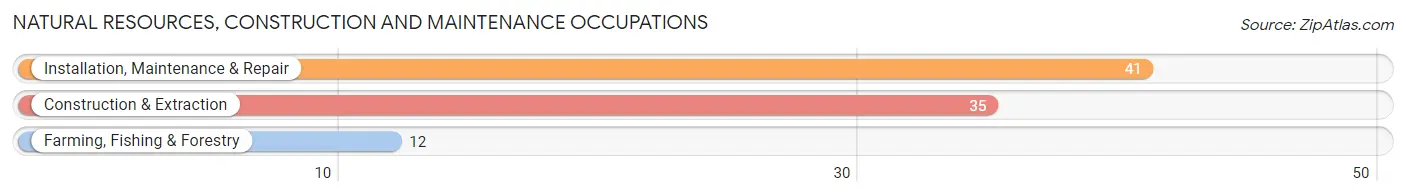
Natural Resources, Construction and Maintenance Occupations
The most common Natural Resources, Construction and Maintenance occupations in Lake Park are Installation, Maintenance & Repair (41 | 6.1%), Construction & Extraction (35 | 5.2%), and Farming, Fishing & Forestry (12 | 1.8%).
Natural Resources, Construction and Maintenance Occupations by Sex
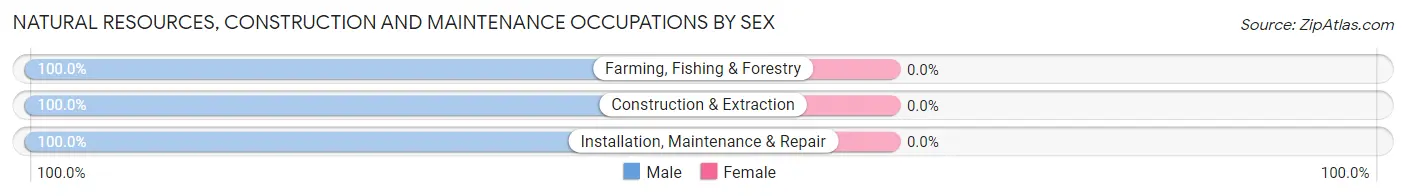
| Occupation | Male | Female |
| Farming, Fishing & Forestry | 12 (100.0%) | 0 (0.0%) |
| Construction & Extraction | 35 (100.0%) | 0 (0.0%) |
| Installation, Maintenance & Repair | 41 (100.0%) | 0 (0.0%) |
| Total (Category) | 88 (100.0%) | 0 (0.0%) |
| Total (Overall) | 377 (56.3%) | 293 (43.7%) |
Production, Transportation and Moving Occupations
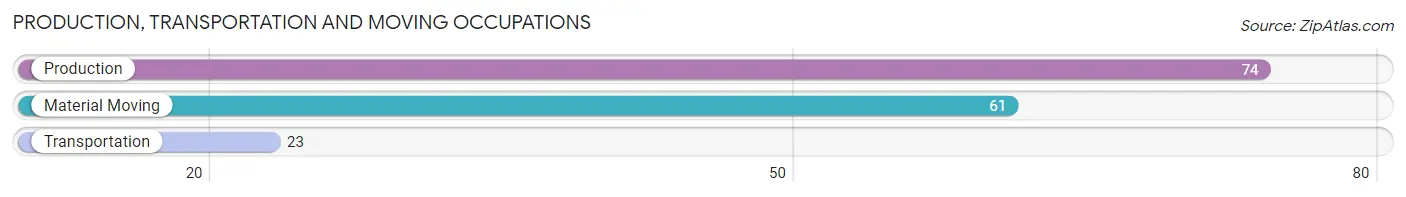
The most common Production, Transportation and Moving occupations in Lake Park are Production (74 | 11.0%), Material Moving (61 | 9.1%), and Transportation (23 | 3.4%).
Production, Transportation and Moving Occupations by Sex
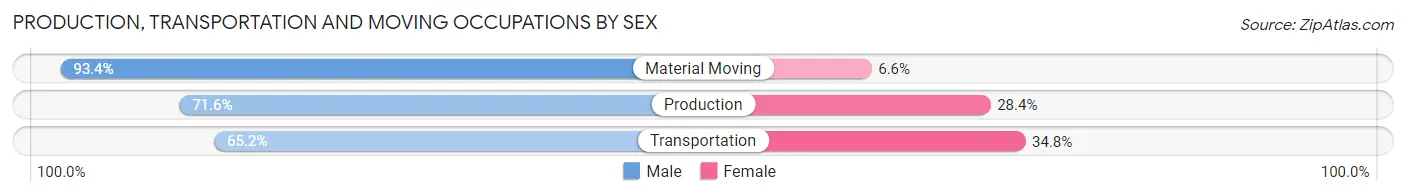
| Occupation | Male | Female |
| Production | 53 (71.6%) | 21 (28.4%) |
| Transportation | 15 (65.2%) | 8 (34.8%) |
| Material Moving | 57 (93.4%) | 4 (6.6%) |
| Total (Category) | 125 (79.1%) | 33 (20.9%) |
| Total (Overall) | 377 (56.3%) | 293 (43.7%) |
Employment Industries by Sex in Lake Park
Employment Industries in Lake Park
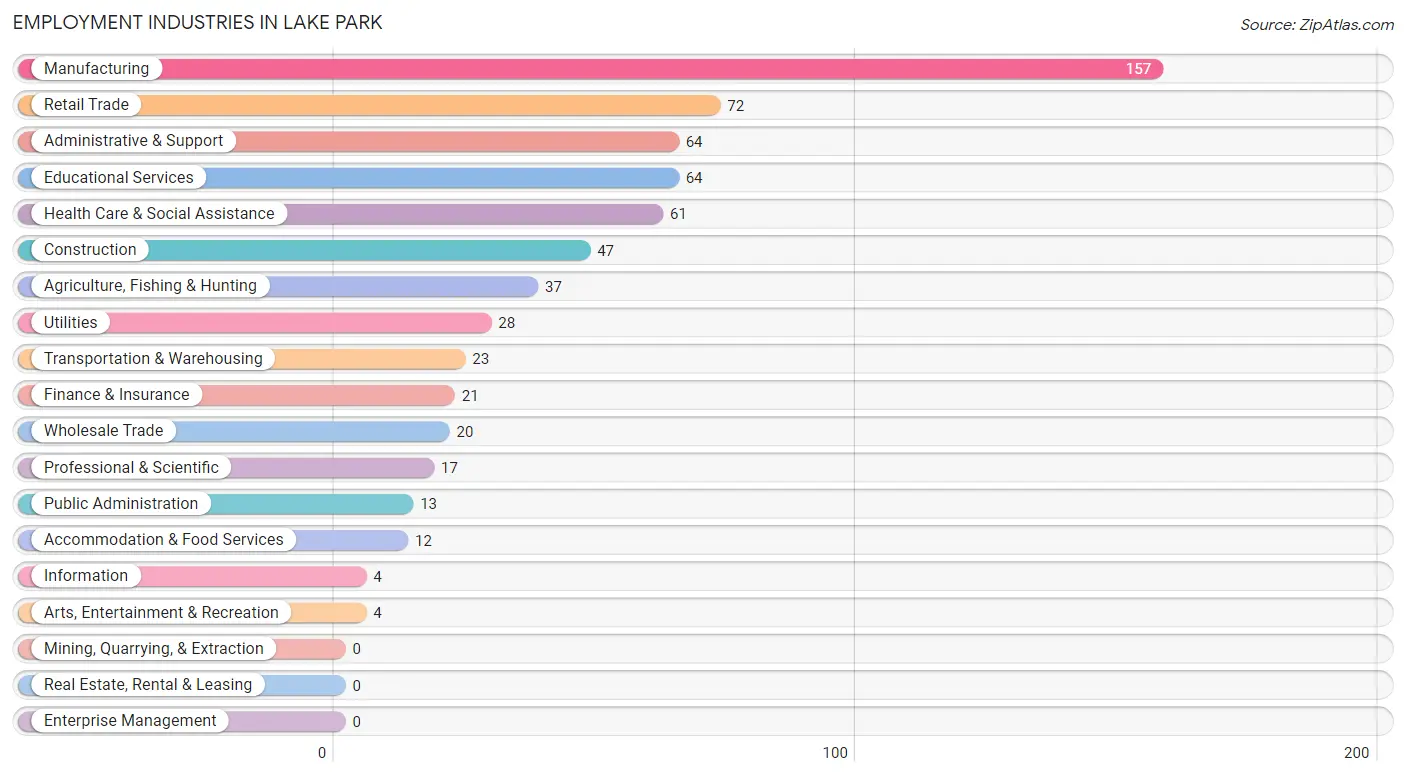
The major employment industries in Lake Park include Manufacturing (157 | 23.4%), Retail Trade (72 | 10.7%), Administrative & Support (64 | 9.6%), Educational Services (64 | 9.6%), and Health Care & Social Assistance (61 | 9.1%).
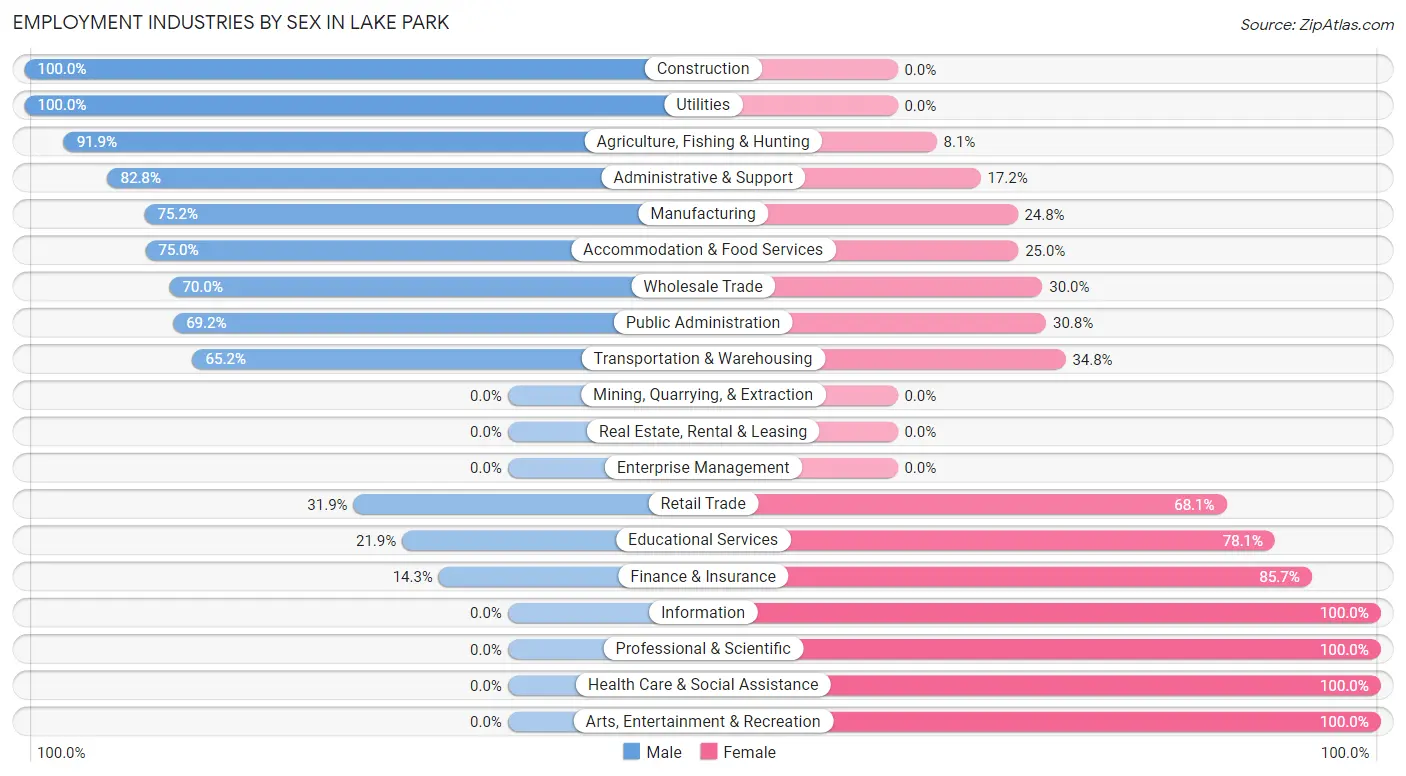
Employment Industries by Sex in Lake Park
The Lake Park industries that see more men than women are Construction (100.0%), Utilities (100.0%), and Agriculture, Fishing & Hunting (91.9%), whereas the industries that tend to have a higher number of women are Information (100.0%), Professional & Scientific (100.0%), and Health Care & Social Assistance (100.0%).
| Industry | Male | Female |
| Agriculture, Fishing & Hunting | 34 (91.9%) | 3 (8.1%) |
| Mining, Quarrying, & Extraction | 0 (0.0%) | 0 (0.0%) |
| Construction | 47 (100.0%) | 0 (0.0%) |
| Manufacturing | 118 (75.2%) | 39 (24.8%) |
| Wholesale Trade | 14 (70.0%) | 6 (30.0%) |
| Retail Trade | 23 (31.9%) | 49 (68.1%) |
| Transportation & Warehousing | 15 (65.2%) | 8 (34.8%) |
| Utilities | 28 (100.0%) | 0 (0.0%) |
| Information | 0 (0.0%) | 4 (100.0%) |
| Finance & Insurance | 3 (14.3%) | 18 (85.7%) |
| Real Estate, Rental & Leasing | 0 (0.0%) | 0 (0.0%) |
| Professional & Scientific | 0 (0.0%) | 17 (100.0%) |
| Enterprise Management | 0 (0.0%) | 0 (0.0%) |
| Administrative & Support | 53 (82.8%) | 11 (17.2%) |
| Educational Services | 14 (21.9%) | 50 (78.1%) |
| Health Care & Social Assistance | 0 (0.0%) | 61 (100.0%) |
| Arts, Entertainment & Recreation | 0 (0.0%) | 4 (100.0%) |
| Accommodation & Food Services | 9 (75.0%) | 3 (25.0%) |
| Public Administration | 9 (69.2%) | 4 (30.8%) |
| Total | 377 (56.3%) | 293 (43.7%) |
Education in Lake Park
School Enrollment in Lake Park
The most common levels of schooling among the 221 students in Lake Park are elementary school (62 | 28.1%), high school (59 | 26.7%), and middle school (54 | 24.4%).
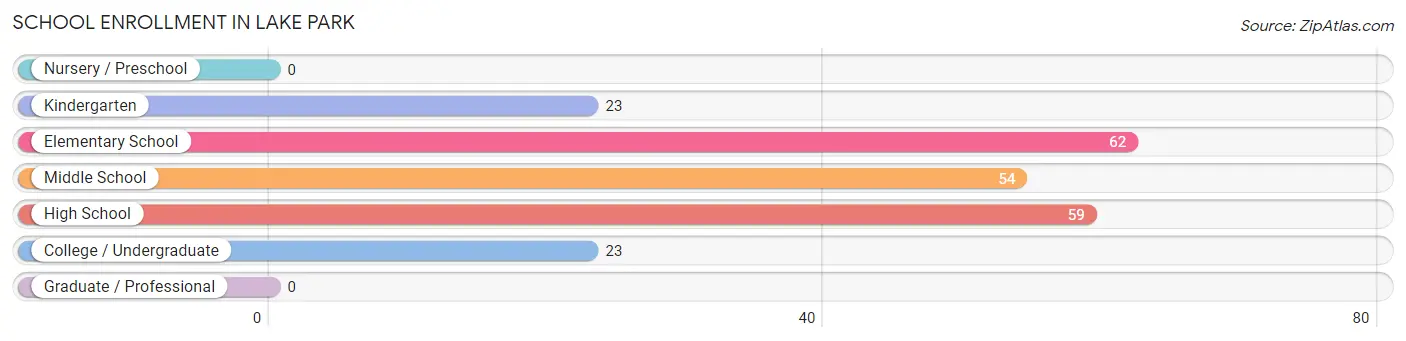
| School Level | # Students | % Students |
| Nursery / Preschool | 0 | 0.0% |
| Kindergarten | 23 | 10.4% |
| Elementary School | 62 | 28.1% |
| Middle School | 54 | 24.4% |
| High School | 59 | 26.7% |
| College / Undergraduate | 23 | 10.4% |
| Graduate / Professional | 0 | 0.0% |
| Total | 221 | 100.0% |
School Enrollment by Age by Funding Source in Lake Park
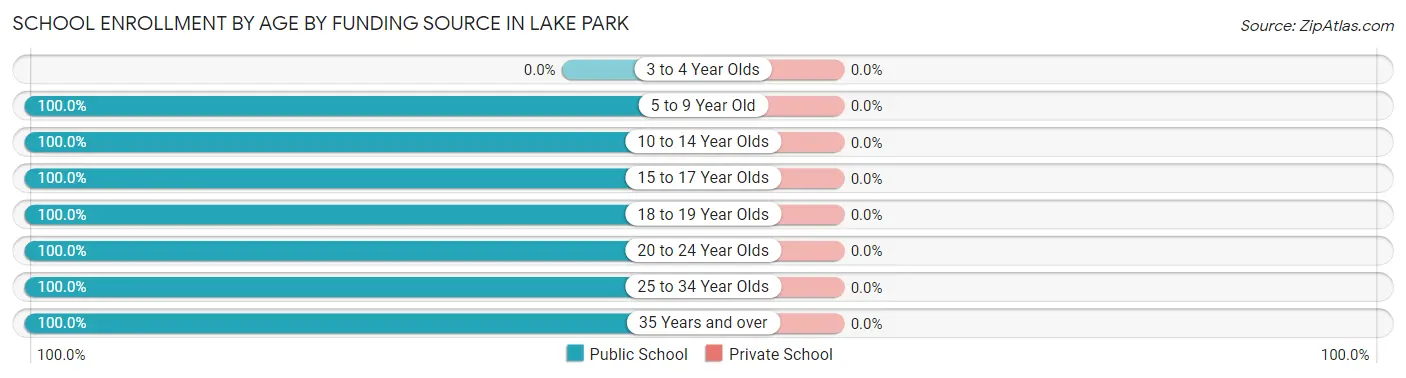
| Age Bracket | Public School | Private School |
| 3 to 4 Year Olds | 0 (0.0%) | 0 (0.0%) |
| 5 to 9 Year Old | 82 (100.0%) | 0 (0.0%) |
| 10 to 14 Year Olds | 60 (100.0%) | 0 (0.0%) |
| 15 to 17 Year Olds | 50 (100.0%) | 0 (0.0%) |
| 18 to 19 Year Olds | 14 (100.0%) | 0 (0.0%) |
| 20 to 24 Year Olds | 5 (100.0%) | 0 (0.0%) |
| 25 to 34 Year Olds | 7 (100.0%) | 0 (0.0%) |
| 35 Years and over | 3 (100.0%) | 0 (0.0%) |
| Total | 221 (100.0%) | 0 (0.0%) |
Educational Attainment by Field of Study in Lake Park
Education (44 | 34.4%), business (32 | 25.0%), science & technology (17 | 13.3%), computers & mathematics (9 | 7.0%), and visual & performing arts (8 | 6.2%) are the most common fields of study among 128 individuals in Lake Park who have obtained a bachelor's degree or higher.
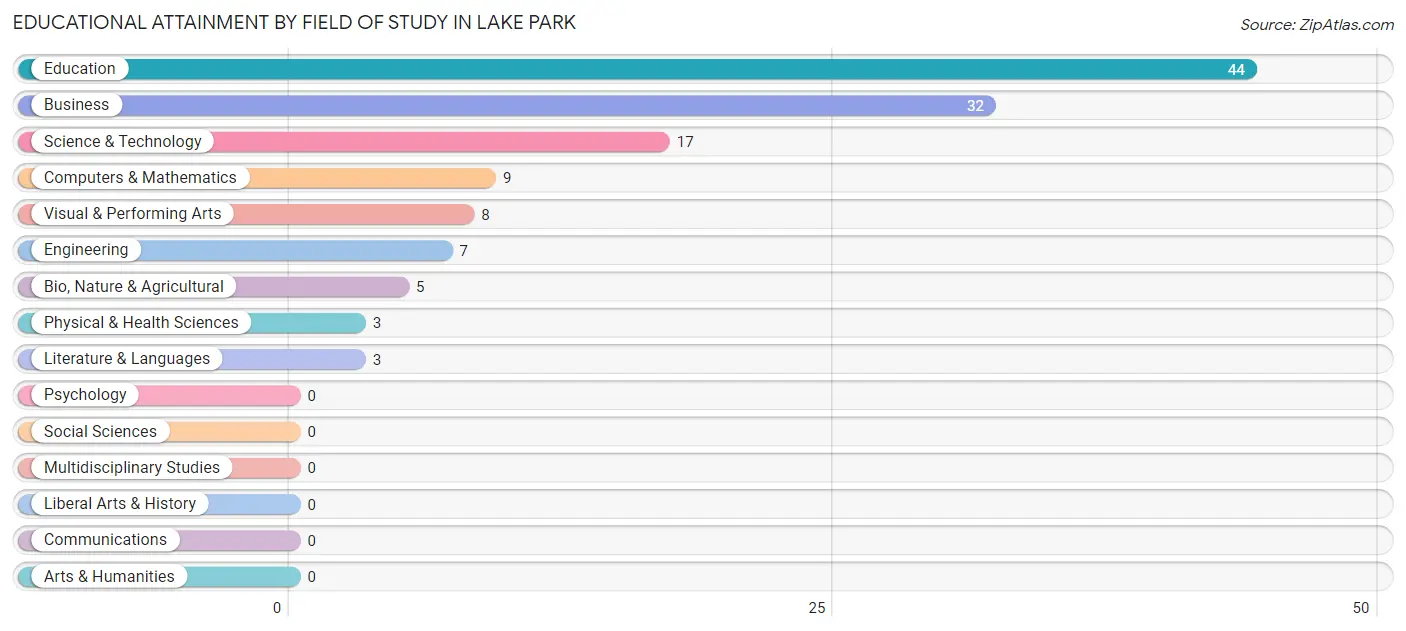
| Field of Study | # Graduates | % Graduates |
| Computers & Mathematics | 9 | 7.0% |
| Bio, Nature & Agricultural | 5 | 3.9% |
| Physical & Health Sciences | 3 | 2.3% |
| Psychology | 0 | 0.0% |
| Social Sciences | 0 | 0.0% |
| Engineering | 7 | 5.5% |
| Multidisciplinary Studies | 0 | 0.0% |
| Science & Technology | 17 | 13.3% |
| Business | 32 | 25.0% |
| Education | 44 | 34.4% |
| Literature & Languages | 3 | 2.3% |
| Liberal Arts & History | 0 | 0.0% |
| Visual & Performing Arts | 8 | 6.2% |
| Communications | 0 | 0.0% |
| Arts & Humanities | 0 | 0.0% |
| Total | 128 | 100.0% |
Transportation & Commute in Lake Park
Vehicle Availability by Sex in Lake Park
The most prevalent vehicle ownership categories in Lake Park are males with 2 vehicles (166, accounting for 44.6%) and females with 2 vehicles (132, making up 56.7%).
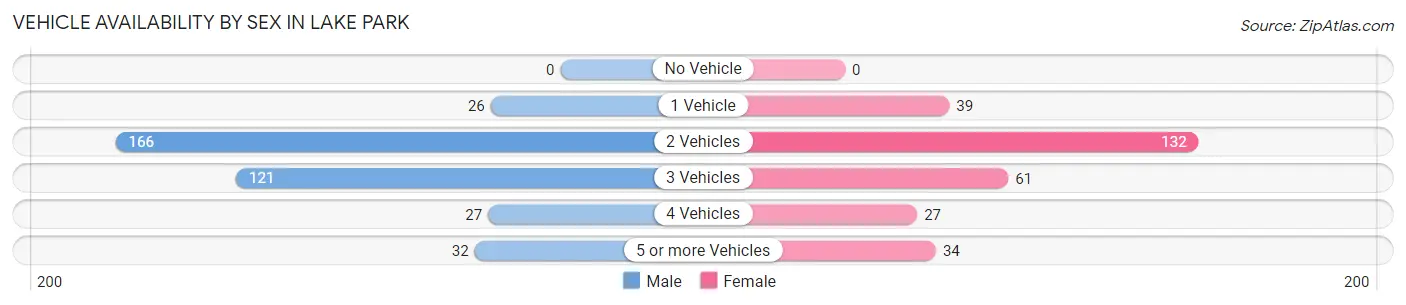
| Vehicles Available | Male | Female |
| No Vehicle | 0 (0.0%) | 0 (0.0%) |
| 1 Vehicle | 26 (7.0%) | 39 (13.3%) |
| 2 Vehicles | 166 (44.6%) | 132 (45.1%) |
| 3 Vehicles | 121 (32.5%) | 61 (20.8%) |
| 4 Vehicles | 27 (7.3%) | 27 (9.2%) |
| 5 or more Vehicles | 32 (8.6%) | 34 (11.6%) |
| Total | 372 (100.0%) | 293 (100.0%) |
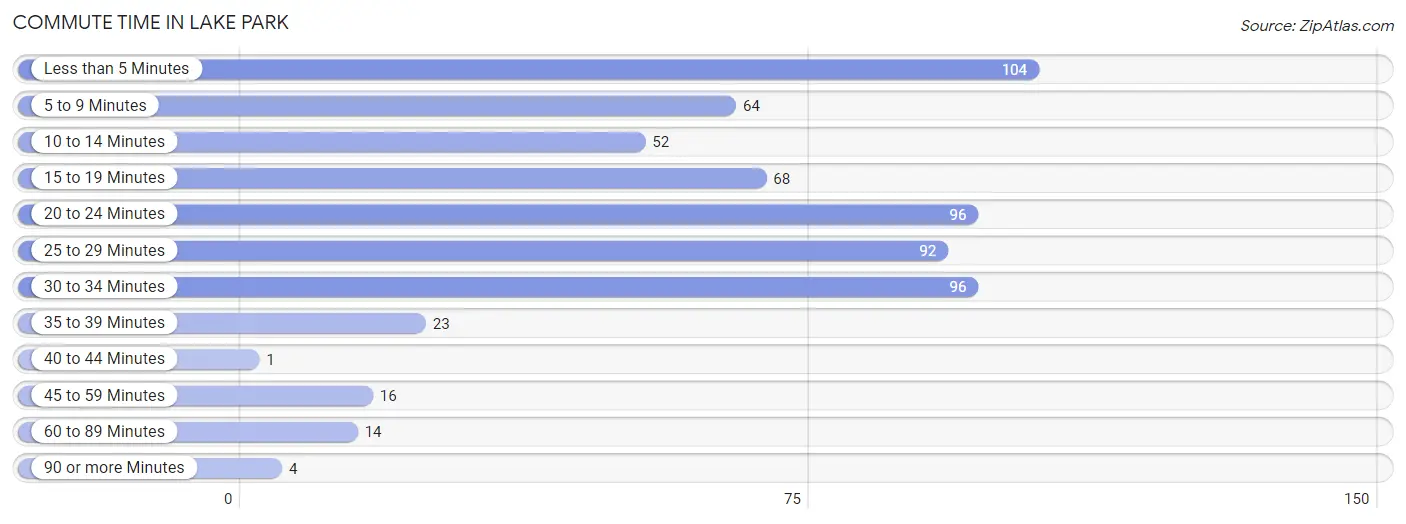
Commute Time in Lake Park
The most frequently occuring commute durations in Lake Park are less than 5 minutes (104 commuters, 16.5%), 20 to 24 minutes (96 commuters, 15.2%), and 30 to 34 minutes (96 commuters, 15.2%).
| Commute Time | # Commuters | % Commuters |
| Less than 5 Minutes | 104 | 16.5% |
| 5 to 9 Minutes | 64 | 10.2% |
| 10 to 14 Minutes | 52 | 8.3% |
| 15 to 19 Minutes | 68 | 10.8% |
| 20 to 24 Minutes | 96 | 15.2% |
| 25 to 29 Minutes | 92 | 14.6% |
| 30 to 34 Minutes | 96 | 15.2% |
| 35 to 39 Minutes | 23 | 3.6% |
| 40 to 44 Minutes | 1 | 0.2% |
| 45 to 59 Minutes | 16 | 2.5% |
| 60 to 89 Minutes | 14 | 2.2% |
| 90 or more Minutes | 4 | 0.6% |
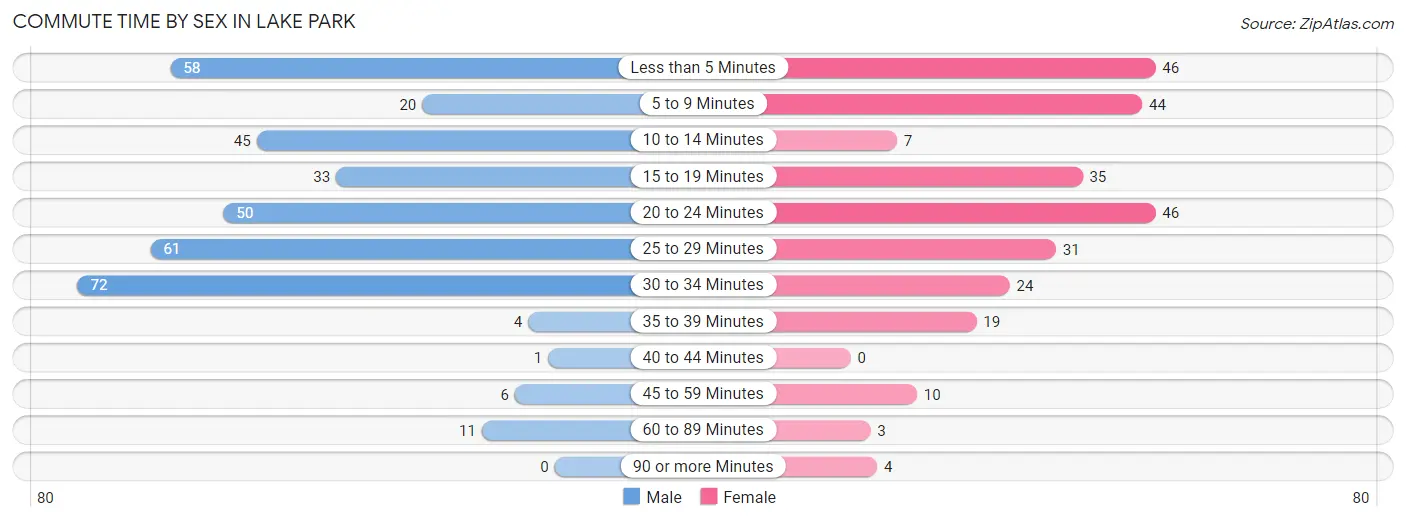
Commute Time by Sex in Lake Park
The most common commute times in Lake Park are 30 to 34 minutes (72 commuters, 19.9%) for males and less than 5 minutes (46 commuters, 17.1%) for females.
| Commute Time | Male | Female |
| Less than 5 Minutes | 58 (16.1%) | 46 (17.1%) |
| 5 to 9 Minutes | 20 (5.5%) | 44 (16.4%) |
| 10 to 14 Minutes | 45 (12.5%) | 7 (2.6%) |
| 15 to 19 Minutes | 33 (9.1%) | 35 (13.0%) |
| 20 to 24 Minutes | 50 (13.9%) | 46 (17.1%) |
| 25 to 29 Minutes | 61 (16.9%) | 31 (11.5%) |
| 30 to 34 Minutes | 72 (19.9%) | 24 (8.9%) |
| 35 to 39 Minutes | 4 (1.1%) | 19 (7.1%) |
| 40 to 44 Minutes | 1 (0.3%) | 0 (0.0%) |
| 45 to 59 Minutes | 6 (1.7%) | 10 (3.7%) |
| 60 to 89 Minutes | 11 (3.0%) | 3 (1.1%) |
| 90 or more Minutes | 0 (0.0%) | 4 (1.5%) |
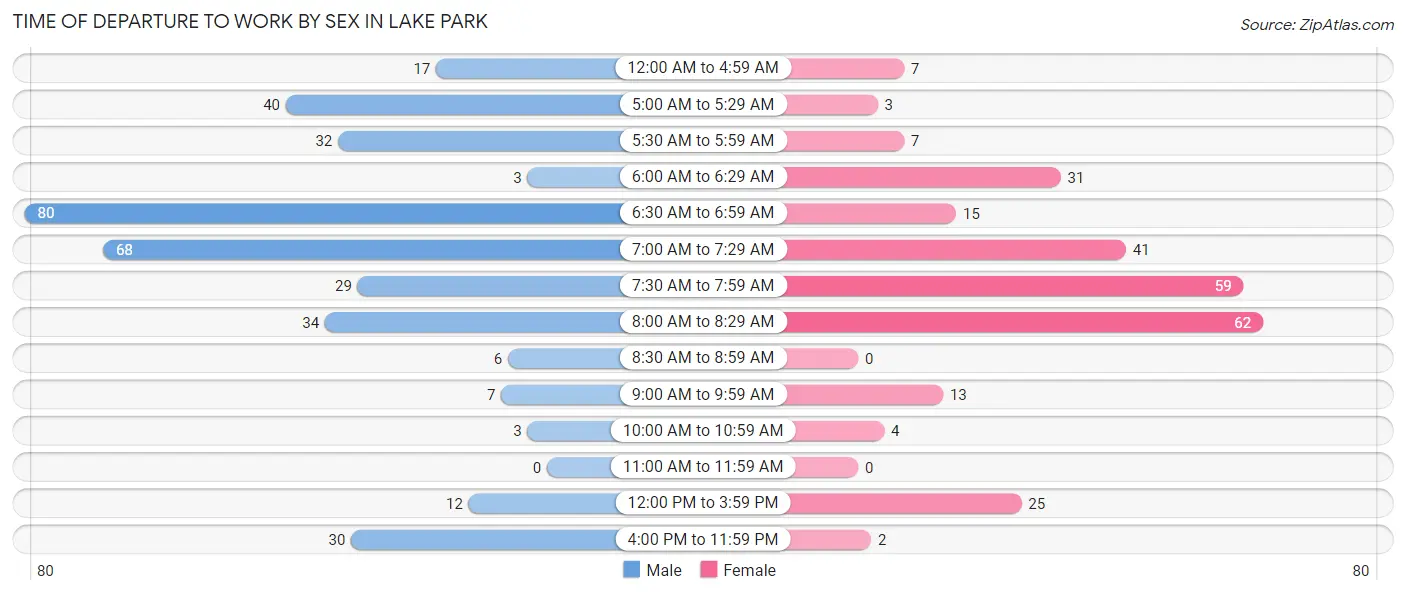
Time of Departure to Work by Sex in Lake Park
The most frequent times of departure to work in Lake Park are 6:30 AM to 6:59 AM (80, 22.2%) for males and 8:00 AM to 8:29 AM (62, 23.1%) for females.
| Time of Departure | Male | Female |
| 12:00 AM to 4:59 AM | 17 (4.7%) | 7 (2.6%) |
| 5:00 AM to 5:29 AM | 40 (11.1%) | 3 (1.1%) |
| 5:30 AM to 5:59 AM | 32 (8.9%) | 7 (2.6%) |
| 6:00 AM to 6:29 AM | 3 (0.8%) | 31 (11.5%) |
| 6:30 AM to 6:59 AM | 80 (22.2%) | 15 (5.6%) |
| 7:00 AM to 7:29 AM | 68 (18.8%) | 41 (15.2%) |
| 7:30 AM to 7:59 AM | 29 (8.0%) | 59 (21.9%) |
| 8:00 AM to 8:29 AM | 34 (9.4%) | 62 (23.1%) |
| 8:30 AM to 8:59 AM | 6 (1.7%) | 0 (0.0%) |
| 9:00 AM to 9:59 AM | 7 (1.9%) | 13 (4.8%) |
| 10:00 AM to 10:59 AM | 3 (0.8%) | 4 (1.5%) |
| 11:00 AM to 11:59 AM | 0 (0.0%) | 0 (0.0%) |
| 12:00 PM to 3:59 PM | 12 (3.3%) | 25 (9.3%) |
| 4:00 PM to 11:59 PM | 30 (8.3%) | 2 (0.7%) |
| Total | 361 (100.0%) | 269 (100.0%) |
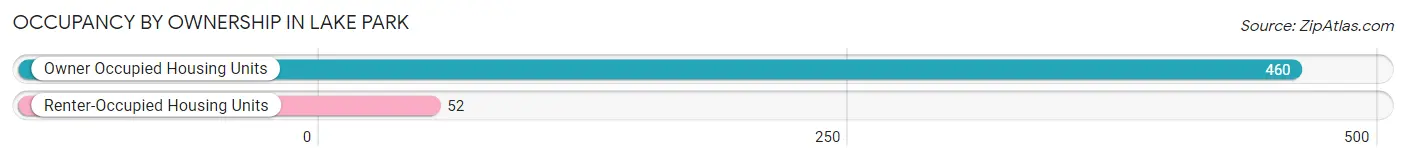
Housing Occupancy in Lake Park
Occupancy by Ownership in Lake Park
Of the total 512 dwellings in Lake Park, owner-occupied units account for 460 (89.8%), while renter-occupied units make up 52 (10.2%).
| Occupancy | # Housing Units | % Housing Units |
| Owner Occupied Housing Units | 460 | 89.8% |
| Renter-Occupied Housing Units | 52 | 10.2% |
| Total Occupied Housing Units | 512 | 100.0% |
Occupancy by Household Size in Lake Park
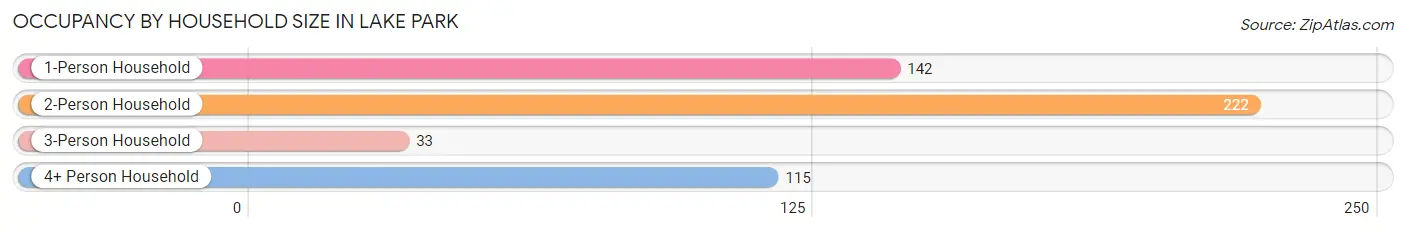
| Household Size | # Housing Units | % Housing Units |
| 1-Person Household | 142 | 27.7% |
| 2-Person Household | 222 | 43.4% |
| 3-Person Household | 33 | 6.5% |
| 4+ Person Household | 115 | 22.5% |
| Total Housing Units | 512 | 100.0% |
Occupancy by Ownership by Household Size in Lake Park
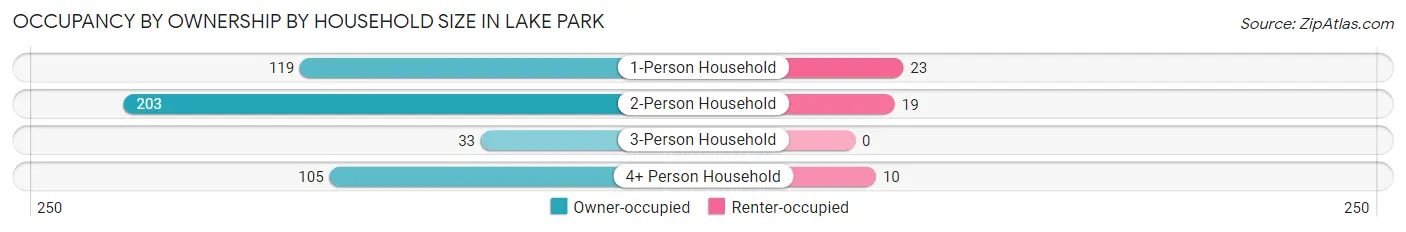
| Household Size | Owner-occupied | Renter-occupied |
| 1-Person Household | 119 (83.8%) | 23 (16.2%) |
| 2-Person Household | 203 (91.4%) | 19 (8.6%) |
| 3-Person Household | 33 (100.0%) | 0 (0.0%) |
| 4+ Person Household | 105 (91.3%) | 10 (8.7%) |
| Total Housing Units | 460 (89.8%) | 52 (10.2%) |
Occupancy by Educational Attainment in Lake Park
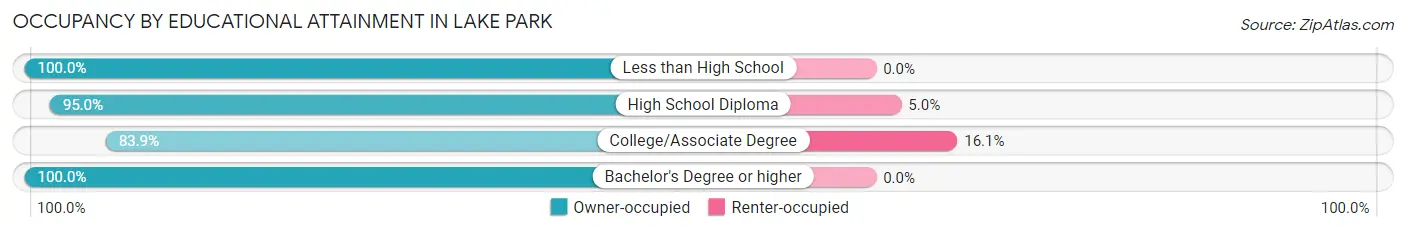
| Household Size | Owner-occupied | Renter-occupied |
| Less than High School | 3 (100.0%) | 0 (0.0%) |
| High School Diploma | 190 (95.0%) | 10 (5.0%) |
| College/Associate Degree | 219 (83.9%) | 42 (16.1%) |
| Bachelor's Degree or higher | 48 (100.0%) | 0 (0.0%) |
Occupancy by Age of Householder in Lake Park
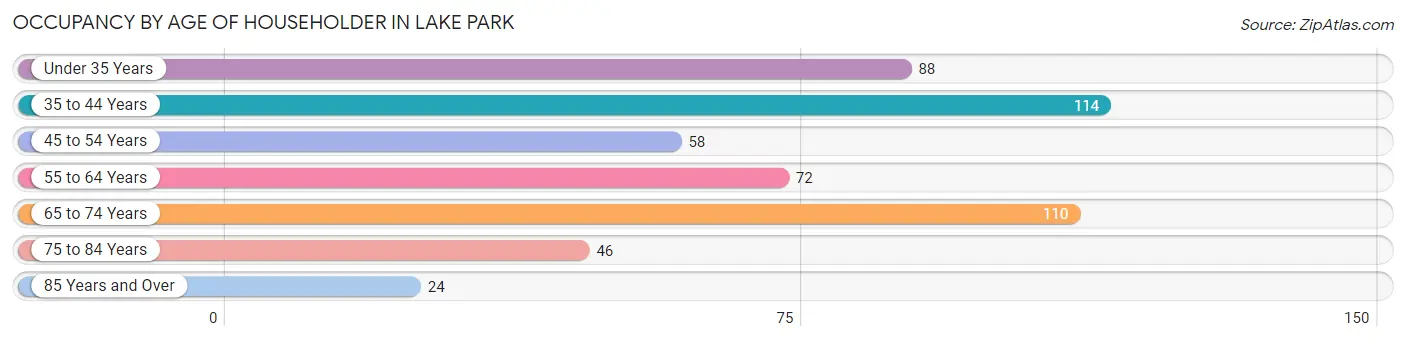
| Age Bracket | # Households | % Households |
| Under 35 Years | 88 | 17.2% |
| 35 to 44 Years | 114 | 22.3% |
| 45 to 54 Years | 58 | 11.3% |
| 55 to 64 Years | 72 | 14.1% |
| 65 to 74 Years | 110 | 21.5% |
| 75 to 84 Years | 46 | 9.0% |
| 85 Years and Over | 24 | 4.7% |
| Total | 512 | 100.0% |
Housing Finances in Lake Park
Median Income by Occupancy in Lake Park
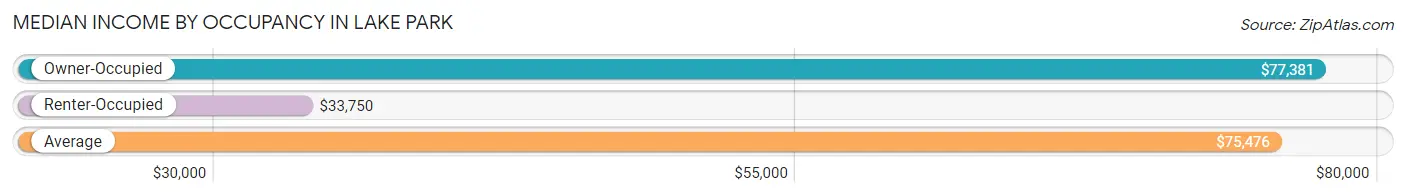
| Occupancy Type | # Households | Median Income |
| Owner-Occupied | 460 (89.8%) | $77,381 |
| Renter-Occupied | 52 (10.2%) | $33,750 |
| Average | 512 (100.0%) | $75,476 |
Occupancy by Householder Income Bracket in Lake Park
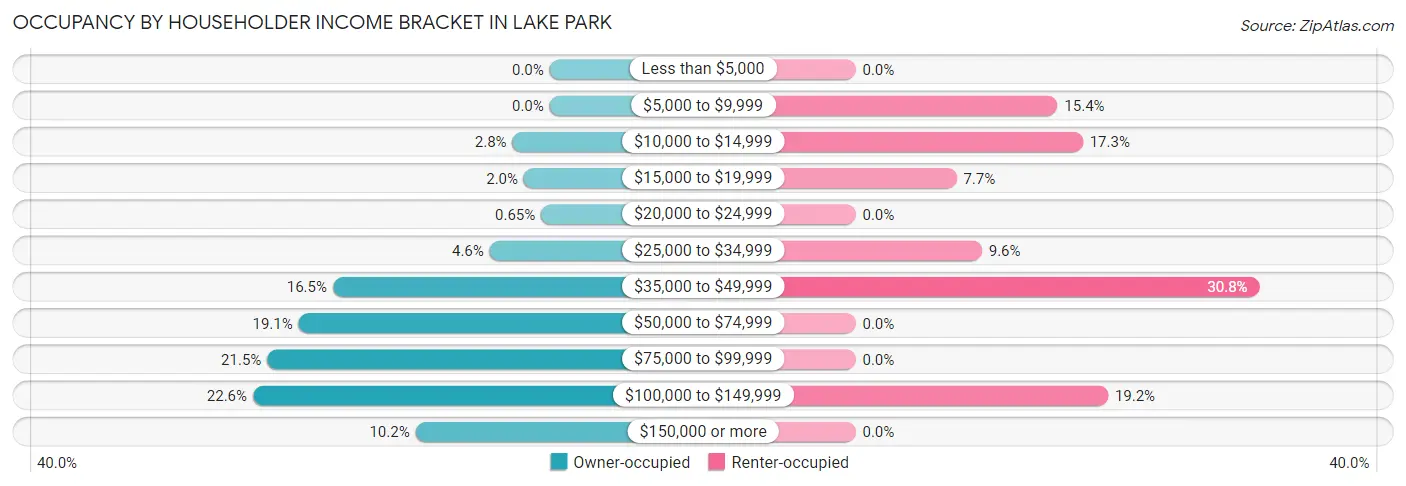
| Income Bracket | Owner-occupied | Renter-occupied |
| Less than $5,000 | 0 (0.0%) | 0 (0.0%) |
| $5,000 to $9,999 | 0 (0.0%) | 8 (15.4%) |
| $10,000 to $14,999 | 13 (2.8%) | 9 (17.3%) |
| $15,000 to $19,999 | 9 (2.0%) | 4 (7.7%) |
| $20,000 to $24,999 | 3 (0.6%) | 0 (0.0%) |
| $25,000 to $34,999 | 21 (4.6%) | 5 (9.6%) |
| $35,000 to $49,999 | 76 (16.5%) | 16 (30.8%) |
| $50,000 to $74,999 | 88 (19.1%) | 0 (0.0%) |
| $75,000 to $99,999 | 99 (21.5%) | 0 (0.0%) |
| $100,000 to $149,999 | 104 (22.6%) | 10 (19.2%) |
| $150,000 or more | 47 (10.2%) | 0 (0.0%) |
| Total | 460 (100.0%) | 52 (100.0%) |
Monthly Housing Cost Tiers in Lake Park
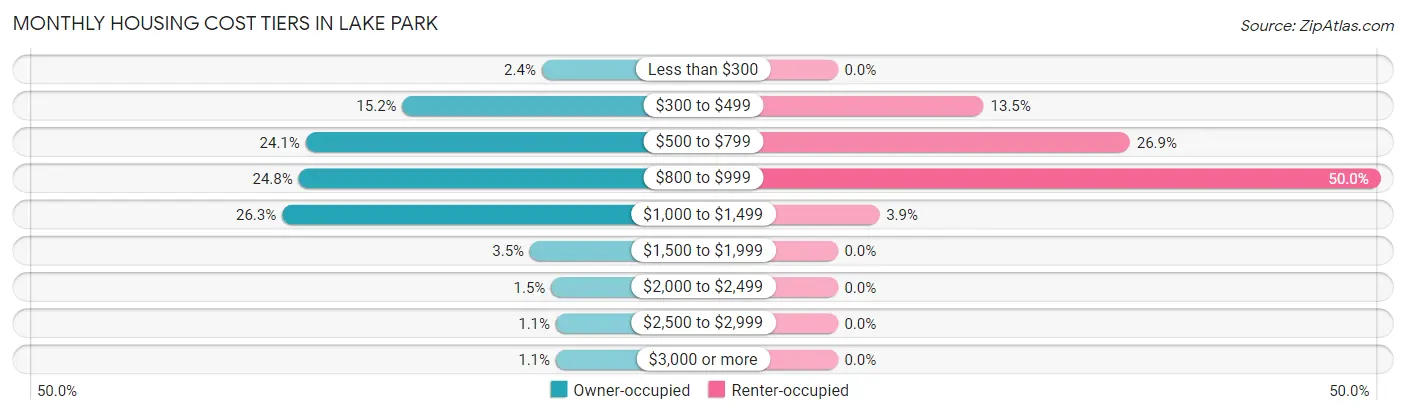
| Monthly Cost | Owner-occupied | Renter-occupied |
| Less than $300 | 11 (2.4%) | 0 (0.0%) |
| $300 to $499 | 70 (15.2%) | 7 (13.5%) |
| $500 to $799 | 111 (24.1%) | 14 (26.9%) |
| $800 to $999 | 114 (24.8%) | 26 (50.0%) |
| $1,000 to $1,499 | 121 (26.3%) | 2 (3.8%) |
| $1,500 to $1,999 | 16 (3.5%) | 0 (0.0%) |
| $2,000 to $2,499 | 7 (1.5%) | 0 (0.0%) |
| $2,500 to $2,999 | 5 (1.1%) | 0 (0.0%) |
| $3,000 or more | 5 (1.1%) | 0 (0.0%) |
| Total | 460 (100.0%) | 52 (100.0%) |
Physical Housing Characteristics in Lake Park
Housing Structures in Lake Park
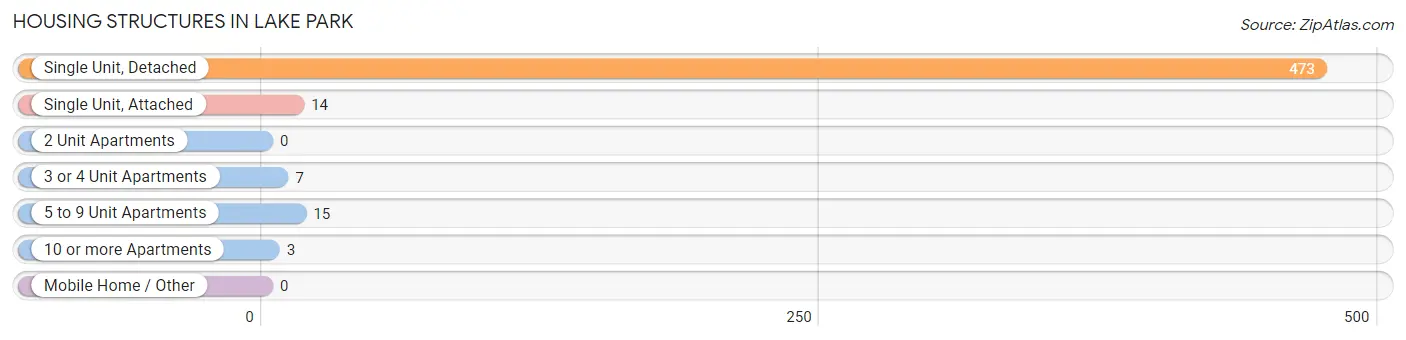
| Structure Type | # Housing Units | % Housing Units |
| Single Unit, Detached | 473 | 92.4% |
| Single Unit, Attached | 14 | 2.7% |
| 2 Unit Apartments | 0 | 0.0% |
| 3 or 4 Unit Apartments | 7 | 1.4% |
| 5 to 9 Unit Apartments | 15 | 2.9% |
| 10 or more Apartments | 3 | 0.6% |
| Mobile Home / Other | 0 | 0.0% |
| Total | 512 | 100.0% |
Housing Structures by Occupancy in Lake Park
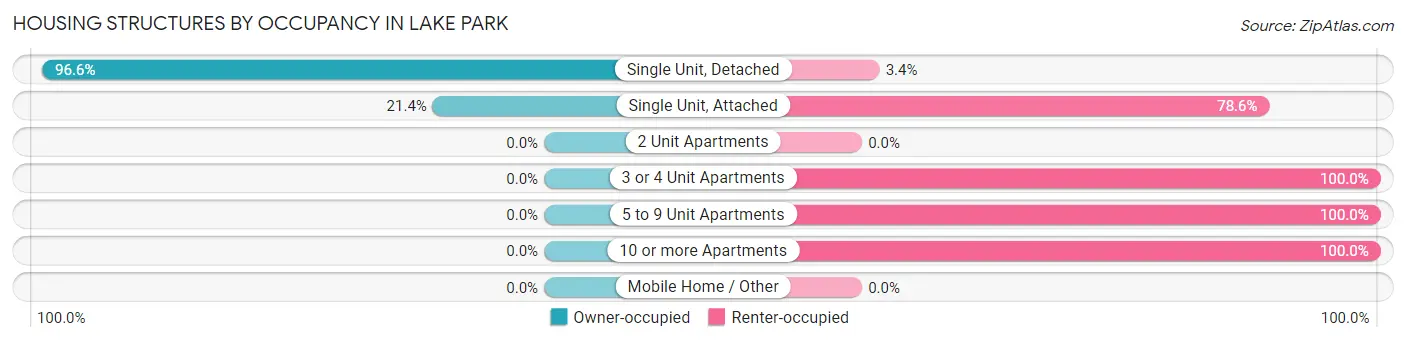
| Structure Type | Owner-occupied | Renter-occupied |
| Single Unit, Detached | 457 (96.6%) | 16 (3.4%) |
| Single Unit, Attached | 3 (21.4%) | 11 (78.6%) |
| 2 Unit Apartments | 0 (0.0%) | 0 (0.0%) |
| 3 or 4 Unit Apartments | 0 (0.0%) | 7 (100.0%) |
| 5 to 9 Unit Apartments | 0 (0.0%) | 15 (100.0%) |
| 10 or more Apartments | 0 (0.0%) | 3 (100.0%) |
| Mobile Home / Other | 0 (0.0%) | 0 (0.0%) |
| Total | 460 (89.8%) | 52 (10.2%) |
Housing Structures by Number of Rooms in Lake Park
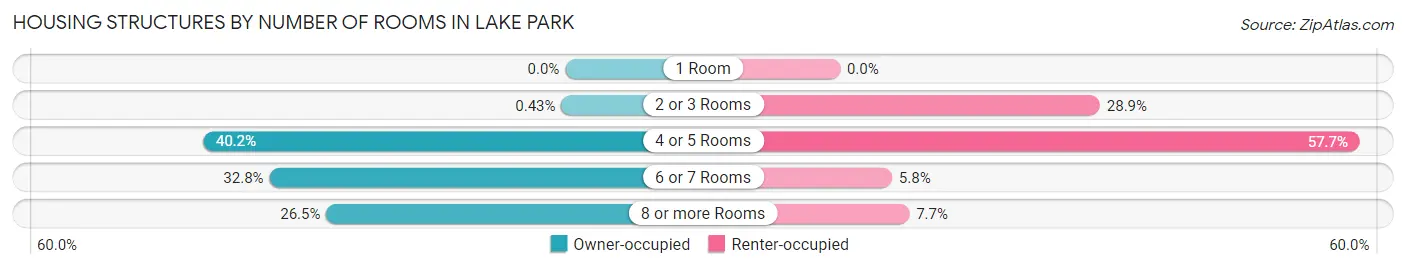
| Number of Rooms | Owner-occupied | Renter-occupied |
| 1 Room | 0 (0.0%) | 0 (0.0%) |
| 2 or 3 Rooms | 2 (0.4%) | 15 (28.8%) |
| 4 or 5 Rooms | 185 (40.2%) | 30 (57.7%) |
| 6 or 7 Rooms | 151 (32.8%) | 3 (5.8%) |
| 8 or more Rooms | 122 (26.5%) | 4 (7.7%) |
| Total | 460 (100.0%) | 52 (100.0%) |
Housing Structure by Heating Type in Lake Park
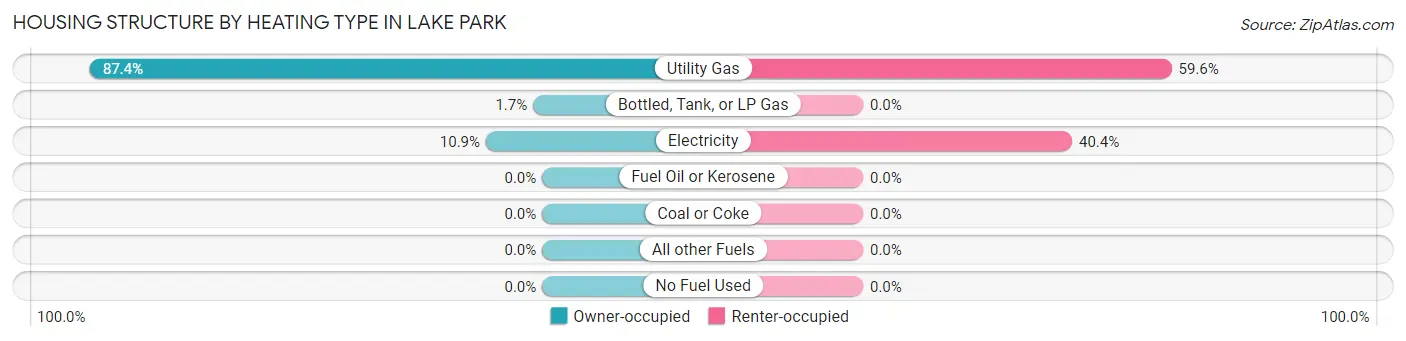
| Heating Type | Owner-occupied | Renter-occupied |
| Utility Gas | 402 (87.4%) | 31 (59.6%) |
| Bottled, Tank, or LP Gas | 8 (1.7%) | 0 (0.0%) |
| Electricity | 50 (10.9%) | 21 (40.4%) |
| Fuel Oil or Kerosene | 0 (0.0%) | 0 (0.0%) |
| Coal or Coke | 0 (0.0%) | 0 (0.0%) |
| All other Fuels | 0 (0.0%) | 0 (0.0%) |
| No Fuel Used | 0 (0.0%) | 0 (0.0%) |
| Total | 460 (100.0%) | 52 (100.0%) |
Household Vehicle Usage in Lake Park
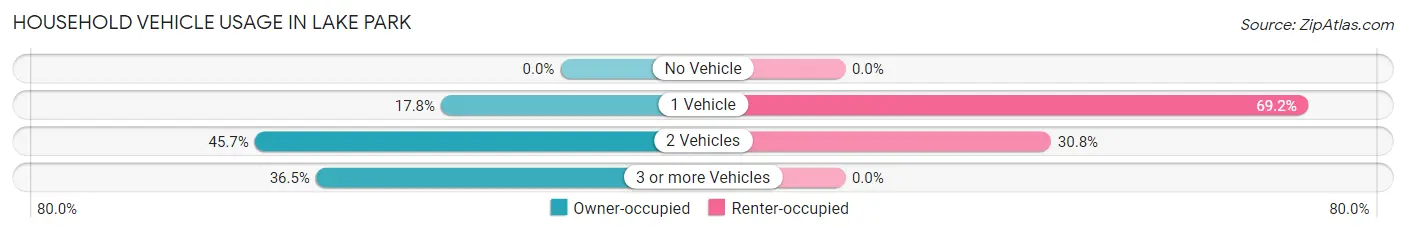
| Vehicles per Household | Owner-occupied | Renter-occupied |
| No Vehicle | 0 (0.0%) | 0 (0.0%) |
| 1 Vehicle | 82 (17.8%) | 36 (69.2%) |
| 2 Vehicles | 210 (45.7%) | 16 (30.8%) |
| 3 or more Vehicles | 168 (36.5%) | 0 (0.0%) |
| Total | 460 (100.0%) | 52 (100.0%) |
Real Estate & Mortgages in Lake Park
Real Estate and Mortgage Overview in Lake Park
| Characteristic | Without Mortgage | With Mortgage |
| Housing Units | 160 | 300 |
| Median Property Value | $158,300 | $133,300 |
| Median Household Income | $78,611 | $15 |
| Monthly Housing Costs | $516 | $5 |
| Real Estate Taxes | $1,881 | $0 |
Property Value by Mortgage Status in Lake Park
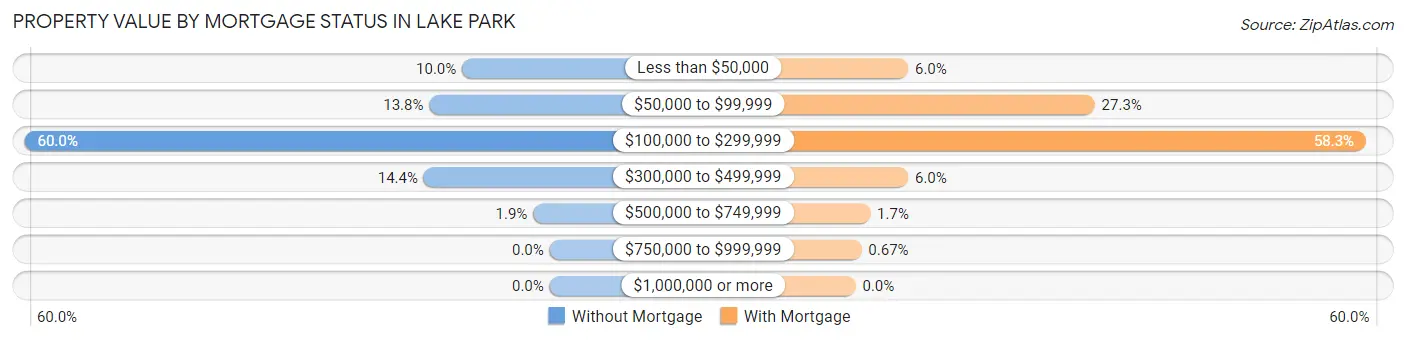
| Property Value | Without Mortgage | With Mortgage |
| Less than $50,000 | 16 (10.0%) | 18 (6.0%) |
| $50,000 to $99,999 | 22 (13.8%) | 82 (27.3%) |
| $100,000 to $299,999 | 96 (60.0%) | 175 (58.3%) |
| $300,000 to $499,999 | 23 (14.4%) | 18 (6.0%) |
| $500,000 to $749,999 | 3 (1.9%) | 5 (1.7%) |
| $750,000 to $999,999 | 0 (0.0%) | 2 (0.7%) |
| $1,000,000 or more | 0 (0.0%) | 0 (0.0%) |
| Total | 160 (100.0%) | 300 (100.0%) |
Household Income by Mortgage Status in Lake Park
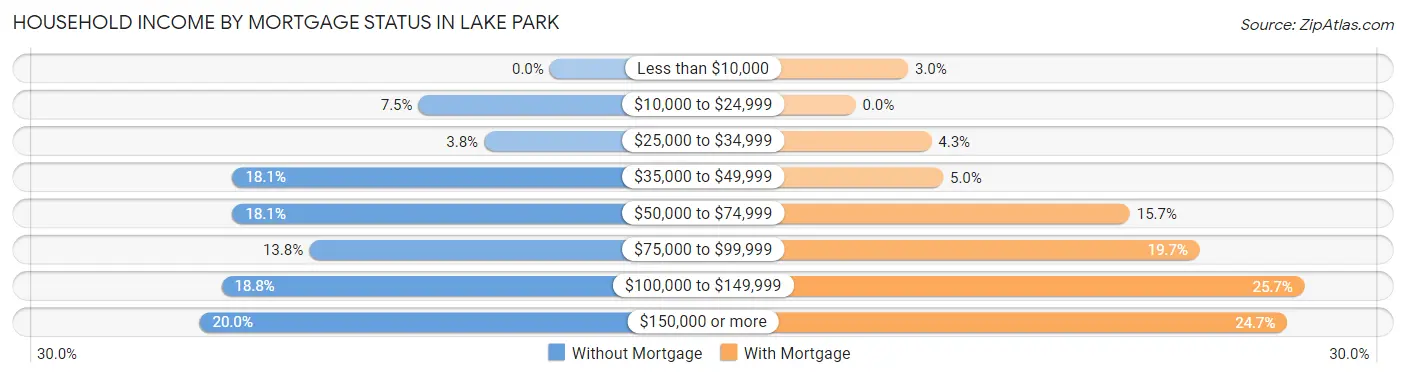
| Household Income | Without Mortgage | With Mortgage |
| Less than $10,000 | 0 (0.0%) | 9 (3.0%) |
| $10,000 to $24,999 | 12 (7.5%) | 0 (0.0%) |
| $25,000 to $34,999 | 6 (3.7%) | 13 (4.3%) |
| $35,000 to $49,999 | 29 (18.1%) | 15 (5.0%) |
| $50,000 to $74,999 | 29 (18.1%) | 47 (15.7%) |
| $75,000 to $99,999 | 22 (13.8%) | 59 (19.7%) |
| $100,000 to $149,999 | 30 (18.8%) | 77 (25.7%) |
| $150,000 or more | 32 (20.0%) | 74 (24.7%) |
| Total | 160 (100.0%) | 300 (100.0%) |
Property Value to Household Income Ratio in Lake Park
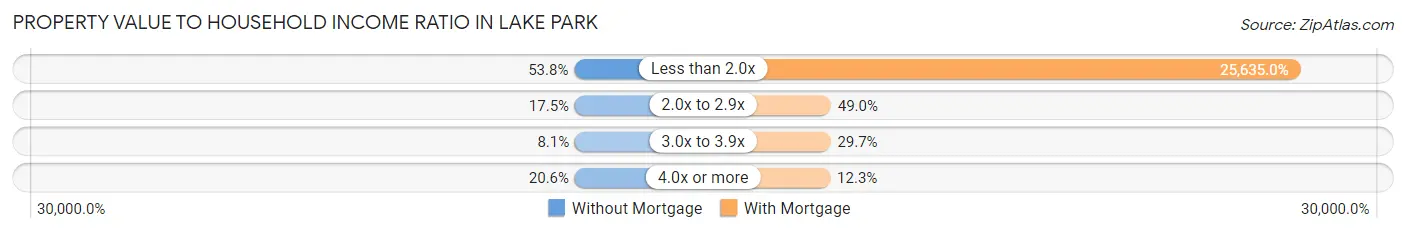
| Value-to-Income Ratio | Without Mortgage | With Mortgage |
| Less than 2.0x | 86 (53.7%) | 76,905 (25,635.0%) |
| 2.0x to 2.9x | 28 (17.5%) | 147 (49.0%) |
| 3.0x to 3.9x | 13 (8.1%) | 89 (29.7%) |
| 4.0x or more | 33 (20.6%) | 37 (12.3%) |
| Total | 160 (100.0%) | 300 (100.0%) |
Real Estate Taxes by Mortgage Status in Lake Park
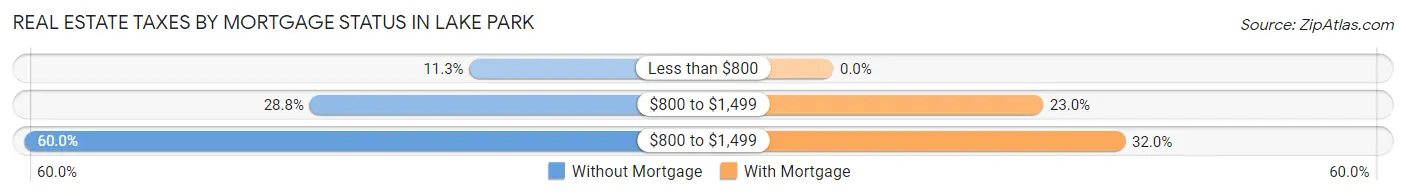
| Property Taxes | Without Mortgage | With Mortgage |
| Less than $800 | 18 (11.3%) | 0 (0.0%) |
| $800 to $1,499 | 46 (28.7%) | 69 (23.0%) |
| $800 to $1,499 | 96 (60.0%) | 96 (32.0%) |
| Total | 160 (100.0%) | 300 (100.0%) |
Health & Disability in Lake Park
Health Insurance Coverage by Age in Lake Park
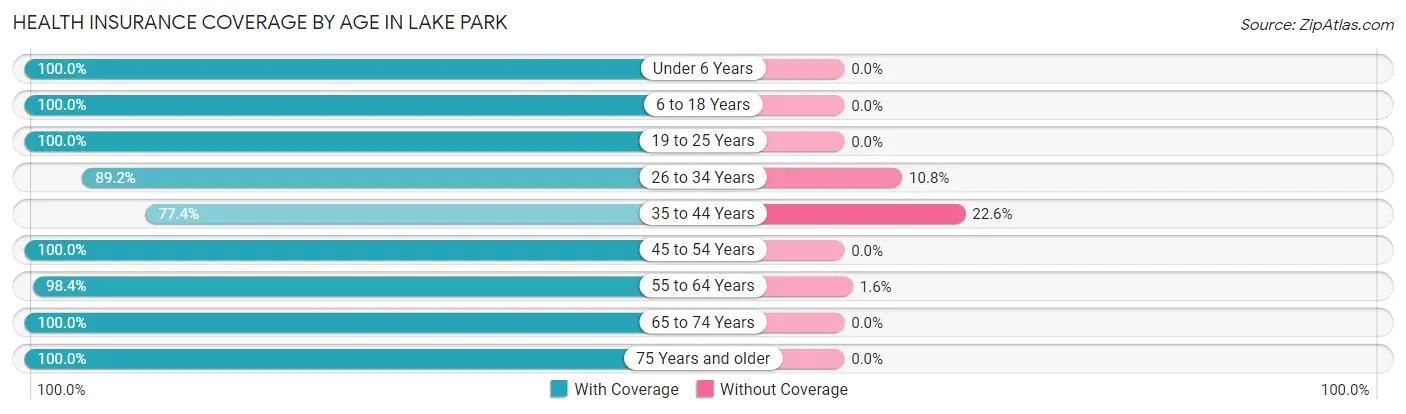
| Age Bracket | With Coverage | Without Coverage |
| Under 6 Years | 106 (100.0%) | 0 (0.0%) |
| 6 to 18 Years | 183 (100.0%) | 0 (0.0%) |
| 19 to 25 Years | 62 (100.0%) | 0 (0.0%) |
| 26 to 34 Years | 124 (89.2%) | 15 (10.8%) |
| 35 to 44 Years | 168 (77.4%) | 49 (22.6%) |
| 45 to 54 Years | 95 (100.0%) | 0 (0.0%) |
| 55 to 64 Years | 124 (98.4%) | 2 (1.6%) |
| 65 to 74 Years | 165 (100.0%) | 0 (0.0%) |
| 75 Years and older | 101 (100.0%) | 0 (0.0%) |
| Total | 1,128 (94.5%) | 66 (5.5%) |
Health Insurance Coverage by Citizenship Status in Lake Park
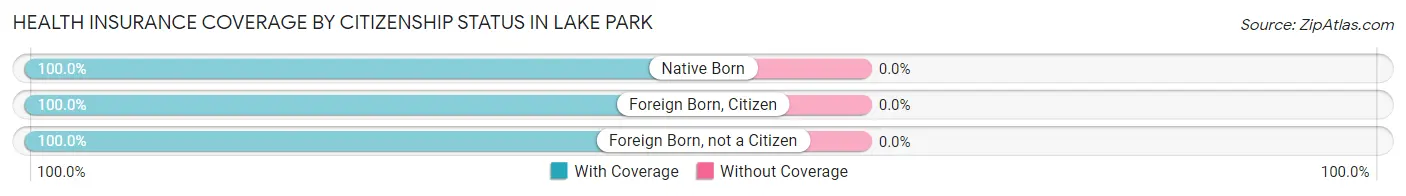
| Citizenship Status | With Coverage | Without Coverage |
| Native Born | 106 (100.0%) | 0 (0.0%) |
| Foreign Born, Citizen | 183 (100.0%) | 0 (0.0%) |
| Foreign Born, not a Citizen | 62 (100.0%) | 0 (0.0%) |
Health Insurance Coverage by Household Income in Lake Park
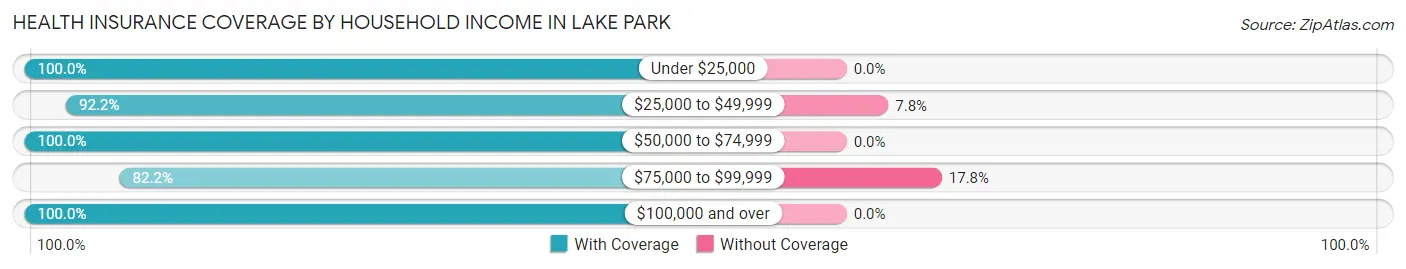
| Household Income | With Coverage | Without Coverage |
| Under $25,000 | 64 (100.0%) | 0 (0.0%) |
| $25,000 to $49,999 | 166 (92.2%) | 14 (7.8%) |
| $50,000 to $74,999 | 182 (100.0%) | 0 (0.0%) |
| $75,000 to $99,999 | 240 (82.2%) | 52 (17.8%) |
| $100,000 and over | 476 (100.0%) | 0 (0.0%) |
Public vs Private Health Insurance Coverage by Age in Lake Park
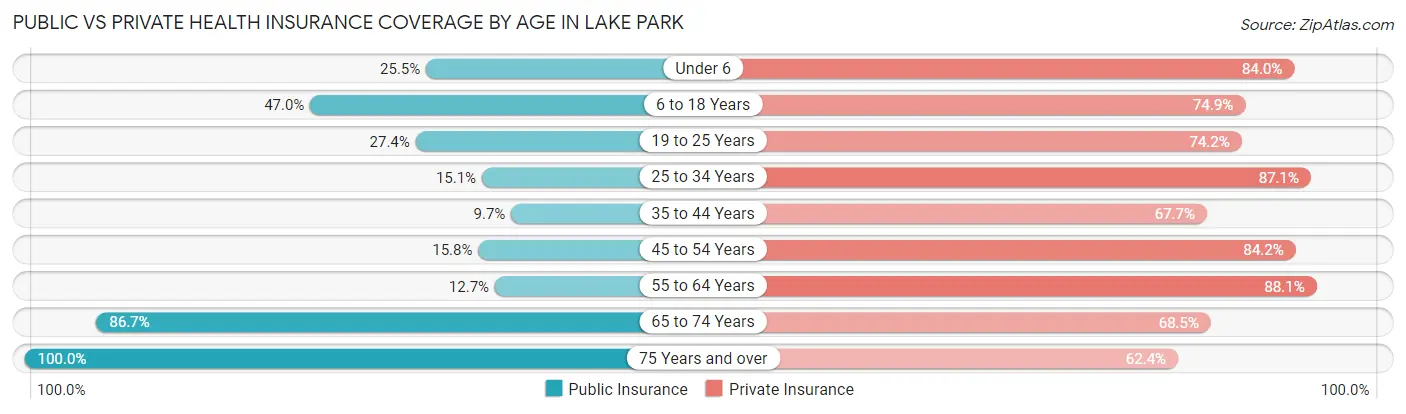
| Age Bracket | Public Insurance | Private Insurance |
| Under 6 | 27 (25.5%) | 89 (84.0%) |
| 6 to 18 Years | 86 (47.0%) | 137 (74.9%) |
| 19 to 25 Years | 17 (27.4%) | 46 (74.2%) |
| 25 to 34 Years | 21 (15.1%) | 121 (87.1%) |
| 35 to 44 Years | 21 (9.7%) | 147 (67.7%) |
| 45 to 54 Years | 15 (15.8%) | 80 (84.2%) |
| 55 to 64 Years | 16 (12.7%) | 111 (88.1%) |
| 65 to 74 Years | 143 (86.7%) | 113 (68.5%) |
| 75 Years and over | 101 (100.0%) | 63 (62.4%) |
| Total | 447 (37.4%) | 907 (76.0%) |
Disability Status by Sex by Age in Lake Park
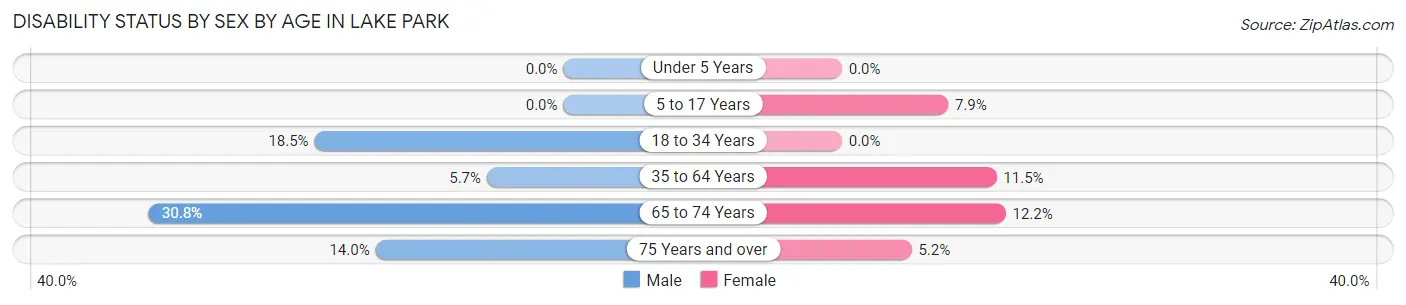
| Age Bracket | Male | Female |
| Under 5 Years | 0 (0.0%) | 0 (0.0%) |
| 5 to 17 Years | 0 (0.0%) | 9 (7.9%) |
| 18 to 34 Years | 17 (18.5%) | 0 (0.0%) |
| 35 to 64 Years | 13 (5.7%) | 24 (11.5%) |
| 65 to 74 Years | 28 (30.8%) | 9 (12.2%) |
| 75 Years and over | 6 (14.0%) | 3 (5.2%) |
Disability Class by Sex by Age in Lake Park
Disability Class: Hearing Difficulty
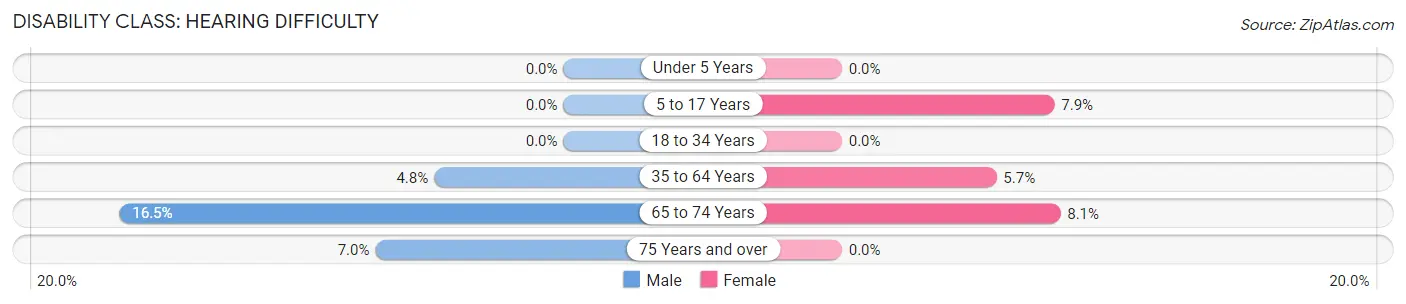
| Age Bracket | Male | Female |
| Under 5 Years | 0 (0.0%) | 0 (0.0%) |
| 5 to 17 Years | 0 (0.0%) | 9 (7.9%) |
| 18 to 34 Years | 0 (0.0%) | 0 (0.0%) |
| 35 to 64 Years | 11 (4.8%) | 12 (5.7%) |
| 65 to 74 Years | 15 (16.5%) | 6 (8.1%) |
| 75 Years and over | 3 (7.0%) | 0 (0.0%) |
Disability Class: Vision Difficulty
| Age Bracket | Male | Female |
| Under 5 Years | 0 (0.0%) | 0 (0.0%) |
| 5 to 17 Years | 0 (0.0%) | 0 (0.0%) |
| 18 to 34 Years | 0 (0.0%) | 0 (0.0%) |
| 35 to 64 Years | 0 (0.0%) | 0 (0.0%) |
| 65 to 74 Years | 0 (0.0%) | 0 (0.0%) |
| 75 Years and over | 0 (0.0%) | 0 (0.0%) |
Disability Class: Cognitive Difficulty
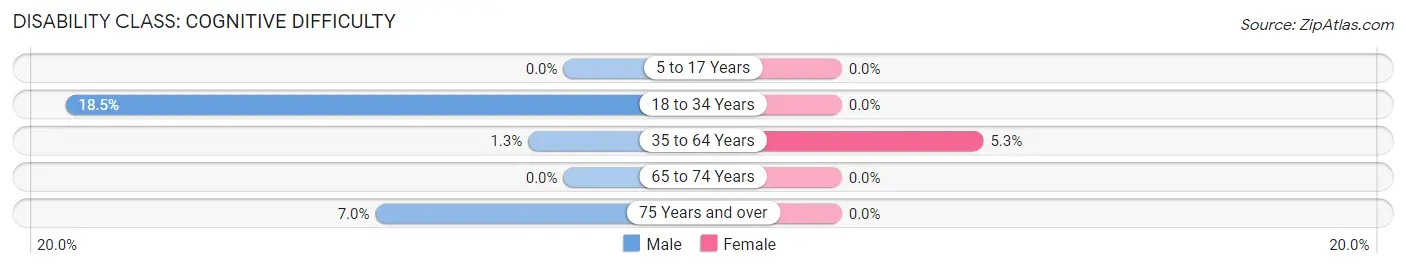
| Age Bracket | Male | Female |
| 5 to 17 Years | 0 (0.0%) | 0 (0.0%) |
| 18 to 34 Years | 17 (18.5%) | 0 (0.0%) |
| 35 to 64 Years | 3 (1.3%) | 11 (5.3%) |
| 65 to 74 Years | 0 (0.0%) | 0 (0.0%) |
| 75 Years and over | 3 (7.0%) | 0 (0.0%) |
Disability Class: Ambulatory Difficulty
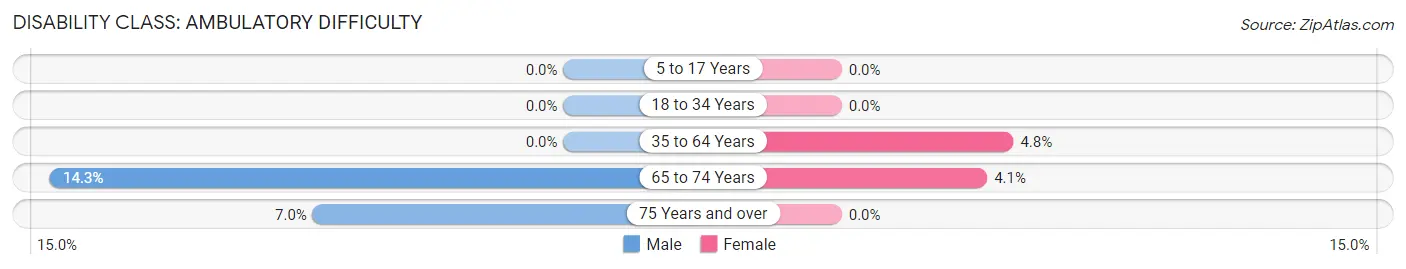
| Age Bracket | Male | Female |
| 5 to 17 Years | 0 (0.0%) | 0 (0.0%) |
| 18 to 34 Years | 0 (0.0%) | 0 (0.0%) |
| 35 to 64 Years | 0 (0.0%) | 10 (4.8%) |
| 65 to 74 Years | 13 (14.3%) | 3 (4.1%) |
| 75 Years and over | 3 (7.0%) | 0 (0.0%) |
Disability Class: Self-Care Difficulty
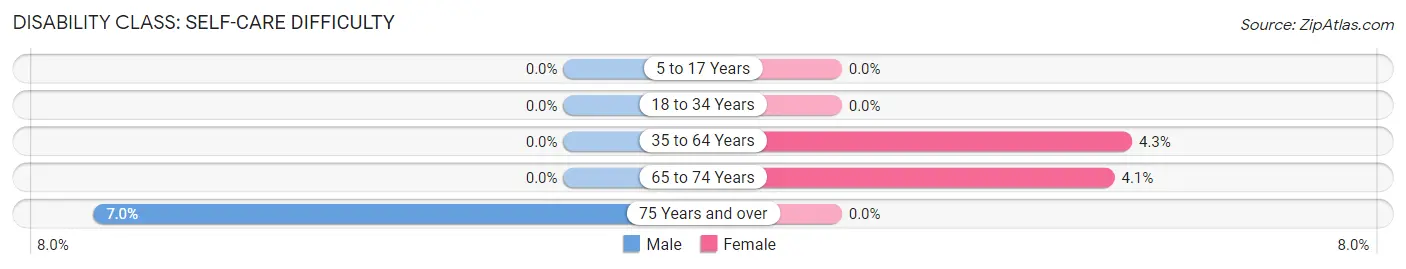
| Age Bracket | Male | Female |
| 5 to 17 Years | 0 (0.0%) | 0 (0.0%) |
| 18 to 34 Years | 0 (0.0%) | 0 (0.0%) |
| 35 to 64 Years | 0 (0.0%) | 9 (4.3%) |
| 65 to 74 Years | 0 (0.0%) | 3 (4.1%) |
| 75 Years and over | 3 (7.0%) | 0 (0.0%) |
Technology Access in Lake Park
Computing Device Access in Lake Park
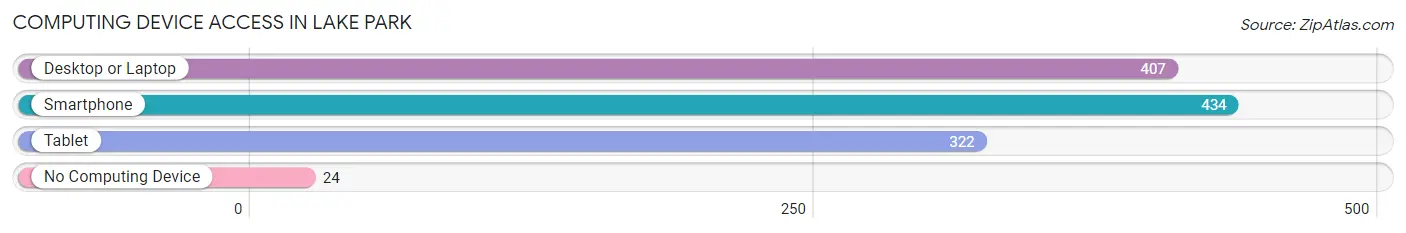
| Device Type | # Households | % Households |
| Desktop or Laptop | 407 | 79.5% |
| Smartphone | 434 | 84.8% |
| Tablet | 322 | 62.9% |
| No Computing Device | 24 | 4.7% |
| Total | 512 | 100.0% |
Internet Access in Lake Park
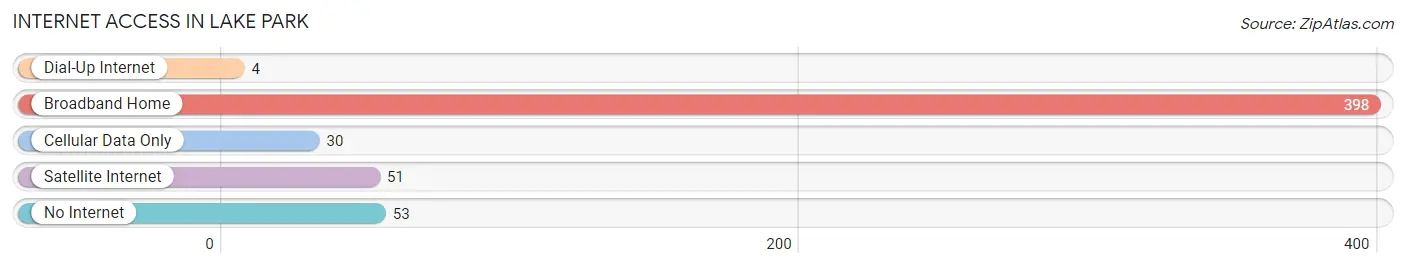
| Internet Type | # Households | % Households |
| Dial-Up Internet | 4 | 0.8% |
| Broadband Home | 398 | 77.7% |
| Cellular Data Only | 30 | 5.9% |
| Satellite Internet | 51 | 10.0% |
| No Internet | 53 | 10.3% |
| Total | 512 | 100.0% |
Lake Park Summary
Park Lake, Iowa is a small town located in Dickinson County in the state of Iowa. It is situated on the western shore of West Okoboji Lake, which is part of the Iowa Great Lakes region. The town has a population of approximately 500 people and is a popular tourist destination in the summer months.
History
Park Lake was first settled in the late 1800s by a group of German immigrants. The town was originally known as “West Okoboji” and was later renamed “Park Lake” in honor of the nearby lake. The town was officially incorporated in 1891 and has remained a small, rural community ever since.
The town was originally a farming community, but in the early 1900s, the area began to attract tourists due to its proximity to the lake. The town quickly became a popular summer destination for vacationers and soon began to develop a thriving tourism industry.
In the 1950s, the town began to experience a population boom as more and more people moved to the area to take advantage of the lake and the nearby attractions. This growth continued into the 1960s and 1970s, and by the 1980s, Park Lake had become a popular destination for both tourists and residents alike.
Geography
Park Lake is located in Dickinson County in the state of Iowa. It is situated on the western shore of West Okoboji Lake, which is part of the Iowa Great Lakes region. The town is surrounded by rolling hills and farmland, and is located approximately 30 miles north of the city of Spencer.
The town is located at an elevation of 1,068 feet above sea level and has a total area of 0.6 square miles. The climate in Park Lake is classified as humid continental, with hot summers and cold winters.
Economy
The economy of Park Lake is largely based on tourism. The town is a popular summer destination for vacationers, and the local economy is heavily reliant on the tourism industry. The town also has a number of small businesses, including restaurants, shops, and lodging.
The town is also home to a number of manufacturing companies, including a furniture factory and a plastics factory. The town also has a number of agricultural businesses, including dairy farms and crop farms.
Demographics
As of the 2010 census, the population of Park Lake was 498 people. The racial makeup of the town was 97.2% White, 0.2% African American, 0.2% Native American, 0.4% Asian, 0.2% from other races, and 1.9% from two or more races. Hispanic or Latino of any race were 0.8% of the population.
The median household income in Park Lake was $41,250, and the median family income was $45,833. The per capita income for the town was $20,945. About 8.2% of families and 10.2% of the population were below the poverty line, including 14.3% of those under age 18 and 6.3% of those age 65 or over.
Common Questions
What is Per Capita Income in Lake Park?
Per Capita income in Lake Park is $36,319.
What is the Median Family Income in Lake Park?
Median Family Income in Lake Park is $83,672.
What is the Median Household income in Lake Park?
Median Household Income in Lake Park is $75,476.
What is Income or Wage Gap in Lake Park?
Income or Wage Gap in Lake Park is 36.4%.
Women in Lake Park earn 63.6 cents for every dollar earned by a man.
What is Inequality or Gini Index in Lake Park?
Inequality or Gini Index in Lake Park is 0.36.
What is the Total Population of Lake Park?
Total Population of Lake Park is 1,223.
What is the Total Male Population of Lake Park?
Total Male Population of Lake Park is 609.
What is the Total Female Population of Lake Park?
Total Female Population of Lake Park is 614.
What is the Ratio of Males per 100 Females in Lake Park?
There are 99.19 Males per 100 Females in Lake Park.
What is the Ratio of Females per 100 Males in Lake Park?
There are 100.82 Females per 100 Males in Lake Park.
What is the Median Population Age in Lake Park?
Median Population Age in Lake Park is 40.1 Years.
What is the Average Family Size in Lake Park
Average Family Size in Lake Park is 3.0 People.
What is the Average Household Size in Lake Park
Average Household Size in Lake Park is 2.3 People.
How Large is the Labor Force in Lake Park?
There are 673 People in the Labor Forcein in Lake Park.
What is the Percentage of People in the Labor Force in Lake Park?
69.6% of People are in the Labor Force in Lake Park.
What is the Unemployment Rate in Lake Park?
Unemployment Rate in Lake Park is 0.4%.