Lake City, IA Map & Demographics
Lake City Map
Lake City Overview
$31,165
PER CAPITA INCOME
$73,036
AVG FAMILY INCOME
$59,704
AVG HOUSEHOLD INCOME
33.6%
WAGE / INCOME GAP [ % ]
66.4¢/ $1
WAGE / INCOME GAP [ $ ]
0.36
INEQUALITY / GINI INDEX
1,745
TOTAL POPULATION
836
MALE POPULATION
909
FEMALE POPULATION
91.97
MALES / 100 FEMALES
108.73
FEMALES / 100 MALES
48.8
MEDIAN AGE
2.7
AVG FAMILY SIZE
2.4
AVG HOUSEHOLD SIZE
804
LABOR FORCE [ PEOPLE ]
55.9%
PERCENT IN LABOR FORCE
2.0%
UNEMPLOYMENT RATE
Lake City Zip Codes
Lake City Area Codes
Income in Lake City
Income Overview in Lake City
Per Capita Income in Lake City is $31,165, while median incomes of families and households are $73,036 and $59,704 respectively.
| Characteristic | Number | Measure |
| Per Capita Income | 1,745 | $31,165 |
| Median Family Income | 477 | $73,036 |
| Mean Family Income | 477 | $81,582 |
| Median Household Income | 683 | $59,704 |
| Mean Household Income | 683 | $71,148 |
| Income Deficit | 477 | $0 |
| Wage / Income Gap (%) | 1,745 | 33.63% |
| Wage / Income Gap ($) | 1,745 | 66.37¢ per $1 |
| Gini / Inequality Index | 1,745 | 0.36 |
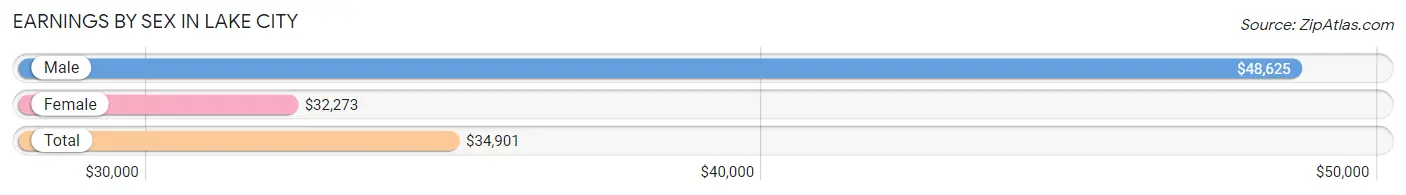
Earnings by Sex in Lake City
Average Earnings in Lake City are $34,901, $48,625 for men and $32,273 for women, a difference of 33.6%.
| Sex | Number | Average Earnings |
| Male | 429 (49.8%) | $48,625 |
| Female | 432 (50.2%) | $32,273 |
| Total | 861 (100.0%) | $34,901 |
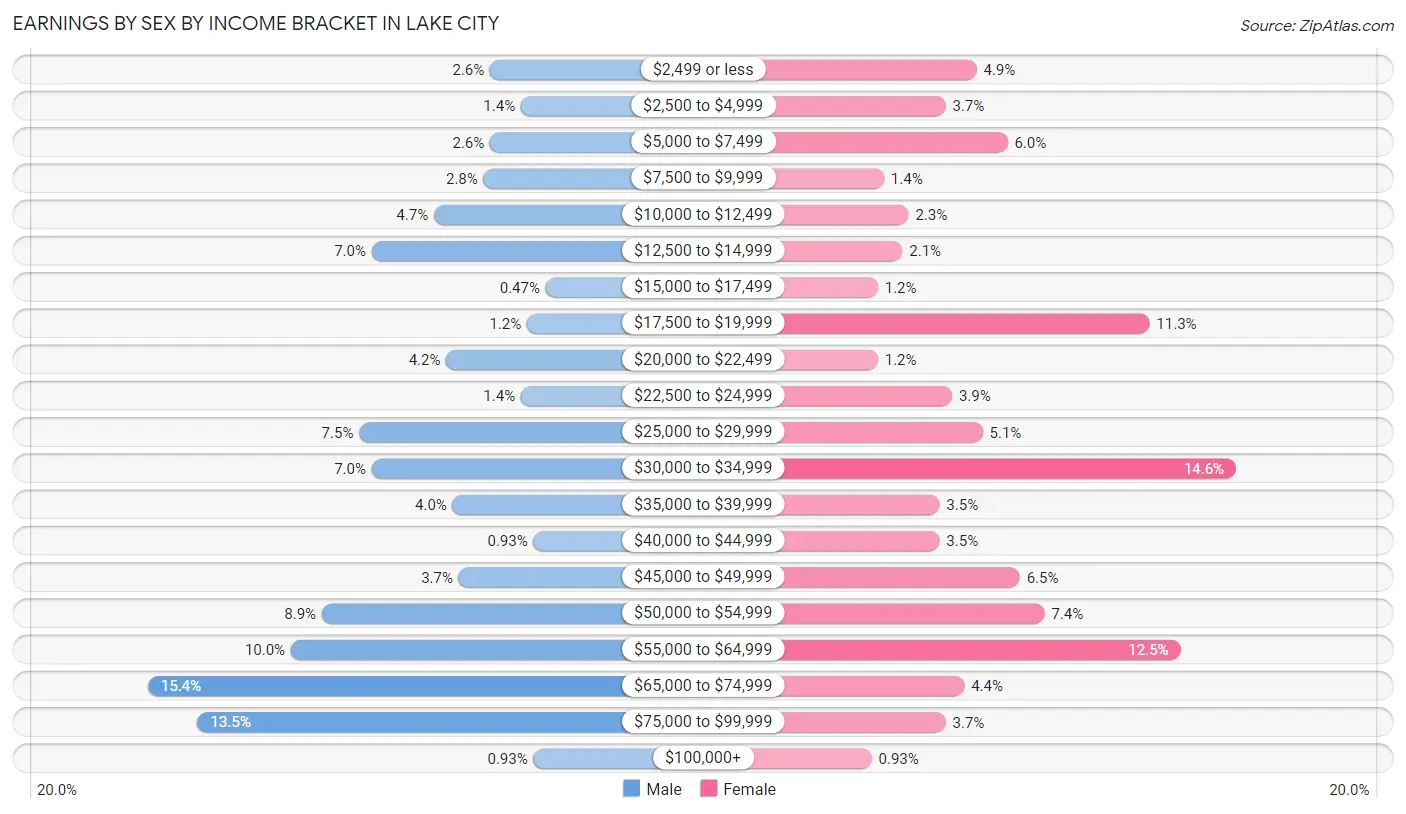
Earnings by Sex by Income Bracket in Lake City
The most common earnings brackets in Lake City are $65,000 to $74,999 for men (66 | 15.4%) and $30,000 to $34,999 for women (63 | 14.6%).
| Income | Male | Female |
| $2,499 or less | 11 (2.6%) | 21 (4.9%) |
| $2,500 to $4,999 | 6 (1.4%) | 16 (3.7%) |
| $5,000 to $7,499 | 11 (2.6%) | 26 (6.0%) |
| $7,500 to $9,999 | 12 (2.8%) | 6 (1.4%) |
| $10,000 to $12,499 | 20 (4.7%) | 10 (2.3%) |
| $12,500 to $14,999 | 30 (7.0%) | 9 (2.1%) |
| $15,000 to $17,499 | 2 (0.5%) | 5 (1.2%) |
| $17,500 to $19,999 | 5 (1.2%) | 49 (11.3%) |
| $20,000 to $22,499 | 18 (4.2%) | 5 (1.2%) |
| $22,500 to $24,999 | 6 (1.4%) | 17 (3.9%) |
| $25,000 to $29,999 | 32 (7.5%) | 22 (5.1%) |
| $30,000 to $34,999 | 30 (7.0%) | 63 (14.6%) |
| $35,000 to $39,999 | 17 (4.0%) | 15 (3.5%) |
| $40,000 to $44,999 | 4 (0.9%) | 15 (3.5%) |
| $45,000 to $49,999 | 16 (3.7%) | 28 (6.5%) |
| $50,000 to $54,999 | 38 (8.9%) | 32 (7.4%) |
| $55,000 to $64,999 | 43 (10.0%) | 54 (12.5%) |
| $65,000 to $74,999 | 66 (15.4%) | 19 (4.4%) |
| $75,000 to $99,999 | 58 (13.5%) | 16 (3.7%) |
| $100,000+ | 4 (0.9%) | 4 (0.9%) |
| Total | 429 (100.0%) | 432 (100.0%) |
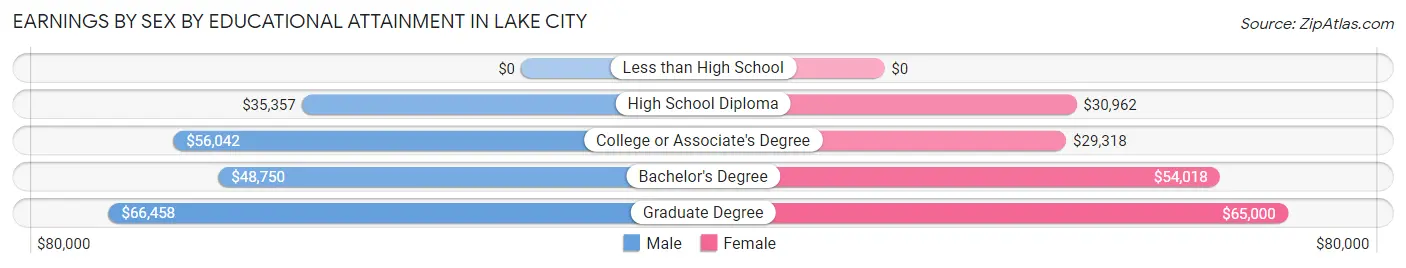
Earnings by Sex by Educational Attainment in Lake City
Average earnings in Lake City are $50,789 for men and $32,462 for women, a difference of 36.1%. Men with an educational attainment of graduate degree enjoy the highest average annual earnings of $66,458, while those with high school diploma education earn the least with $35,357. Women with an educational attainment of graduate degree earn the most with the average annual earnings of $65,000, while those with college or associate's degree education have the smallest earnings of $29,318.
| Educational Attainment | Male Income | Female Income |
| Less than High School | - | - |
| High School Diploma | $35,357 | $30,962 |
| College or Associate's Degree | $56,042 | $29,318 |
| Bachelor's Degree | $48,750 | $54,018 |
| Graduate Degree | $66,458 | $65,000 |
| Total | $50,789 | $32,462 |
Family Income in Lake City
Family Income Brackets in Lake City
According to the Lake City family income data, there are 134 families falling into the $50,000 to $74,999 income range, which is the most common income bracket and makes up 28.1% of all families.
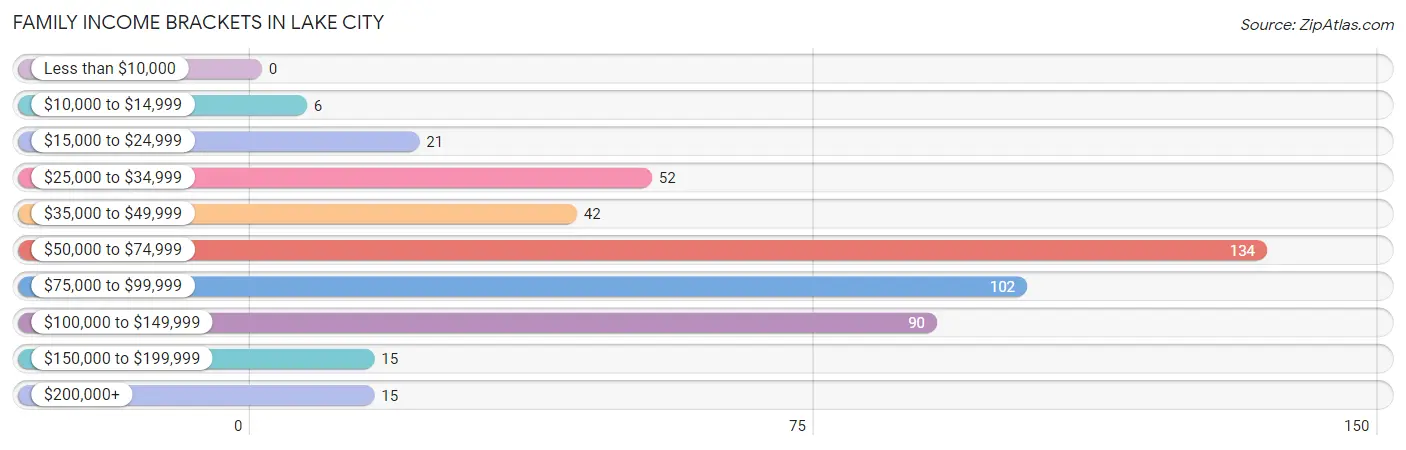
| Income Bracket | # Families | % Families |
| Less than $10,000 | 0 | 0.0% |
| $10,000 to $14,999 | 6 | 1.3% |
| $15,000 to $24,999 | 21 | 4.4% |
| $25,000 to $34,999 | 52 | 10.9% |
| $35,000 to $49,999 | 42 | 8.8% |
| $50,000 to $74,999 | 134 | 28.1% |
| $75,000 to $99,999 | 102 | 21.4% |
| $100,000 to $149,999 | 90 | 18.9% |
| $150,000 to $199,999 | 15 | 3.1% |
| $200,000+ | 15 | 3.1% |
Family Income by Famaliy Size in Lake City
2-person families (306 | 64.1%) account for the highest median family income in Lake City with $75,441 per family, while 2-person families (306 | 64.1%) have the highest median income of $37,720 per family member.
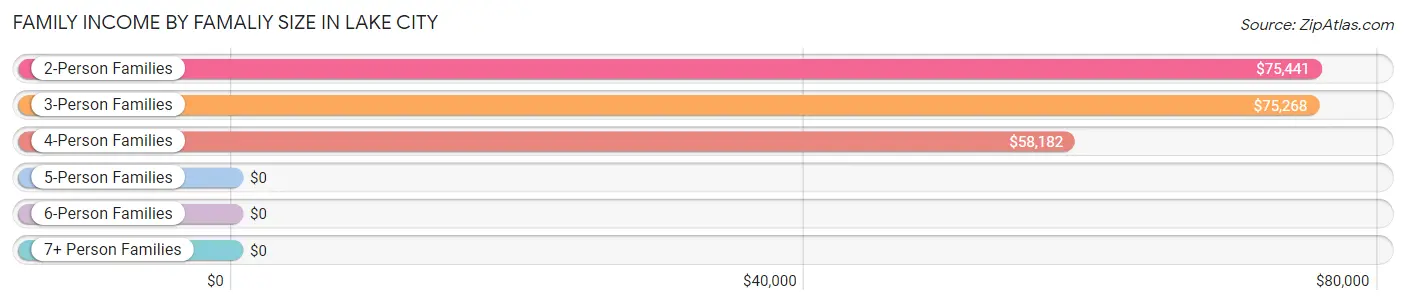
| Income Bracket | # Families | Median Income |
| 2-Person Families | 306 (64.1%) | $75,441 |
| 3-Person Families | 83 (17.4%) | $75,268 |
| 4-Person Families | 68 (14.3%) | $58,182 |
| 5-Person Families | 12 (2.5%) | $0 |
| 6-Person Families | 3 (0.6%) | $0 |
| 7+ Person Families | 5 (1.1%) | $0 |
| Total | 477 (100.0%) | $73,036 |
Family Income by Number of Earners in Lake City
The median family income in Lake City is $73,036, with families comprising 3+ earners (12) having the highest median family income of $111,250, while families with no earners (89) have the lowest median family income of $39,821, accounting for 2.5% and 18.7% of families, respectively.
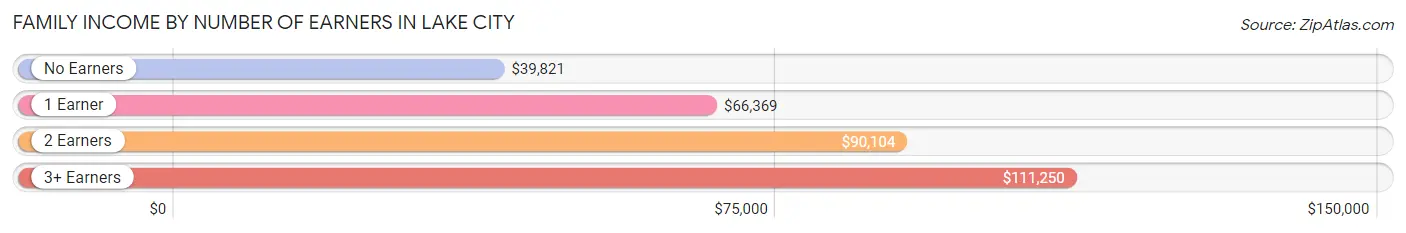
| Number of Earners | # Families | Median Income |
| No Earners | 89 (18.7%) | $39,821 |
| 1 Earner | 189 (39.6%) | $66,369 |
| 2 Earners | 187 (39.2%) | $90,104 |
| 3+ Earners | 12 (2.5%) | $111,250 |
| Total | 477 (100.0%) | $73,036 |
Household Income in Lake City
Household Income Brackets in Lake City
With 153 households falling in the category, the $50,000 to $74,999 income range is the most frequent in Lake City, accounting for 22.4% of all households. In contrast, only 14 households (2.1%) fall into the less than $10,000 income bracket, making it the least populous group.
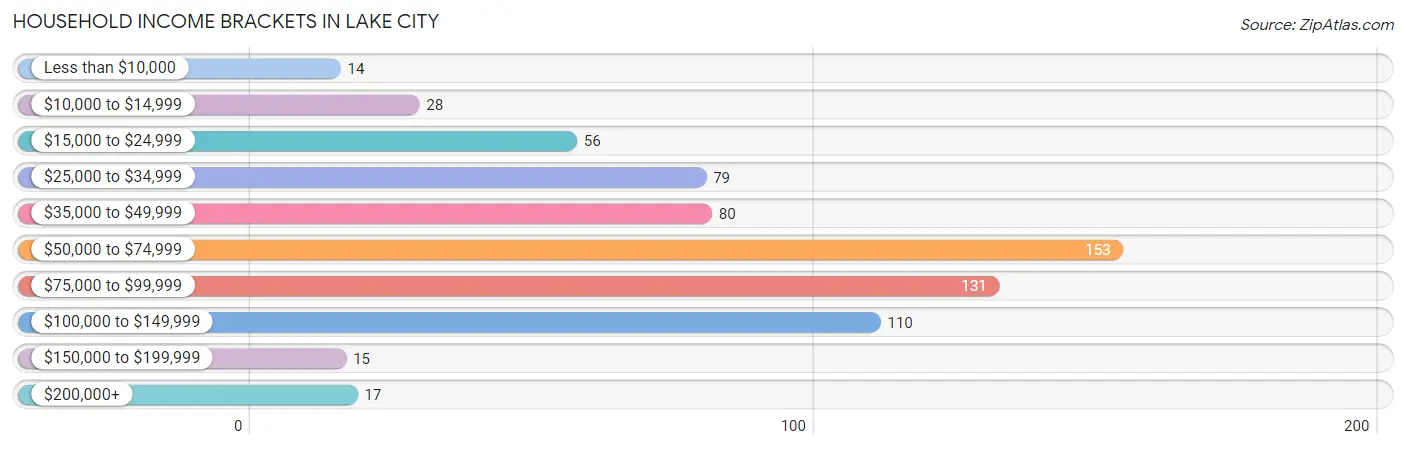
| Income Bracket | # Households | % Households |
| Less than $10,000 | 14 | 2.0% |
| $10,000 to $14,999 | 28 | 4.1% |
| $15,000 to $24,999 | 56 | 8.2% |
| $25,000 to $34,999 | 79 | 11.6% |
| $35,000 to $49,999 | 80 | 11.7% |
| $50,000 to $74,999 | 153 | 22.4% |
| $75,000 to $99,999 | 131 | 19.2% |
| $100,000 to $149,999 | 110 | 16.1% |
| $150,000 to $199,999 | 15 | 2.2% |
| $200,000+ | 17 | 2.5% |
Household Income by Householder Age in Lake City
The median household income in Lake City is $59,704, with the highest median household income of $77,313 found in the 45 to 64 years age bracket for the primary householder. A total of 215 households (31.5%) fall into this category. Meanwhile, the 15 to 24 years age bracket for the primary householder has the lowest median household income of $0, with 7 households (1.0%) in this group.
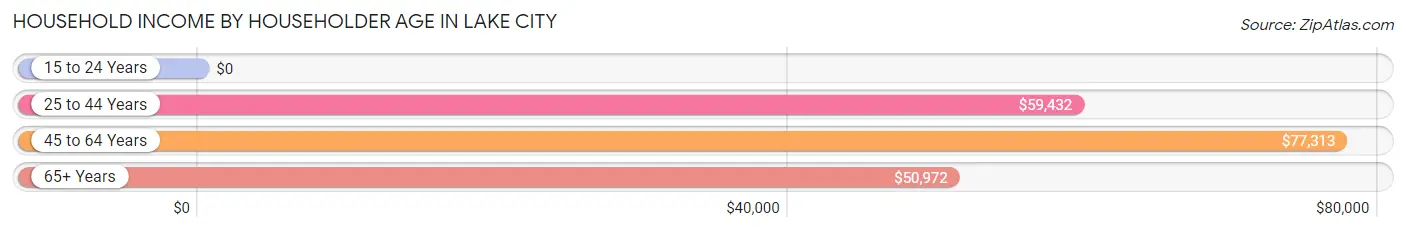
| Income Bracket | # Households | Median Income |
| 15 to 24 Years | 7 (1.0%) | $0 |
| 25 to 44 Years | 202 (29.6%) | $59,432 |
| 45 to 64 Years | 215 (31.5%) | $77,313 |
| 65+ Years | 259 (37.9%) | $50,972 |
| Total | 683 (100.0%) | $59,704 |
Poverty in Lake City
Income Below Poverty by Sex and Age in Lake City
With 11.6% poverty level for males and 10.5% for females among the residents of Lake City, 12 to 14 year old males and 5 year old females are the most vulnerable to poverty, with 2 males (66.7%) and 4 females (44.4%) in their respective age groups living below the poverty level.
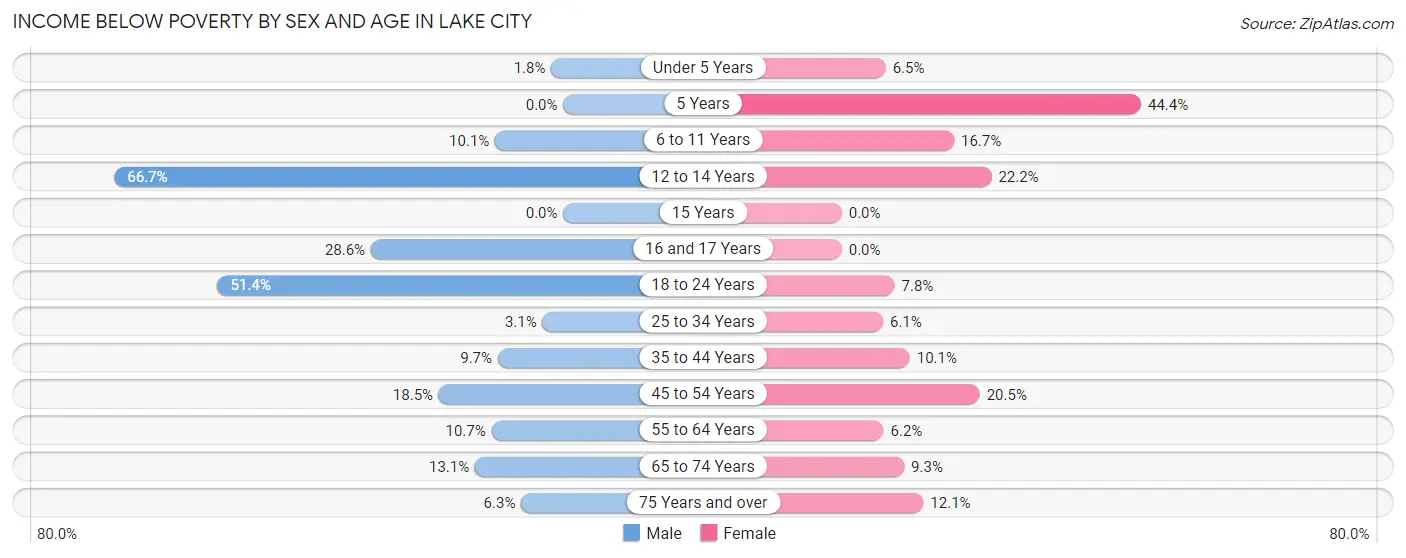
| Age Bracket | Male | Female |
| Under 5 Years | 1 (1.8%) | 3 (6.5%) |
| 5 Years | 0 (0.0%) | 4 (44.4%) |
| 6 to 11 Years | 8 (10.1%) | 10 (16.7%) |
| 12 to 14 Years | 2 (66.7%) | 2 (22.2%) |
| 15 Years | 0 (0.0%) | 0 (0.0%) |
| 16 and 17 Years | 4 (28.6%) | 0 (0.0%) |
| 18 to 24 Years | 19 (51.3%) | 4 (7.8%) |
| 25 to 34 Years | 3 (3.1%) | 9 (6.1%) |
| 35 to 44 Years | 7 (9.7%) | 10 (10.1%) |
| 45 to 54 Years | 17 (18.5%) | 17 (20.5%) |
| 55 to 64 Years | 13 (10.7%) | 9 (6.2%) |
| 65 to 74 Years | 16 (13.1%) | 10 (9.3%) |
| 75 Years and over | 5 (6.2%) | 12 (12.1%) |
| Total | 95 (11.6%) | 90 (10.5%) |
Income Above Poverty by Sex and Age in Lake City
According to the poverty statistics in Lake City, males aged 15 years and females aged 16 and 17 years are the age groups that are most secure financially, with 100.0% of males and 100.0% of females in these age groups living above the poverty line.
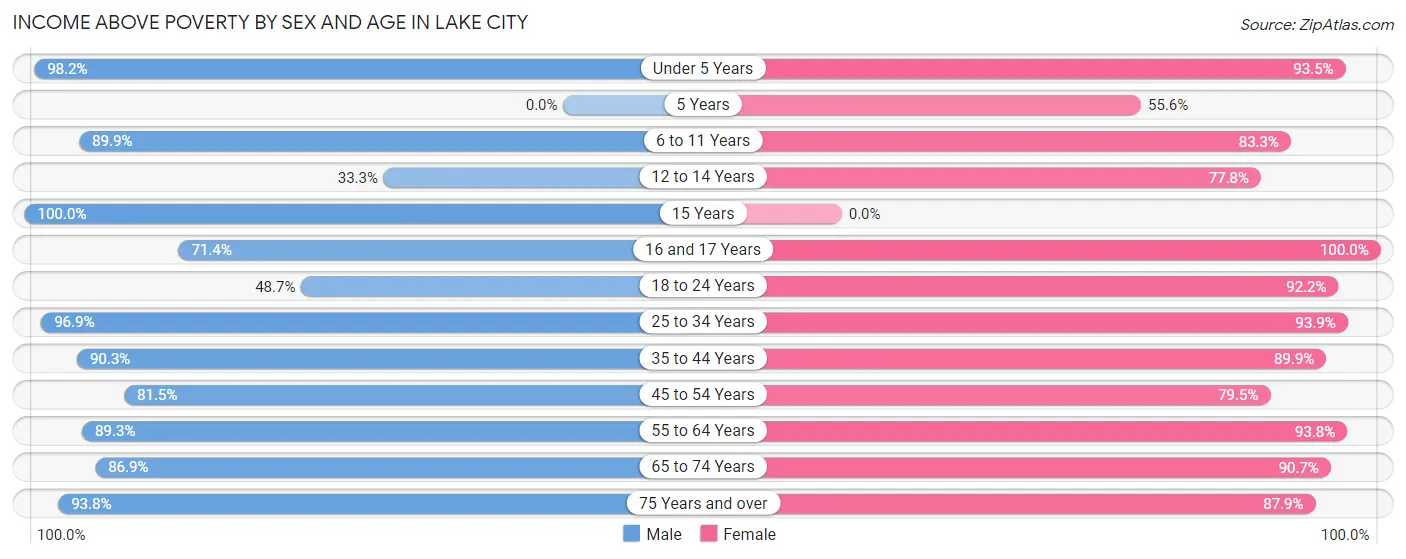
| Age Bracket | Male | Female |
| Under 5 Years | 55 (98.2%) | 43 (93.5%) |
| 5 Years | 0 (0.0%) | 5 (55.6%) |
| 6 to 11 Years | 71 (89.9%) | 50 (83.3%) |
| 12 to 14 Years | 1 (33.3%) | 7 (77.8%) |
| 15 Years | 42 (100.0%) | 0 (0.0%) |
| 16 and 17 Years | 10 (71.4%) | 2 (100.0%) |
| 18 to 24 Years | 18 (48.6%) | 47 (92.2%) |
| 25 to 34 Years | 94 (96.9%) | 138 (93.9%) |
| 35 to 44 Years | 65 (90.3%) | 89 (89.9%) |
| 45 to 54 Years | 75 (81.5%) | 66 (79.5%) |
| 55 to 64 Years | 109 (89.3%) | 136 (93.8%) |
| 65 to 74 Years | 106 (86.9%) | 98 (90.7%) |
| 75 Years and over | 75 (93.8%) | 87 (87.9%) |
| Total | 721 (88.4%) | 768 (89.5%) |
Income Below Poverty Among Married-Couple Families in Lake City
The poverty statistics for married-couple families in Lake City show that 1.6% or 6 of the total 377 families live below the poverty line. Families with 5 or more children have the highest poverty rate of 100.0%, comprising of 3 families. On the other hand, families with 1 or 2 children have the lowest poverty rate of 0.0%, which includes 0 families.
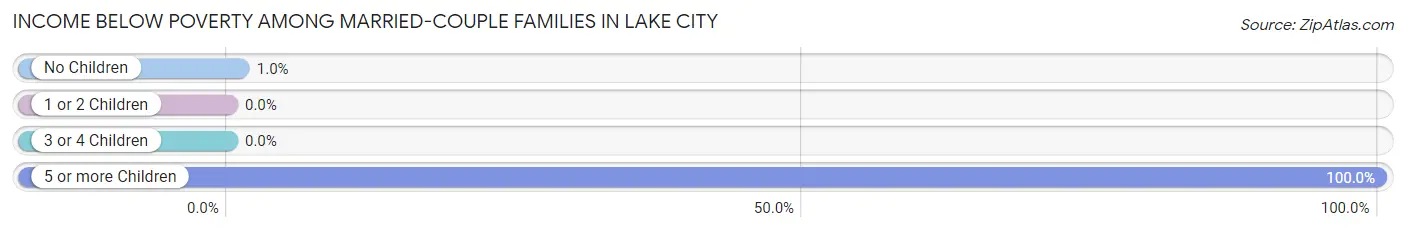
| Children | Above Poverty | Below Poverty |
| No Children | 287 (99.0%) | 3 (1.0%) |
| 1 or 2 Children | 71 (100.0%) | 0 (0.0%) |
| 3 or 4 Children | 13 (100.0%) | 0 (0.0%) |
| 5 or more Children | 0 (0.0%) | 3 (100.0%) |
| Total | 371 (98.4%) | 6 (1.6%) |
Income Below Poverty Among Single-Parent Households in Lake City
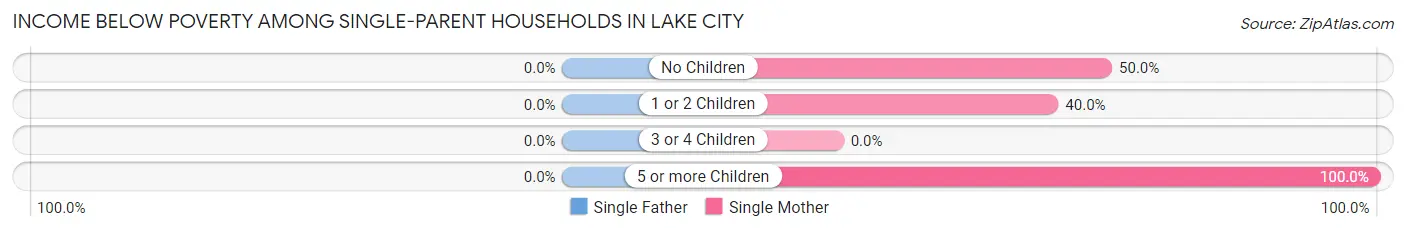
| Children | Single Father | Single Mother |
| No Children | 0 (0.0%) | 9 (50.0%) |
| 1 or 2 Children | 0 (0.0%) | 6 (40.0%) |
| 3 or 4 Children | 0 (0.0%) | 0 (0.0%) |
| 5 or more Children | 0 (0.0%) | 2 (100.0%) |
| Total | 0 (0.0%) | 17 (29.8%) |
Income Below Poverty Among Married-Couple vs Single-Parent Households in Lake City
The poverty data for Lake City shows that 6 of the married-couple family households (1.6%) and 17 of the single-parent households (17.0%) are living below the poverty level. Within the married-couple family households, those with 5 or more children have the highest poverty rate, with 3 households (100.0%) falling below the poverty line. Among the single-parent households, those with 5 or more children have the highest poverty rate, with 2 household (100.0%) living below poverty.
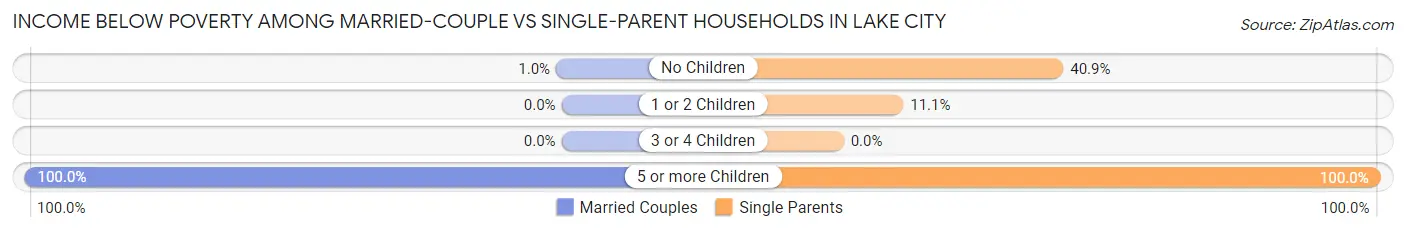
| Children | Married-Couple Families | Single-Parent Households |
| No Children | 3 (1.0%) | 9 (40.9%) |
| 1 or 2 Children | 0 (0.0%) | 6 (11.1%) |
| 3 or 4 Children | 0 (0.0%) | 0 (0.0%) |
| 5 or more Children | 3 (100.0%) | 2 (100.0%) |
| Total | 6 (1.6%) | 17 (17.0%) |
Race in Lake City
The most populous races in Lake City are White / Caucasian (1,609 | 92.2%), Hispanic or Latino (109 | 6.2%), and Two or more Races (98 | 5.6%).
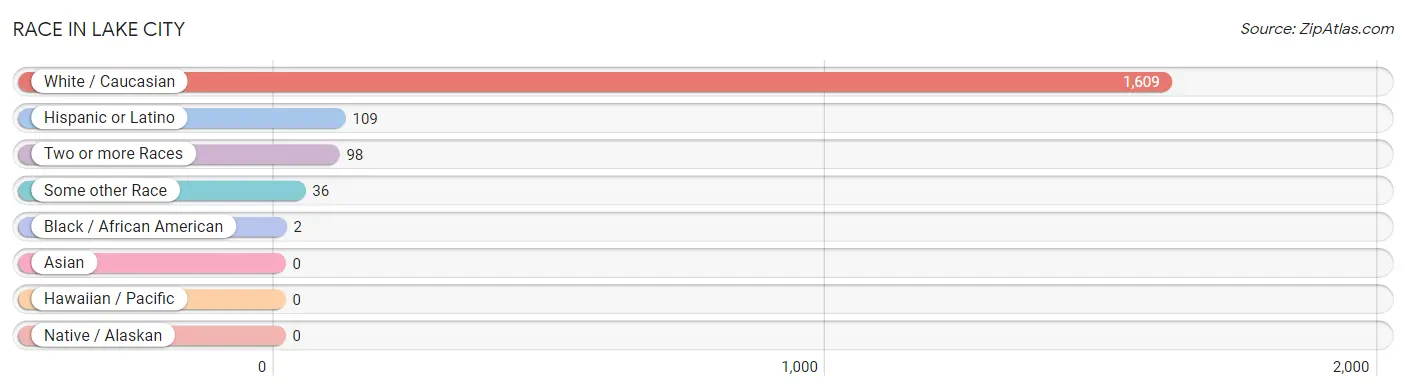
| Race | # Population | % Population |
| Asian | 0 | 0.0% |
| Black / African American | 2 | 0.1% |
| Hawaiian / Pacific | 0 | 0.0% |
| Hispanic or Latino | 109 | 6.2% |
| Native / Alaskan | 0 | 0.0% |
| White / Caucasian | 1,609 | 92.2% |
| Two or more Races | 98 | 5.6% |
| Some other Race | 36 | 2.1% |
| Total | 1,745 | 100.0% |
Ancestry in Lake City
The most populous ancestries reported in Lake City are German (687 | 39.4%), English (207 | 11.9%), Irish (130 | 7.4%), American (104 | 6.0%), and Mexican (103 | 5.9%), together accounting for 70.5% of all Lake City residents.
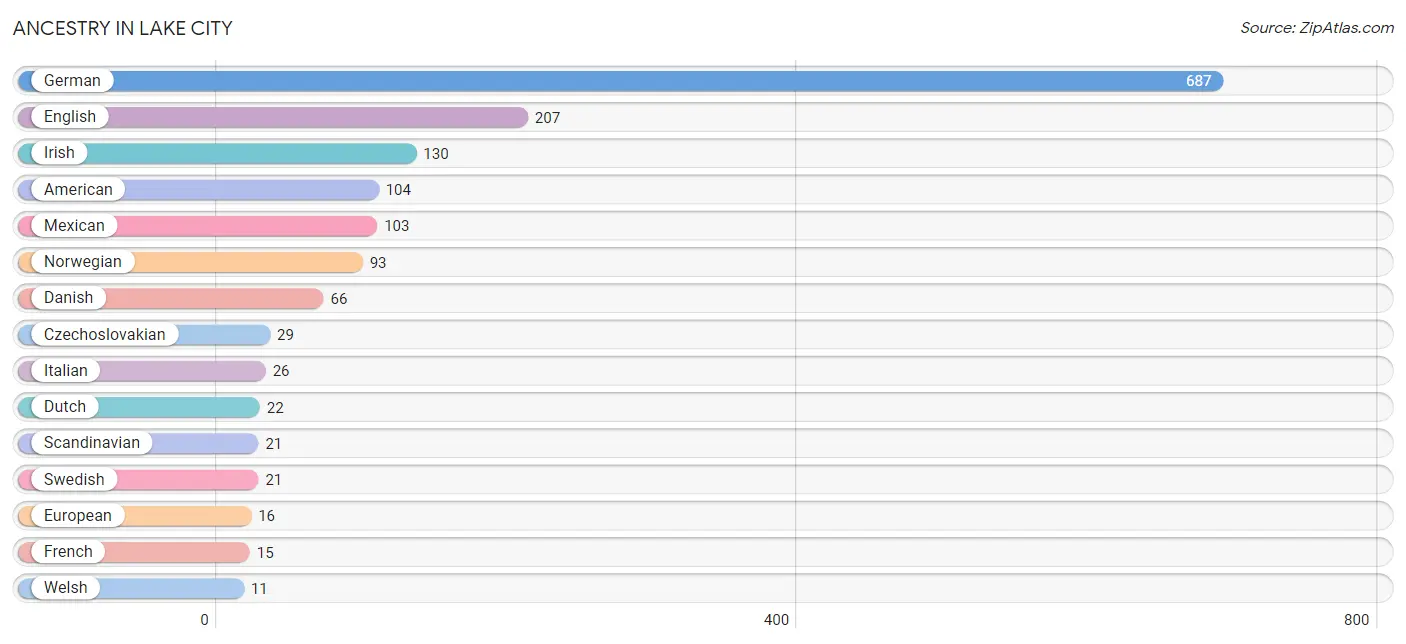
| Ancestry | # Population | % Population |
| American | 104 | 6.0% |
| British | 5 | 0.3% |
| Czech | 7 | 0.4% |
| Czechoslovakian | 29 | 1.7% |
| Danish | 66 | 3.8% |
| Dominican | 6 | 0.3% |
| Dutch | 22 | 1.3% |
| English | 207 | 11.9% |
| European | 16 | 0.9% |
| French | 15 | 0.9% |
| French Canadian | 7 | 0.4% |
| German | 687 | 39.4% |
| Greek | 3 | 0.2% |
| Irish | 130 | 7.4% |
| Italian | 26 | 1.5% |
| Mexican | 103 | 5.9% |
| Northern European | 3 | 0.2% |
| Norwegian | 93 | 5.3% |
| Polish | 6 | 0.3% |
| Russian | 2 | 0.1% |
| Scandinavian | 21 | 1.2% |
| Scotch-Irish | 5 | 0.3% |
| Scottish | 4 | 0.2% |
| Swedish | 21 | 1.2% |
| Welsh | 11 | 0.6% |
| Yugoslavian | 5 | 0.3% | View All 26 Rows |
Immigrants in Lake City
The most numerous immigrant groups reported in Lake City came from Central America (5 | 0.3%), Latin America (5 | 0.3%), and Mexico (5 | 0.3%), together accounting for 0.9% of all Lake City residents.
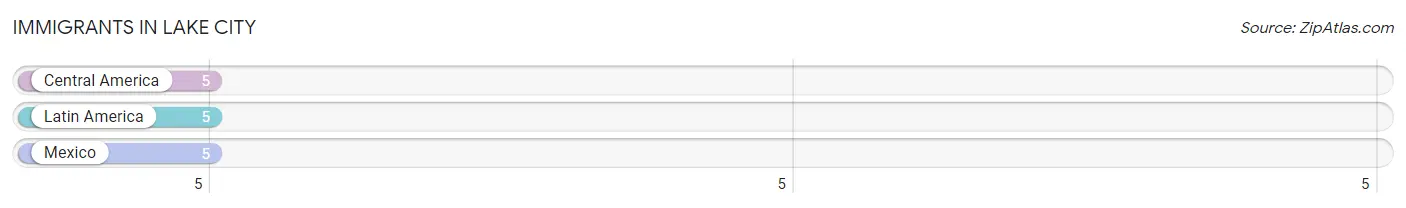
| Immigration Origin | # Population | % Population |
| Central America | 5 | 0.3% |
| Latin America | 5 | 0.3% |
| Mexico | 5 | 0.3% | View All 3 Rows |
Sex and Age in Lake City
Sex and Age in Lake City
The most populous age groups in Lake City are 65 to 69 Years (96 | 11.5%) for men and 25 to 29 Years (112 | 12.3%) for women.
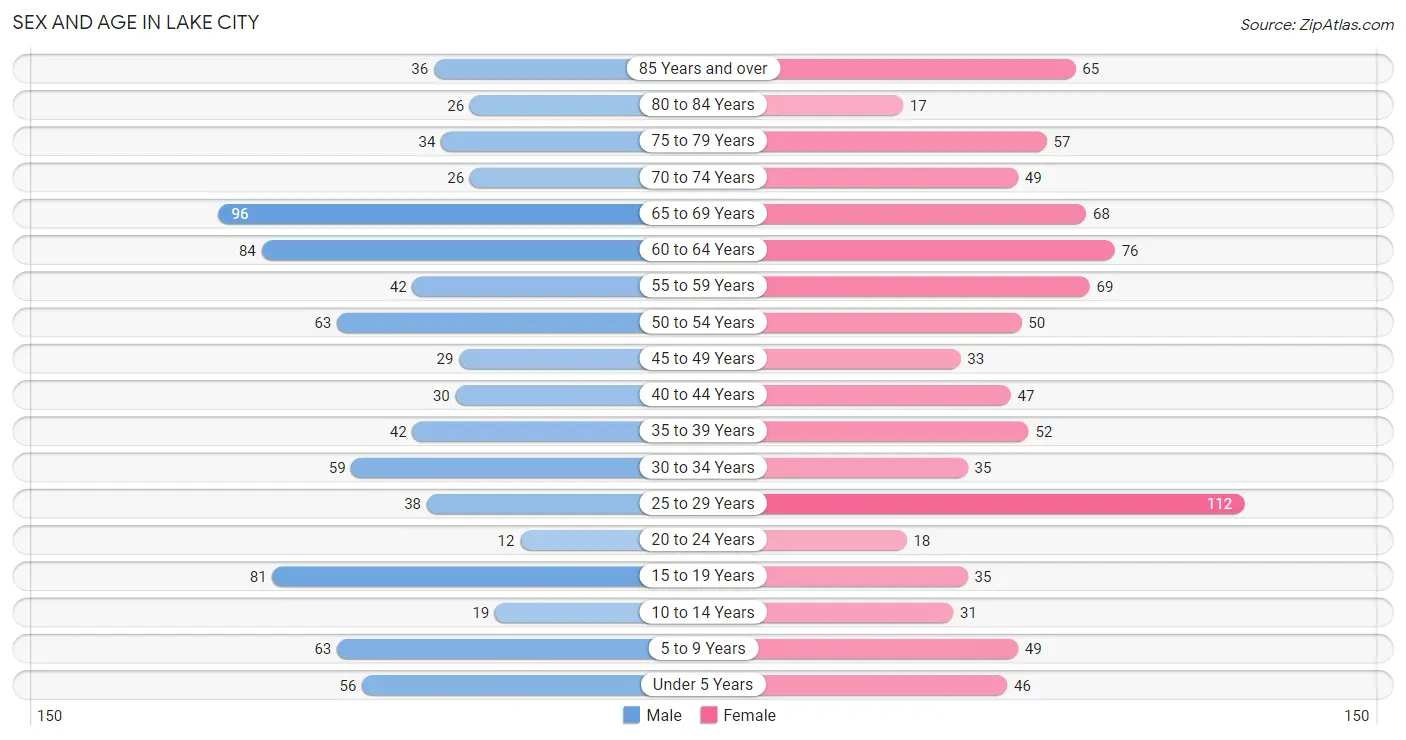
| Age Bracket | Male | Female |
| Under 5 Years | 56 (6.7%) | 46 (5.1%) |
| 5 to 9 Years | 63 (7.5%) | 49 (5.4%) |
| 10 to 14 Years | 19 (2.3%) | 31 (3.4%) |
| 15 to 19 Years | 81 (9.7%) | 35 (3.8%) |
| 20 to 24 Years | 12 (1.4%) | 18 (2.0%) |
| 25 to 29 Years | 38 (4.5%) | 112 (12.3%) |
| 30 to 34 Years | 59 (7.1%) | 35 (3.8%) |
| 35 to 39 Years | 42 (5.0%) | 52 (5.7%) |
| 40 to 44 Years | 30 (3.6%) | 47 (5.2%) |
| 45 to 49 Years | 29 (3.5%) | 33 (3.6%) |
| 50 to 54 Years | 63 (7.5%) | 50 (5.5%) |
| 55 to 59 Years | 42 (5.0%) | 69 (7.6%) |
| 60 to 64 Years | 84 (10.1%) | 76 (8.4%) |
| 65 to 69 Years | 96 (11.5%) | 68 (7.5%) |
| 70 to 74 Years | 26 (3.1%) | 49 (5.4%) |
| 75 to 79 Years | 34 (4.1%) | 57 (6.3%) |
| 80 to 84 Years | 26 (3.1%) | 17 (1.9%) |
| 85 Years and over | 36 (4.3%) | 65 (7.1%) |
| Total | 836 (100.0%) | 909 (100.0%) |
Families and Households in Lake City
Median Family Size in Lake City
The median family size in Lake City is 2.72 persons per family, with single female/mother families (57 | 11.9%) accounting for the largest median family size of 3.42 persons per family. On the other hand, single male/father families (43 | 9.0%) represent the smallest median family size with 2.26 persons per family.
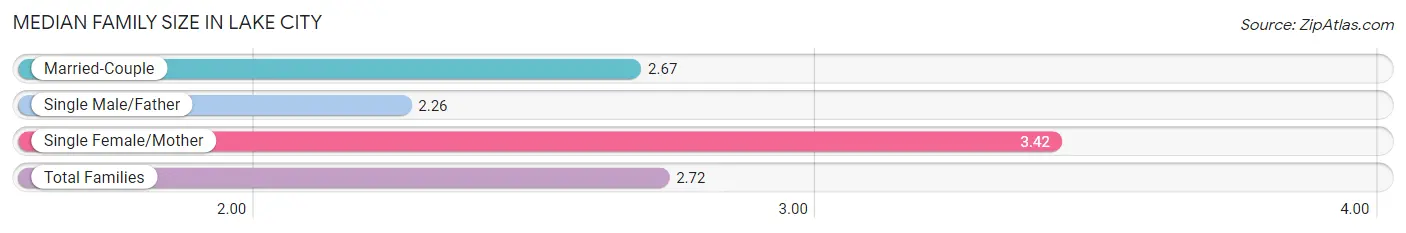
| Family Type | # Families | Family Size |
| Married-Couple | 377 (79.0%) | 2.67 |
| Single Male/Father | 43 (9.0%) | 2.26 |
| Single Female/Mother | 57 (11.9%) | 3.42 |
| Total Families | 477 (100.0%) | 2.72 |
Median Household Size in Lake City
The median household size in Lake City is 2.40 persons per household, with single female/mother households (57 | 8.4%) accounting for the largest median household size of 3.63 persons per household. non-family households (206 | 30.2%) represent the smallest median household size with 1.35 persons per household.
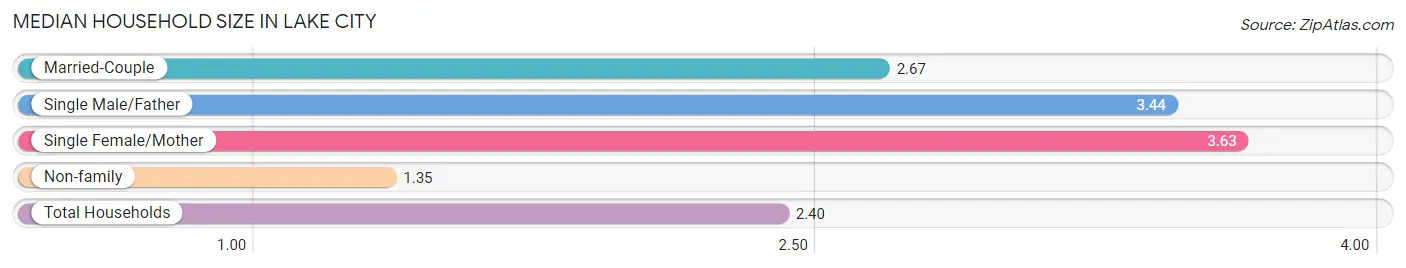
| Household Type | # Households | Household Size |
| Married-Couple | 377 (55.2%) | 2.67 |
| Single Male/Father | 43 (6.3%) | 3.44 |
| Single Female/Mother | 57 (8.4%) | 3.63 |
| Non-family | 206 (30.2%) | 1.35 |
| Total Households | 683 (100.0%) | 2.40 |
Household Size by Marriage Status in Lake City
Out of a total of 683 households in Lake City, 477 (69.8%) are family households, while 206 (30.2%) are nonfamily households. The most numerous type of family households are 2-person households, comprising 303, and the most common type of nonfamily households are 1-person households, comprising 175.
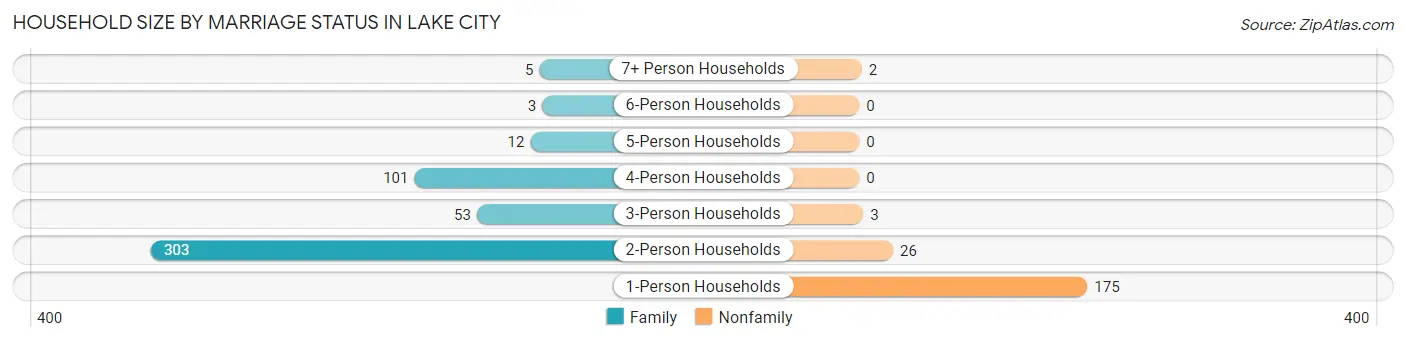
| Household Size | Family Households | Nonfamily Households |
| 1-Person Households | - | 175 (25.6%) |
| 2-Person Households | 303 (44.4%) | 26 (3.8%) |
| 3-Person Households | 53 (7.8%) | 3 (0.4%) |
| 4-Person Households | 101 (14.8%) | 0 (0.0%) |
| 5-Person Households | 12 (1.8%) | 0 (0.0%) |
| 6-Person Households | 3 (0.4%) | 0 (0.0%) |
| 7+ Person Households | 5 (0.7%) | 2 (0.3%) |
| Total | 477 (69.8%) | 206 (30.2%) |
Female Fertility in Lake City
Fertility by Age in Lake City
Average fertility rate in Lake City is 38.0 births per 1,000 women. Women in the age bracket of 20 to 34 years have the highest fertility rate with 55.0 births per 1,000 women. Women in the age bracket of 20 to 34 years acount for 69.2% of all women with births.
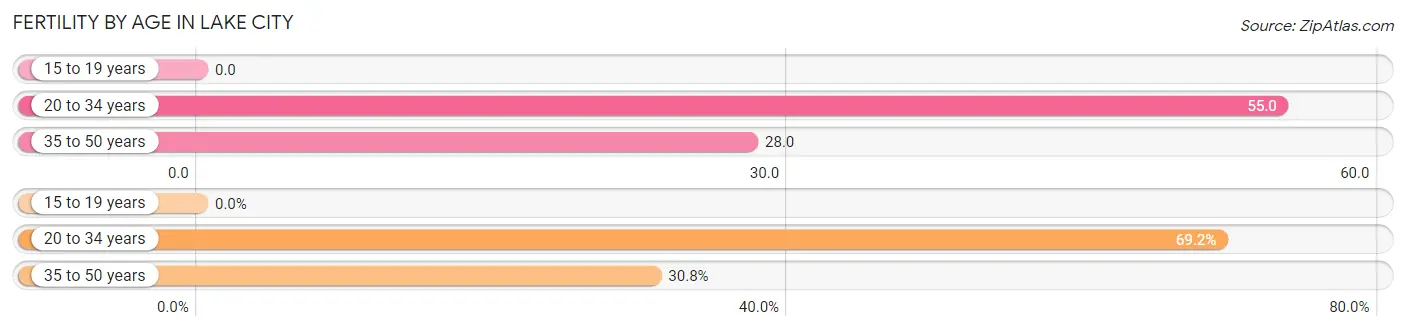
| Age Bracket | Women with Births | Births / 1,000 Women |
| 15 to 19 years | 0 (0.0%) | 0.0 |
| 20 to 34 years | 9 (69.2%) | 55.0 |
| 35 to 50 years | 4 (30.8%) | 28.0 |
| Total | 13 (100.0%) | 38.0 |
Fertility by Age by Marriage Status in Lake City
84.6% of women with births (13) in Lake City are married. The highest percentage of unmarried women with births falls into 20 to 34 years age bracket with 22.2% of them unmarried at the time of birth, while the lowest percentage of unmarried women with births belong to 35 to 50 years age bracket with 0.0% of them unmarried.
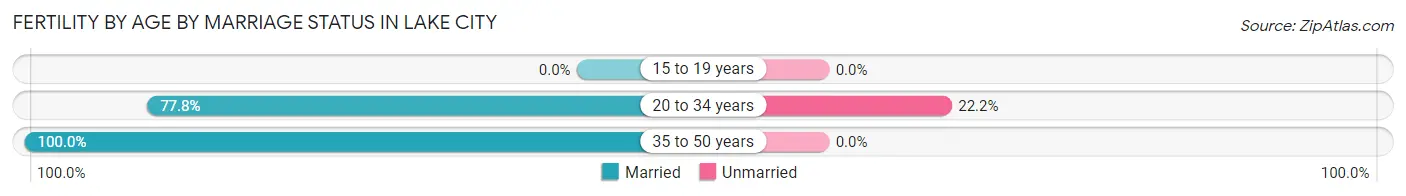
| Age Bracket | Married | Unmarried |
| 15 to 19 years | 0 (0.0%) | 0 (0.0%) |
| 20 to 34 years | 7 (77.8%) | 2 (22.2%) |
| 35 to 50 years | 4 (100.0%) | 0 (0.0%) |
| Total | 11 (84.6%) | 2 (15.4%) |
Fertility by Education in Lake City
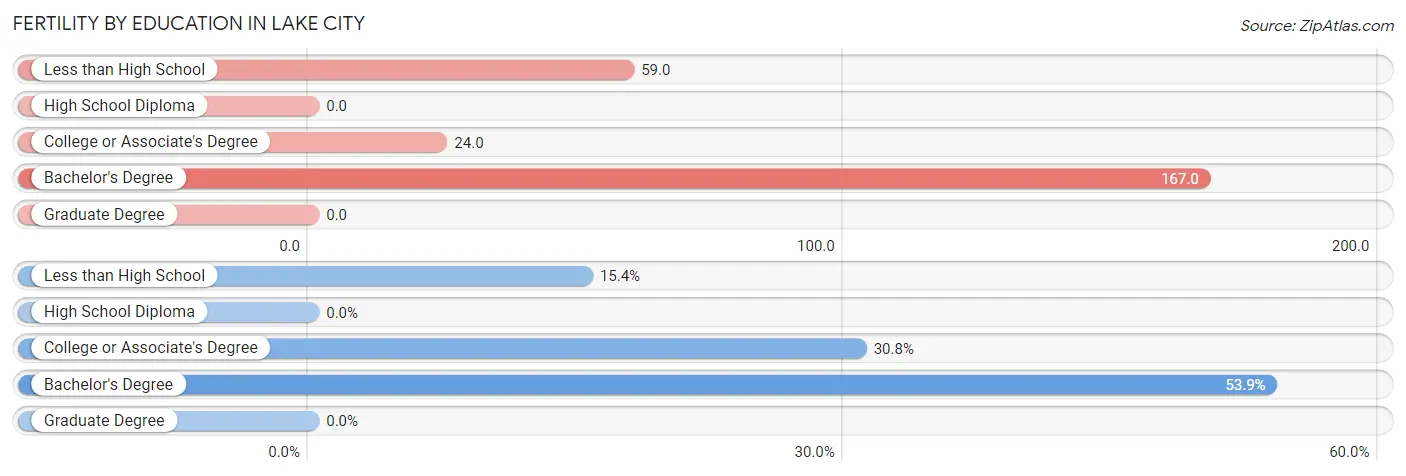
| Educational Attainment | Women with Births | Births / 1,000 Women |
| Less than High School | 2 (15.4%) | 59.0 |
| High School Diploma | 0 (0.0%) | 0.0 |
| College or Associate's Degree | 4 (30.8%) | 24.0 |
| Bachelor's Degree | 7 (53.8%) | 167.0 |
| Graduate Degree | 0 (0.0%) | 0.0 |
| Total | 13 (100.0%) | 38.0 |
Fertility by Education by Marriage Status in Lake City
15.4% of women with births in Lake City are unmarried. Women with the educational attainment of college or associate's degree are most likely to be married with 100.0% of them married at childbirth, while women with the educational attainment of less than high school are least likely to be married with 100.0% of them unmarried at childbirth.
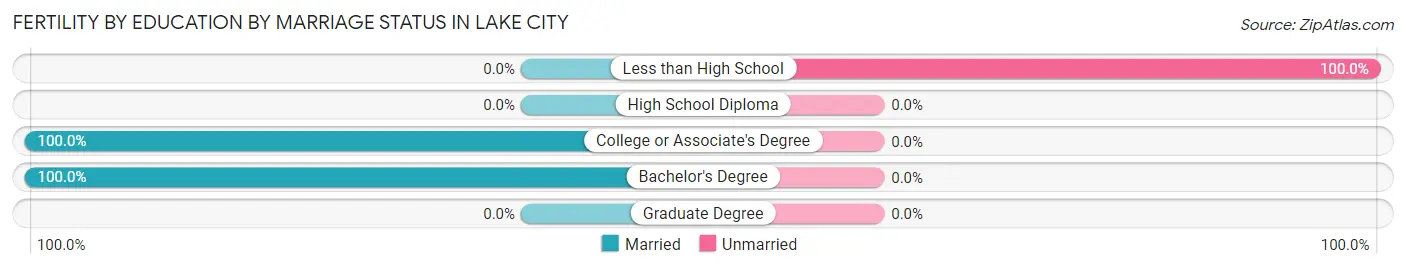
| Educational Attainment | Married | Unmarried |
| Less than High School | 0 (0.0%) | 2 (100.0%) |
| High School Diploma | 0 (0.0%) | 0 (0.0%) |
| College or Associate's Degree | 4 (100.0%) | 0 (0.0%) |
| Bachelor's Degree | 7 (100.0%) | 0 (0.0%) |
| Graduate Degree | 0 (0.0%) | 0 (0.0%) |
| Total | 11 (84.6%) | 2 (15.4%) |
Employment Characteristics in Lake City
Employment by Class of Employer in Lake City
Among the 783 employed individuals in Lake City, private company employees (429 | 54.8%), not-for-profit organizations (105 | 13.4%), and local government employees (79 | 10.1%) make up the most common classes of employment.
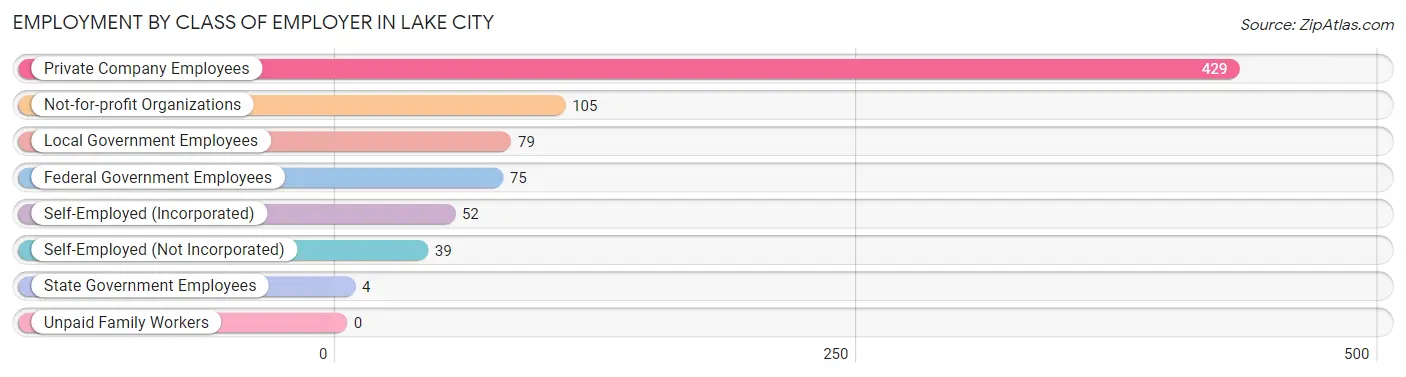
| Employer Class | # Employees | % Employees |
| Private Company Employees | 429 | 54.8% |
| Self-Employed (Incorporated) | 52 | 6.6% |
| Self-Employed (Not Incorporated) | 39 | 5.0% |
| Not-for-profit Organizations | 105 | 13.4% |
| Local Government Employees | 79 | 10.1% |
| State Government Employees | 4 | 0.5% |
| Federal Government Employees | 75 | 9.6% |
| Unpaid Family Workers | 0 | 0.0% |
| Total | 783 | 100.0% |
Employment Status by Age in Lake City
According to the labor force statistics for Lake City, out of the total population over 16 years of age (1,439), 55.9% or 804 individuals are in the labor force, with 2.0% or 16 of them unemployed. The age group with the highest labor force participation rate is 20 to 24 years, with 96.7% or 29 individuals in the labor force. Within the labor force, the 16 to 19 years age range has the highest percentage of unemployed individuals, with 8.3% or 2 of them being unemployed.
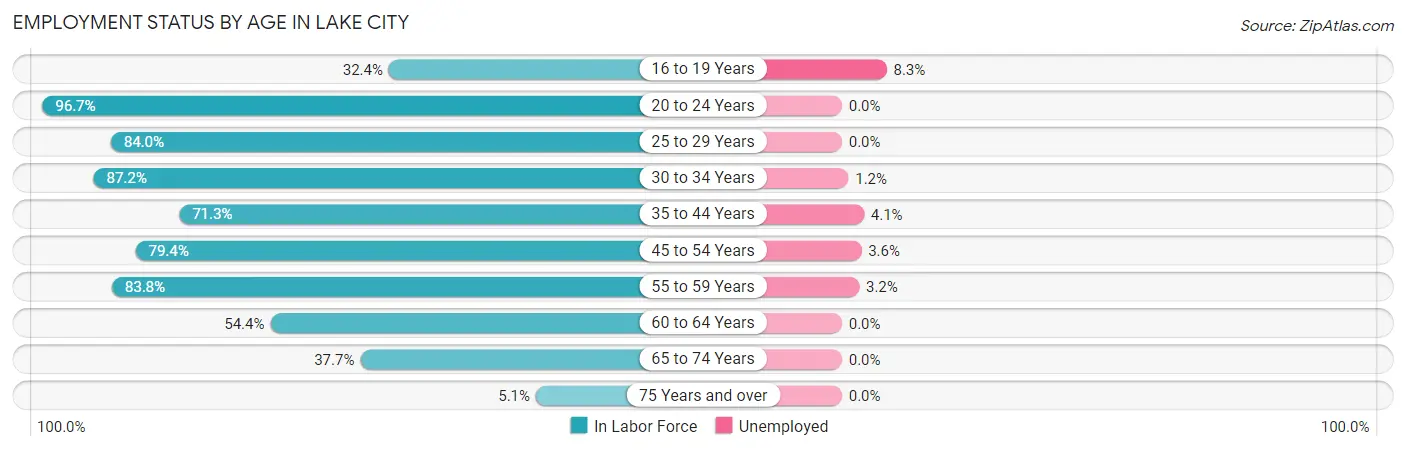
| Age Bracket | In Labor Force | Unemployed |
| 16 to 19 Years | 24 (32.4%) | 2 (8.3%) |
| 20 to 24 Years | 29 (96.7%) | 0 (0.0%) |
| 25 to 29 Years | 126 (84.0%) | 0 (0.0%) |
| 30 to 34 Years | 82 (87.2%) | 1 (1.2%) |
| 35 to 44 Years | 122 (71.3%) | 5 (4.1%) |
| 45 to 54 Years | 139 (79.4%) | 5 (3.6%) |
| 55 to 59 Years | 93 (83.8%) | 3 (3.2%) |
| 60 to 64 Years | 87 (54.4%) | 0 (0.0%) |
| 65 to 74 Years | 90 (37.7%) | 0 (0.0%) |
| 75 Years and over | 12 (5.1%) | 0 (0.0%) |
| Total | 804 (55.9%) | 16 (2.0%) |
Employment Status by Educational Attainment in Lake City
According to labor force statistics for Lake City, 75.4% of individuals (649) out of the total population between 25 and 64 years of age (861) are in the labor force, with 2.2% or 14 of them being unemployed. The group with the highest labor force participation rate are those with the educational attainment of bachelor's degree or higher, with 86.7% or 150 individuals in the labor force. Within the labor force, individuals with high school diploma education have the highest percentage of unemployment, with 4.6% or 9 of them being unemployed.
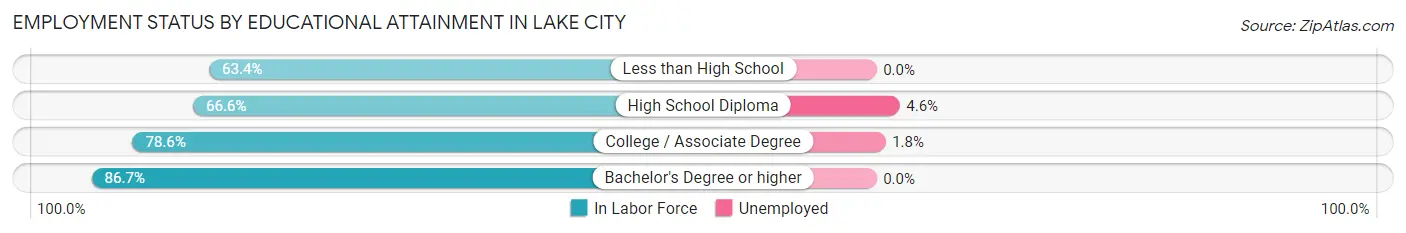
| Educational Attainment | In Labor Force | Unemployed |
| Less than High School | 26 (63.4%) | 0 (0.0%) |
| High School Diploma | 197 (66.6%) | 14 (4.6%) |
| College / Associate Degree | 276 (78.6%) | 6 (1.8%) |
| Bachelor's Degree or higher | 150 (86.7%) | 0 (0.0%) |
| Total | 649 (75.4%) | 19 (2.2%) |
Employment Occupations by Sex in Lake City
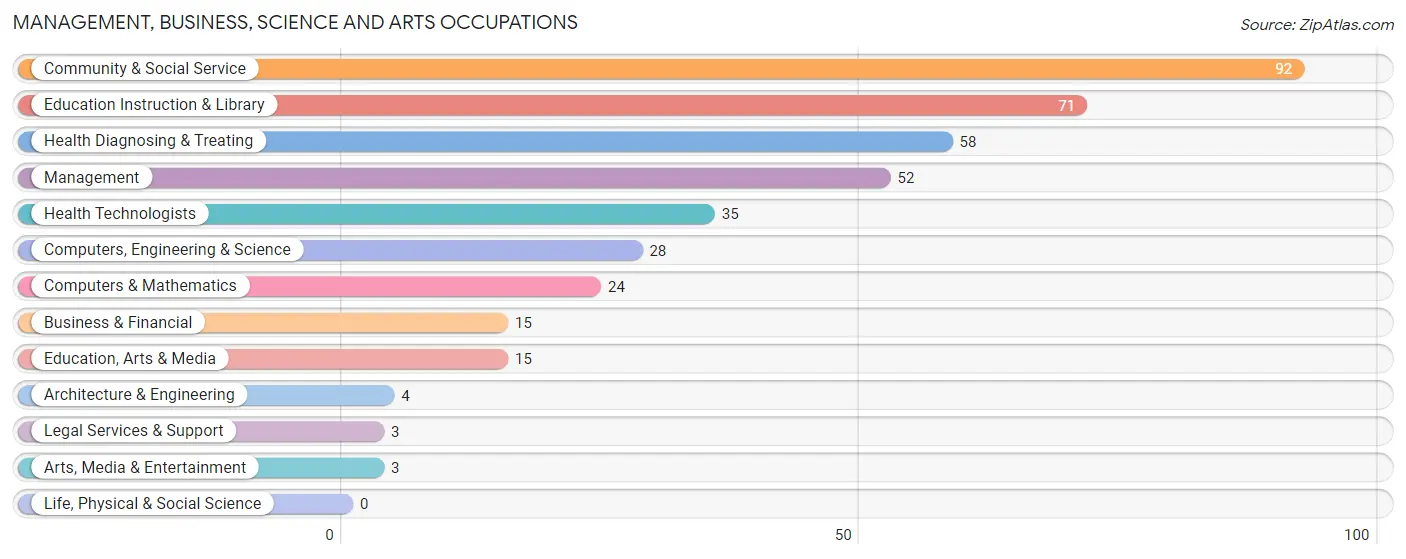
Management, Business, Science and Arts Occupations
The most common Management, Business, Science and Arts occupations in Lake City are Community & Social Service (92 | 11.7%), Education Instruction & Library (71 | 9.0%), Health Diagnosing & Treating (58 | 7.4%), Management (52 | 6.6%), and Health Technologists (35 | 4.4%).
Management, Business, Science and Arts Occupations by Sex
Within the Management, Business, Science and Arts occupations in Lake City, the most male-oriented occupations are Computers, Engineering & Science (100.0%), Computers & Mathematics (100.0%), and Architecture & Engineering (100.0%), while the most female-oriented occupations are Legal Services & Support (100.0%), Arts, Media & Entertainment (100.0%), and Health Diagnosing & Treating (100.0%).
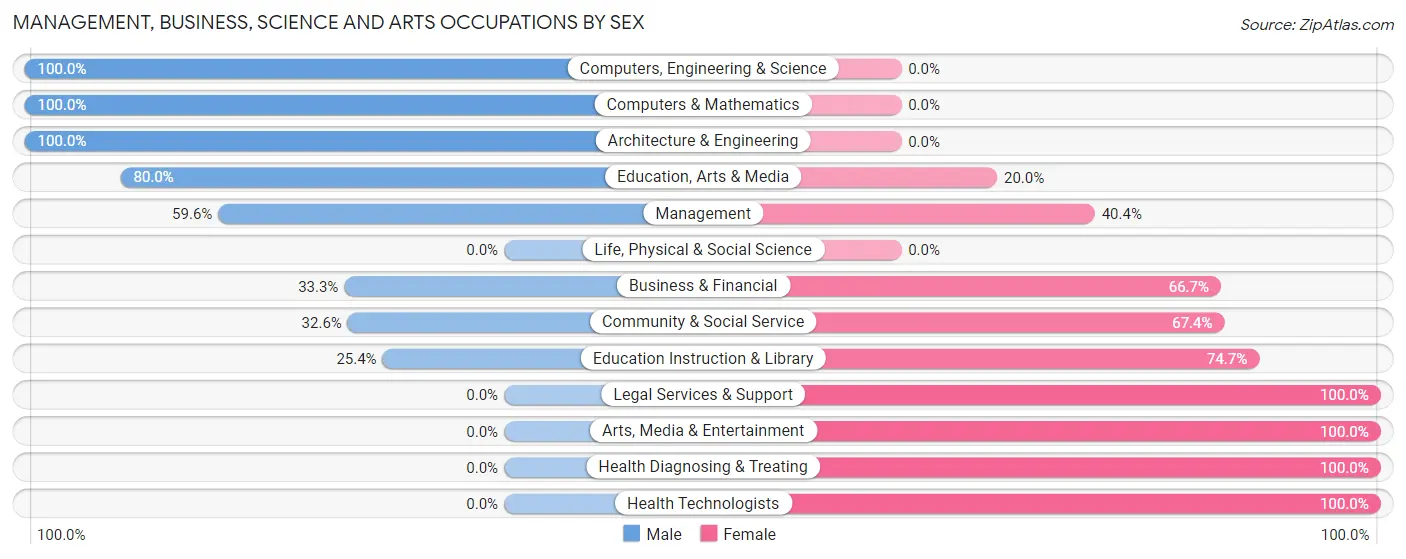
| Occupation | Male | Female |
| Management | 31 (59.6%) | 21 (40.4%) |
| Business & Financial | 5 (33.3%) | 10 (66.7%) |
| Computers, Engineering & Science | 28 (100.0%) | 0 (0.0%) |
| Computers & Mathematics | 24 (100.0%) | 0 (0.0%) |
| Architecture & Engineering | 4 (100.0%) | 0 (0.0%) |
| Life, Physical & Social Science | 0 (0.0%) | 0 (0.0%) |
| Community & Social Service | 30 (32.6%) | 62 (67.4%) |
| Education, Arts & Media | 12 (80.0%) | 3 (20.0%) |
| Legal Services & Support | 0 (0.0%) | 3 (100.0%) |
| Education Instruction & Library | 18 (25.4%) | 53 (74.7%) |
| Arts, Media & Entertainment | 0 (0.0%) | 3 (100.0%) |
| Health Diagnosing & Treating | 0 (0.0%) | 58 (100.0%) |
| Health Technologists | 0 (0.0%) | 35 (100.0%) |
| Total (Category) | 94 (38.4%) | 151 (61.6%) |
| Total (Overall) | 386 (49.0%) | 402 (51.0%) |
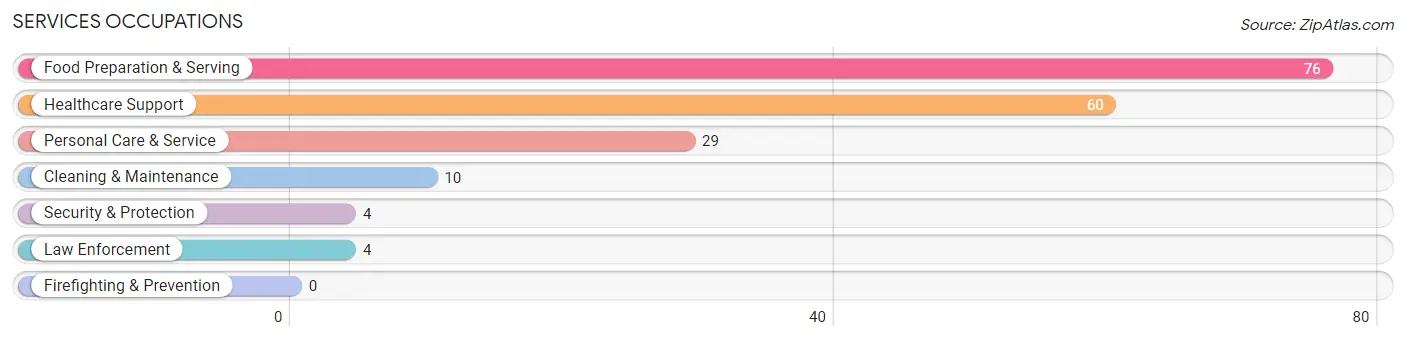
Services Occupations
The most common Services occupations in Lake City are Food Preparation & Serving (76 | 9.6%), Healthcare Support (60 | 7.6%), Personal Care & Service (29 | 3.7%), Cleaning & Maintenance (10 | 1.3%), and Security & Protection (4 | 0.5%).
Services Occupations by Sex
Within the Services occupations in Lake City, the most male-oriented occupations are Security & Protection (100.0%), Law Enforcement (100.0%), and Cleaning & Maintenance (50.0%), while the most female-oriented occupations are Healthcare Support (100.0%), Personal Care & Service (86.2%), and Food Preparation & Serving (64.5%).
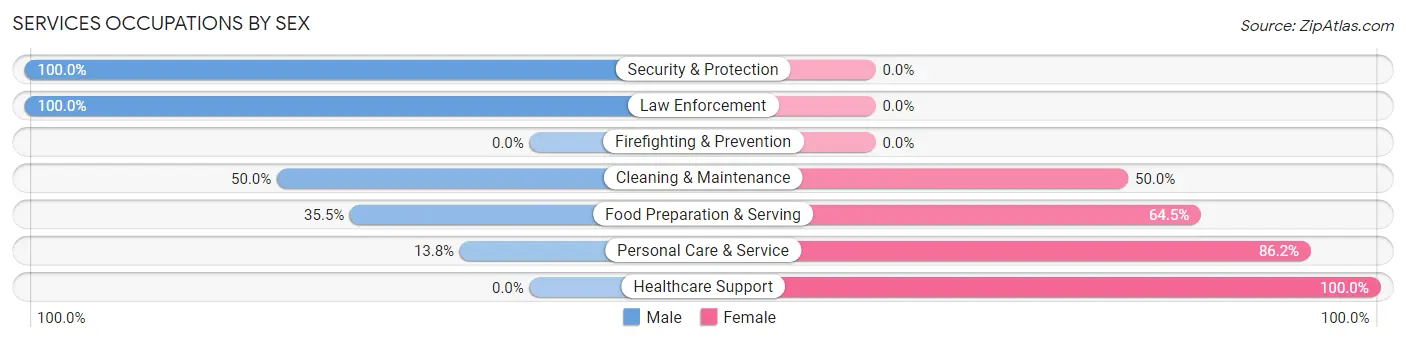
| Occupation | Male | Female |
| Healthcare Support | 0 (0.0%) | 60 (100.0%) |
| Security & Protection | 4 (100.0%) | 0 (0.0%) |
| Firefighting & Prevention | 0 (0.0%) | 0 (0.0%) |
| Law Enforcement | 4 (100.0%) | 0 (0.0%) |
| Food Preparation & Serving | 27 (35.5%) | 49 (64.5%) |
| Cleaning & Maintenance | 5 (50.0%) | 5 (50.0%) |
| Personal Care & Service | 4 (13.8%) | 25 (86.2%) |
| Total (Category) | 40 (22.4%) | 139 (77.6%) |
| Total (Overall) | 386 (49.0%) | 402 (51.0%) |
Sales and Office Occupations
The most common Sales and Office occupations in Lake City are Sales & Related (76 | 9.6%), and Office & Administration (50 | 6.4%).
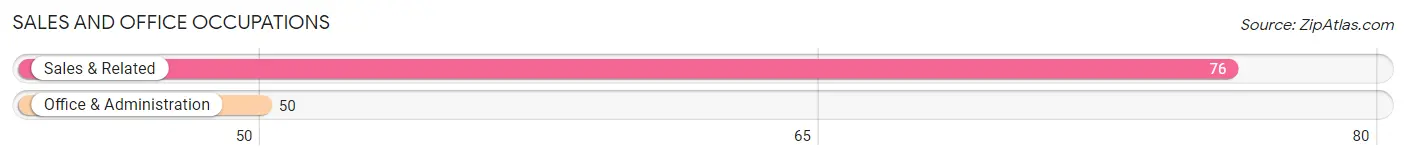
Sales and Office Occupations by Sex
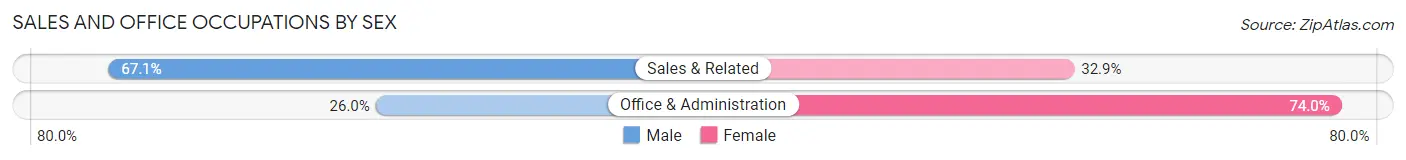
| Occupation | Male | Female |
| Sales & Related | 51 (67.1%) | 25 (32.9%) |
| Office & Administration | 13 (26.0%) | 37 (74.0%) |
| Total (Category) | 64 (50.8%) | 62 (49.2%) |
| Total (Overall) | 386 (49.0%) | 402 (51.0%) |
Natural Resources, Construction and Maintenance Occupations
The most common Natural Resources, Construction and Maintenance occupations in Lake City are Installation, Maintenance & Repair (40 | 5.1%), Construction & Extraction (24 | 3.0%), and Farming, Fishing & Forestry (16 | 2.0%).
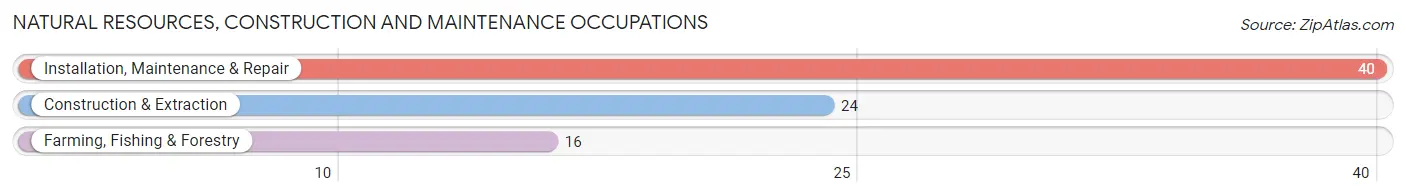
Natural Resources, Construction and Maintenance Occupations by Sex
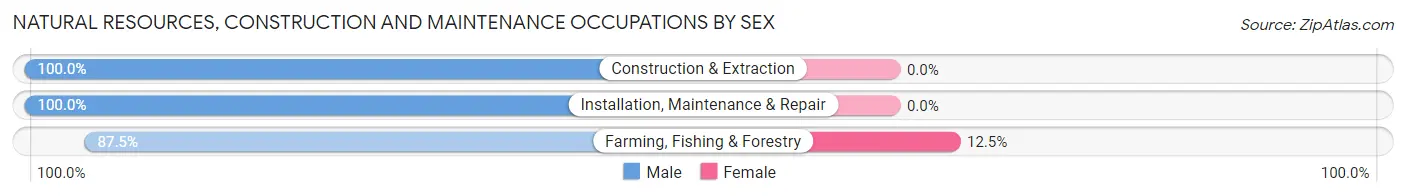
| Occupation | Male | Female |
| Farming, Fishing & Forestry | 14 (87.5%) | 2 (12.5%) |
| Construction & Extraction | 24 (100.0%) | 0 (0.0%) |
| Installation, Maintenance & Repair | 40 (100.0%) | 0 (0.0%) |
| Total (Category) | 78 (97.5%) | 2 (2.5%) |
| Total (Overall) | 386 (49.0%) | 402 (51.0%) |
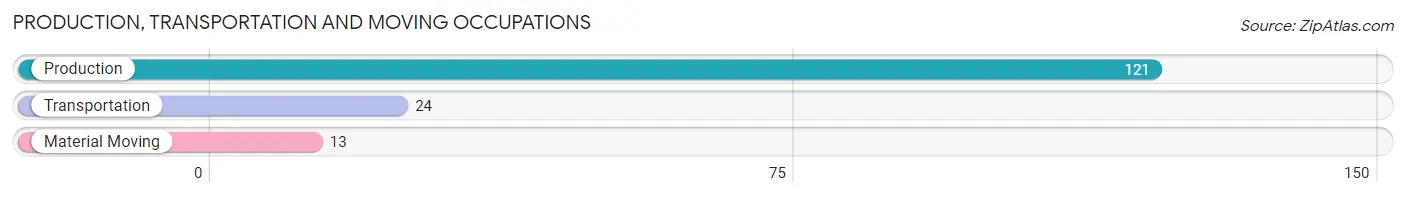
Production, Transportation and Moving Occupations
The most common Production, Transportation and Moving occupations in Lake City are Production (121 | 15.4%), Transportation (24 | 3.0%), and Material Moving (13 | 1.7%).
Production, Transportation and Moving Occupations by Sex
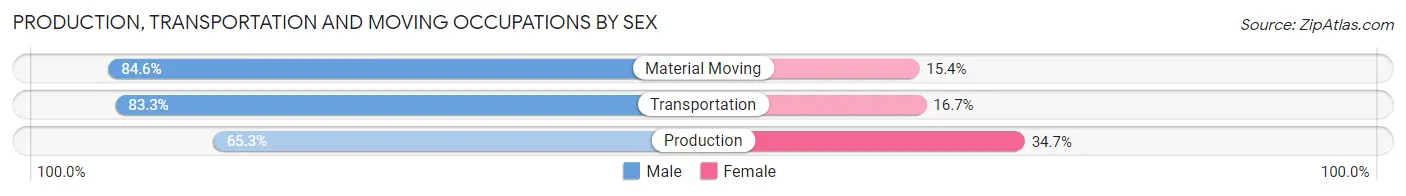
| Occupation | Male | Female |
| Production | 79 (65.3%) | 42 (34.7%) |
| Transportation | 20 (83.3%) | 4 (16.7%) |
| Material Moving | 11 (84.6%) | 2 (15.4%) |
| Total (Category) | 110 (69.6%) | 48 (30.4%) |
| Total (Overall) | 386 (49.0%) | 402 (51.0%) |
Employment Industries by Sex in Lake City
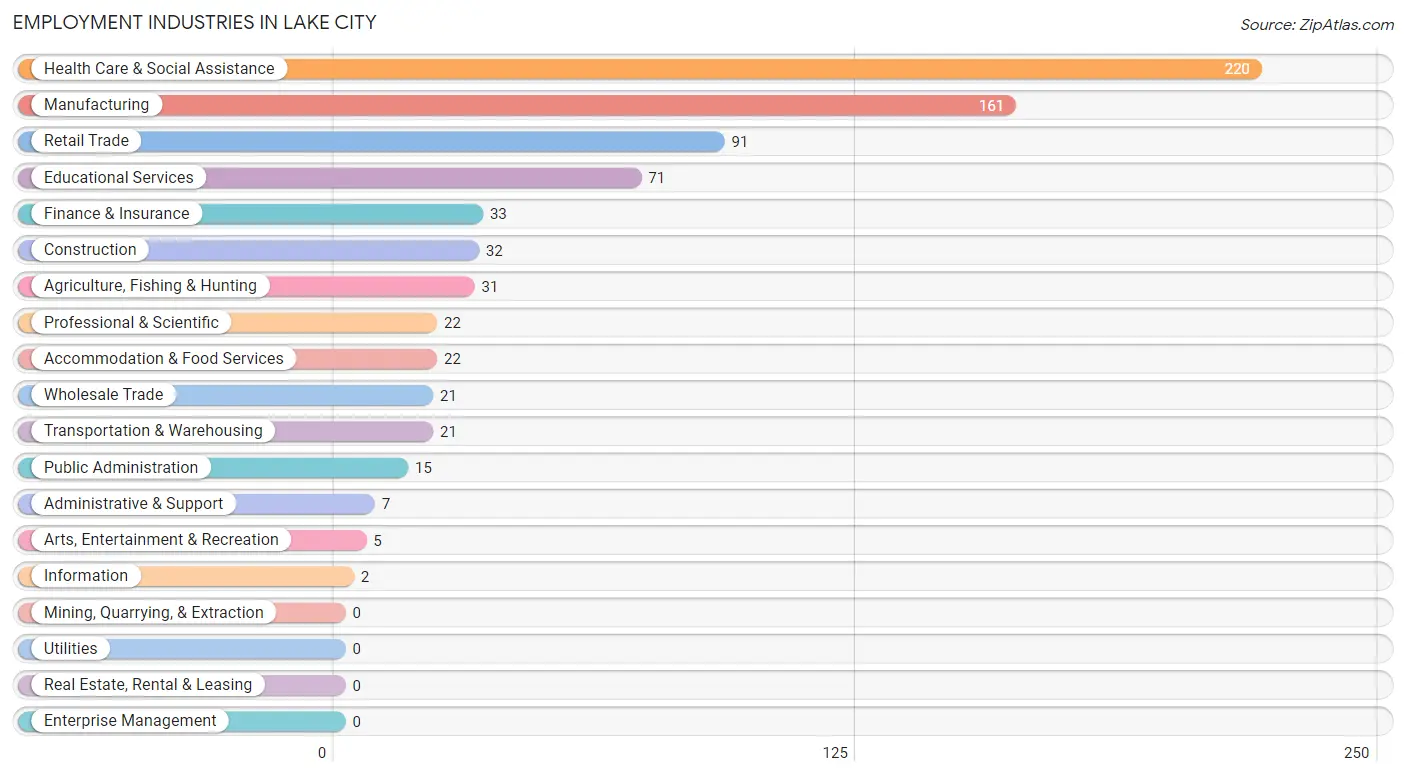
Employment Industries in Lake City
The major employment industries in Lake City include Health Care & Social Assistance (220 | 27.9%), Manufacturing (161 | 20.4%), Retail Trade (91 | 11.6%), Educational Services (71 | 9.0%), and Finance & Insurance (33 | 4.2%).
Employment Industries by Sex in Lake City
The Lake City industries that see more men than women are Construction (100.0%), Wholesale Trade (100.0%), and Transportation & Warehousing (100.0%), whereas the industries that tend to have a higher number of women are Information (100.0%), Administrative & Support (100.0%), and Health Care & Social Assistance (95.0%).
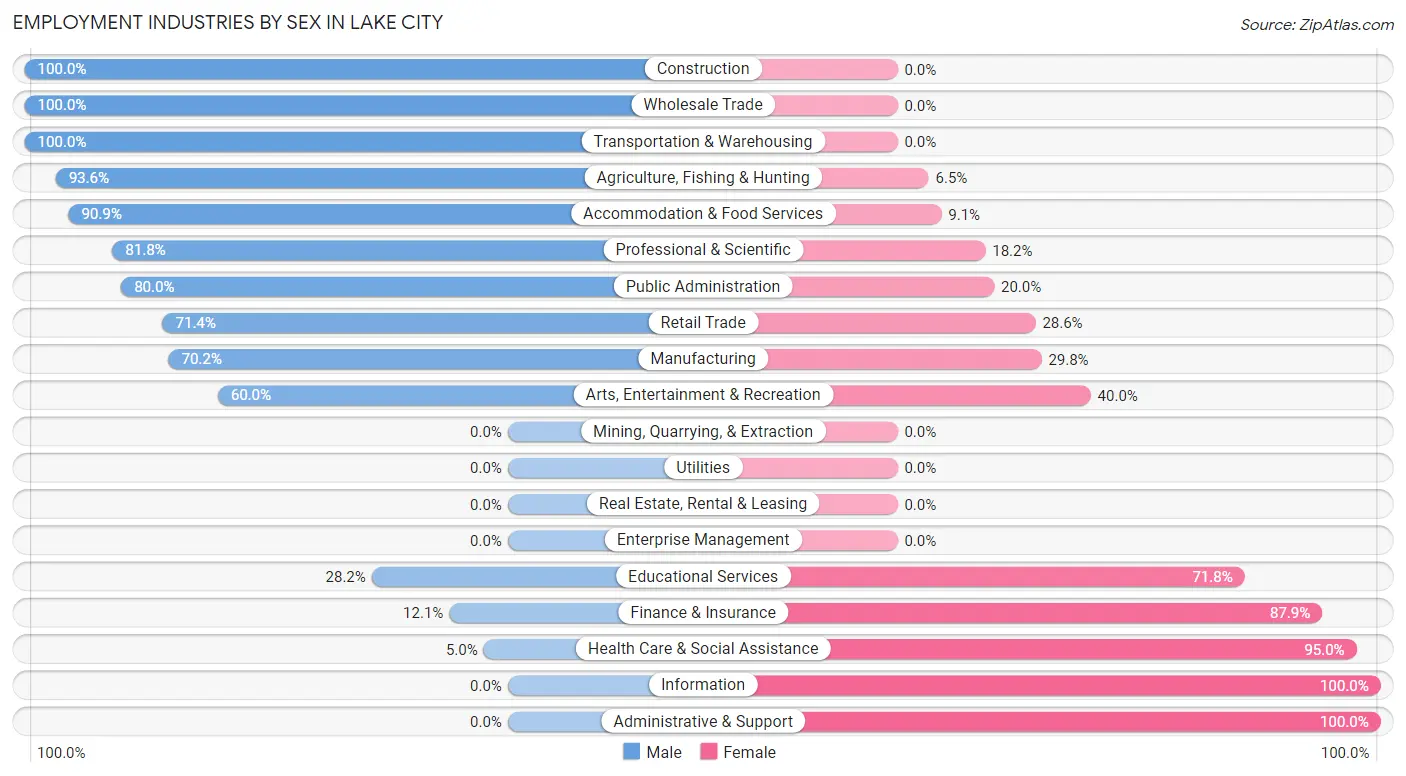
| Industry | Male | Female |
| Agriculture, Fishing & Hunting | 29 (93.5%) | 2 (6.5%) |
| Mining, Quarrying, & Extraction | 0 (0.0%) | 0 (0.0%) |
| Construction | 32 (100.0%) | 0 (0.0%) |
| Manufacturing | 113 (70.2%) | 48 (29.8%) |
| Wholesale Trade | 21 (100.0%) | 0 (0.0%) |
| Retail Trade | 65 (71.4%) | 26 (28.6%) |
| Transportation & Warehousing | 21 (100.0%) | 0 (0.0%) |
| Utilities | 0 (0.0%) | 0 (0.0%) |
| Information | 0 (0.0%) | 2 (100.0%) |
| Finance & Insurance | 4 (12.1%) | 29 (87.9%) |
| Real Estate, Rental & Leasing | 0 (0.0%) | 0 (0.0%) |
| Professional & Scientific | 18 (81.8%) | 4 (18.2%) |
| Enterprise Management | 0 (0.0%) | 0 (0.0%) |
| Administrative & Support | 0 (0.0%) | 7 (100.0%) |
| Educational Services | 20 (28.2%) | 51 (71.8%) |
| Health Care & Social Assistance | 11 (5.0%) | 209 (95.0%) |
| Arts, Entertainment & Recreation | 3 (60.0%) | 2 (40.0%) |
| Accommodation & Food Services | 20 (90.9%) | 2 (9.1%) |
| Public Administration | 12 (80.0%) | 3 (20.0%) |
| Total | 386 (49.0%) | 402 (51.0%) |
Education in Lake City
School Enrollment in Lake City
The most common levels of schooling among the 279 students in Lake City are elementary school (105 | 37.6%), high school (48 | 17.2%), and middle school (38 | 13.6%).
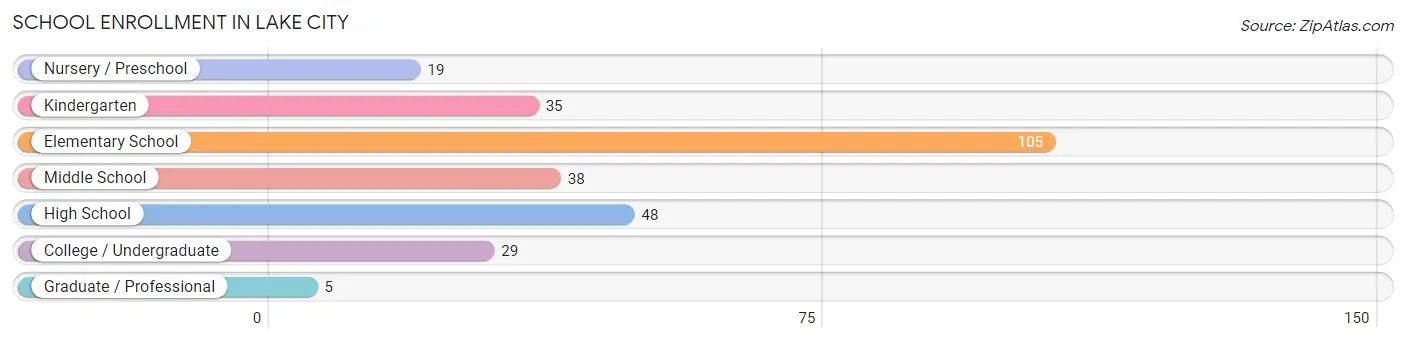
| School Level | # Students | % Students |
| Nursery / Preschool | 19 | 6.8% |
| Kindergarten | 35 | 12.5% |
| Elementary School | 105 | 37.6% |
| Middle School | 38 | 13.6% |
| High School | 48 | 17.2% |
| College / Undergraduate | 29 | 10.4% |
| Graduate / Professional | 5 | 1.8% |
| Total | 279 | 100.0% |
School Enrollment by Age by Funding Source in Lake City
Out of a total of 279 students who are enrolled in schools in Lake City, 39 (14.0%) attend a private institution, while the remaining 240 (86.0%) are enrolled in public schools. The age group of 25 to 34 year olds has the highest likelihood of being enrolled in private schools, with 3 (42.9% in the age bracket) enrolled. Conversely, the age group of 3 to 4 year olds has the lowest likelihood of being enrolled in a private school, with 19 (100.0% in the age bracket) attending a public institution.
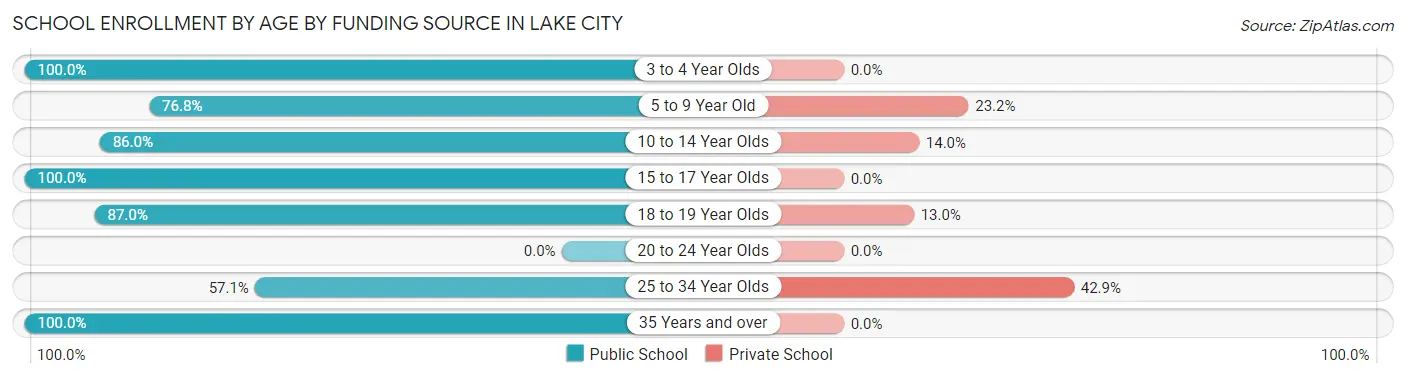
| Age Bracket | Public School | Private School |
| 3 to 4 Year Olds | 19 (100.0%) | 0 (0.0%) |
| 5 to 9 Year Old | 86 (76.8%) | 26 (23.2%) |
| 10 to 14 Year Olds | 43 (86.0%) | 7 (14.0%) |
| 15 to 17 Year Olds | 57 (100.0%) | 0 (0.0%) |
| 18 to 19 Year Olds | 20 (87.0%) | 3 (13.0%) |
| 20 to 24 Year Olds | 0 (0.0%) | 0 (0.0%) |
| 25 to 34 Year Olds | 4 (57.1%) | 3 (42.9%) |
| 35 Years and over | 11 (100.0%) | 0 (0.0%) |
| Total | 240 (86.0%) | 39 (14.0%) |
Educational Attainment by Field of Study in Lake City
Education (114 | 40.6%), bio, nature & agricultural (29 | 10.3%), science & technology (28 | 10.0%), social sciences (25 | 8.9%), and business (25 | 8.9%) are the most common fields of study among 281 individuals in Lake City who have obtained a bachelor's degree or higher.
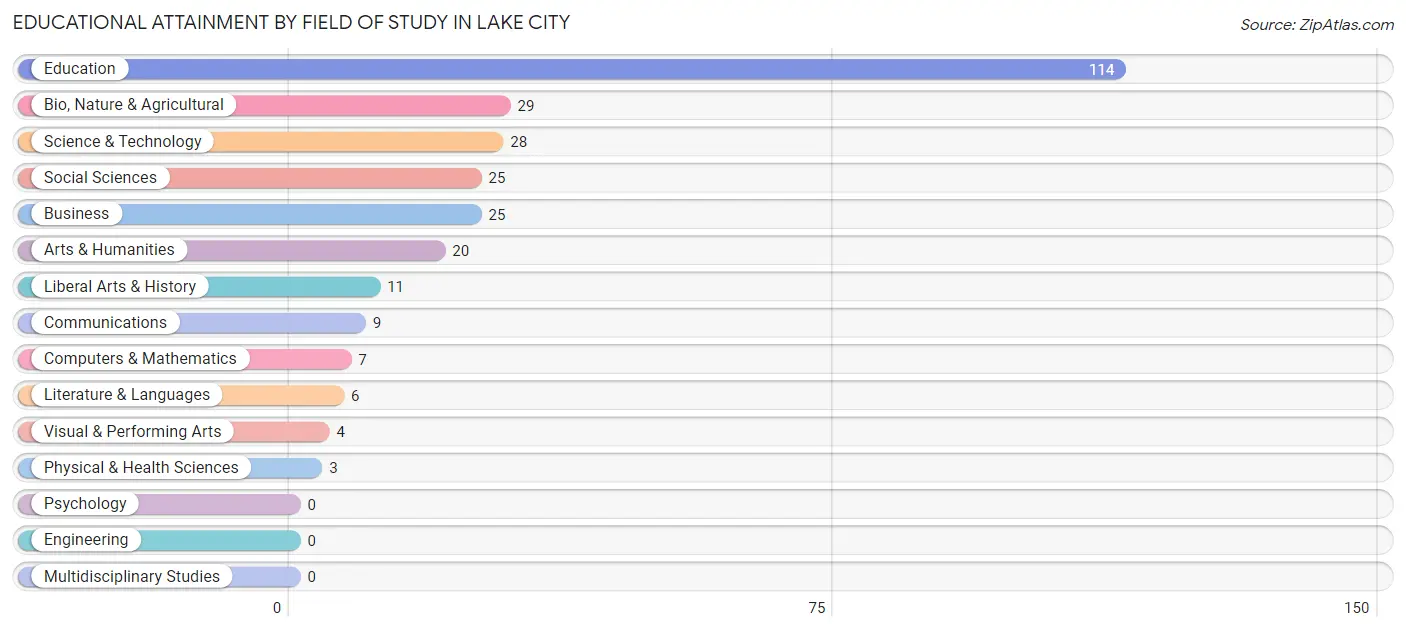
| Field of Study | # Graduates | % Graduates |
| Computers & Mathematics | 7 | 2.5% |
| Bio, Nature & Agricultural | 29 | 10.3% |
| Physical & Health Sciences | 3 | 1.1% |
| Psychology | 0 | 0.0% |
| Social Sciences | 25 | 8.9% |
| Engineering | 0 | 0.0% |
| Multidisciplinary Studies | 0 | 0.0% |
| Science & Technology | 28 | 10.0% |
| Business | 25 | 8.9% |
| Education | 114 | 40.6% |
| Literature & Languages | 6 | 2.1% |
| Liberal Arts & History | 11 | 3.9% |
| Visual & Performing Arts | 4 | 1.4% |
| Communications | 9 | 3.2% |
| Arts & Humanities | 20 | 7.1% |
| Total | 281 | 100.0% |
Transportation & Commute in Lake City
Vehicle Availability by Sex in Lake City
The most prevalent vehicle ownership categories in Lake City are males with 2 vehicles (212, accounting for 54.9%) and females with 2 vehicles (156, making up 53.4%).
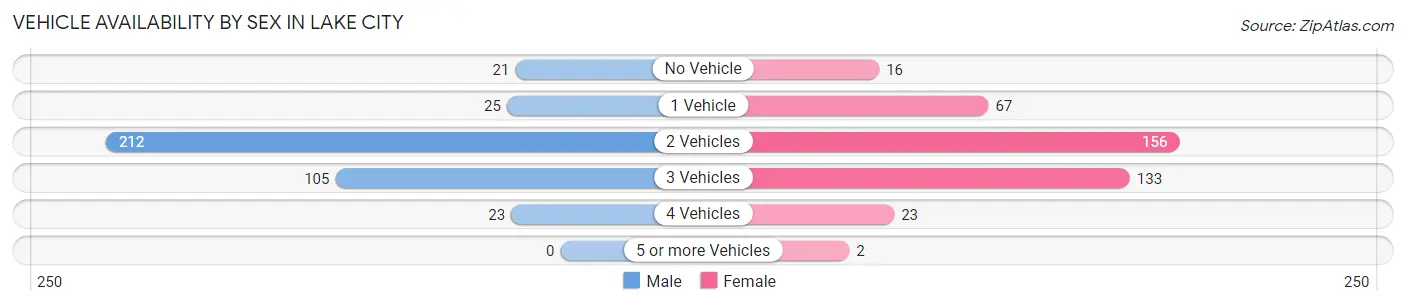
| Vehicles Available | Male | Female |
| No Vehicle | 21 (5.4%) | 16 (4.0%) |
| 1 Vehicle | 25 (6.5%) | 67 (16.9%) |
| 2 Vehicles | 212 (54.9%) | 156 (39.3%) |
| 3 Vehicles | 105 (27.2%) | 133 (33.5%) |
| 4 Vehicles | 23 (6.0%) | 23 (5.8%) |
| 5 or more Vehicles | 0 (0.0%) | 2 (0.5%) |
| Total | 386 (100.0%) | 397 (100.0%) |
Commute Time in Lake City
The most frequently occuring commute durations in Lake City are 5 to 9 minutes (217 commuters, 28.4%), less than 5 minutes (161 commuters, 21.0%), and 30 to 34 minutes (89 commuters, 11.6%).
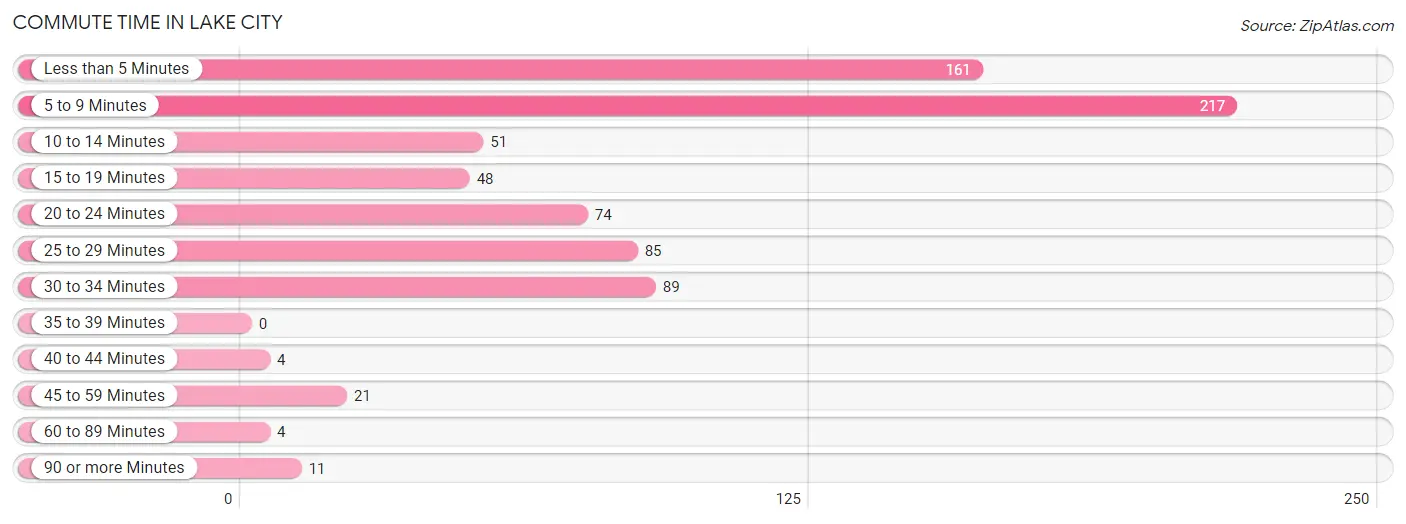
| Commute Time | # Commuters | % Commuters |
| Less than 5 Minutes | 161 | 21.0% |
| 5 to 9 Minutes | 217 | 28.4% |
| 10 to 14 Minutes | 51 | 6.7% |
| 15 to 19 Minutes | 48 | 6.3% |
| 20 to 24 Minutes | 74 | 9.7% |
| 25 to 29 Minutes | 85 | 11.1% |
| 30 to 34 Minutes | 89 | 11.6% |
| 35 to 39 Minutes | 0 | 0.0% |
| 40 to 44 Minutes | 4 | 0.5% |
| 45 to 59 Minutes | 21 | 2.8% |
| 60 to 89 Minutes | 4 | 0.5% |
| 90 or more Minutes | 11 | 1.4% |
Commute Time by Sex in Lake City
The most common commute times in Lake City are less than 5 minutes (86 commuters, 22.5%) for males and 5 to 9 minutes (133 commuters, 34.7%) for females.
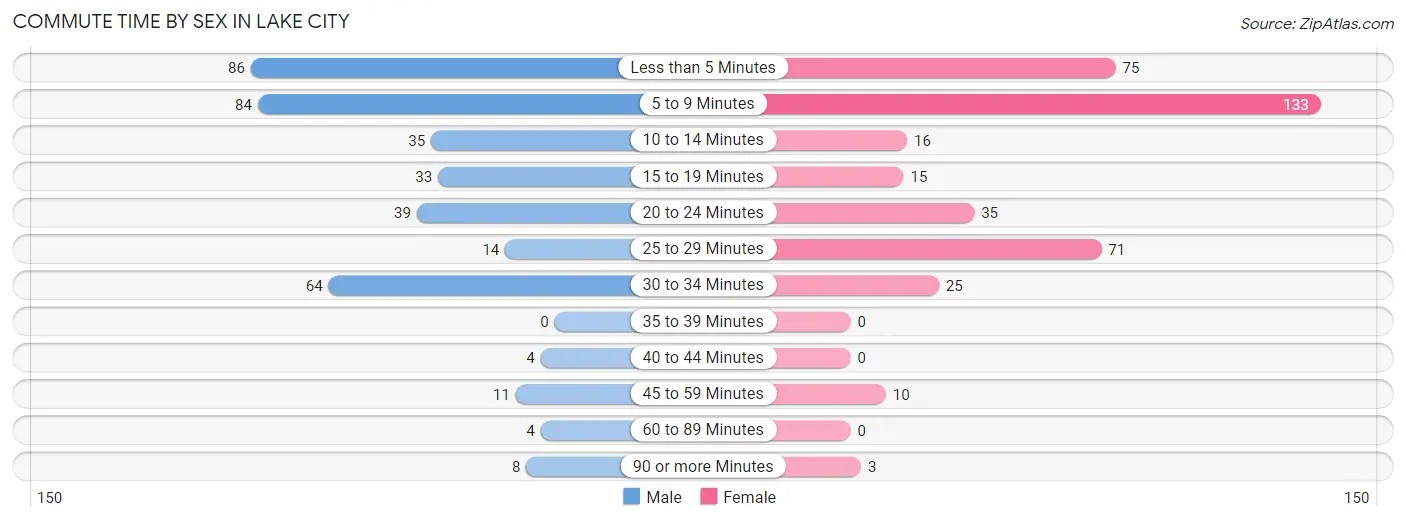
| Commute Time | Male | Female |
| Less than 5 Minutes | 86 (22.5%) | 75 (19.6%) |
| 5 to 9 Minutes | 84 (22.0%) | 133 (34.7%) |
| 10 to 14 Minutes | 35 (9.2%) | 16 (4.2%) |
| 15 to 19 Minutes | 33 (8.6%) | 15 (3.9%) |
| 20 to 24 Minutes | 39 (10.2%) | 35 (9.1%) |
| 25 to 29 Minutes | 14 (3.7%) | 71 (18.5%) |
| 30 to 34 Minutes | 64 (16.8%) | 25 (6.5%) |
| 35 to 39 Minutes | 0 (0.0%) | 0 (0.0%) |
| 40 to 44 Minutes | 4 (1.1%) | 0 (0.0%) |
| 45 to 59 Minutes | 11 (2.9%) | 10 (2.6%) |
| 60 to 89 Minutes | 4 (1.1%) | 0 (0.0%) |
| 90 or more Minutes | 8 (2.1%) | 3 (0.8%) |
Time of Departure to Work by Sex in Lake City
The most frequent times of departure to work in Lake City are 8:00 AM to 8:29 AM (88, 23.0%) for males and 7:30 AM to 7:59 AM (88, 23.0%) for females.
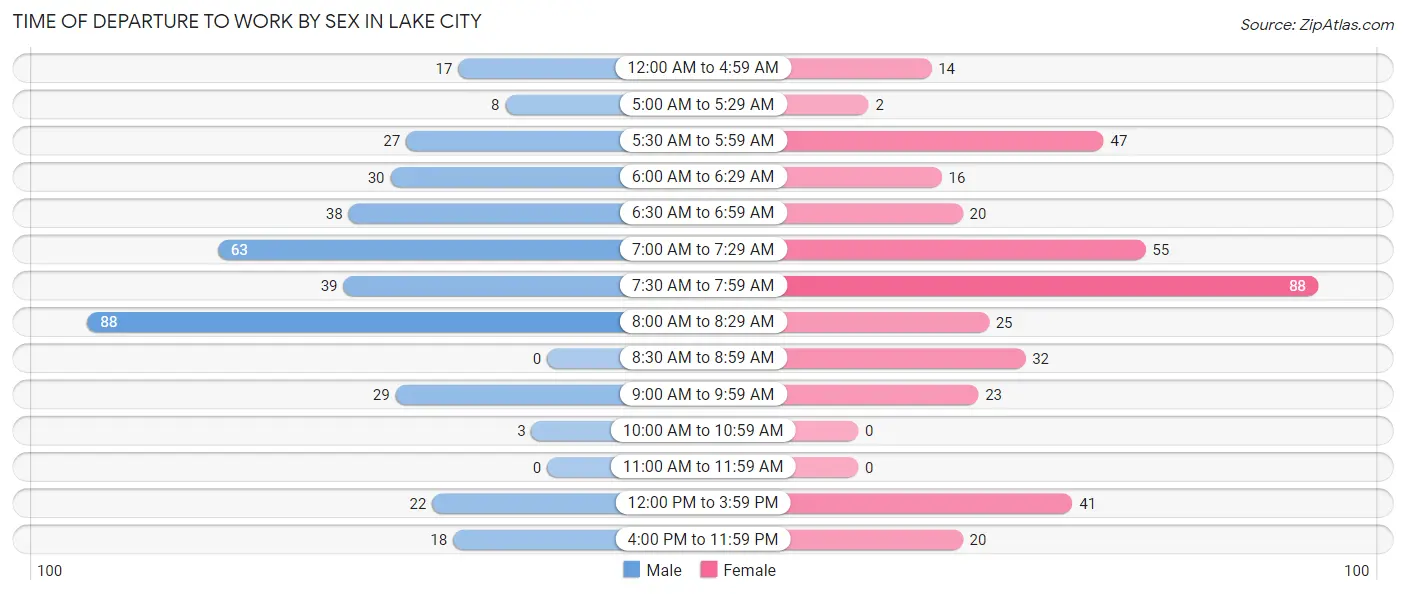
| Time of Departure | Male | Female |
| 12:00 AM to 4:59 AM | 17 (4.4%) | 14 (3.7%) |
| 5:00 AM to 5:29 AM | 8 (2.1%) | 2 (0.5%) |
| 5:30 AM to 5:59 AM | 27 (7.1%) | 47 (12.3%) |
| 6:00 AM to 6:29 AM | 30 (7.9%) | 16 (4.2%) |
| 6:30 AM to 6:59 AM | 38 (10.0%) | 20 (5.2%) |
| 7:00 AM to 7:29 AM | 63 (16.5%) | 55 (14.4%) |
| 7:30 AM to 7:59 AM | 39 (10.2%) | 88 (23.0%) |
| 8:00 AM to 8:29 AM | 88 (23.0%) | 25 (6.5%) |
| 8:30 AM to 8:59 AM | 0 (0.0%) | 32 (8.4%) |
| 9:00 AM to 9:59 AM | 29 (7.6%) | 23 (6.0%) |
| 10:00 AM to 10:59 AM | 3 (0.8%) | 0 (0.0%) |
| 11:00 AM to 11:59 AM | 0 (0.0%) | 0 (0.0%) |
| 12:00 PM to 3:59 PM | 22 (5.8%) | 41 (10.7%) |
| 4:00 PM to 11:59 PM | 18 (4.7%) | 20 (5.2%) |
| Total | 382 (100.0%) | 383 (100.0%) |
Housing Occupancy in Lake City
Occupancy by Ownership in Lake City
Of the total 683 dwellings in Lake City, owner-occupied units account for 515 (75.4%), while renter-occupied units make up 168 (24.6%).
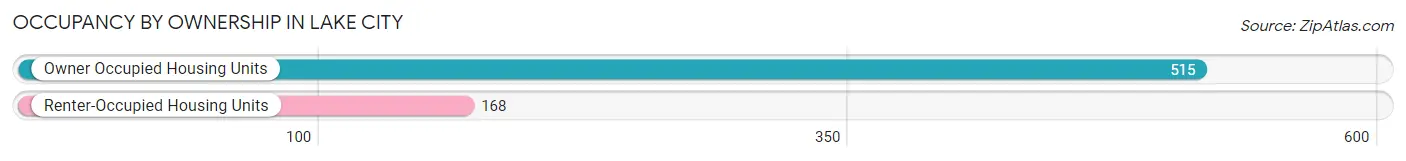
| Occupancy | # Housing Units | % Housing Units |
| Owner Occupied Housing Units | 515 | 75.4% |
| Renter-Occupied Housing Units | 168 | 24.6% |
| Total Occupied Housing Units | 683 | 100.0% |
Occupancy by Household Size in Lake City
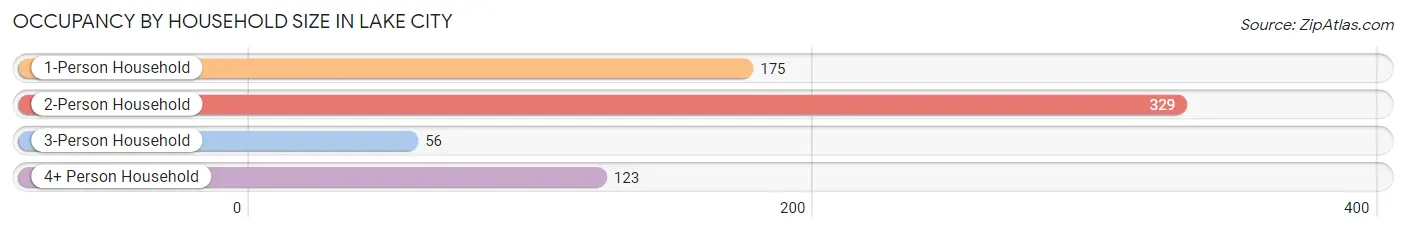
| Household Size | # Housing Units | % Housing Units |
| 1-Person Household | 175 | 25.6% |
| 2-Person Household | 329 | 48.2% |
| 3-Person Household | 56 | 8.2% |
| 4+ Person Household | 123 | 18.0% |
| Total Housing Units | 683 | 100.0% |
Occupancy by Ownership by Household Size in Lake City
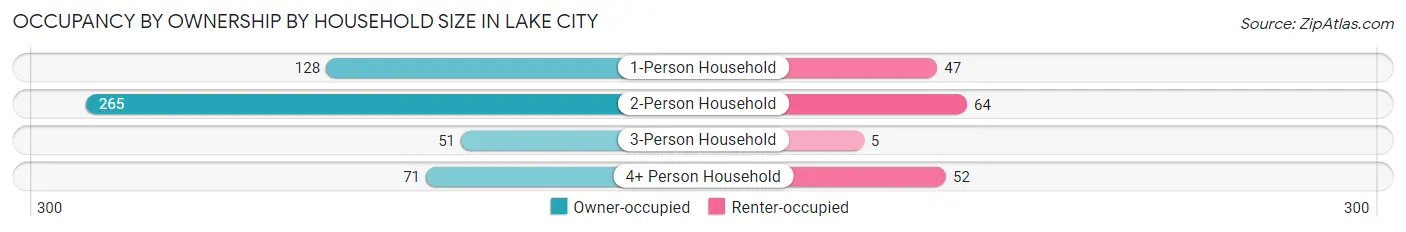
| Household Size | Owner-occupied | Renter-occupied |
| 1-Person Household | 128 (73.1%) | 47 (26.9%) |
| 2-Person Household | 265 (80.5%) | 64 (19.5%) |
| 3-Person Household | 51 (91.1%) | 5 (8.9%) |
| 4+ Person Household | 71 (57.7%) | 52 (42.3%) |
| Total Housing Units | 515 (75.4%) | 168 (24.6%) |
Occupancy by Educational Attainment in Lake City
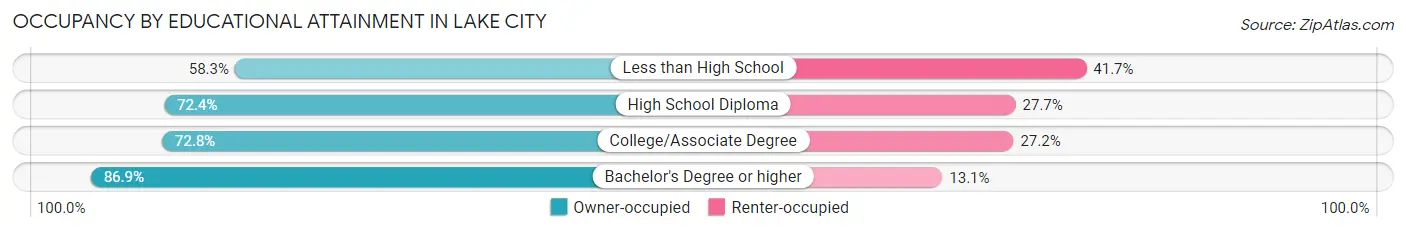
| Household Size | Owner-occupied | Renter-occupied |
| Less than High School | 14 (58.3%) | 10 (41.7%) |
| High School Diploma | 191 (72.4%) | 73 (27.7%) |
| College/Associate Degree | 171 (72.8%) | 64 (27.2%) |
| Bachelor's Degree or higher | 139 (86.9%) | 21 (13.1%) |
Occupancy by Age of Householder in Lake City
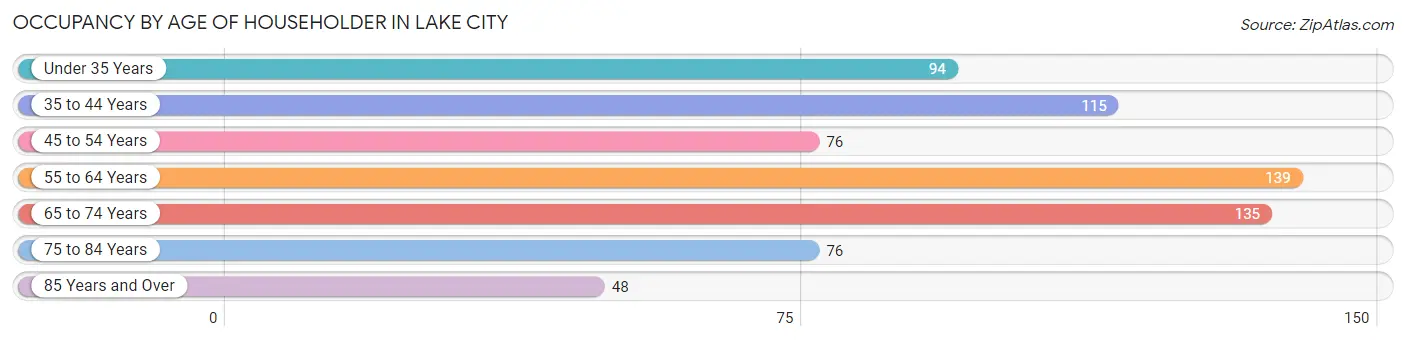
| Age Bracket | # Households | % Households |
| Under 35 Years | 94 | 13.8% |
| 35 to 44 Years | 115 | 16.8% |
| 45 to 54 Years | 76 | 11.1% |
| 55 to 64 Years | 139 | 20.3% |
| 65 to 74 Years | 135 | 19.8% |
| 75 to 84 Years | 76 | 11.1% |
| 85 Years and Over | 48 | 7.0% |
| Total | 683 | 100.0% |
Housing Finances in Lake City
Median Income by Occupancy in Lake City
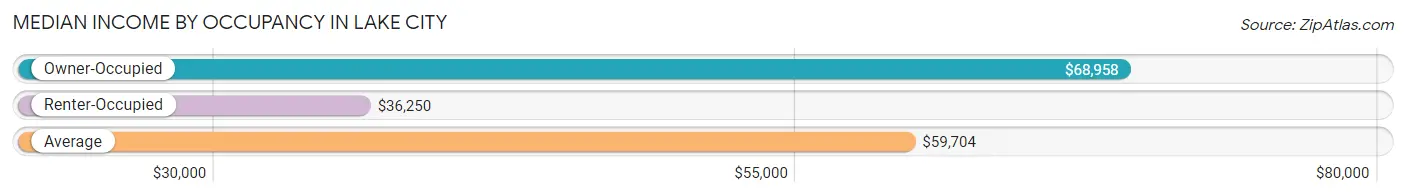
| Occupancy Type | # Households | Median Income |
| Owner-Occupied | 515 (75.4%) | $68,958 |
| Renter-Occupied | 168 (24.6%) | $36,250 |
| Average | 683 (100.0%) | $59,704 |
Occupancy by Householder Income Bracket in Lake City
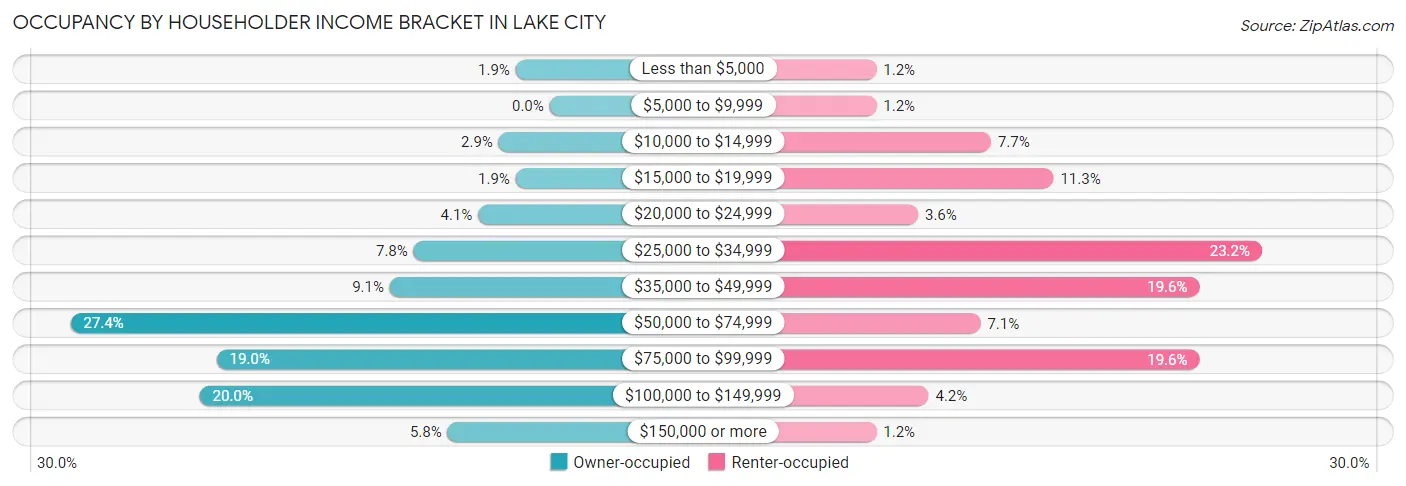
| Income Bracket | Owner-occupied | Renter-occupied |
| Less than $5,000 | 10 (1.9%) | 2 (1.2%) |
| $5,000 to $9,999 | 0 (0.0%) | 2 (1.2%) |
| $10,000 to $14,999 | 15 (2.9%) | 13 (7.7%) |
| $15,000 to $19,999 | 10 (1.9%) | 19 (11.3%) |
| $20,000 to $24,999 | 21 (4.1%) | 6 (3.6%) |
| $25,000 to $34,999 | 40 (7.8%) | 39 (23.2%) |
| $35,000 to $49,999 | 47 (9.1%) | 33 (19.6%) |
| $50,000 to $74,999 | 141 (27.4%) | 12 (7.1%) |
| $75,000 to $99,999 | 98 (19.0%) | 33 (19.6%) |
| $100,000 to $149,999 | 103 (20.0%) | 7 (4.2%) |
| $150,000 or more | 30 (5.8%) | 2 (1.2%) |
| Total | 515 (100.0%) | 168 (100.0%) |
Monthly Housing Cost Tiers in Lake City
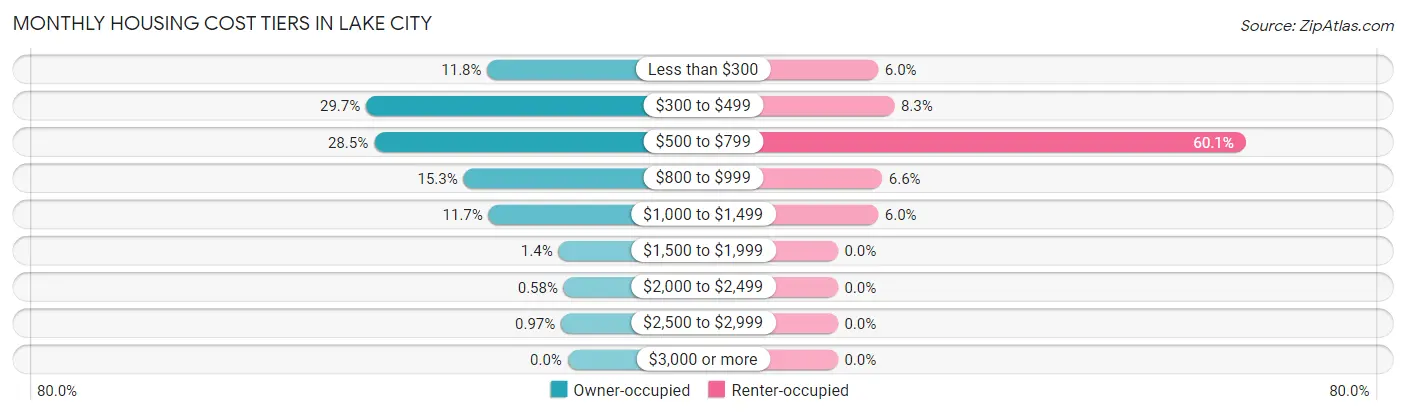
| Monthly Cost | Owner-occupied | Renter-occupied |
| Less than $300 | 61 (11.8%) | 10 (5.9%) |
| $300 to $499 | 153 (29.7%) | 14 (8.3%) |
| $500 to $799 | 147 (28.5%) | 101 (60.1%) |
| $800 to $999 | 79 (15.3%) | 11 (6.6%) |
| $1,000 to $1,499 | 60 (11.7%) | 10 (5.9%) |
| $1,500 to $1,999 | 7 (1.4%) | 0 (0.0%) |
| $2,000 to $2,499 | 3 (0.6%) | 0 (0.0%) |
| $2,500 to $2,999 | 5 (1.0%) | 0 (0.0%) |
| $3,000 or more | 0 (0.0%) | 0 (0.0%) |
| Total | 515 (100.0%) | 168 (100.0%) |
Physical Housing Characteristics in Lake City
Housing Structures in Lake City
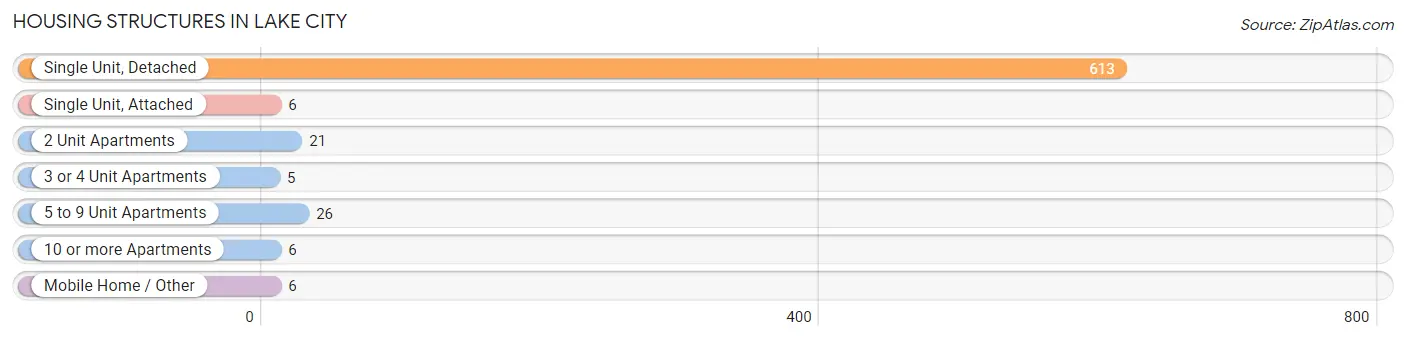
| Structure Type | # Housing Units | % Housing Units |
| Single Unit, Detached | 613 | 89.7% |
| Single Unit, Attached | 6 | 0.9% |
| 2 Unit Apartments | 21 | 3.1% |
| 3 or 4 Unit Apartments | 5 | 0.7% |
| 5 to 9 Unit Apartments | 26 | 3.8% |
| 10 or more Apartments | 6 | 0.9% |
| Mobile Home / Other | 6 | 0.9% |
| Total | 683 | 100.0% |
Housing Structures by Occupancy in Lake City
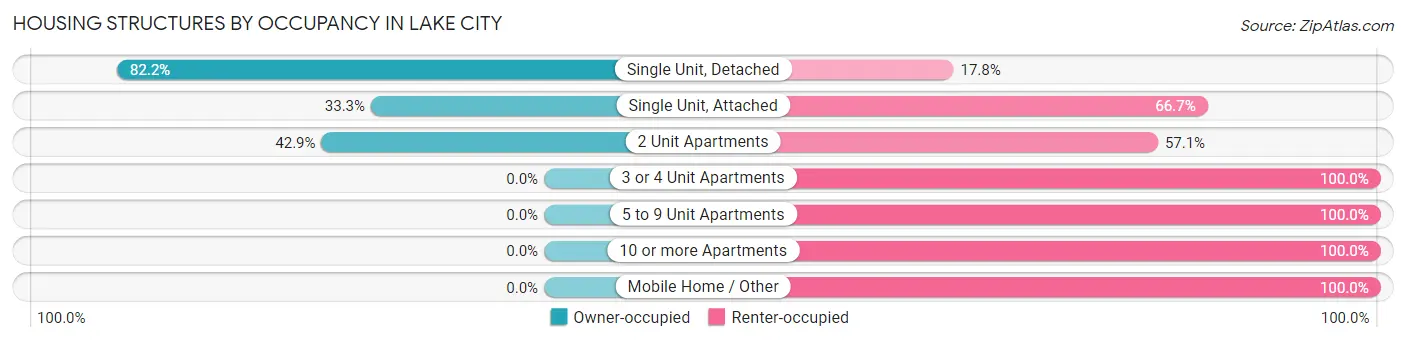
| Structure Type | Owner-occupied | Renter-occupied |
| Single Unit, Detached | 504 (82.2%) | 109 (17.8%) |
| Single Unit, Attached | 2 (33.3%) | 4 (66.7%) |
| 2 Unit Apartments | 9 (42.9%) | 12 (57.1%) |
| 3 or 4 Unit Apartments | 0 (0.0%) | 5 (100.0%) |
| 5 to 9 Unit Apartments | 0 (0.0%) | 26 (100.0%) |
| 10 or more Apartments | 0 (0.0%) | 6 (100.0%) |
| Mobile Home / Other | 0 (0.0%) | 6 (100.0%) |
| Total | 515 (75.4%) | 168 (24.6%) |
Housing Structures by Number of Rooms in Lake City
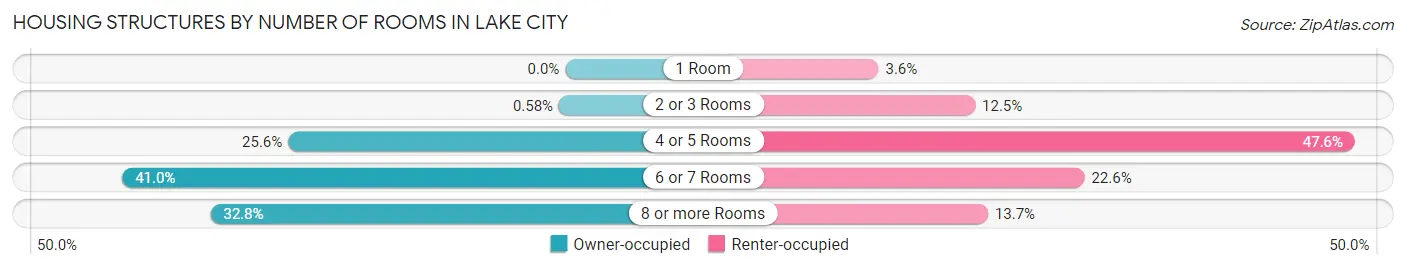
| Number of Rooms | Owner-occupied | Renter-occupied |
| 1 Room | 0 (0.0%) | 6 (3.6%) |
| 2 or 3 Rooms | 3 (0.6%) | 21 (12.5%) |
| 4 or 5 Rooms | 132 (25.6%) | 80 (47.6%) |
| 6 or 7 Rooms | 211 (41.0%) | 38 (22.6%) |
| 8 or more Rooms | 169 (32.8%) | 23 (13.7%) |
| Total | 515 (100.0%) | 168 (100.0%) |
Housing Structure by Heating Type in Lake City
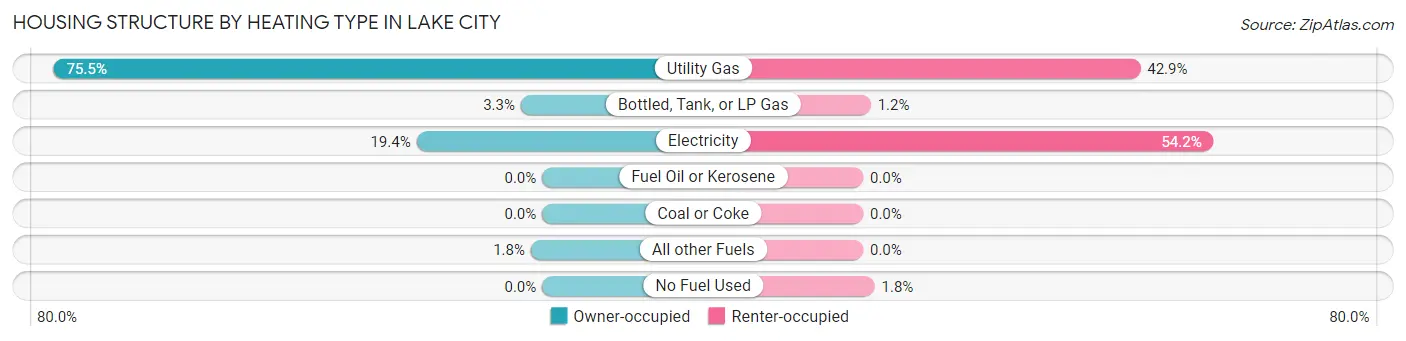
| Heating Type | Owner-occupied | Renter-occupied |
| Utility Gas | 389 (75.5%) | 72 (42.9%) |
| Bottled, Tank, or LP Gas | 17 (3.3%) | 2 (1.2%) |
| Electricity | 100 (19.4%) | 91 (54.2%) |
| Fuel Oil or Kerosene | 0 (0.0%) | 0 (0.0%) |
| Coal or Coke | 0 (0.0%) | 0 (0.0%) |
| All other Fuels | 9 (1.8%) | 0 (0.0%) |
| No Fuel Used | 0 (0.0%) | 3 (1.8%) |
| Total | 515 (100.0%) | 168 (100.0%) |
Household Vehicle Usage in Lake City
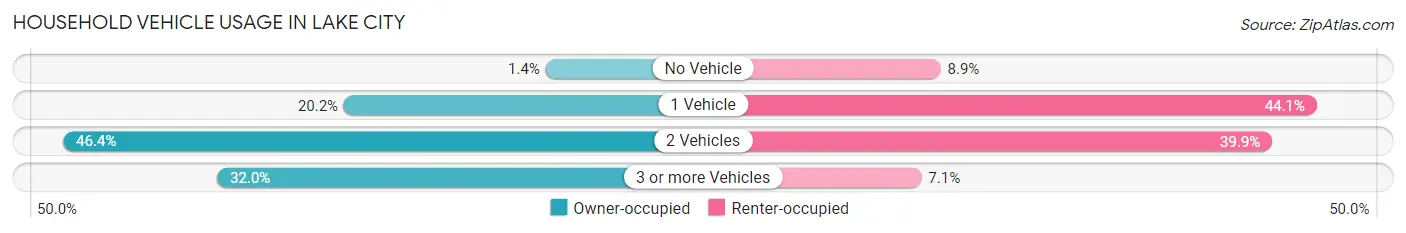
| Vehicles per Household | Owner-occupied | Renter-occupied |
| No Vehicle | 7 (1.4%) | 15 (8.9%) |
| 1 Vehicle | 104 (20.2%) | 74 (44.1%) |
| 2 Vehicles | 239 (46.4%) | 67 (39.9%) |
| 3 or more Vehicles | 165 (32.0%) | 12 (7.1%) |
| Total | 515 (100.0%) | 168 (100.0%) |
Real Estate & Mortgages in Lake City
Real Estate and Mortgage Overview in Lake City
| Characteristic | Without Mortgage | With Mortgage |
| Housing Units | 324 | 191 |
| Median Property Value | $88,600 | $101,100 |
| Median Household Income | $66,786 | $13 |
| Monthly Housing Costs | $434 | $0 |
| Real Estate Taxes | $1,354 | $2 |
Property Value by Mortgage Status in Lake City
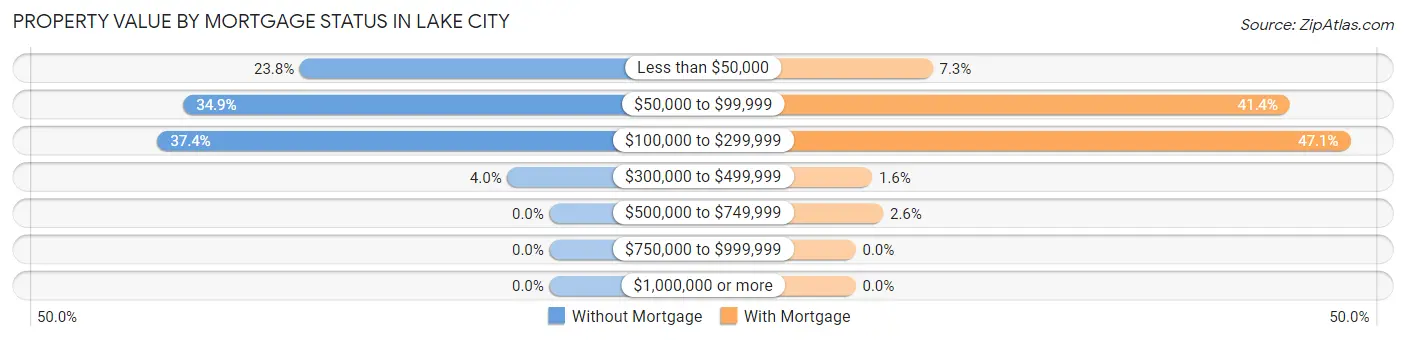
| Property Value | Without Mortgage | With Mortgage |
| Less than $50,000 | 77 (23.8%) | 14 (7.3%) |
| $50,000 to $99,999 | 113 (34.9%) | 79 (41.4%) |
| $100,000 to $299,999 | 121 (37.3%) | 90 (47.1%) |
| $300,000 to $499,999 | 13 (4.0%) | 3 (1.6%) |
| $500,000 to $749,999 | 0 (0.0%) | 5 (2.6%) |
| $750,000 to $999,999 | 0 (0.0%) | 0 (0.0%) |
| $1,000,000 or more | 0 (0.0%) | 0 (0.0%) |
| Total | 324 (100.0%) | 191 (100.0%) |
Household Income by Mortgage Status in Lake City
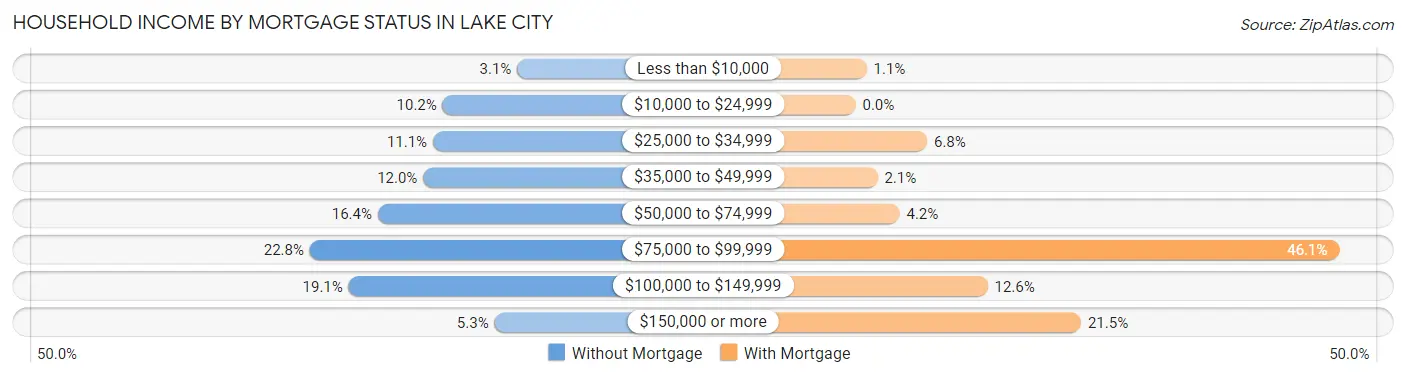
| Household Income | Without Mortgage | With Mortgage |
| Less than $10,000 | 10 (3.1%) | 2 (1.1%) |
| $10,000 to $24,999 | 33 (10.2%) | 0 (0.0%) |
| $25,000 to $34,999 | 36 (11.1%) | 13 (6.8%) |
| $35,000 to $49,999 | 39 (12.0%) | 4 (2.1%) |
| $50,000 to $74,999 | 53 (16.4%) | 8 (4.2%) |
| $75,000 to $99,999 | 74 (22.8%) | 88 (46.1%) |
| $100,000 to $149,999 | 62 (19.1%) | 24 (12.6%) |
| $150,000 or more | 17 (5.2%) | 41 (21.5%) |
| Total | 324 (100.0%) | 191 (100.0%) |
Property Value to Household Income Ratio in Lake City
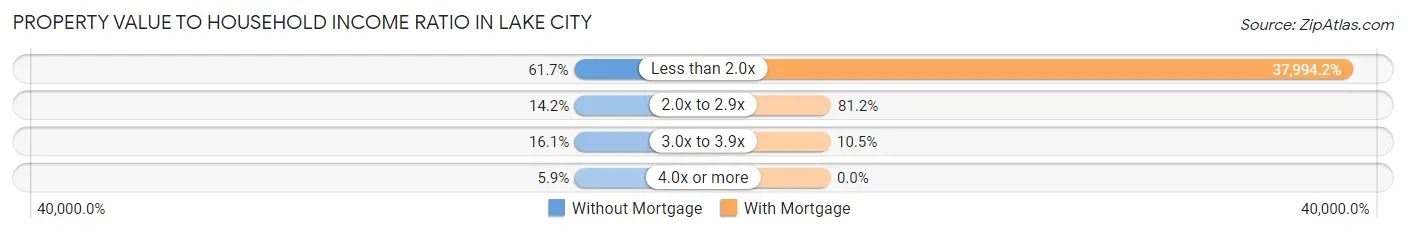
| Value-to-Income Ratio | Without Mortgage | With Mortgage |
| Less than 2.0x | 200 (61.7%) | 72,569 (37,994.2%) |
| 2.0x to 2.9x | 46 (14.2%) | 155 (81.1%) |
| 3.0x to 3.9x | 52 (16.1%) | 20 (10.5%) |
| 4.0x or more | 19 (5.9%) | 0 (0.0%) |
| Total | 324 (100.0%) | 191 (100.0%) |
Real Estate Taxes by Mortgage Status in Lake City
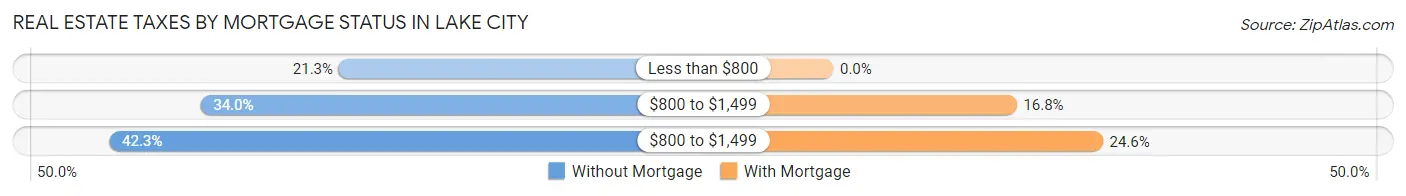
| Property Taxes | Without Mortgage | With Mortgage |
| Less than $800 | 69 (21.3%) | 0 (0.0%) |
| $800 to $1,499 | 110 (34.0%) | 32 (16.8%) |
| $800 to $1,499 | 137 (42.3%) | 47 (24.6%) |
| Total | 324 (100.0%) | 191 (100.0%) |
Health & Disability in Lake City
Health Insurance Coverage by Age in Lake City
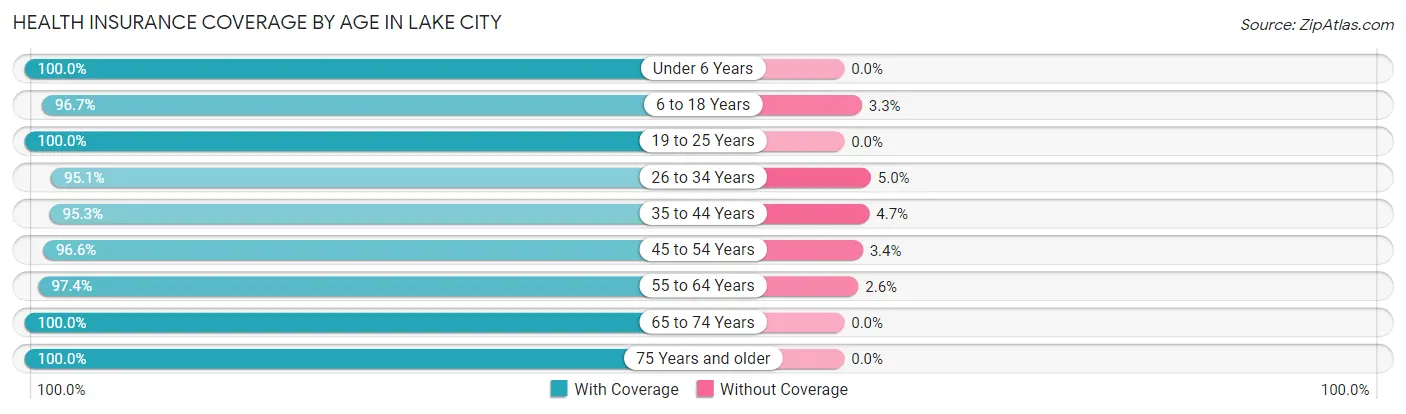
| Age Bracket | With Coverage | Without Coverage |
| Under 6 Years | 111 (100.0%) | 0 (0.0%) |
| 6 to 18 Years | 236 (96.7%) | 8 (3.3%) |
| 19 to 25 Years | 117 (100.0%) | 0 (0.0%) |
| 26 to 34 Years | 173 (95.1%) | 9 (5.0%) |
| 35 to 44 Years | 163 (95.3%) | 8 (4.7%) |
| 45 to 54 Years | 169 (96.6%) | 6 (3.4%) |
| 55 to 64 Years | 260 (97.4%) | 7 (2.6%) |
| 65 to 74 Years | 230 (100.0%) | 0 (0.0%) |
| 75 Years and older | 179 (100.0%) | 0 (0.0%) |
| Total | 1,638 (97.7%) | 38 (2.3%) |
Health Insurance Coverage by Citizenship Status in Lake City
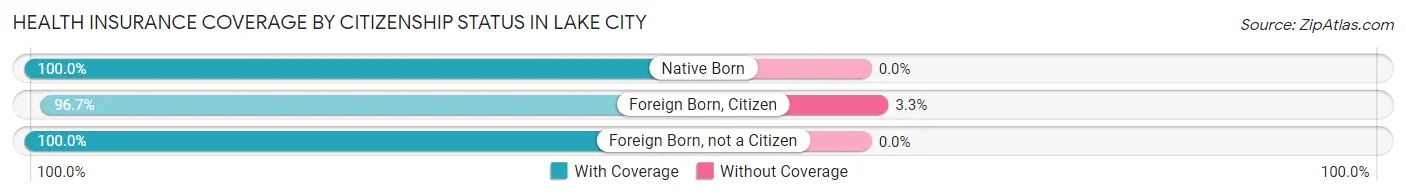
| Citizenship Status | With Coverage | Without Coverage |
| Native Born | 111 (100.0%) | 0 (0.0%) |
| Foreign Born, Citizen | 236 (96.7%) | 8 (3.3%) |
| Foreign Born, not a Citizen | 117 (100.0%) | 0 (0.0%) |
Health Insurance Coverage by Household Income in Lake City
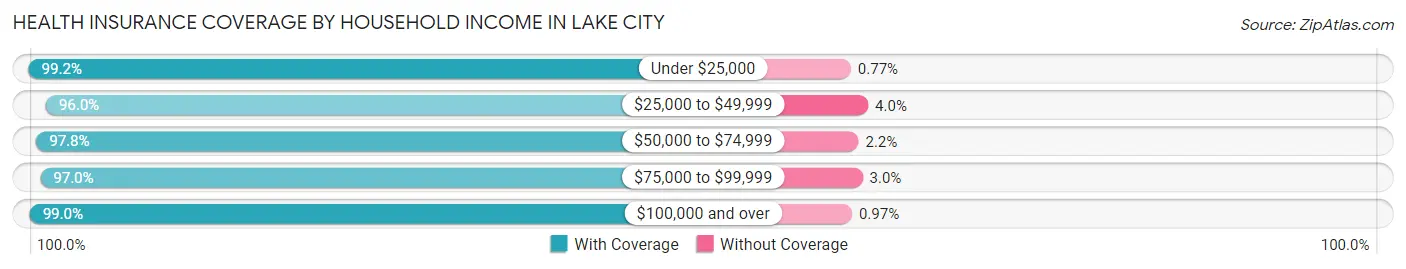
| Household Income | With Coverage | Without Coverage |
| Under $25,000 | 129 (99.2%) | 1 (0.8%) |
| $25,000 to $49,999 | 336 (96.0%) | 14 (4.0%) |
| $50,000 to $74,999 | 400 (97.8%) | 9 (2.2%) |
| $75,000 to $99,999 | 328 (97.0%) | 10 (3.0%) |
| $100,000 and over | 410 (99.0%) | 4 (1.0%) |
Public vs Private Health Insurance Coverage by Age in Lake City
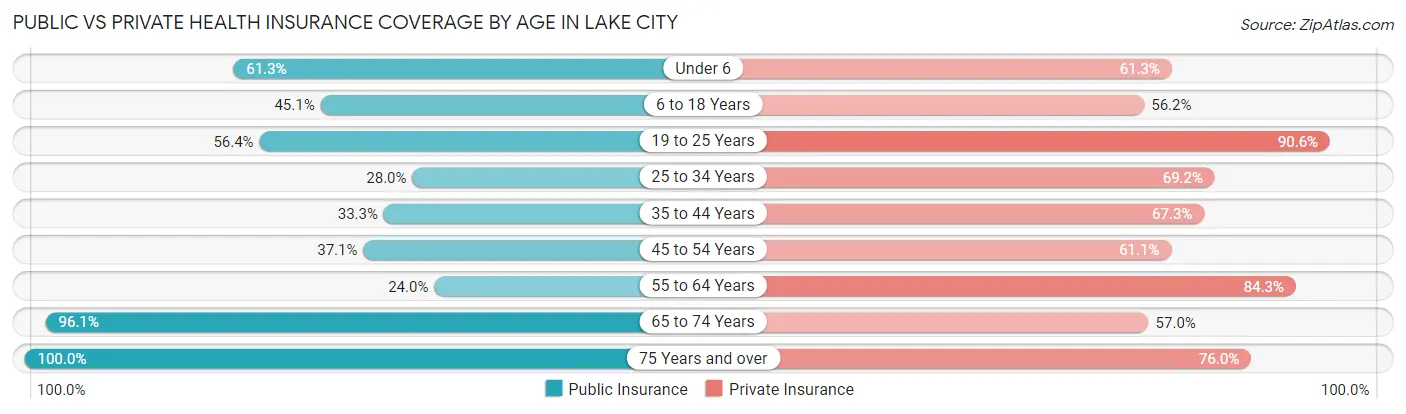
| Age Bracket | Public Insurance | Private Insurance |
| Under 6 | 68 (61.3%) | 68 (61.3%) |
| 6 to 18 Years | 110 (45.1%) | 137 (56.1%) |
| 19 to 25 Years | 66 (56.4%) | 106 (90.6%) |
| 25 to 34 Years | 51 (28.0%) | 126 (69.2%) |
| 35 to 44 Years | 57 (33.3%) | 115 (67.2%) |
| 45 to 54 Years | 65 (37.1%) | 107 (61.1%) |
| 55 to 64 Years | 64 (24.0%) | 225 (84.3%) |
| 65 to 74 Years | 221 (96.1%) | 131 (57.0%) |
| 75 Years and over | 179 (100.0%) | 136 (76.0%) |
| Total | 881 (52.6%) | 1,151 (68.7%) |
Disability Status by Sex by Age in Lake City
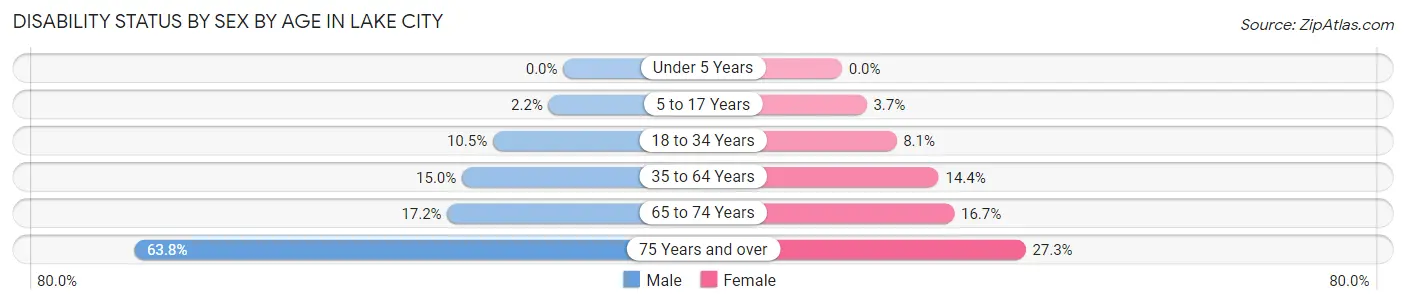
| Age Bracket | Male | Female |
| Under 5 Years | 0 (0.0%) | 0 (0.0%) |
| 5 to 17 Years | 3 (2.2%) | 3 (3.7%) |
| 18 to 34 Years | 14 (10.4%) | 16 (8.1%) |
| 35 to 64 Years | 43 (15.0%) | 47 (14.4%) |
| 65 to 74 Years | 21 (17.2%) | 18 (16.7%) |
| 75 Years and over | 51 (63.7%) | 27 (27.3%) |
Disability Class by Sex by Age in Lake City
Disability Class: Hearing Difficulty
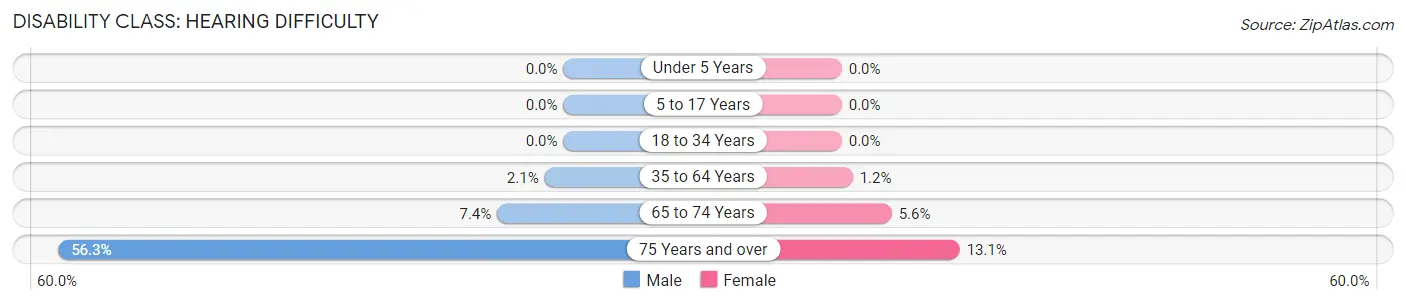
| Age Bracket | Male | Female |
| Under 5 Years | 0 (0.0%) | 0 (0.0%) |
| 5 to 17 Years | 0 (0.0%) | 0 (0.0%) |
| 18 to 34 Years | 0 (0.0%) | 0 (0.0%) |
| 35 to 64 Years | 6 (2.1%) | 4 (1.2%) |
| 65 to 74 Years | 9 (7.4%) | 6 (5.6%) |
| 75 Years and over | 45 (56.2%) | 13 (13.1%) |
Disability Class: Vision Difficulty
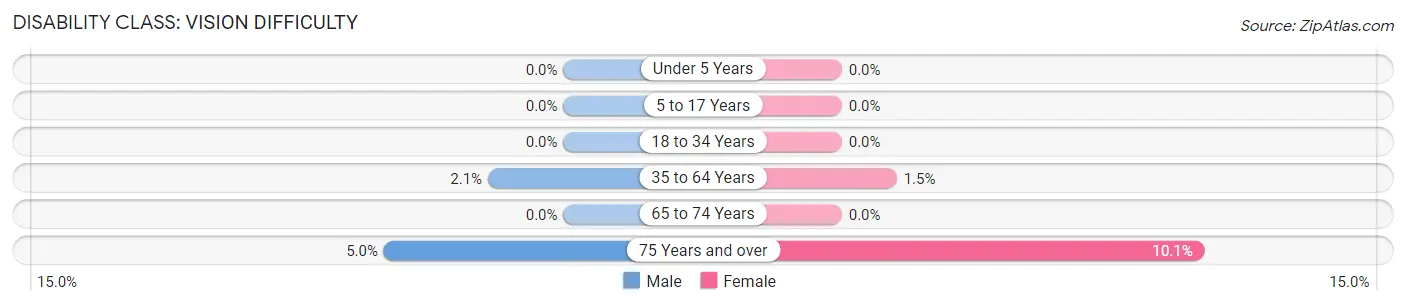
| Age Bracket | Male | Female |
| Under 5 Years | 0 (0.0%) | 0 (0.0%) |
| 5 to 17 Years | 0 (0.0%) | 0 (0.0%) |
| 18 to 34 Years | 0 (0.0%) | 0 (0.0%) |
| 35 to 64 Years | 6 (2.1%) | 5 (1.5%) |
| 65 to 74 Years | 0 (0.0%) | 0 (0.0%) |
| 75 Years and over | 4 (5.0%) | 10 (10.1%) |
Disability Class: Cognitive Difficulty
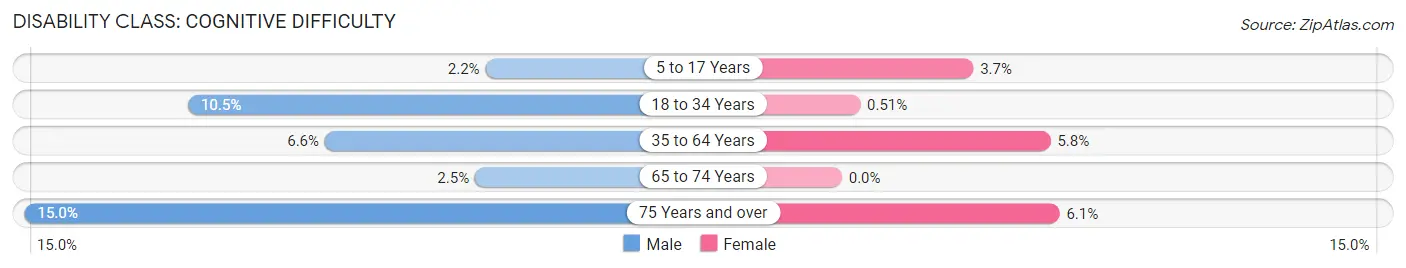
| Age Bracket | Male | Female |
| 5 to 17 Years | 3 (2.2%) | 3 (3.7%) |
| 18 to 34 Years | 14 (10.4%) | 1 (0.5%) |
| 35 to 64 Years | 19 (6.6%) | 19 (5.8%) |
| 65 to 74 Years | 3 (2.5%) | 0 (0.0%) |
| 75 Years and over | 12 (15.0%) | 6 (6.1%) |
Disability Class: Ambulatory Difficulty
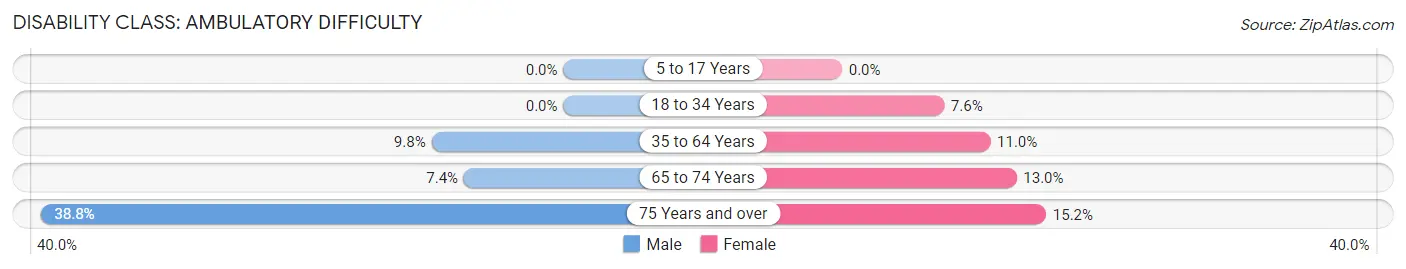
| Age Bracket | Male | Female |
| 5 to 17 Years | 0 (0.0%) | 0 (0.0%) |
| 18 to 34 Years | 0 (0.0%) | 15 (7.6%) |
| 35 to 64 Years | 28 (9.8%) | 36 (11.0%) |
| 65 to 74 Years | 9 (7.4%) | 14 (13.0%) |
| 75 Years and over | 31 (38.8%) | 15 (15.1%) |
Disability Class: Self-Care Difficulty
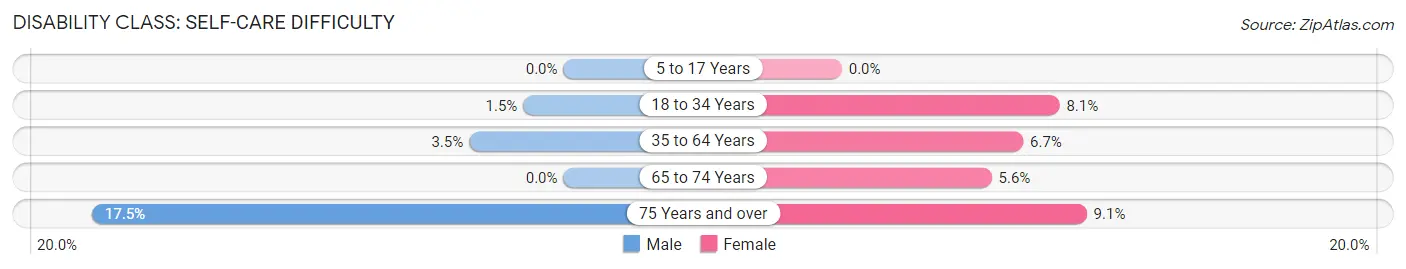
| Age Bracket | Male | Female |
| 5 to 17 Years | 0 (0.0%) | 0 (0.0%) |
| 18 to 34 Years | 2 (1.5%) | 16 (8.1%) |
| 35 to 64 Years | 10 (3.5%) | 22 (6.7%) |
| 65 to 74 Years | 0 (0.0%) | 6 (5.6%) |
| 75 Years and over | 14 (17.5%) | 9 (9.1%) |
Technology Access in Lake City
Computing Device Access in Lake City
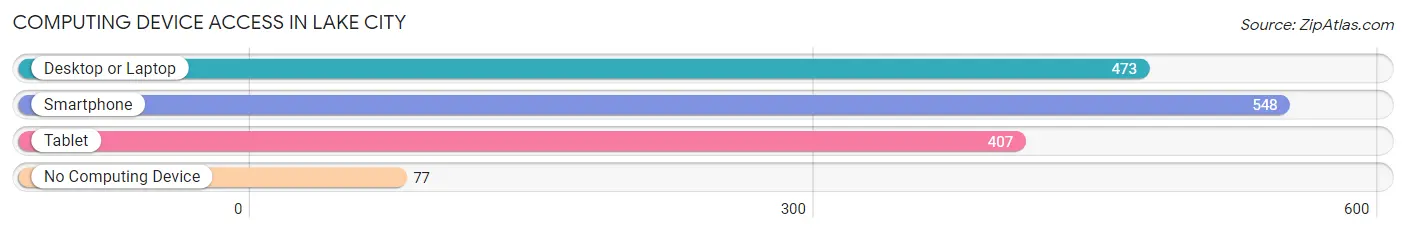
| Device Type | # Households | % Households |
| Desktop or Laptop | 473 | 69.3% |
| Smartphone | 548 | 80.2% |
| Tablet | 407 | 59.6% |
| No Computing Device | 77 | 11.3% |
| Total | 683 | 100.0% |
Internet Access in Lake City
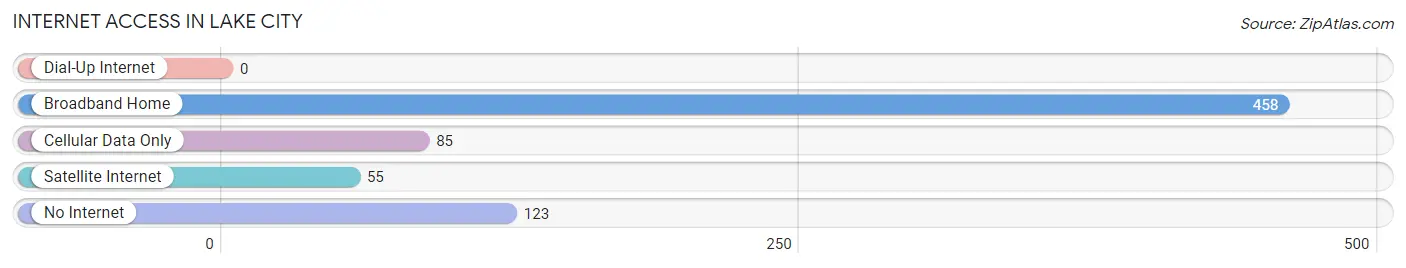
| Internet Type | # Households | % Households |
| Dial-Up Internet | 0 | 0.0% |
| Broadband Home | 458 | 67.1% |
| Cellular Data Only | 85 | 12.4% |
| Satellite Internet | 55 | 8.1% |
| No Internet | 123 | 18.0% |
| Total | 683 | 100.0% |
Lake City Summary
City of Lake City Iowa
History
The city of Lake City, Iowa is located in Calhoun County in the northwest corner of the state. It is situated on the banks of the Mississippi River, and is the county seat of Calhoun County. The city was founded in 1856 by a group of settlers from Ohio, led by William H. and Mary Ann (Henderson) Lake. The city was named after the Lakes, and the first post office was established in 1857.
The city of Lake City was incorporated in 1868, and the first mayor was William H. Lake. The city was a major port on the Mississippi River, and was a major hub for the lumber industry. The city was also home to a number of manufacturing plants, including a flour mill, a sawmill, a brickyard, and a furniture factory.
The city of Lake City experienced a period of growth in the late 19th and early 20th centuries, and the population peaked at around 2,000 in the 1920s. The Great Depression and World War II caused a decline in the city’s population, and by the 1950s the population had dropped to around 1,000.
Geography
The city of Lake City is located in Calhoun County in the northwest corner of the state of Iowa. It is situated on the banks of the Mississippi River, and is the county seat of Calhoun County. The city is located at the intersection of U.S. Route 67 and Iowa Highway 4.
The city of Lake City has a total area of 2.2 square miles, all of which is land. The city is located in a flat, low-lying area, and is surrounded by agricultural land. The city is located in the Central Time Zone, and the average elevation is 645 feet above sea level.
Economy
The economy of Lake City is largely based on agriculture and manufacturing. The city is home to a number of manufacturing plants, including a flour mill, a sawmill, a brickyard, and a furniture factory. The city is also home to a number of agricultural businesses, including grain elevators, feed mills, and livestock operations.
The city of Lake City is also home to a number of retail businesses, including grocery stores, restaurants, and clothing stores. The city is also home to a number of service businesses, including banks, insurance companies, and medical offices.
Demographics
The population of Lake City, Iowa was 1,092 at the 2010 census. The population density was 488.7 people per square mile. The racial makeup of the city was 97.3% White, 0.7% African American, 0.2% Native American, 0.2% Asian, 0.2% from other races, and 1.6% from two or more races. Hispanic or Latino of any race were 1.2% of the population.
The median income for a household in the city was $37,500, and the median income for a family was $45,000. The per capita income for the city was $19,845. About 11.2% of families and 14.2% of the population were below the poverty line, including 18.2% of those under age 18 and 8.3% of those age 65 or over.
Common Questions
What is Per Capita Income in Lake City?
Per Capita income in Lake City is $31,165.
What is the Median Family Income in Lake City?
Median Family Income in Lake City is $73,036.
What is the Median Household income in Lake City?
Median Household Income in Lake City is $59,704.
What is Income or Wage Gap in Lake City?
Income or Wage Gap in Lake City is 33.6%.
Women in Lake City earn 66.4 cents for every dollar earned by a man.
What is Inequality or Gini Index in Lake City?
Inequality or Gini Index in Lake City is 0.36.
What is the Total Population of Lake City?
Total Population of Lake City is 1,745.
What is the Total Male Population of Lake City?
Total Male Population of Lake City is 836.
What is the Total Female Population of Lake City?
Total Female Population of Lake City is 909.
What is the Ratio of Males per 100 Females in Lake City?
There are 91.97 Males per 100 Females in Lake City.
What is the Ratio of Females per 100 Males in Lake City?
There are 108.73 Females per 100 Males in Lake City.
What is the Median Population Age in Lake City?
Median Population Age in Lake City is 48.8 Years.
What is the Average Family Size in Lake City
Average Family Size in Lake City is 2.7 People.
What is the Average Household Size in Lake City
Average Household Size in Lake City is 2.4 People.
How Large is the Labor Force in Lake City?
There are 804 People in the Labor Forcein in Lake City.
What is the Percentage of People in the Labor Force in Lake City?
55.9% of People are in the Labor Force in Lake City.
What is the Unemployment Rate in Lake City?
Unemployment Rate in Lake City is 2.0%.