Jefferson, IA Map & Demographics
Jefferson Map
Jefferson Overview
$33,826
PER CAPITA INCOME
$87,634
AVG FAMILY INCOME
$48,868
AVG HOUSEHOLD INCOME
48.8%
WAGE / INCOME GAP [ % ]
51.2¢/ $1
WAGE / INCOME GAP [ $ ]
0.42
INEQUALITY / GINI INDEX
4,190
TOTAL POPULATION
1,922
MALE POPULATION
2,268
FEMALE POPULATION
84.74
MALES / 100 FEMALES
118.00
FEMALES / 100 MALES
47.7
MEDIAN AGE
2.9
AVG FAMILY SIZE
2.0
AVG HOUSEHOLD SIZE
2,008
LABOR FORCE [ PEOPLE ]
57.4%
PERCENT IN LABOR FORCE
2.1%
UNEMPLOYMENT RATE
Jefferson Zip Codes
Jefferson Area Codes
Income in Jefferson
Income Overview in Jefferson
Per Capita Income in Jefferson is $33,826, while median incomes of families and households are $87,634 and $48,868 respectively.
| Characteristic | Number | Measure |
| Per Capita Income | 4,190 | $33,826 |
| Median Family Income | 1,025 | $87,634 |
| Mean Family Income | 1,025 | $94,199 |
| Median Household Income | 2,001 | $48,868 |
| Mean Household Income | 2,001 | $68,656 |
| Income Deficit | 1,025 | $0 |
| Wage / Income Gap (%) | 4,190 | 48.83% |
| Wage / Income Gap ($) | 4,190 | 51.17¢ per $1 |
| Gini / Inequality Index | 4,190 | 0.42 |
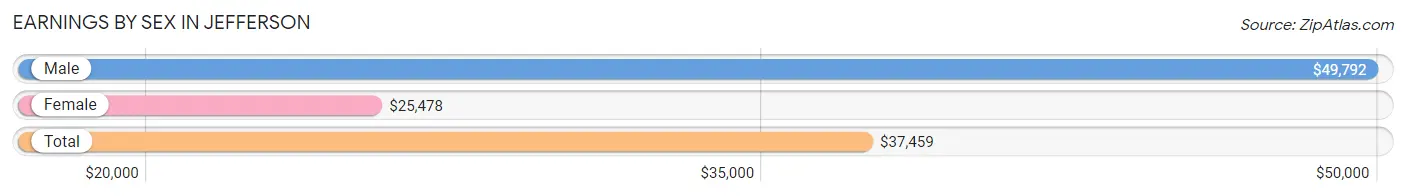
Earnings by Sex in Jefferson
Average Earnings in Jefferson are $37,459, $49,792 for men and $25,478 for women, a difference of 48.8%.
| Sex | Number | Average Earnings |
| Male | 1,122 (50.8%) | $49,792 |
| Female | 1,088 (49.2%) | $25,478 |
| Total | 2,210 (100.0%) | $37,459 |
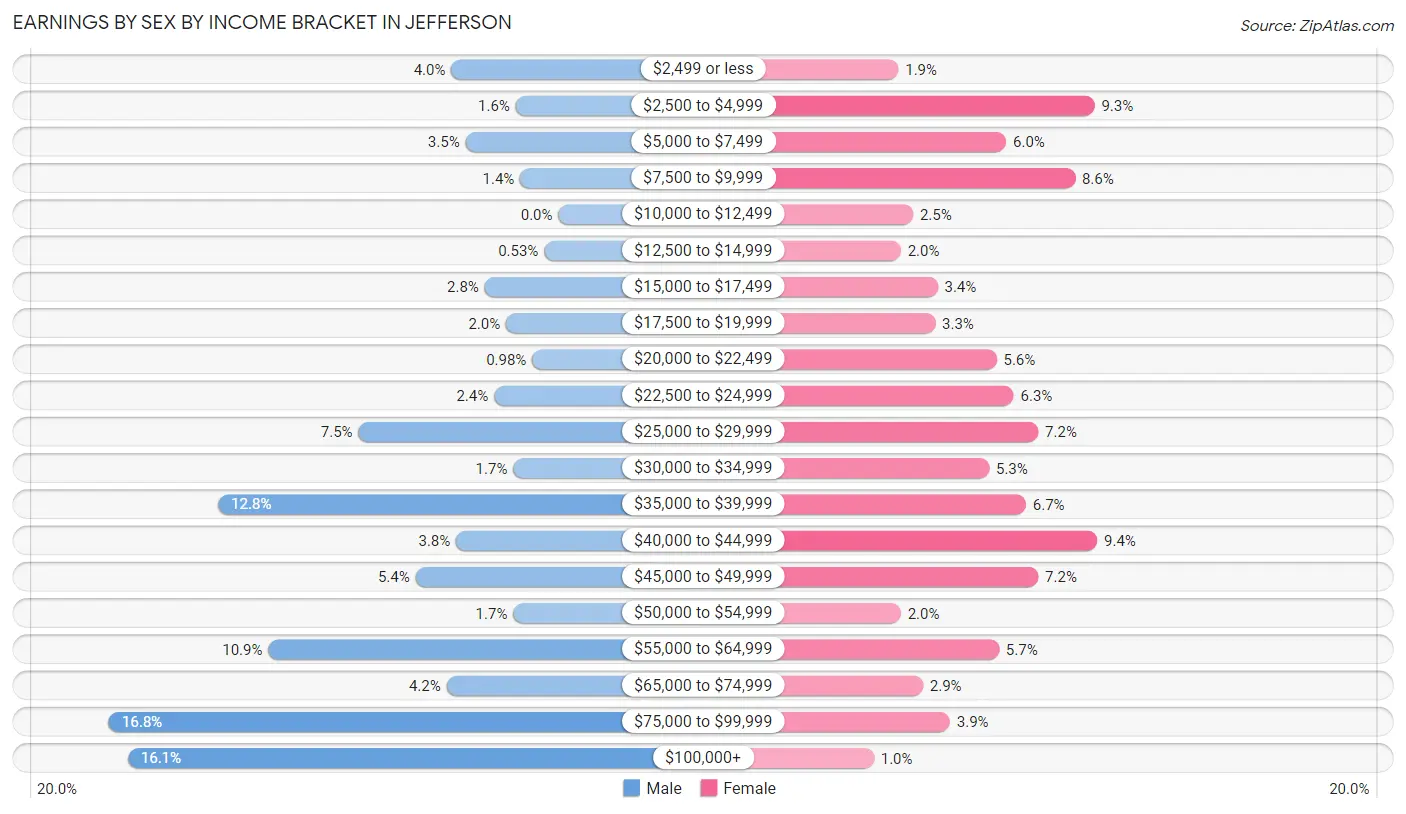
Earnings by Sex by Income Bracket in Jefferson
The most common earnings brackets in Jefferson are $75,000 to $99,999 for men (189 | 16.8%) and $40,000 to $44,999 for women (102 | 9.4%).
| Income | Male | Female |
| $2,499 or less | 45 (4.0%) | 21 (1.9%) |
| $2,500 to $4,999 | 18 (1.6%) | 101 (9.3%) |
| $5,000 to $7,499 | 39 (3.5%) | 65 (6.0%) |
| $7,500 to $9,999 | 16 (1.4%) | 93 (8.6%) |
| $10,000 to $12,499 | 0 (0.0%) | 27 (2.5%) |
| $12,500 to $14,999 | 6 (0.5%) | 22 (2.0%) |
| $15,000 to $17,499 | 31 (2.8%) | 37 (3.4%) |
| $17,500 to $19,999 | 22 (2.0%) | 36 (3.3%) |
| $20,000 to $22,499 | 11 (1.0%) | 61 (5.6%) |
| $22,500 to $24,999 | 27 (2.4%) | 68 (6.2%) |
| $25,000 to $29,999 | 84 (7.5%) | 78 (7.2%) |
| $30,000 to $34,999 | 19 (1.7%) | 58 (5.3%) |
| $35,000 to $39,999 | 143 (12.8%) | 73 (6.7%) |
| $40,000 to $44,999 | 43 (3.8%) | 102 (9.4%) |
| $45,000 to $49,999 | 60 (5.3%) | 78 (7.2%) |
| $50,000 to $54,999 | 19 (1.7%) | 22 (2.0%) |
| $55,000 to $64,999 | 122 (10.9%) | 62 (5.7%) |
| $65,000 to $74,999 | 47 (4.2%) | 31 (2.9%) |
| $75,000 to $99,999 | 189 (16.8%) | 42 (3.9%) |
| $100,000+ | 181 (16.1%) | 11 (1.0%) |
| Total | 1,122 (100.0%) | 1,088 (100.0%) |
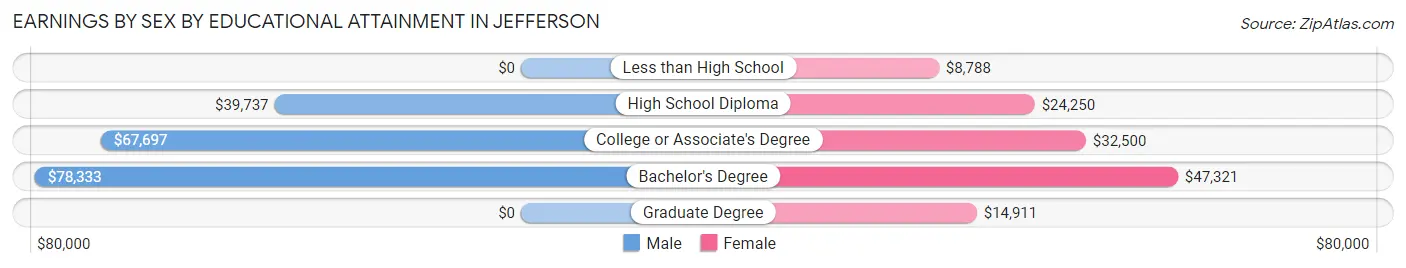
Earnings by Sex by Educational Attainment in Jefferson
Average earnings in Jefferson are $57,885 for men and $25,368 for women, a difference of 56.2%. Men with an educational attainment of bachelor's degree enjoy the highest average annual earnings of $78,333, while those with high school diploma education earn the least with $39,737. Women with an educational attainment of bachelor's degree earn the most with the average annual earnings of $47,321, while those with less than high school education have the smallest earnings of $8,788.
| Educational Attainment | Male Income | Female Income |
| Less than High School | - | - |
| High School Diploma | $39,737 | $24,250 |
| College or Associate's Degree | $67,697 | $32,500 |
| Bachelor's Degree | $78,333 | $47,321 |
| Graduate Degree | - | - |
| Total | $57,885 | $25,368 |
Family Income in Jefferson
Family Income Brackets in Jefferson
According to the Jefferson family income data, there are 272 families falling into the $100,000 to $149,999 income range, which is the most common income bracket and makes up 26.5% of all families. Conversely, the $10,000 to $14,999 income bracket is the least frequent group with only 14 families (1.4%) belonging to this category.
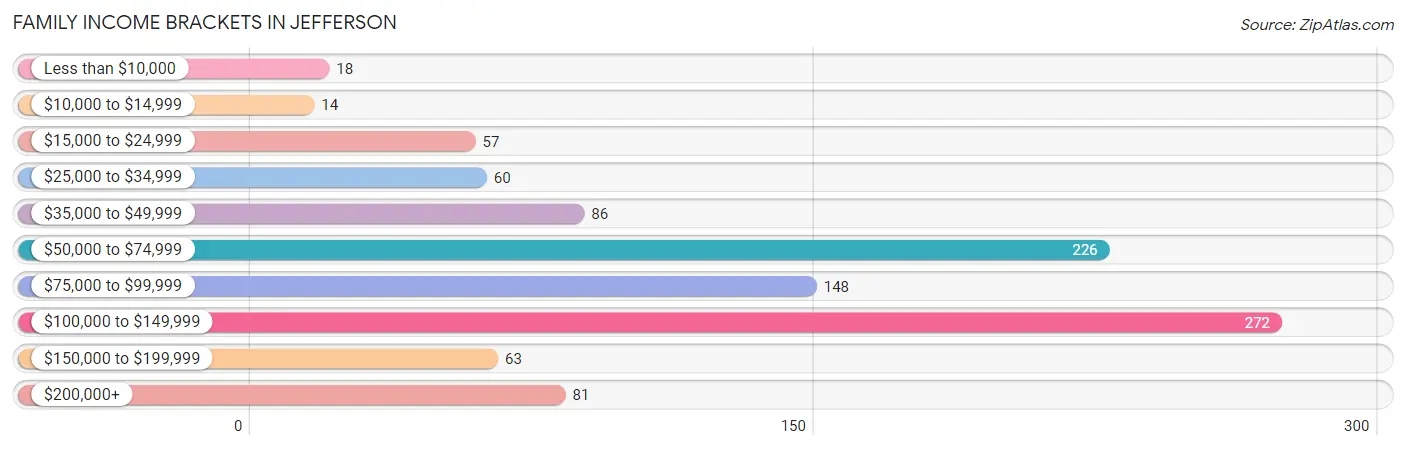
| Income Bracket | # Families | % Families |
| Less than $10,000 | 18 | 1.8% |
| $10,000 to $14,999 | 14 | 1.4% |
| $15,000 to $24,999 | 57 | 5.6% |
| $25,000 to $34,999 | 60 | 5.9% |
| $35,000 to $49,999 | 86 | 8.4% |
| $50,000 to $74,999 | 226 | 22.0% |
| $75,000 to $99,999 | 148 | 14.4% |
| $100,000 to $149,999 | 272 | 26.5% |
| $150,000 to $199,999 | 63 | 6.1% |
| $200,000+ | 81 | 7.9% |
Family Income by Famaliy Size in Jefferson
4-person families (80 | 7.8%) account for the highest median family income in Jefferson with $143,095 per family, while 4-person families (80 | 7.8%) have the highest median income of $35,774 per family member.
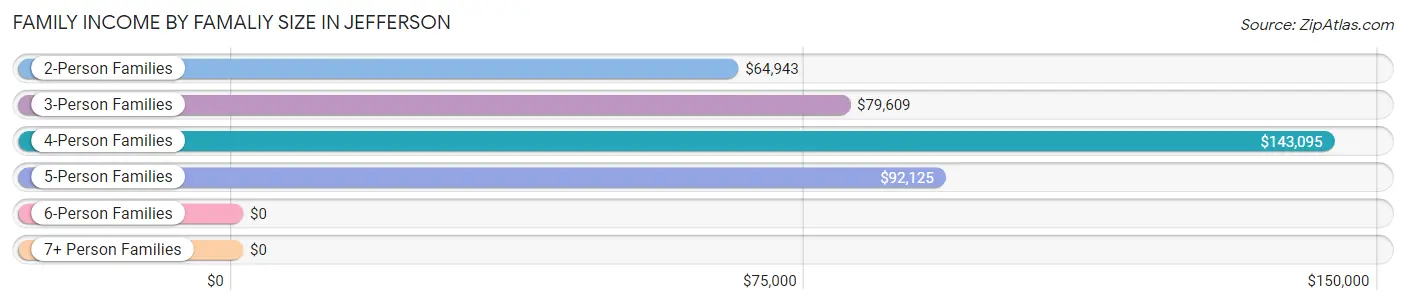
| Income Bracket | # Families | Median Income |
| 2-Person Families | 677 (66.0%) | $64,943 |
| 3-Person Families | 134 (13.1%) | $79,609 |
| 4-Person Families | 80 (7.8%) | $143,095 |
| 5-Person Families | 123 (12.0%) | $92,125 |
| 6-Person Families | 0 (0.0%) | $0 |
| 7+ Person Families | 11 (1.1%) | $0 |
| Total | 1,025 (100.0%) | $87,634 |
Family Income by Number of Earners in Jefferson
The median family income in Jefferson is $87,634, with families comprising 2 earners (557) having the highest median family income of $123,542, while families with no earners (148) have the lowest median family income of $37,115, accounting for 54.3% and 14.4% of families, respectively.
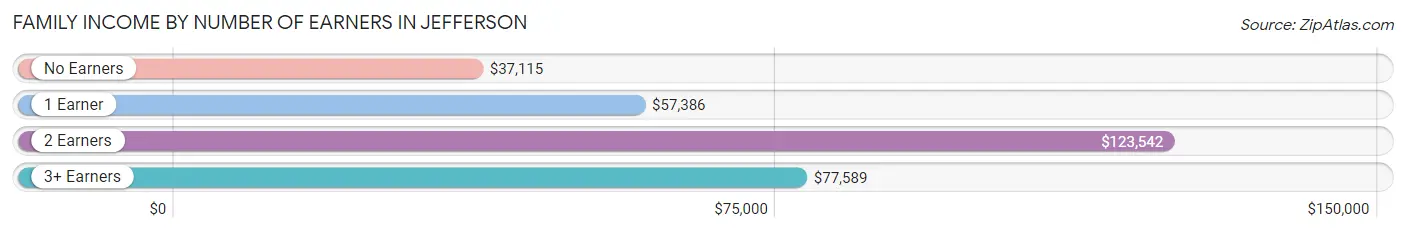
| Number of Earners | # Families | Median Income |
| No Earners | 148 (14.4%) | $37,115 |
| 1 Earner | 267 (26.1%) | $57,386 |
| 2 Earners | 557 (54.3%) | $123,542 |
| 3+ Earners | 53 (5.2%) | $77,589 |
| Total | 1,025 (100.0%) | $87,634 |
Household Income in Jefferson
Household Income Brackets in Jefferson
With 492 households falling in the category, the $35,000 to $49,999 income range is the most frequent in Jefferson, accounting for 24.6% of all households. In contrast, only 44 households (2.2%) fall into the $10,000 to $14,999 income bracket, making it the least populous group.
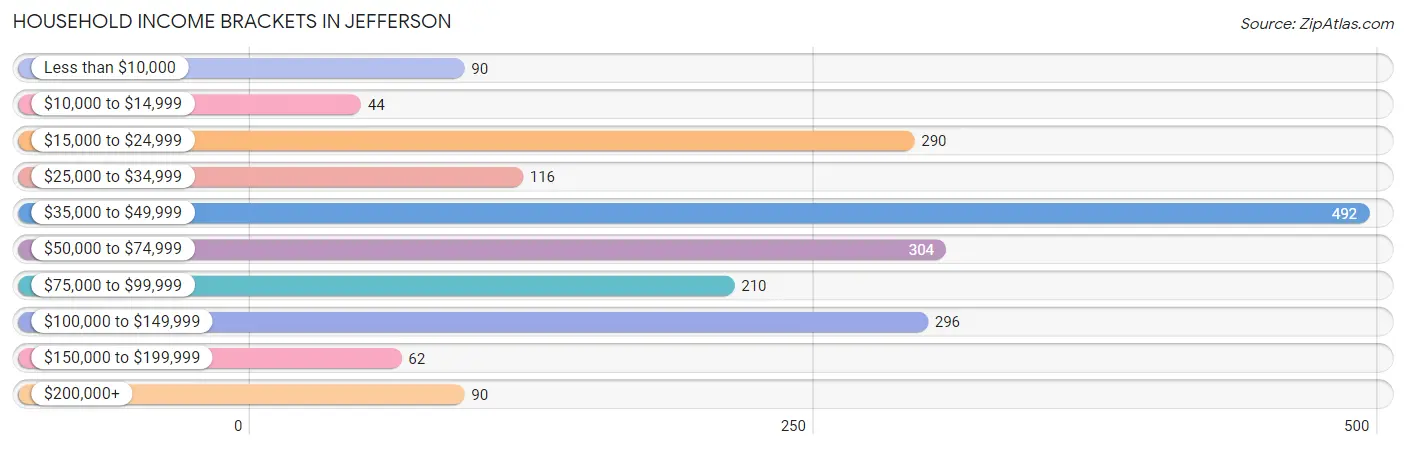
| Income Bracket | # Households | % Households |
| Less than $10,000 | 90 | 4.5% |
| $10,000 to $14,999 | 44 | 2.2% |
| $15,000 to $24,999 | 290 | 14.5% |
| $25,000 to $34,999 | 116 | 5.8% |
| $35,000 to $49,999 | 492 | 24.6% |
| $50,000 to $74,999 | 304 | 15.2% |
| $75,000 to $99,999 | 210 | 10.5% |
| $100,000 to $149,999 | 296 | 14.8% |
| $150,000 to $199,999 | 62 | 3.1% |
| $200,000+ | 90 | 4.5% |
Household Income by Householder Age in Jefferson
The median household income in Jefferson is $48,868, with the highest median household income of $69,279 found in the 25 to 44 years age bracket for the primary householder. A total of 475 households (23.7%) fall into this category. Meanwhile, the 15 to 24 years age bracket for the primary householder has the lowest median household income of $0, with 87 households (4.3%) in this group.
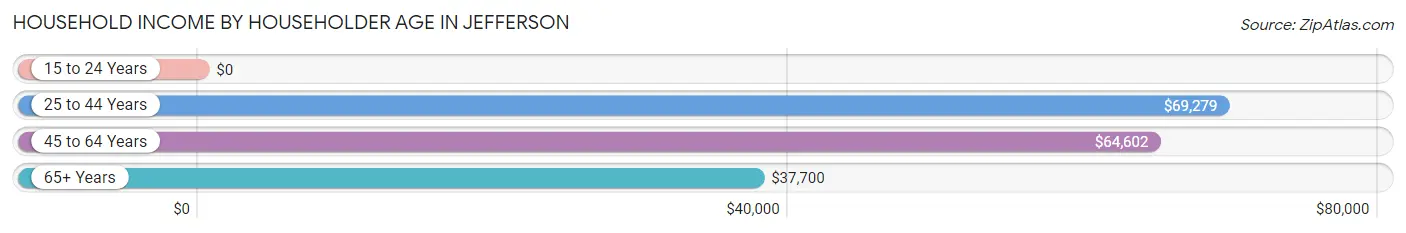
| Income Bracket | # Households | Median Income |
| 15 to 24 Years | 87 (4.3%) | $0 |
| 25 to 44 Years | 475 (23.7%) | $69,279 |
| 45 to 64 Years | 549 (27.4%) | $64,602 |
| 65+ Years | 890 (44.5%) | $37,700 |
| Total | 2,001 (100.0%) | $48,868 |
Poverty in Jefferson
Income Below Poverty by Sex and Age in Jefferson
With 4.6% poverty level for males and 10.6% for females among the residents of Jefferson, 15 year old males and 15 year old females are the most vulnerable to poverty, with 12 males (54.5%) and 11 females (100.0%) in their respective age groups living below the poverty level.
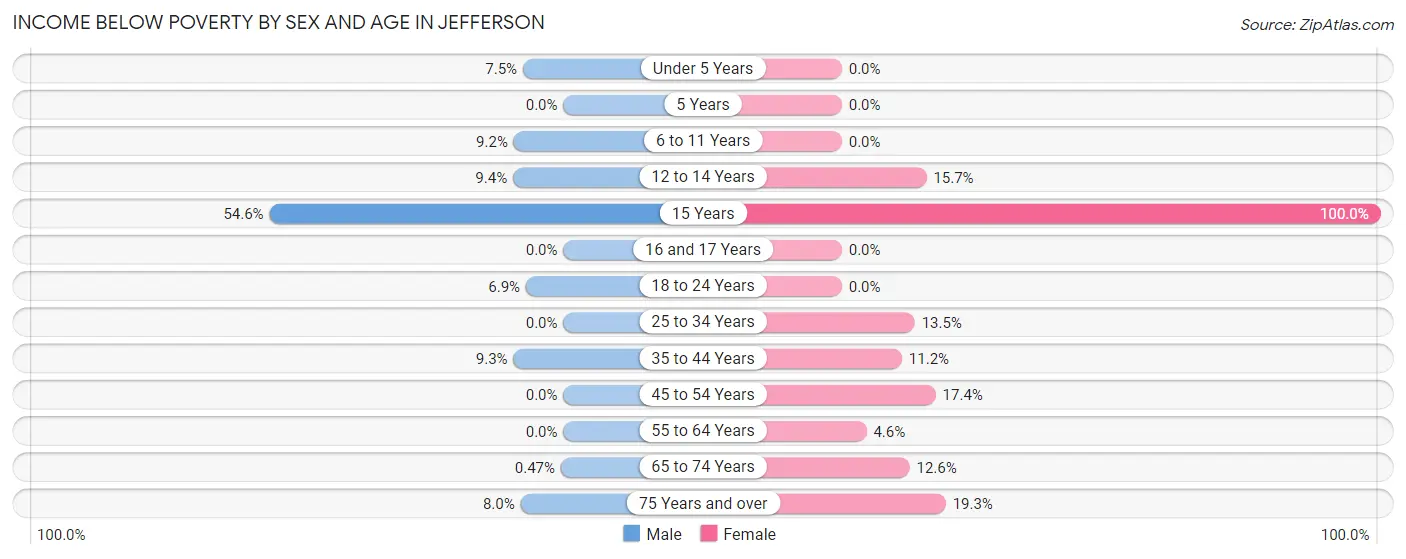
| Age Bracket | Male | Female |
| Under 5 Years | 9 (7.5%) | 0 (0.0%) |
| 5 Years | 0 (0.0%) | 0 (0.0%) |
| 6 to 11 Years | 7 (9.2%) | 0 (0.0%) |
| 12 to 14 Years | 10 (9.3%) | 11 (15.7%) |
| 15 Years | 12 (54.5%) | 11 (100.0%) |
| 16 and 17 Years | 0 (0.0%) | 0 (0.0%) |
| 18 to 24 Years | 12 (6.9%) | 0 (0.0%) |
| 25 to 34 Years | 0 (0.0%) | 28 (13.5%) |
| 35 to 44 Years | 20 (9.3%) | 25 (11.2%) |
| 45 to 54 Years | 0 (0.0%) | 23 (17.4%) |
| 55 to 64 Years | 0 (0.0%) | 17 (4.6%) |
| 65 to 74 Years | 1 (0.5%) | 44 (12.6%) |
| 75 Years and over | 14 (8.0%) | 76 (19.3%) |
| Total | 85 (4.6%) | 235 (10.6%) |
Income Above Poverty by Sex and Age in Jefferson
According to the poverty statistics in Jefferson, males aged 5 years and females aged under 5 years are the age groups that are most secure financially, with 100.0% of males and 100.0% of females in these age groups living above the poverty line.
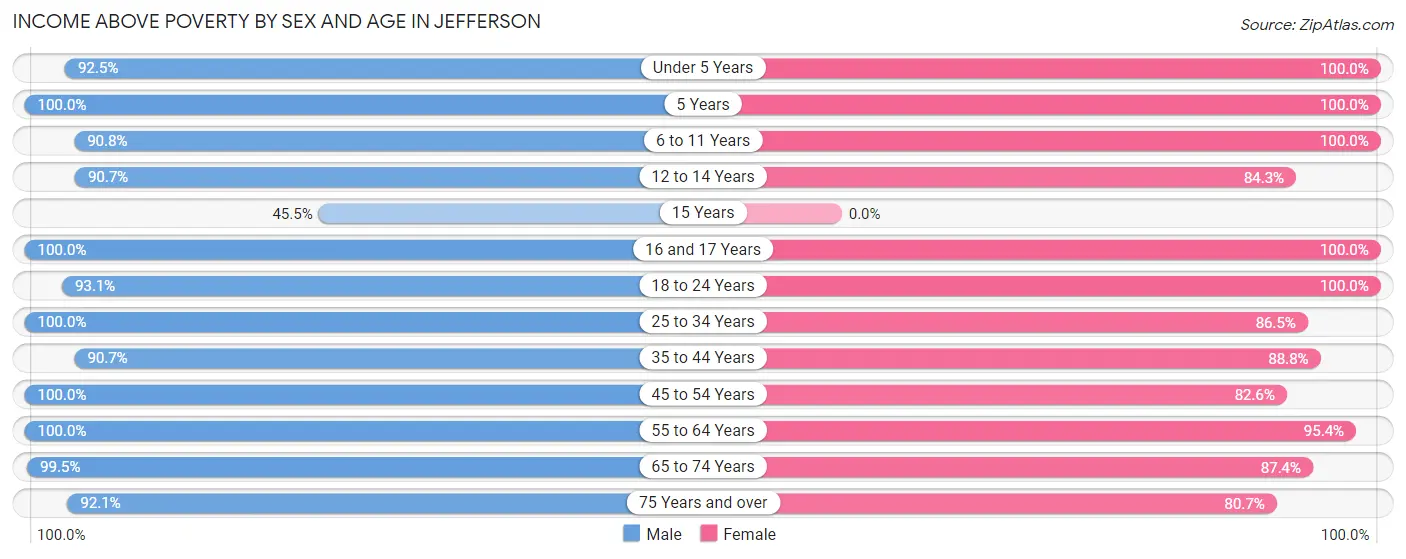
| Age Bracket | Male | Female |
| Under 5 Years | 111 (92.5%) | 92 (100.0%) |
| 5 Years | 65 (100.0%) | 8 (100.0%) |
| 6 to 11 Years | 69 (90.8%) | 120 (100.0%) |
| 12 to 14 Years | 97 (90.6%) | 59 (84.3%) |
| 15 Years | 10 (45.5%) | 0 (0.0%) |
| 16 and 17 Years | 48 (100.0%) | 79 (100.0%) |
| 18 to 24 Years | 161 (93.1%) | 156 (100.0%) |
| 25 to 34 Years | 209 (100.0%) | 179 (86.5%) |
| 35 to 44 Years | 196 (90.7%) | 199 (88.8%) |
| 45 to 54 Years | 148 (100.0%) | 109 (82.6%) |
| 55 to 64 Years | 292 (100.0%) | 354 (95.4%) |
| 65 to 74 Years | 213 (99.5%) | 306 (87.4%) |
| 75 Years and over | 162 (92.0%) | 318 (80.7%) |
| Total | 1,781 (95.4%) | 1,979 (89.4%) |
Income Below Poverty Among Married-Couple Families in Jefferson
The poverty statistics for married-couple families in Jefferson show that 1.9% or 14 of the total 750 families live below the poverty line. Families with no children have the highest poverty rate of 2.5%, comprising of 14 families. On the other hand, families with 1 or 2 children have the lowest poverty rate of 0.0%, which includes 0 families.
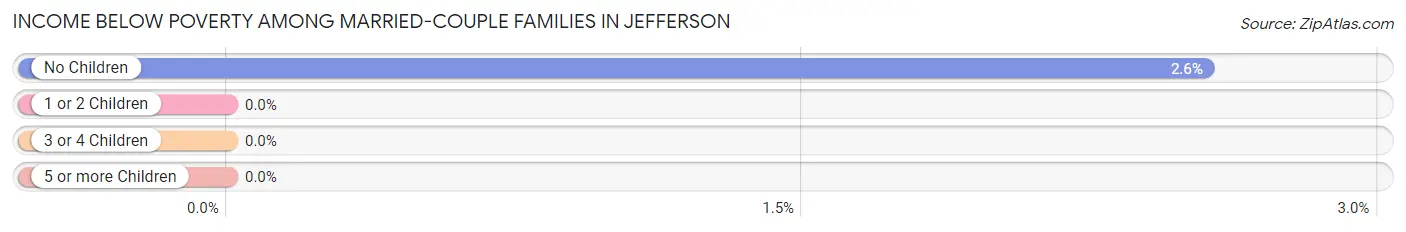
| Children | Above Poverty | Below Poverty |
| No Children | 534 (97.5%) | 14 (2.5%) |
| 1 or 2 Children | 111 (100.0%) | 0 (0.0%) |
| 3 or 4 Children | 84 (100.0%) | 0 (0.0%) |
| 5 or more Children | 7 (100.0%) | 0 (0.0%) |
| Total | 736 (98.1%) | 14 (1.9%) |
Income Below Poverty Among Single-Parent Households in Jefferson
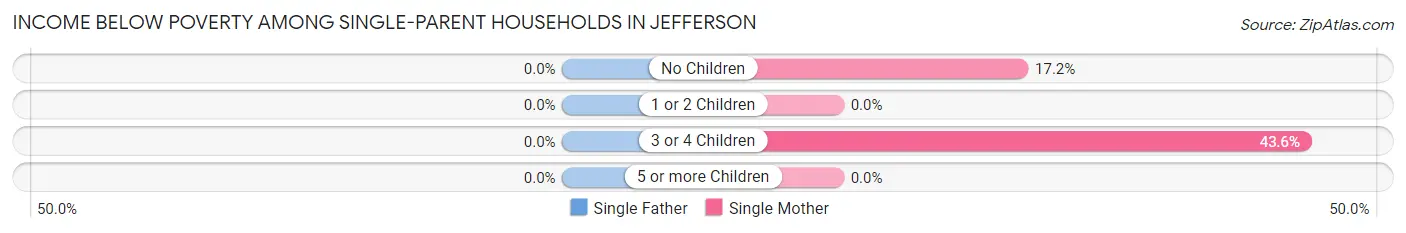
| Children | Single Father | Single Mother |
| No Children | 0 (0.0%) | 28 (17.2%) |
| 1 or 2 Children | 0 (0.0%) | 0 (0.0%) |
| 3 or 4 Children | 0 (0.0%) | 17 (43.6%) |
| 5 or more Children | 0 (0.0%) | 0 (0.0%) |
| Total | 0 (0.0%) | 45 (18.4%) |
Income Below Poverty Among Married-Couple vs Single-Parent Households in Jefferson
The poverty data for Jefferson shows that 14 of the married-couple family households (1.9%) and 45 of the single-parent households (16.4%) are living below the poverty level. Within the married-couple family households, those with no children have the highest poverty rate, with 14 households (2.5%) falling below the poverty line. Among the single-parent households, those with 3 or 4 children have the highest poverty rate, with 17 household (43.6%) living below poverty.
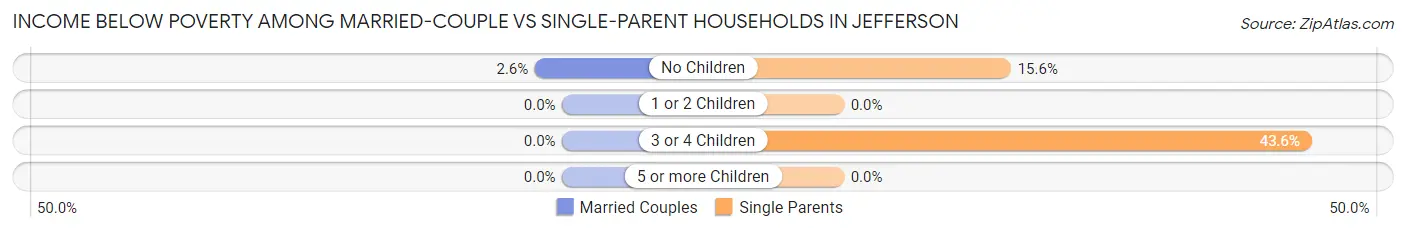
| Children | Married-Couple Families | Single-Parent Households |
| No Children | 14 (2.5%) | 28 (15.6%) |
| 1 or 2 Children | 0 (0.0%) | 0 (0.0%) |
| 3 or 4 Children | 0 (0.0%) | 17 (43.6%) |
| 5 or more Children | 0 (0.0%) | 0 (0.0%) |
| Total | 14 (1.9%) | 45 (16.4%) |
Race in Jefferson
The most populous races in Jefferson are White / Caucasian (3,892 | 92.9%), Hispanic or Latino (213 | 5.1%), and Two or more Races (208 | 5.0%).
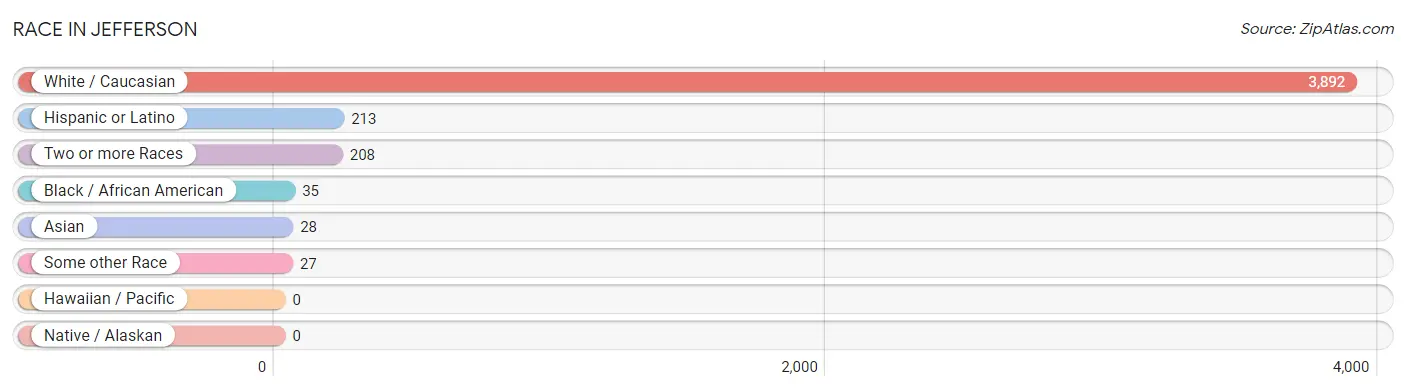
| Race | # Population | % Population |
| Asian | 28 | 0.7% |
| Black / African American | 35 | 0.8% |
| Hawaiian / Pacific | 0 | 0.0% |
| Hispanic or Latino | 213 | 5.1% |
| Native / Alaskan | 0 | 0.0% |
| White / Caucasian | 3,892 | 92.9% |
| Two or more Races | 208 | 5.0% |
| Some other Race | 27 | 0.6% |
| Total | 4,190 | 100.0% |
Ancestry in Jefferson
The most populous ancestries reported in Jefferson are German (1,577 | 37.6%), English (881 | 21.0%), Irish (541 | 12.9%), Norwegian (281 | 6.7%), and French (153 | 3.6%), together accounting for 81.9% of all Jefferson residents.
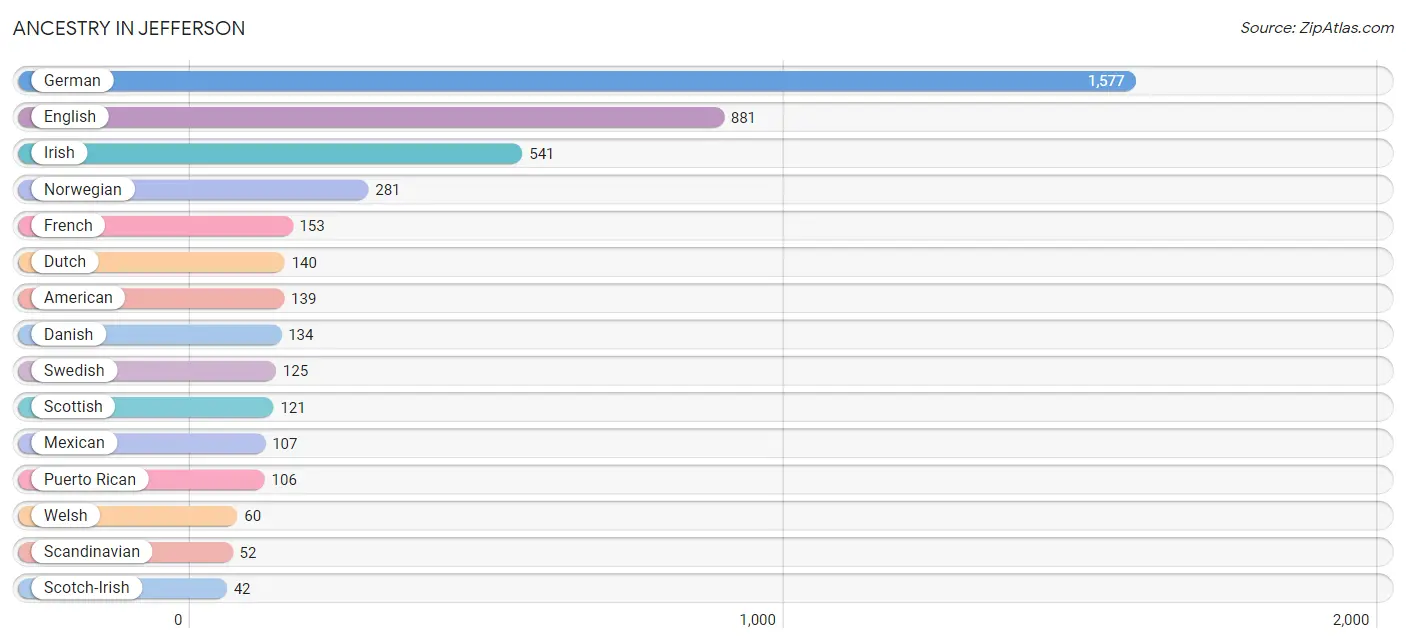
| Ancestry | # Population | % Population |
| American | 139 | 3.3% |
| Arab | 15 | 0.4% |
| Danish | 134 | 3.2% |
| Dutch | 140 | 3.3% |
| Egyptian | 15 | 0.4% |
| English | 881 | 21.0% |
| European | 15 | 0.4% |
| French | 153 | 3.6% |
| German | 1,577 | 37.6% |
| Irish | 541 | 12.9% |
| Italian | 7 | 0.2% |
| Korean | 18 | 0.4% |
| Mexican | 107 | 2.5% |
| Norwegian | 281 | 6.7% |
| Polish | 31 | 0.7% |
| Puerto Rican | 106 | 2.5% |
| Russian | 11 | 0.3% |
| Scandinavian | 52 | 1.2% |
| Scotch-Irish | 42 | 1.0% |
| Scottish | 121 | 2.9% |
| Sioux | 14 | 0.3% |
| Swedish | 125 | 3.0% |
| Thai | 28 | 0.7% |
| Welsh | 60 | 1.4% |
| Yakama | 18 | 0.4% | View All 25 Rows |
Immigrants in Jefferson
The most numerous immigrant groups reported in Jefferson came from Central America (41 | 1.0%), Latin America (41 | 1.0%), Mexico (41 | 1.0%), Asia (28 | 0.7%), and India (28 | 0.7%), together accounting for 4.3% of all Jefferson residents.
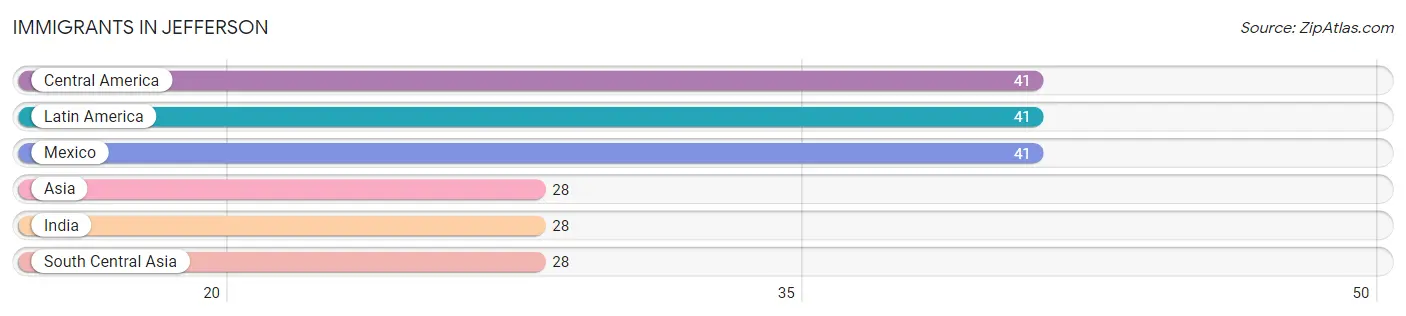
| Immigration Origin | # Population | % Population |
| Asia | 28 | 0.7% |
| Central America | 41 | 1.0% |
| India | 28 | 0.7% |
| Latin America | 41 | 1.0% |
| Mexico | 41 | 1.0% |
| South Central Asia | 28 | 0.7% | View All 6 Rows |
Sex and Age in Jefferson
Sex and Age in Jefferson
The most populous age groups in Jefferson are 60 to 64 Years (195 | 10.2%) for men and 65 to 69 Years (278 | 12.3%) for women.
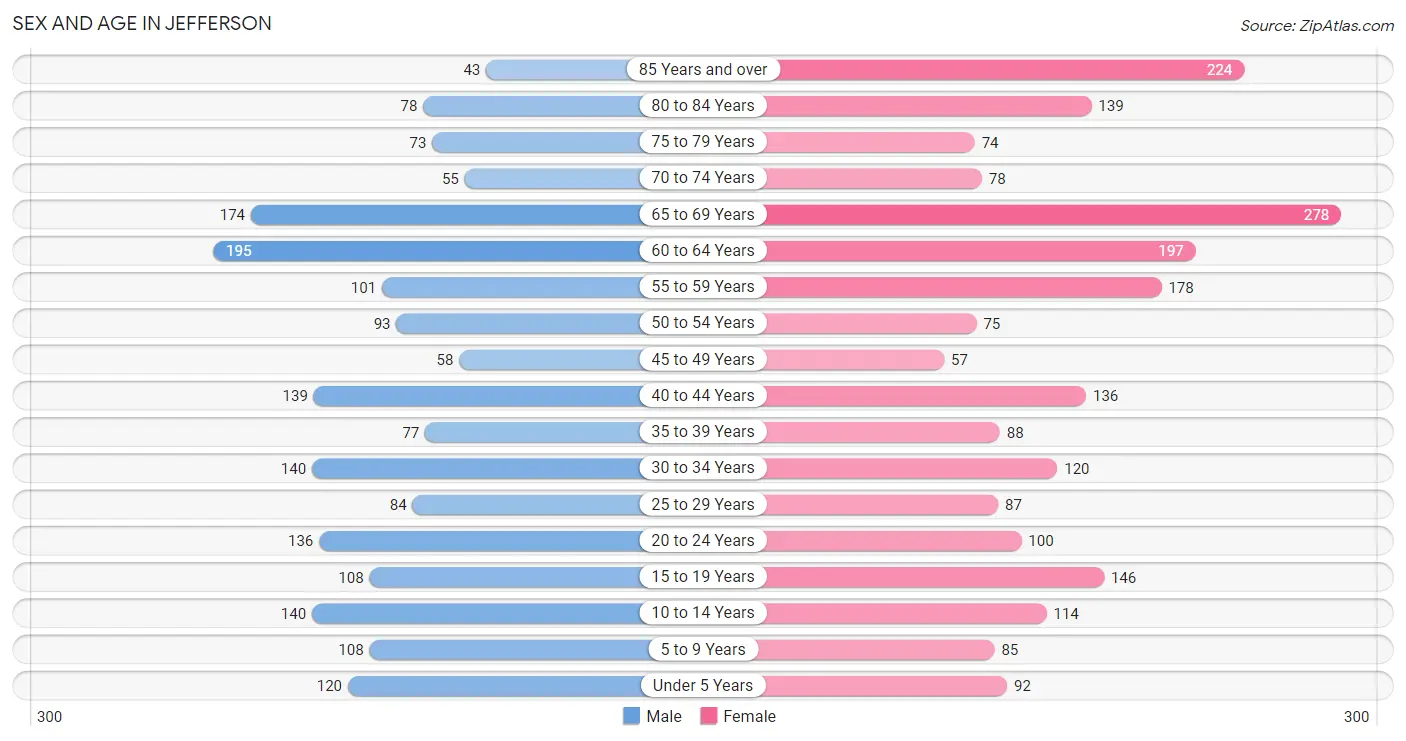
| Age Bracket | Male | Female |
| Under 5 Years | 120 (6.2%) | 92 (4.1%) |
| 5 to 9 Years | 108 (5.6%) | 85 (3.7%) |
| 10 to 14 Years | 140 (7.3%) | 114 (5.0%) |
| 15 to 19 Years | 108 (5.6%) | 146 (6.4%) |
| 20 to 24 Years | 136 (7.1%) | 100 (4.4%) |
| 25 to 29 Years | 84 (4.4%) | 87 (3.8%) |
| 30 to 34 Years | 140 (7.3%) | 120 (5.3%) |
| 35 to 39 Years | 77 (4.0%) | 88 (3.9%) |
| 40 to 44 Years | 139 (7.2%) | 136 (6.0%) |
| 45 to 49 Years | 58 (3.0%) | 57 (2.5%) |
| 50 to 54 Years | 93 (4.8%) | 75 (3.3%) |
| 55 to 59 Years | 101 (5.2%) | 178 (7.9%) |
| 60 to 64 Years | 195 (10.2%) | 197 (8.7%) |
| 65 to 69 Years | 174 (9.0%) | 278 (12.3%) |
| 70 to 74 Years | 55 (2.9%) | 78 (3.4%) |
| 75 to 79 Years | 73 (3.8%) | 74 (3.3%) |
| 80 to 84 Years | 78 (4.1%) | 139 (6.1%) |
| 85 Years and over | 43 (2.2%) | 224 (9.9%) |
| Total | 1,922 (100.0%) | 2,268 (100.0%) |
Families and Households in Jefferson
Median Family Size in Jefferson
The median family size in Jefferson is 2.86 persons per family, with single male/father families (31 | 3.0%) accounting for the largest median family size of 5.35 persons per family. On the other hand, married-couple families (750 | 73.2%) represent the smallest median family size with 2.73 persons per family.
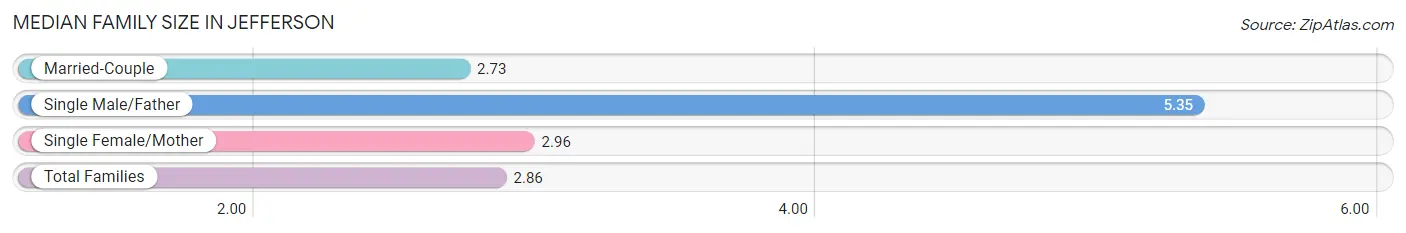
| Family Type | # Families | Family Size |
| Married-Couple | 750 (73.2%) | 2.73 |
| Single Male/Father | 31 (3.0%) | 5.35 |
| Single Female/Mother | 244 (23.8%) | 2.96 |
| Total Families | 1,025 (100.0%) | 2.86 |
Median Household Size in Jefferson
The median household size in Jefferson is 2.03 persons per household, with single male/father households (31 | 1.5%) accounting for the largest median household size of 5.61 persons per household. non-family households (976 | 48.8%) represent the smallest median household size with 1.10 persons per household.
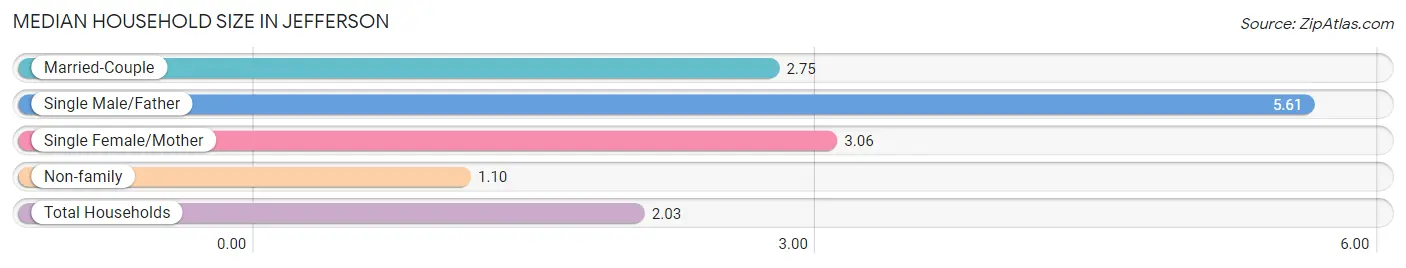
| Household Type | # Households | Household Size |
| Married-Couple | 750 (37.5%) | 2.75 |
| Single Male/Father | 31 (1.5%) | 5.61 |
| Single Female/Mother | 244 (12.2%) | 3.06 |
| Non-family | 976 (48.8%) | 1.10 |
| Total Households | 2,001 (100.0%) | 2.03 |
Household Size by Marriage Status in Jefferson
Out of a total of 2,001 households in Jefferson, 1,025 (51.2%) are family households, while 976 (48.8%) are nonfamily households. The most numerous type of family households are 2-person households, comprising 663, and the most common type of nonfamily households are 1-person households, comprising 886.
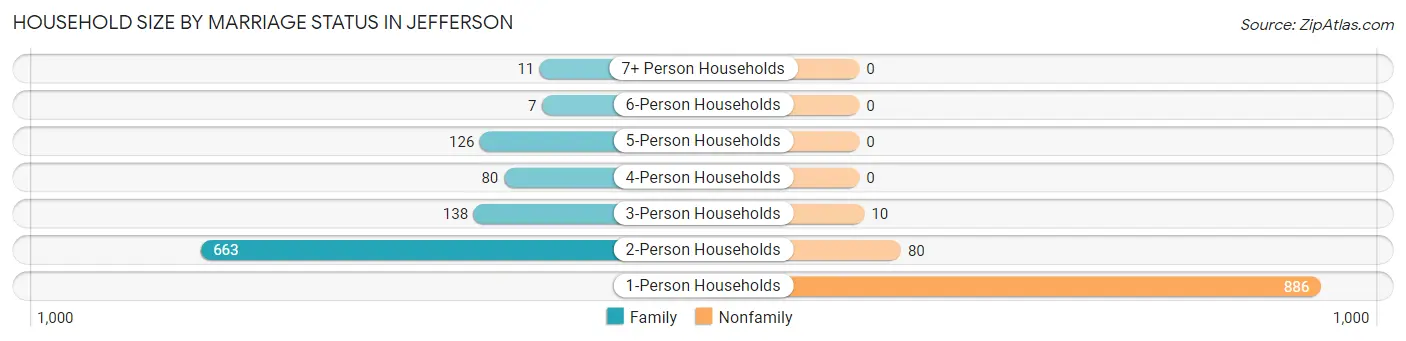
| Household Size | Family Households | Nonfamily Households |
| 1-Person Households | - | 886 (44.3%) |
| 2-Person Households | 663 (33.1%) | 80 (4.0%) |
| 3-Person Households | 138 (6.9%) | 10 (0.5%) |
| 4-Person Households | 80 (4.0%) | 0 (0.0%) |
| 5-Person Households | 126 (6.3%) | 0 (0.0%) |
| 6-Person Households | 7 (0.4%) | 0 (0.0%) |
| 7+ Person Households | 11 (0.5%) | 0 (0.0%) |
| Total | 1,025 (51.2%) | 976 (48.8%) |
Female Fertility in Jefferson
Fertility by Age in Jefferson
Average fertility rate in Jefferson is 25.0 births per 1,000 women. Women in the age bracket of 35 to 50 years have the highest fertility rate with 43.0 births per 1,000 women. Women in the age bracket of 35 to 50 years acount for 66.7% of all women with births.
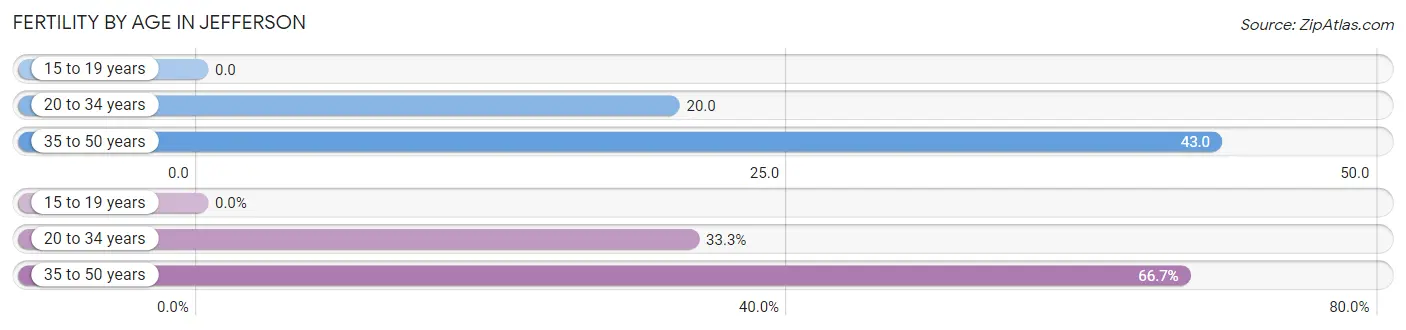
| Age Bracket | Women with Births | Births / 1,000 Women |
| 15 to 19 years | 0 (0.0%) | 0.0 |
| 20 to 34 years | 6 (33.3%) | 20.0 |
| 35 to 50 years | 12 (66.7%) | 43.0 |
| Total | 18 (100.0%) | 25.0 |
Fertility by Age by Marriage Status in Jefferson
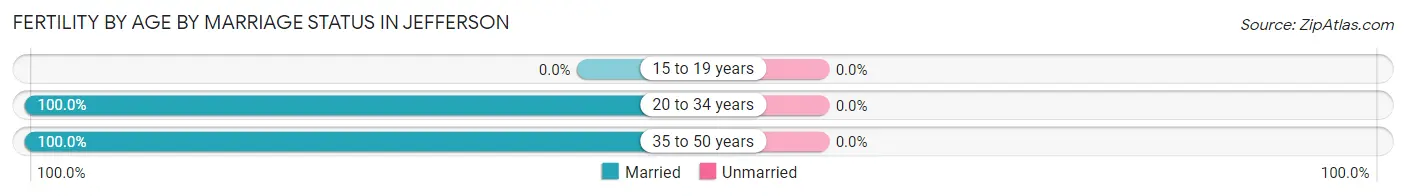
| Age Bracket | Married | Unmarried |
| 15 to 19 years | 0 (0.0%) | 0 (0.0%) |
| 20 to 34 years | 6 (100.0%) | 0 (0.0%) |
| 35 to 50 years | 12 (100.0%) | 0 (0.0%) |
| Total | 18 (100.0%) | 0 (0.0%) |
Fertility by Education in Jefferson
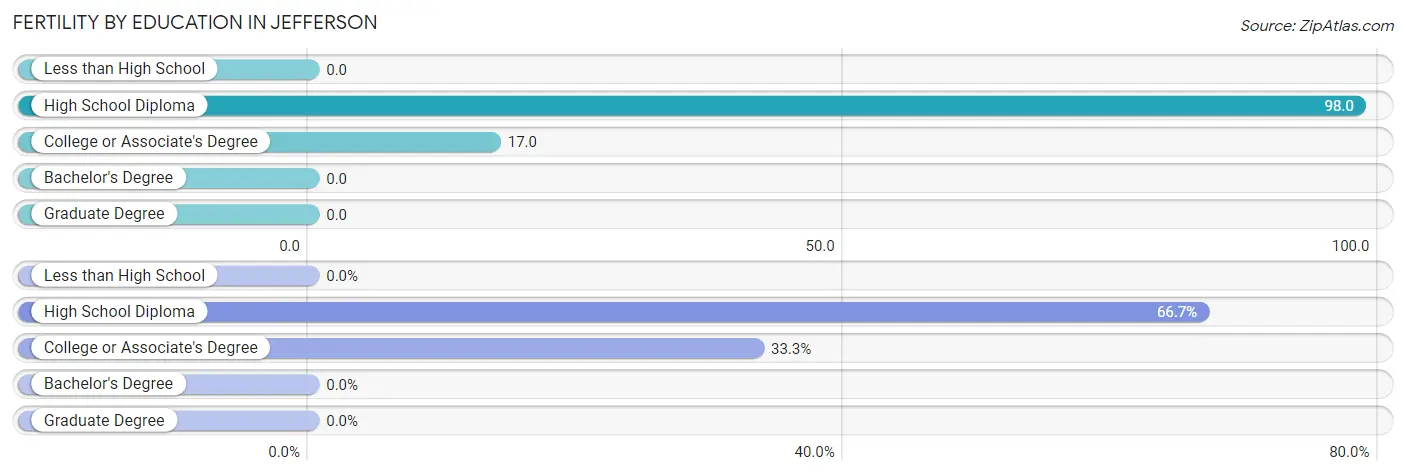
| Educational Attainment | Women with Births | Births / 1,000 Women |
| Less than High School | 0 (0.0%) | 0.0 |
| High School Diploma | 12 (66.7%) | 98.0 |
| College or Associate's Degree | 6 (33.3%) | 17.0 |
| Bachelor's Degree | 0 (0.0%) | 0.0 |
| Graduate Degree | 0 (0.0%) | 0.0 |
| Total | 18 (100.0%) | 25.0 |
Fertility by Education by Marriage Status in Jefferson

| Educational Attainment | Married | Unmarried |
| Less than High School | 0 (0.0%) | 0 (0.0%) |
| High School Diploma | 12 (100.0%) | 0 (0.0%) |
| College or Associate's Degree | 6 (100.0%) | 0 (0.0%) |
| Bachelor's Degree | 0 (0.0%) | 0 (0.0%) |
| Graduate Degree | 0 (0.0%) | 0 (0.0%) |
| Total | 18 (100.0%) | 0 (0.0%) |
Employment Characteristics in Jefferson
Employment by Class of Employer in Jefferson
Among the 1,966 employed individuals in Jefferson, private company employees (1,192 | 60.6%), local government employees (273 | 13.9%), and not-for-profit organizations (235 | 11.9%) make up the most common classes of employment.
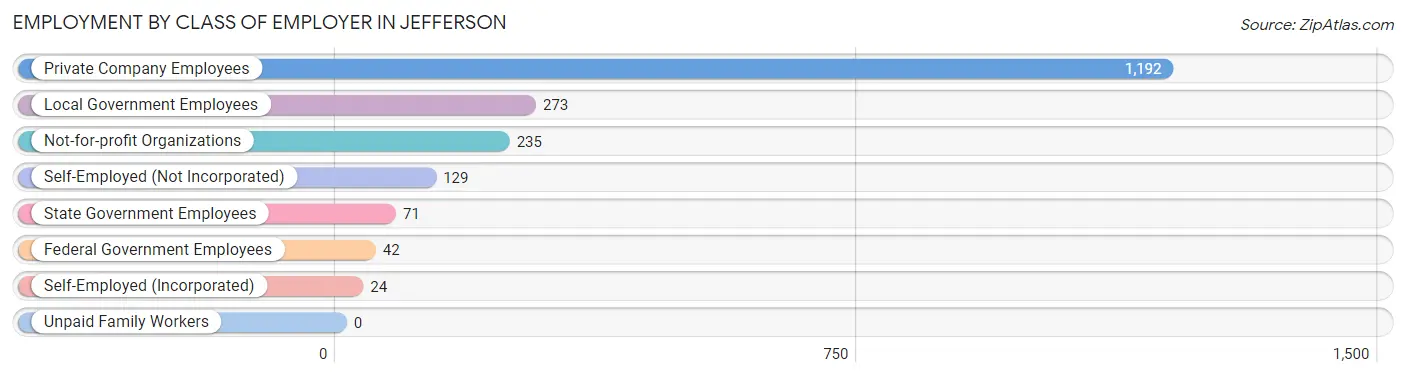
| Employer Class | # Employees | % Employees |
| Private Company Employees | 1,192 | 60.6% |
| Self-Employed (Incorporated) | 24 | 1.2% |
| Self-Employed (Not Incorporated) | 129 | 6.6% |
| Not-for-profit Organizations | 235 | 11.9% |
| Local Government Employees | 273 | 13.9% |
| State Government Employees | 71 | 3.6% |
| Federal Government Employees | 42 | 2.1% |
| Unpaid Family Workers | 0 | 0.0% |
| Total | 1,966 | 100.0% |
Employment Status by Age in Jefferson
According to the labor force statistics for Jefferson, out of the total population over 16 years of age (3,498), 57.4% or 2,008 individuals are in the labor force, with 2.1% or 42 of them unemployed. The age group with the highest labor force participation rate is 20 to 24 years, with 99.2% or 234 individuals in the labor force. Within the labor force, the 45 to 54 years age range has the highest percentage of unemployed individuals, with 6.0% or 16 of them being unemployed.
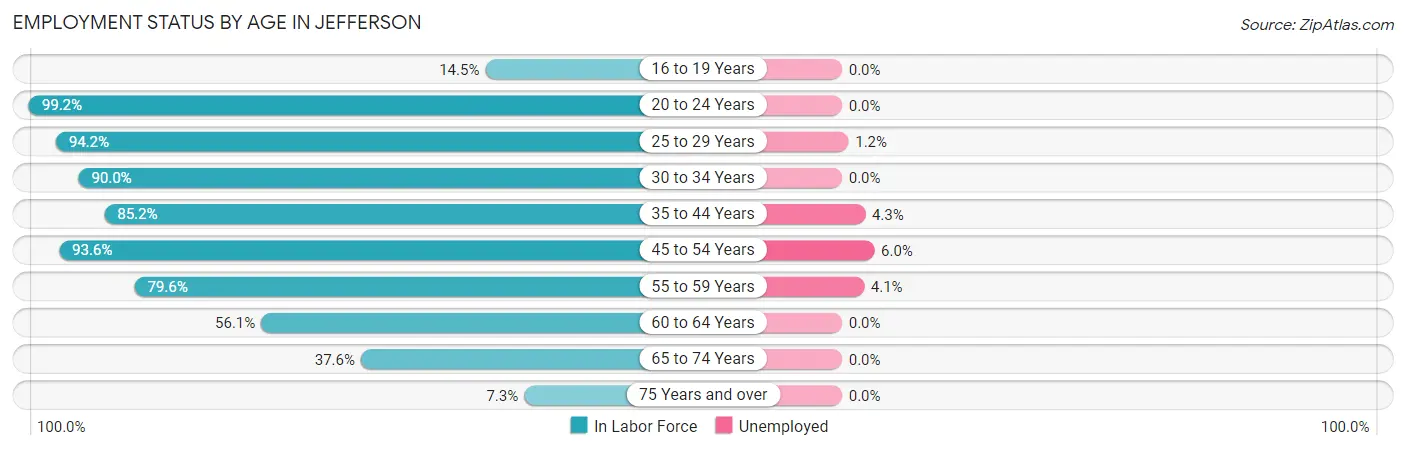
| Age Bracket | In Labor Force | Unemployed |
| 16 to 19 Years | 32 (14.5%) | 0 (0.0%) |
| 20 to 24 Years | 234 (99.2%) | 0 (0.0%) |
| 25 to 29 Years | 161 (94.2%) | 2 (1.2%) |
| 30 to 34 Years | 234 (90.0%) | 0 (0.0%) |
| 35 to 44 Years | 375 (85.2%) | 16 (4.3%) |
| 45 to 54 Years | 265 (93.6%) | 16 (6.0%) |
| 55 to 59 Years | 222 (79.6%) | 9 (4.1%) |
| 60 to 64 Years | 220 (56.1%) | 0 (0.0%) |
| 65 to 74 Years | 220 (37.6%) | 0 (0.0%) |
| 75 Years and over | 46 (7.3%) | 0 (0.0%) |
| Total | 2,008 (57.4%) | 42 (2.1%) |
Employment Status by Educational Attainment in Jefferson
According to labor force statistics for Jefferson, 80.9% of individuals (1,476) out of the total population between 25 and 64 years of age (1,825) are in the labor force, with 2.9% or 43 of them being unemployed. The group with the highest labor force participation rate are those with the educational attainment of bachelor's degree or higher, with 97.0% or 417 individuals in the labor force. Within the labor force, individuals with less than high school education have the highest percentage of unemployment, with 27.6% or 8 of them being unemployed.
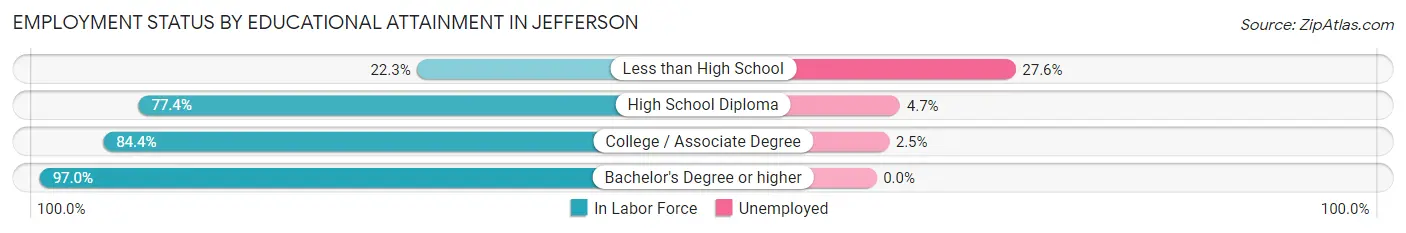
| Educational Attainment | In Labor Force | Unemployed |
| Less than High School | 29 (22.3%) | 36 (27.6%) |
| High School Diploma | 403 (77.4%) | 24 (4.7%) |
| College / Associate Degree | 628 (84.4%) | 19 (2.5%) |
| Bachelor's Degree or higher | 417 (97.0%) | 0 (0.0%) |
| Total | 1,476 (80.9%) | 53 (2.9%) |
Employment Occupations by Sex in Jefferson
Management, Business, Science and Arts Occupations
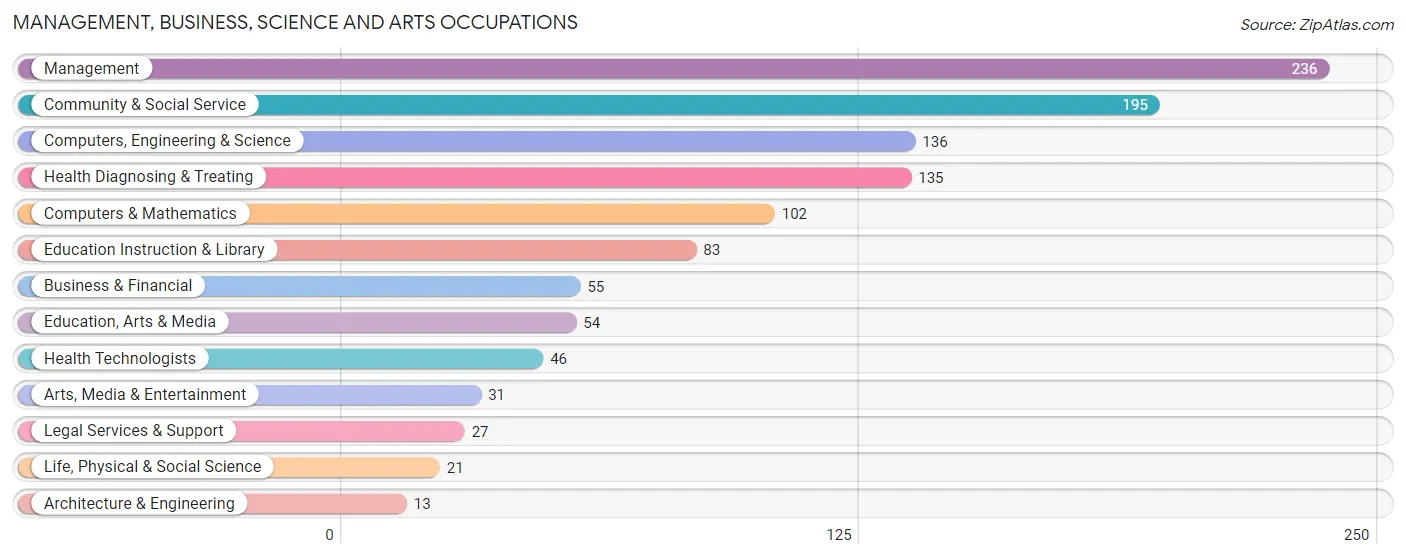
The most common Management, Business, Science and Arts occupations in Jefferson are Management (236 | 12.0%), Community & Social Service (195 | 9.9%), Computers, Engineering & Science (136 | 6.9%), Health Diagnosing & Treating (135 | 6.9%), and Computers & Mathematics (102 | 5.2%).
Management, Business, Science and Arts Occupations by Sex
Within the Management, Business, Science and Arts occupations in Jefferson, the most male-oriented occupations are Computers, Engineering & Science (100.0%), Computers & Mathematics (100.0%), and Architecture & Engineering (100.0%), while the most female-oriented occupations are Education Instruction & Library (100.0%), Arts, Media & Entertainment (100.0%), and Health Diagnosing & Treating (83.0%).
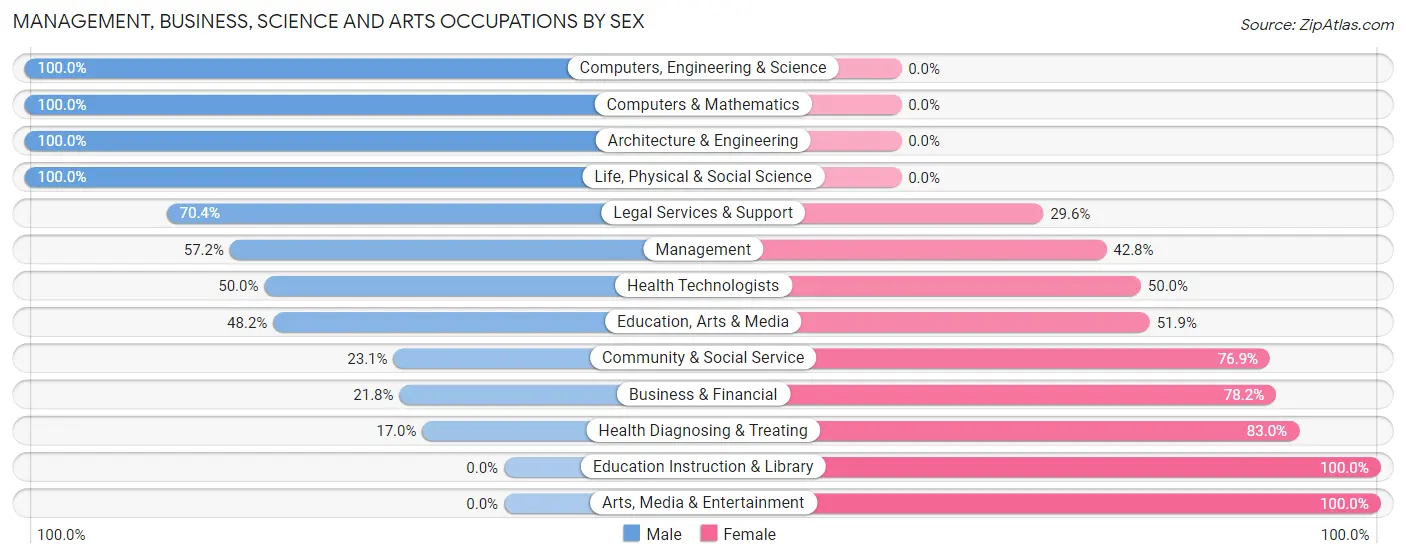
| Occupation | Male | Female |
| Management | 135 (57.2%) | 101 (42.8%) |
| Business & Financial | 12 (21.8%) | 43 (78.2%) |
| Computers, Engineering & Science | 136 (100.0%) | 0 (0.0%) |
| Computers & Mathematics | 102 (100.0%) | 0 (0.0%) |
| Architecture & Engineering | 13 (100.0%) | 0 (0.0%) |
| Life, Physical & Social Science | 21 (100.0%) | 0 (0.0%) |
| Community & Social Service | 45 (23.1%) | 150 (76.9%) |
| Education, Arts & Media | 26 (48.1%) | 28 (51.8%) |
| Legal Services & Support | 19 (70.4%) | 8 (29.6%) |
| Education Instruction & Library | 0 (0.0%) | 83 (100.0%) |
| Arts, Media & Entertainment | 0 (0.0%) | 31 (100.0%) |
| Health Diagnosing & Treating | 23 (17.0%) | 112 (83.0%) |
| Health Technologists | 23 (50.0%) | 23 (50.0%) |
| Total (Category) | 351 (46.4%) | 406 (53.6%) |
| Total (Overall) | 1,030 (52.4%) | 936 (47.6%) |
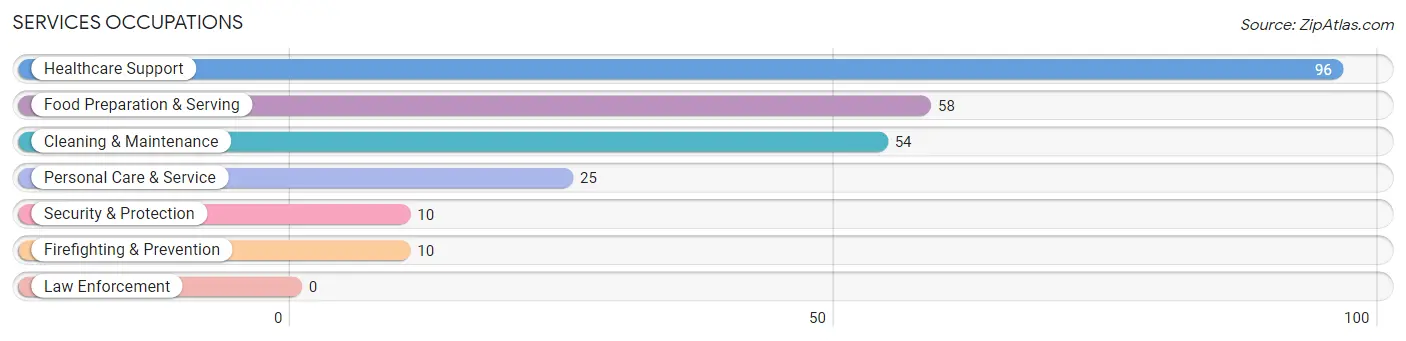
Services Occupations
The most common Services occupations in Jefferson are Healthcare Support (96 | 4.9%), Food Preparation & Serving (58 | 2.9%), Cleaning & Maintenance (54 | 2.8%), Personal Care & Service (25 | 1.3%), and Security & Protection (10 | 0.5%).
Services Occupations by Sex
Within the Services occupations in Jefferson, the most male-oriented occupations are Security & Protection (100.0%), Firefighting & Prevention (100.0%), and Cleaning & Maintenance (85.2%), while the most female-oriented occupations are Healthcare Support (100.0%), Personal Care & Service (100.0%), and Food Preparation & Serving (22.4%).
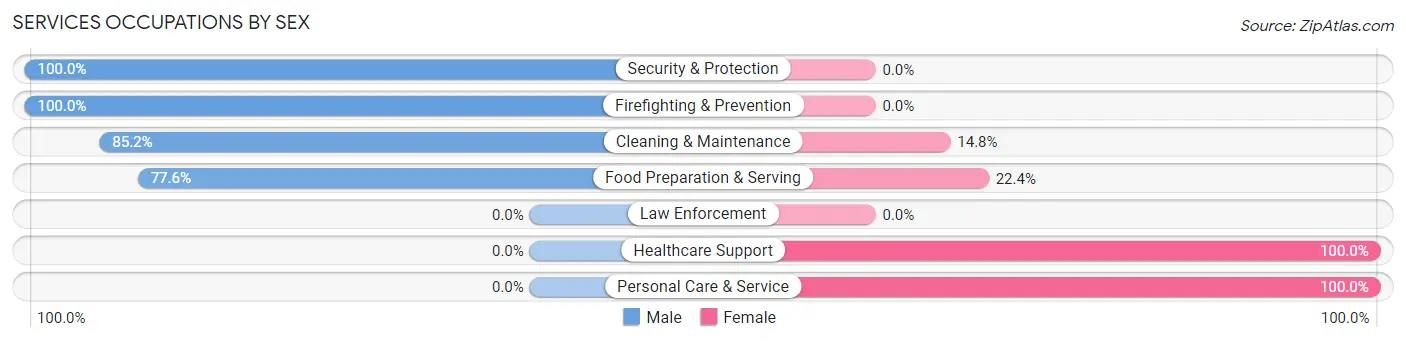
| Occupation | Male | Female |
| Healthcare Support | 0 (0.0%) | 96 (100.0%) |
| Security & Protection | 10 (100.0%) | 0 (0.0%) |
| Firefighting & Prevention | 10 (100.0%) | 0 (0.0%) |
| Law Enforcement | 0 (0.0%) | 0 (0.0%) |
| Food Preparation & Serving | 45 (77.6%) | 13 (22.4%) |
| Cleaning & Maintenance | 46 (85.2%) | 8 (14.8%) |
| Personal Care & Service | 0 (0.0%) | 25 (100.0%) |
| Total (Category) | 101 (41.6%) | 142 (58.4%) |
| Total (Overall) | 1,030 (52.4%) | 936 (47.6%) |
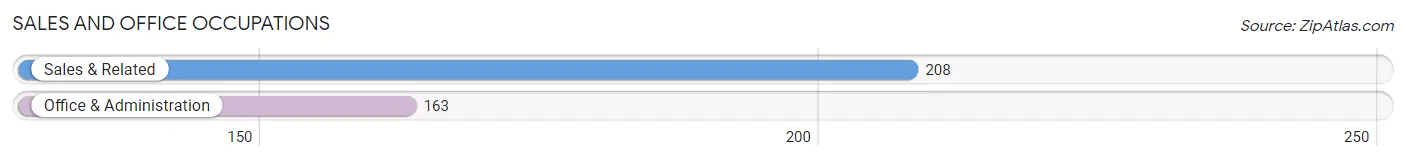
Sales and Office Occupations
The most common Sales and Office occupations in Jefferson are Sales & Related (208 | 10.6%), and Office & Administration (163 | 8.3%).
Sales and Office Occupations by Sex
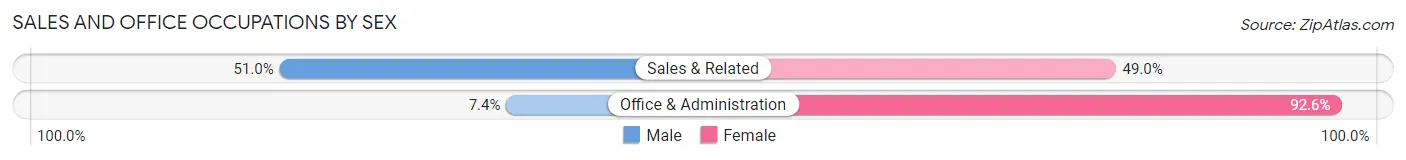
| Occupation | Male | Female |
| Sales & Related | 106 (51.0%) | 102 (49.0%) |
| Office & Administration | 12 (7.4%) | 151 (92.6%) |
| Total (Category) | 118 (31.8%) | 253 (68.2%) |
| Total (Overall) | 1,030 (52.4%) | 936 (47.6%) |
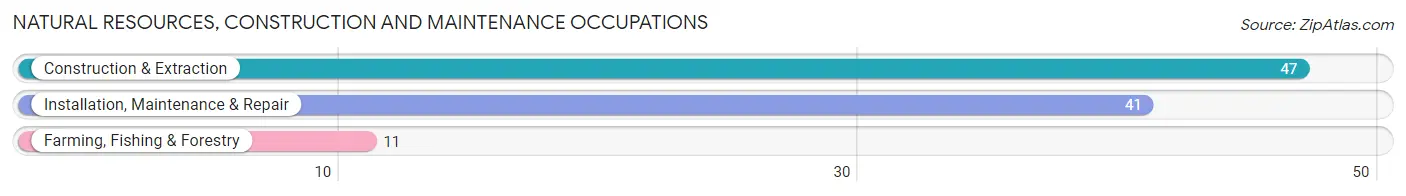
Natural Resources, Construction and Maintenance Occupations
The most common Natural Resources, Construction and Maintenance occupations in Jefferson are Construction & Extraction (47 | 2.4%), Installation, Maintenance & Repair (41 | 2.1%), and Farming, Fishing & Forestry (11 | 0.6%).
Natural Resources, Construction and Maintenance Occupations by Sex
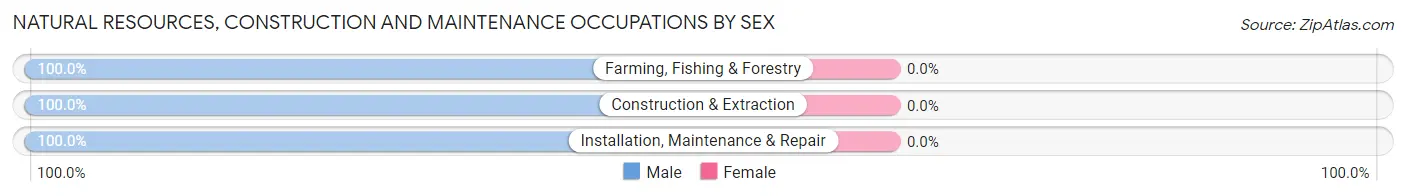
| Occupation | Male | Female |
| Farming, Fishing & Forestry | 11 (100.0%) | 0 (0.0%) |
| Construction & Extraction | 47 (100.0%) | 0 (0.0%) |
| Installation, Maintenance & Repair | 41 (100.0%) | 0 (0.0%) |
| Total (Category) | 99 (100.0%) | 0 (0.0%) |
| Total (Overall) | 1,030 (52.4%) | 936 (47.6%) |
Production, Transportation and Moving Occupations
The most common Production, Transportation and Moving occupations in Jefferson are Material Moving (188 | 9.6%), Production (178 | 9.0%), and Transportation (130 | 6.6%).

Production, Transportation and Moving Occupations by Sex
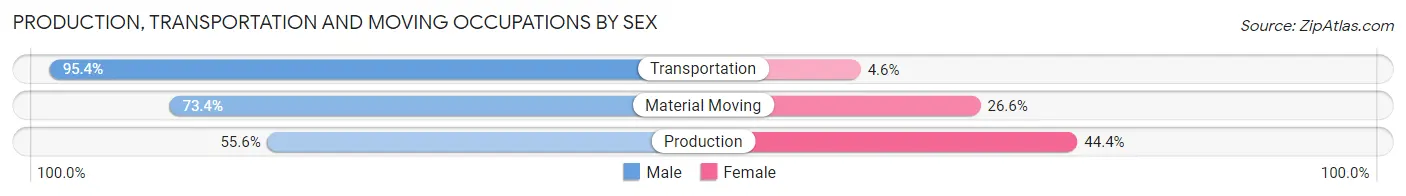
| Occupation | Male | Female |
| Production | 99 (55.6%) | 79 (44.4%) |
| Transportation | 124 (95.4%) | 6 (4.6%) |
| Material Moving | 138 (73.4%) | 50 (26.6%) |
| Total (Category) | 361 (72.8%) | 135 (27.2%) |
| Total (Overall) | 1,030 (52.4%) | 936 (47.6%) |
Employment Industries by Sex in Jefferson
Employment Industries in Jefferson
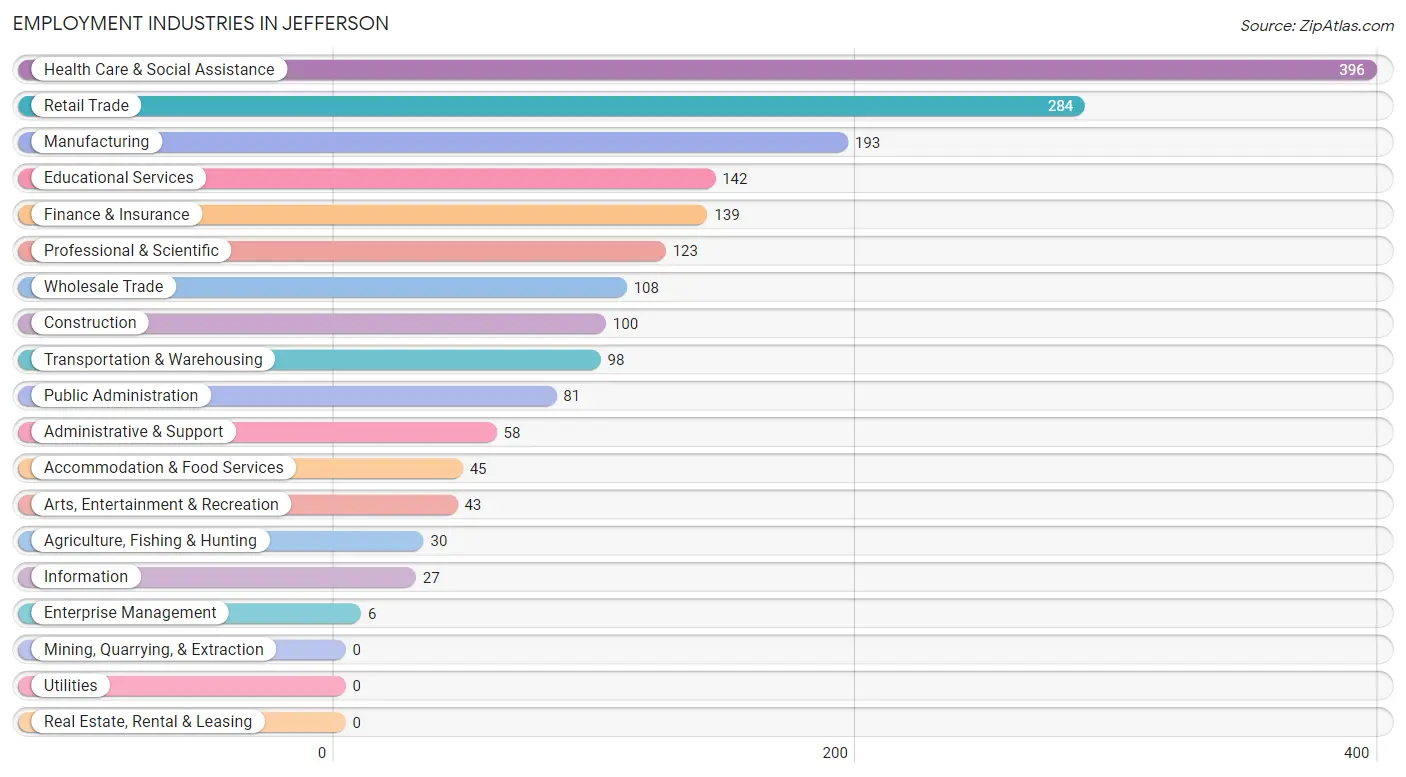
The major employment industries in Jefferson include Health Care & Social Assistance (396 | 20.1%), Retail Trade (284 | 14.4%), Manufacturing (193 | 9.8%), Educational Services (142 | 7.2%), and Finance & Insurance (139 | 7.1%).
Employment Industries by Sex in Jefferson
The Jefferson industries that see more men than women are Wholesale Trade (100.0%), Enterprise Management (100.0%), and Construction (95.0%), whereas the industries that tend to have a higher number of women are Health Care & Social Assistance (82.3%), Information (74.1%), and Finance & Insurance (69.8%).
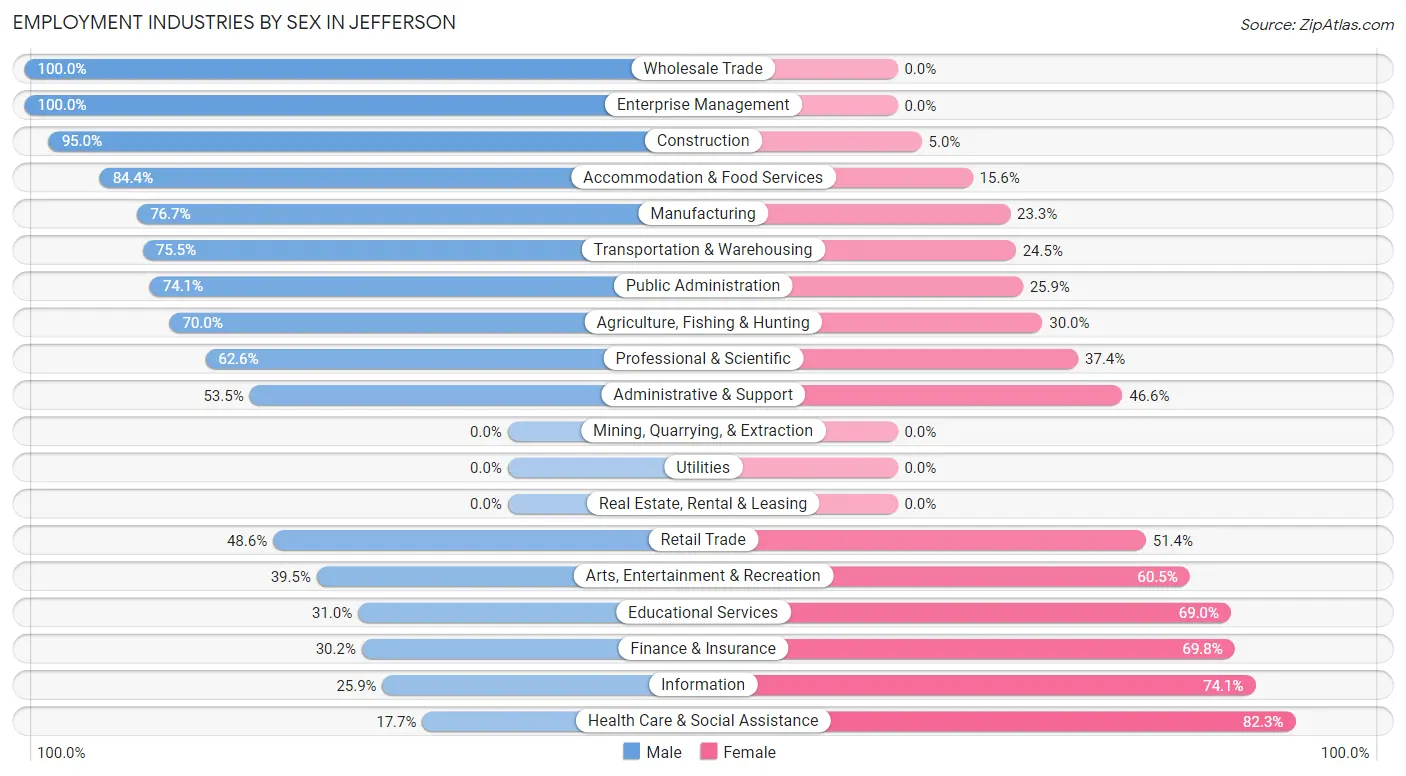
| Industry | Male | Female |
| Agriculture, Fishing & Hunting | 21 (70.0%) | 9 (30.0%) |
| Mining, Quarrying, & Extraction | 0 (0.0%) | 0 (0.0%) |
| Construction | 95 (95.0%) | 5 (5.0%) |
| Manufacturing | 148 (76.7%) | 45 (23.3%) |
| Wholesale Trade | 108 (100.0%) | 0 (0.0%) |
| Retail Trade | 138 (48.6%) | 146 (51.4%) |
| Transportation & Warehousing | 74 (75.5%) | 24 (24.5%) |
| Utilities | 0 (0.0%) | 0 (0.0%) |
| Information | 7 (25.9%) | 20 (74.1%) |
| Finance & Insurance | 42 (30.2%) | 97 (69.8%) |
| Real Estate, Rental & Leasing | 0 (0.0%) | 0 (0.0%) |
| Professional & Scientific | 77 (62.6%) | 46 (37.4%) |
| Enterprise Management | 6 (100.0%) | 0 (0.0%) |
| Administrative & Support | 31 (53.4%) | 27 (46.6%) |
| Educational Services | 44 (31.0%) | 98 (69.0%) |
| Health Care & Social Assistance | 70 (17.7%) | 326 (82.3%) |
| Arts, Entertainment & Recreation | 17 (39.5%) | 26 (60.5%) |
| Accommodation & Food Services | 38 (84.4%) | 7 (15.6%) |
| Public Administration | 60 (74.1%) | 21 (25.9%) |
| Total | 1,030 (52.4%) | 936 (47.6%) |
Education in Jefferson
School Enrollment in Jefferson
The most common levels of schooling among the 787 students in Jefferson are middle school (206 | 26.2%), high school (178 | 22.6%), and elementary school (164 | 20.8%).
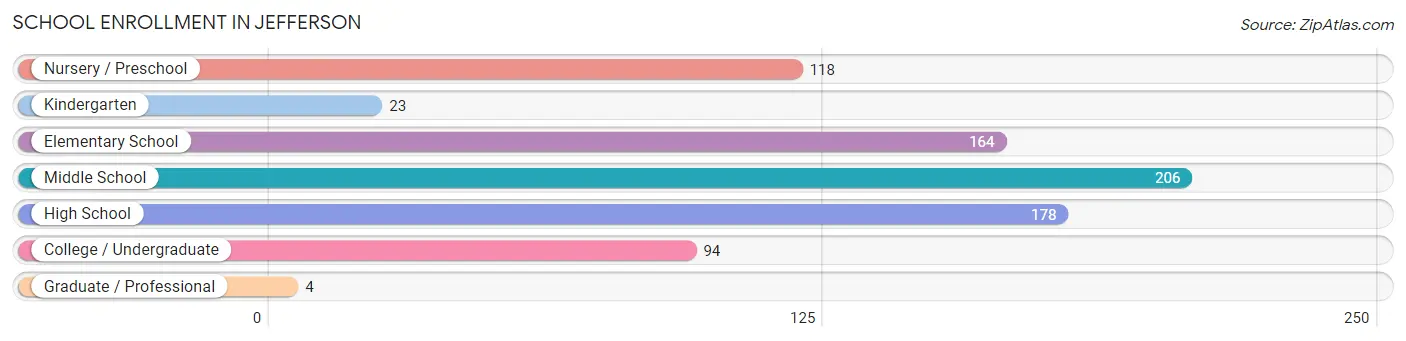
| School Level | # Students | % Students |
| Nursery / Preschool | 118 | 15.0% |
| Kindergarten | 23 | 2.9% |
| Elementary School | 164 | 20.8% |
| Middle School | 206 | 26.2% |
| High School | 178 | 22.6% |
| College / Undergraduate | 94 | 11.9% |
| Graduate / Professional | 4 | 0.5% |
| Total | 787 | 100.0% |
School Enrollment by Age by Funding Source in Jefferson
Out of a total of 787 students who are enrolled in schools in Jefferson, 84 (10.7%) attend a private institution, while the remaining 703 (89.3%) are enrolled in public schools. The age group of 10 to 14 year olds has the highest likelihood of being enrolled in private schools, with 56 (22.1% in the age bracket) enrolled. Conversely, the age group of 3 to 4 year olds has the lowest likelihood of being enrolled in a private school, with 68 (100.0% in the age bracket) attending a public institution.
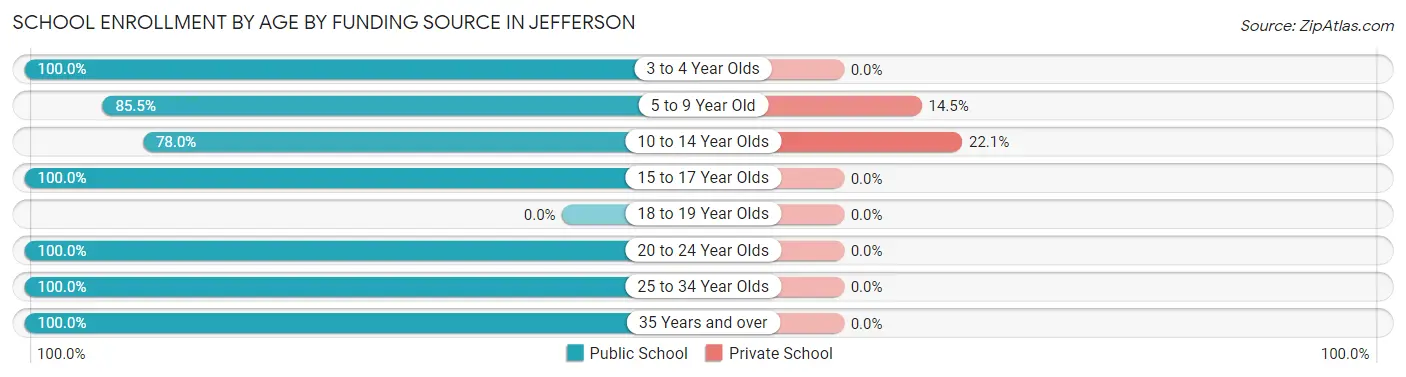
| Age Bracket | Public School | Private School |
| 3 to 4 Year Olds | 68 (100.0%) | 0 (0.0%) |
| 5 to 9 Year Old | 165 (85.5%) | 28 (14.5%) |
| 10 to 14 Year Olds | 198 (77.9%) | 56 (22.1%) |
| 15 to 17 Year Olds | 151 (100.0%) | 0 (0.0%) |
| 18 to 19 Year Olds | 0 (0.0%) | 0 (0.0%) |
| 20 to 24 Year Olds | 30 (100.0%) | 0 (0.0%) |
| 25 to 34 Year Olds | 65 (100.0%) | 0 (0.0%) |
| 35 Years and over | 26 (100.0%) | 0 (0.0%) |
| Total | 703 (89.3%) | 84 (10.7%) |
Educational Attainment by Field of Study in Jefferson
Education (141 | 18.6%), business (126 | 16.7%), bio, nature & agricultural (101 | 13.4%), science & technology (67 | 8.9%), and social sciences (55 | 7.3%) are the most common fields of study among 756 individuals in Jefferson who have obtained a bachelor's degree or higher.
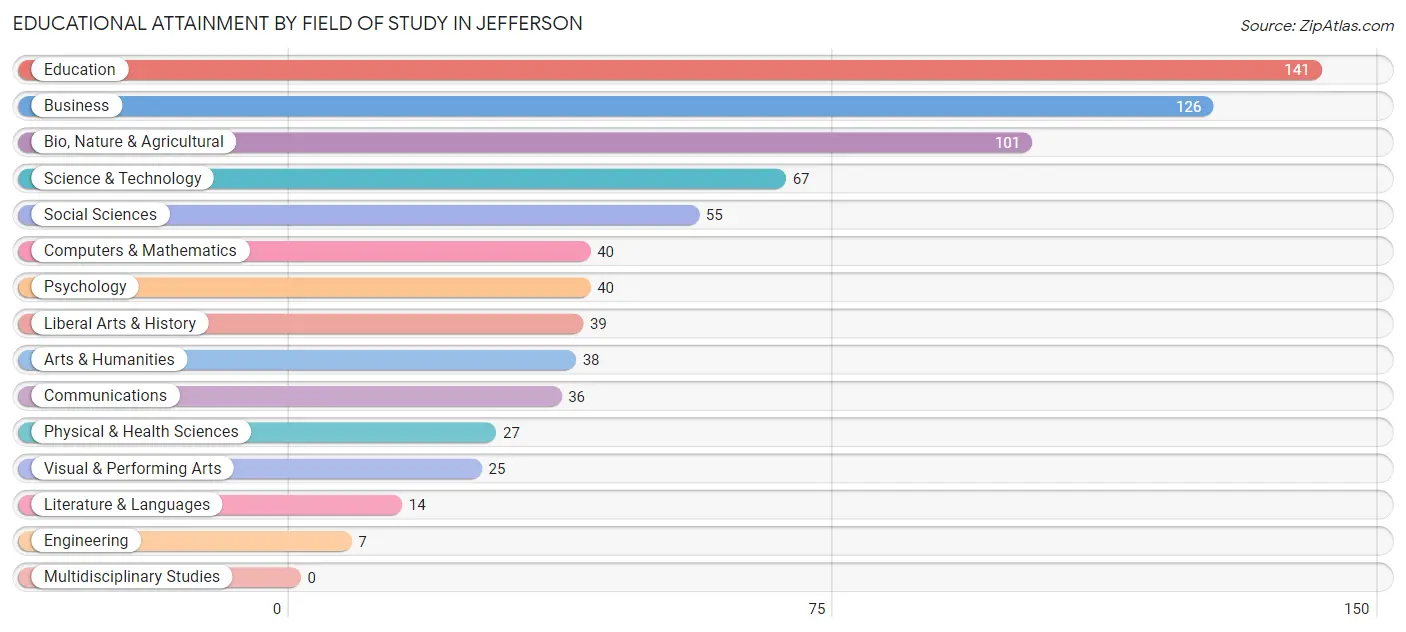
| Field of Study | # Graduates | % Graduates |
| Computers & Mathematics | 40 | 5.3% |
| Bio, Nature & Agricultural | 101 | 13.4% |
| Physical & Health Sciences | 27 | 3.6% |
| Psychology | 40 | 5.3% |
| Social Sciences | 55 | 7.3% |
| Engineering | 7 | 0.9% |
| Multidisciplinary Studies | 0 | 0.0% |
| Science & Technology | 67 | 8.9% |
| Business | 126 | 16.7% |
| Education | 141 | 18.6% |
| Literature & Languages | 14 | 1.8% |
| Liberal Arts & History | 39 | 5.2% |
| Visual & Performing Arts | 25 | 3.3% |
| Communications | 36 | 4.8% |
| Arts & Humanities | 38 | 5.0% |
| Total | 756 | 100.0% |
Transportation & Commute in Jefferson
Vehicle Availability by Sex in Jefferson
The most prevalent vehicle ownership categories in Jefferson are males with 2 vehicles (540, accounting for 52.5%) and females with 2 vehicles (417, making up 58.1%).
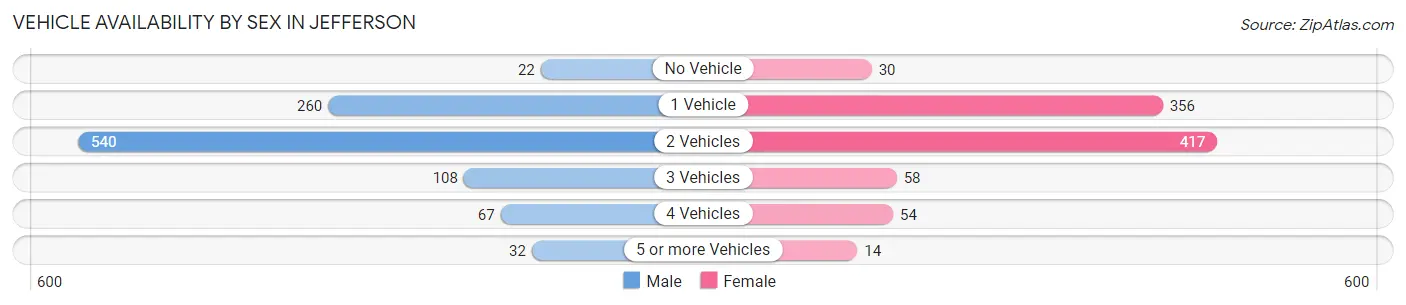
| Vehicles Available | Male | Female |
| No Vehicle | 22 (2.1%) | 30 (3.2%) |
| 1 Vehicle | 260 (25.3%) | 356 (38.3%) |
| 2 Vehicles | 540 (52.5%) | 417 (44.9%) |
| 3 Vehicles | 108 (10.5%) | 58 (6.2%) |
| 4 Vehicles | 67 (6.5%) | 54 (5.8%) |
| 5 or more Vehicles | 32 (3.1%) | 14 (1.5%) |
| Total | 1,029 (100.0%) | 929 (100.0%) |
Commute Time in Jefferson
The most frequently occuring commute durations in Jefferson are 5 to 9 minutes (591 commuters, 31.8%), less than 5 minutes (320 commuters, 17.2%), and 35 to 39 minutes (180 commuters, 9.7%).
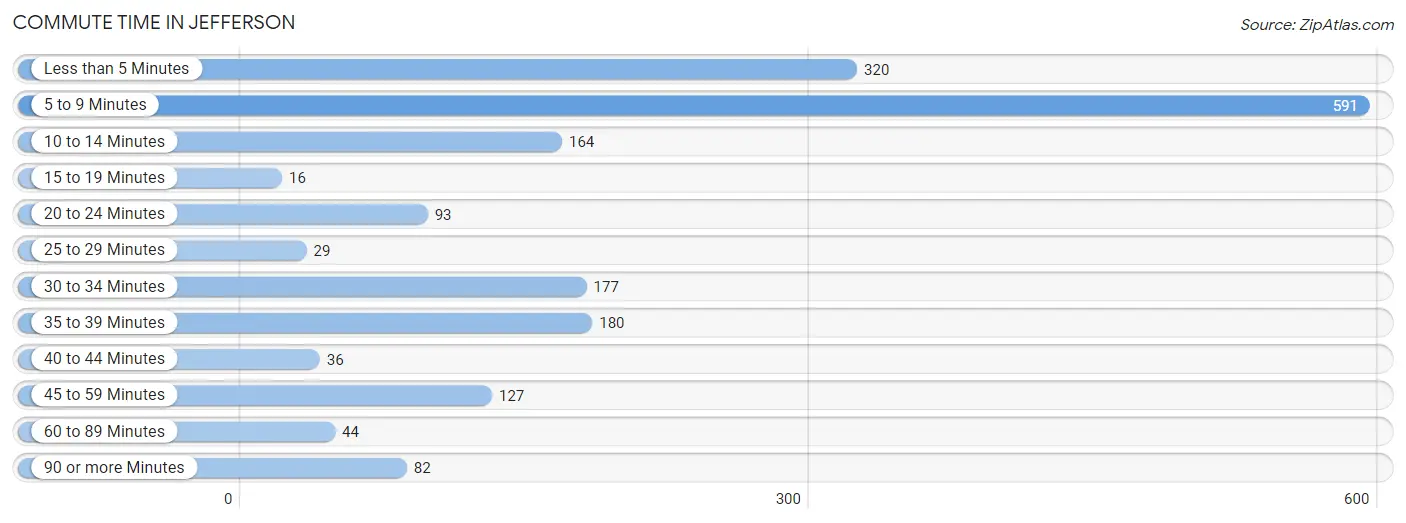
| Commute Time | # Commuters | % Commuters |
| Less than 5 Minutes | 320 | 17.2% |
| 5 to 9 Minutes | 591 | 31.8% |
| 10 to 14 Minutes | 164 | 8.8% |
| 15 to 19 Minutes | 16 | 0.9% |
| 20 to 24 Minutes | 93 | 5.0% |
| 25 to 29 Minutes | 29 | 1.6% |
| 30 to 34 Minutes | 177 | 9.5% |
| 35 to 39 Minutes | 180 | 9.7% |
| 40 to 44 Minutes | 36 | 1.9% |
| 45 to 59 Minutes | 127 | 6.8% |
| 60 to 89 Minutes | 44 | 2.4% |
| 90 or more Minutes | 82 | 4.4% |
Commute Time by Sex in Jefferson
The most common commute times in Jefferson are 5 to 9 minutes (225 commuters, 22.5%) for males and 5 to 9 minutes (366 commuters, 42.7%) for females.
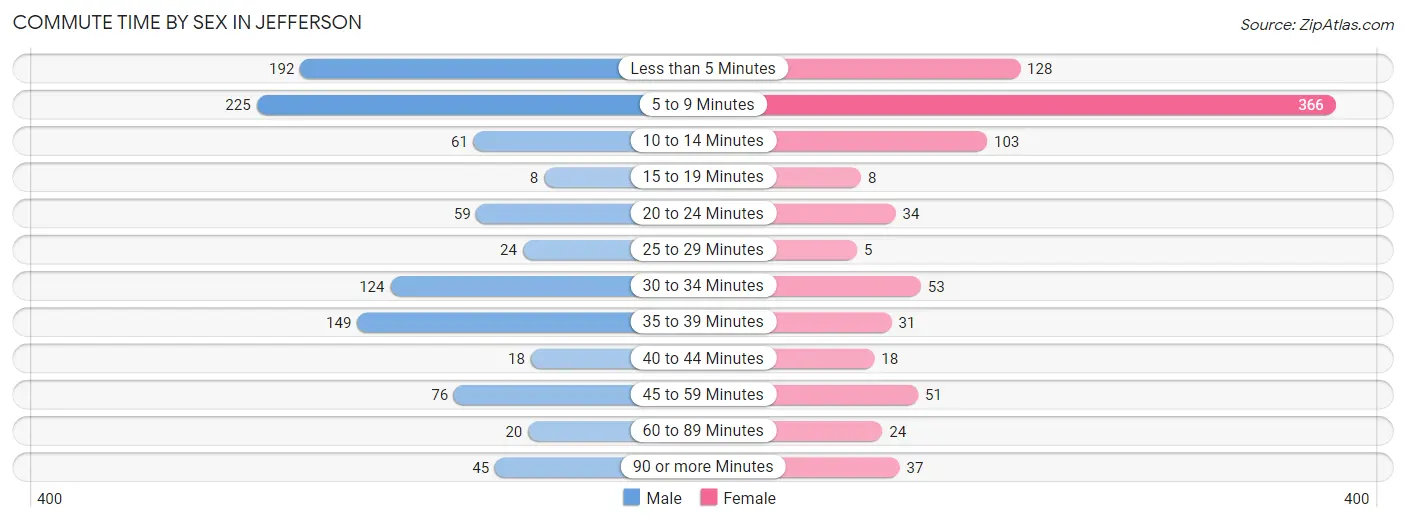
| Commute Time | Male | Female |
| Less than 5 Minutes | 192 (19.2%) | 128 (14.9%) |
| 5 to 9 Minutes | 225 (22.5%) | 366 (42.7%) |
| 10 to 14 Minutes | 61 (6.1%) | 103 (12.0%) |
| 15 to 19 Minutes | 8 (0.8%) | 8 (0.9%) |
| 20 to 24 Minutes | 59 (5.9%) | 34 (4.0%) |
| 25 to 29 Minutes | 24 (2.4%) | 5 (0.6%) |
| 30 to 34 Minutes | 124 (12.4%) | 53 (6.2%) |
| 35 to 39 Minutes | 149 (14.9%) | 31 (3.6%) |
| 40 to 44 Minutes | 18 (1.8%) | 18 (2.1%) |
| 45 to 59 Minutes | 76 (7.6%) | 51 (5.9%) |
| 60 to 89 Minutes | 20 (2.0%) | 24 (2.8%) |
| 90 or more Minutes | 45 (4.5%) | 37 (4.3%) |
Time of Departure to Work by Sex in Jefferson
The most frequent times of departure to work in Jefferson are 7:00 AM to 7:29 AM (225, 22.5%) for males and 7:30 AM to 7:59 AM (184, 21.4%) for females.
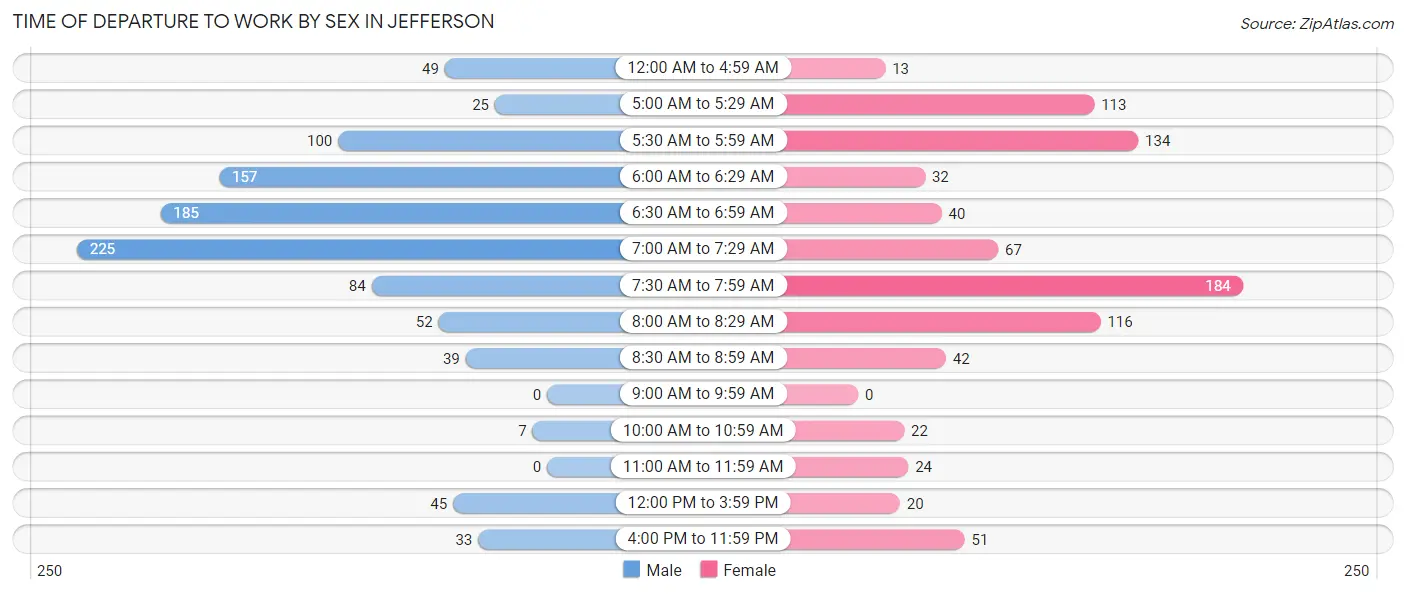
| Time of Departure | Male | Female |
| 12:00 AM to 4:59 AM | 49 (4.9%) | 13 (1.5%) |
| 5:00 AM to 5:29 AM | 25 (2.5%) | 113 (13.2%) |
| 5:30 AM to 5:59 AM | 100 (10.0%) | 134 (15.6%) |
| 6:00 AM to 6:29 AM | 157 (15.7%) | 32 (3.7%) |
| 6:30 AM to 6:59 AM | 185 (18.5%) | 40 (4.7%) |
| 7:00 AM to 7:29 AM | 225 (22.5%) | 67 (7.8%) |
| 7:30 AM to 7:59 AM | 84 (8.4%) | 184 (21.4%) |
| 8:00 AM to 8:29 AM | 52 (5.2%) | 116 (13.5%) |
| 8:30 AM to 8:59 AM | 39 (3.9%) | 42 (4.9%) |
| 9:00 AM to 9:59 AM | 0 (0.0%) | 0 (0.0%) |
| 10:00 AM to 10:59 AM | 7 (0.7%) | 22 (2.6%) |
| 11:00 AM to 11:59 AM | 0 (0.0%) | 24 (2.8%) |
| 12:00 PM to 3:59 PM | 45 (4.5%) | 20 (2.3%) |
| 4:00 PM to 11:59 PM | 33 (3.3%) | 51 (5.9%) |
| Total | 1,001 (100.0%) | 858 (100.0%) |
Housing Occupancy in Jefferson
Occupancy by Ownership in Jefferson
Of the total 2,001 dwellings in Jefferson, owner-occupied units account for 1,432 (71.6%), while renter-occupied units make up 569 (28.4%).
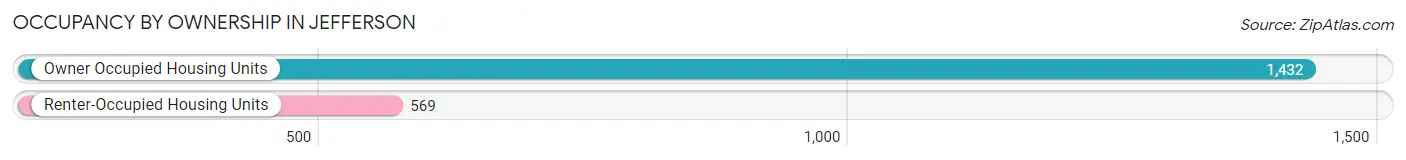
| Occupancy | # Housing Units | % Housing Units |
| Owner Occupied Housing Units | 1,432 | 71.6% |
| Renter-Occupied Housing Units | 569 | 28.4% |
| Total Occupied Housing Units | 2,001 | 100.0% |
Occupancy by Household Size in Jefferson
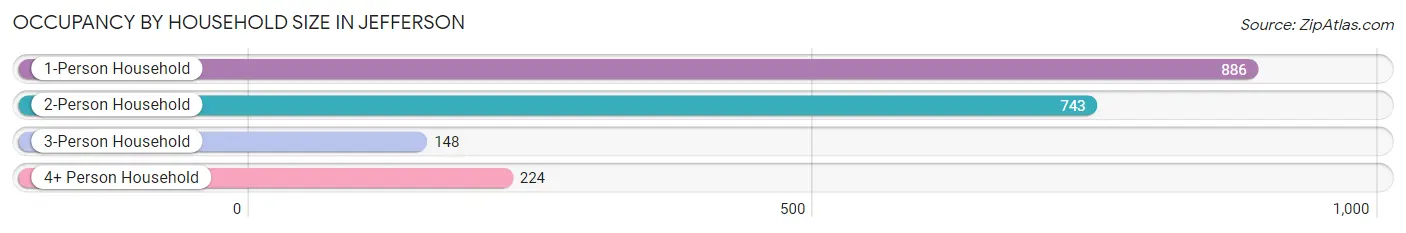
| Household Size | # Housing Units | % Housing Units |
| 1-Person Household | 886 | 44.3% |
| 2-Person Household | 743 | 37.1% |
| 3-Person Household | 148 | 7.4% |
| 4+ Person Household | 224 | 11.2% |
| Total Housing Units | 2,001 | 100.0% |
Occupancy by Ownership by Household Size in Jefferson
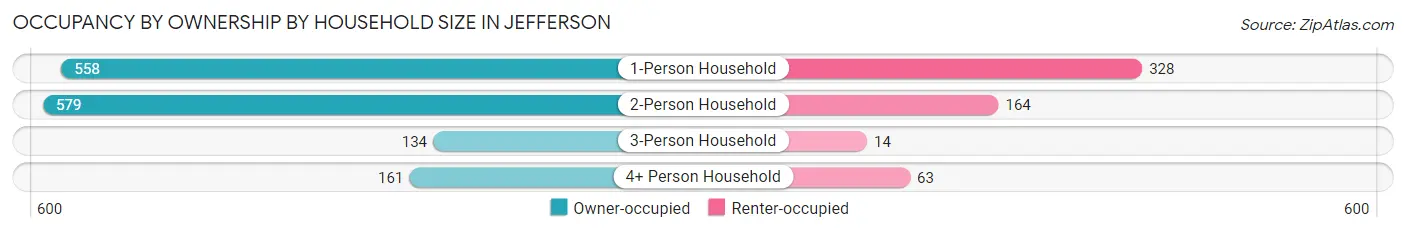
| Household Size | Owner-occupied | Renter-occupied |
| 1-Person Household | 558 (63.0%) | 328 (37.0%) |
| 2-Person Household | 579 (77.9%) | 164 (22.1%) |
| 3-Person Household | 134 (90.5%) | 14 (9.5%) |
| 4+ Person Household | 161 (71.9%) | 63 (28.1%) |
| Total Housing Units | 1,432 (71.6%) | 569 (28.4%) |
Occupancy by Educational Attainment in Jefferson
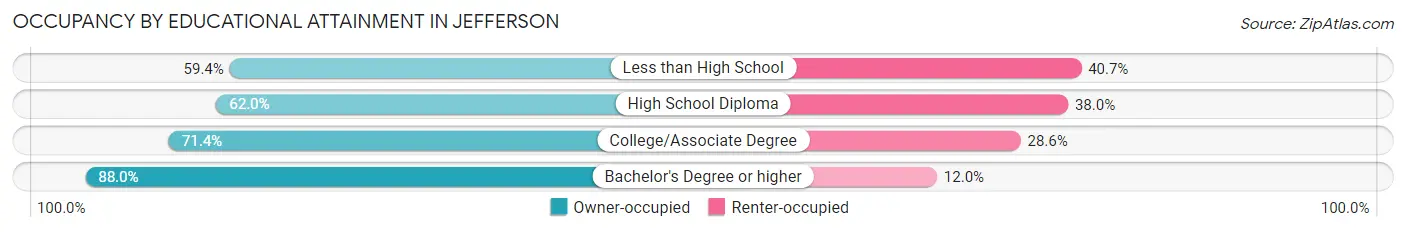
| Household Size | Owner-occupied | Renter-occupied |
| Less than High School | 92 (59.4%) | 63 (40.6%) |
| High School Diploma | 352 (62.0%) | 216 (38.0%) |
| College/Associate Degree | 586 (71.4%) | 235 (28.6%) |
| Bachelor's Degree or higher | 402 (88.0%) | 55 (12.0%) |
Occupancy by Age of Householder in Jefferson
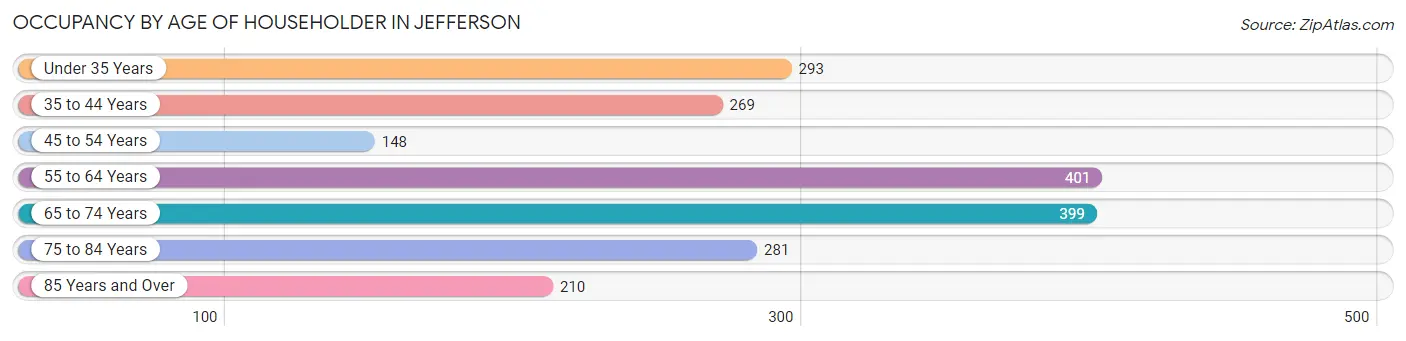
| Age Bracket | # Households | % Households |
| Under 35 Years | 293 | 14.6% |
| 35 to 44 Years | 269 | 13.4% |
| 45 to 54 Years | 148 | 7.4% |
| 55 to 64 Years | 401 | 20.0% |
| 65 to 74 Years | 399 | 19.9% |
| 75 to 84 Years | 281 | 14.0% |
| 85 Years and Over | 210 | 10.5% |
| Total | 2,001 | 100.0% |
Housing Finances in Jefferson
Median Income by Occupancy in Jefferson
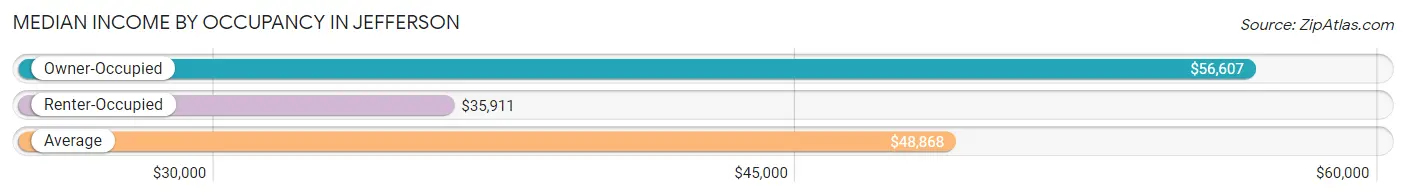
| Occupancy Type | # Households | Median Income |
| Owner-Occupied | 1,432 (71.6%) | $56,607 |
| Renter-Occupied | 569 (28.4%) | $35,911 |
| Average | 2,001 (100.0%) | $48,868 |
Occupancy by Householder Income Bracket in Jefferson
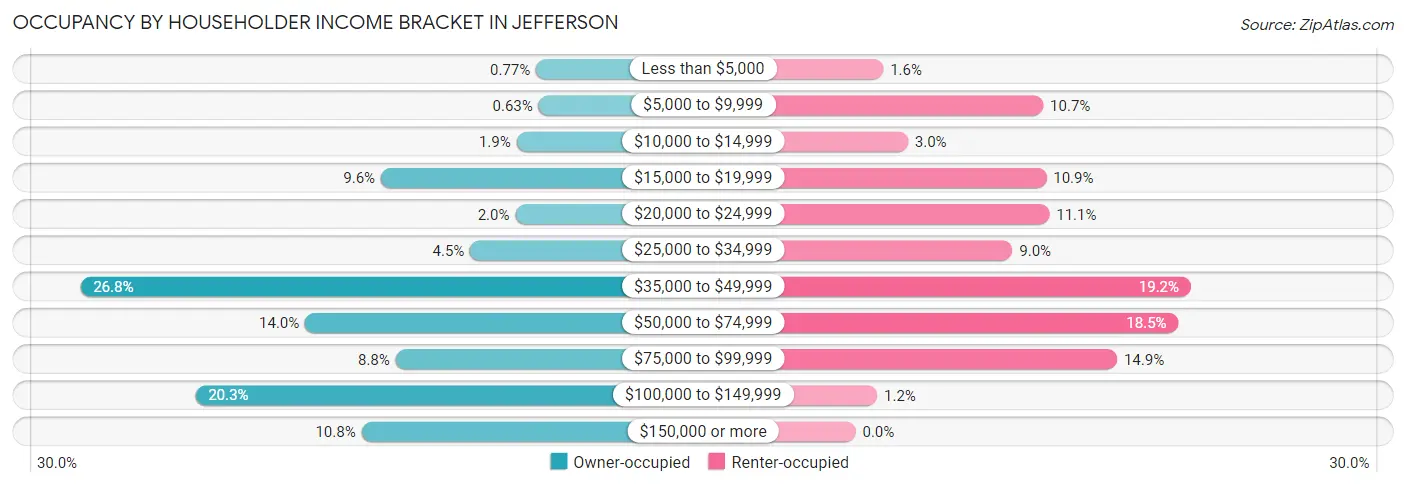
| Income Bracket | Owner-occupied | Renter-occupied |
| Less than $5,000 | 11 (0.8%) | 9 (1.6%) |
| $5,000 to $9,999 | 9 (0.6%) | 61 (10.7%) |
| $10,000 to $14,999 | 27 (1.9%) | 17 (3.0%) |
| $15,000 to $19,999 | 138 (9.6%) | 62 (10.9%) |
| $20,000 to $24,999 | 28 (2.0%) | 63 (11.1%) |
| $25,000 to $34,999 | 65 (4.5%) | 51 (9.0%) |
| $35,000 to $49,999 | 384 (26.8%) | 109 (19.2%) |
| $50,000 to $74,999 | 200 (14.0%) | 105 (18.4%) |
| $75,000 to $99,999 | 126 (8.8%) | 85 (14.9%) |
| $100,000 to $149,999 | 290 (20.3%) | 7 (1.2%) |
| $150,000 or more | 154 (10.7%) | 0 (0.0%) |
| Total | 1,432 (100.0%) | 569 (100.0%) |
Monthly Housing Cost Tiers in Jefferson
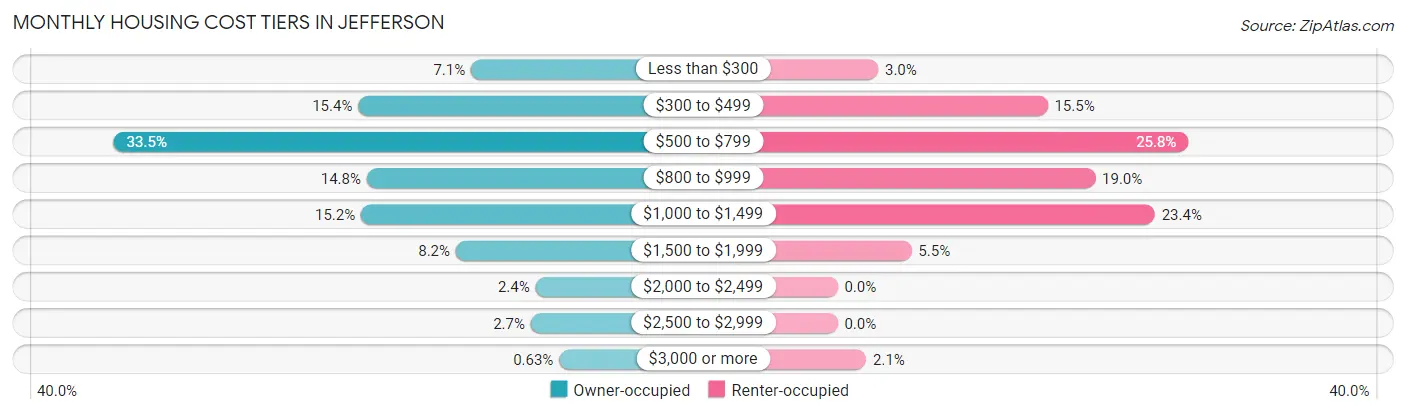
| Monthly Cost | Owner-occupied | Renter-occupied |
| Less than $300 | 102 (7.1%) | 17 (3.0%) |
| $300 to $499 | 221 (15.4%) | 88 (15.5%) |
| $500 to $799 | 479 (33.5%) | 147 (25.8%) |
| $800 to $999 | 212 (14.8%) | 108 (19.0%) |
| $1,000 to $1,499 | 218 (15.2%) | 133 (23.4%) |
| $1,500 to $1,999 | 118 (8.2%) | 31 (5.4%) |
| $2,000 to $2,499 | 34 (2.4%) | 0 (0.0%) |
| $2,500 to $2,999 | 39 (2.7%) | 0 (0.0%) |
| $3,000 or more | 9 (0.6%) | 12 (2.1%) |
| Total | 1,432 (100.0%) | 569 (100.0%) |
Physical Housing Characteristics in Jefferson
Housing Structures in Jefferson
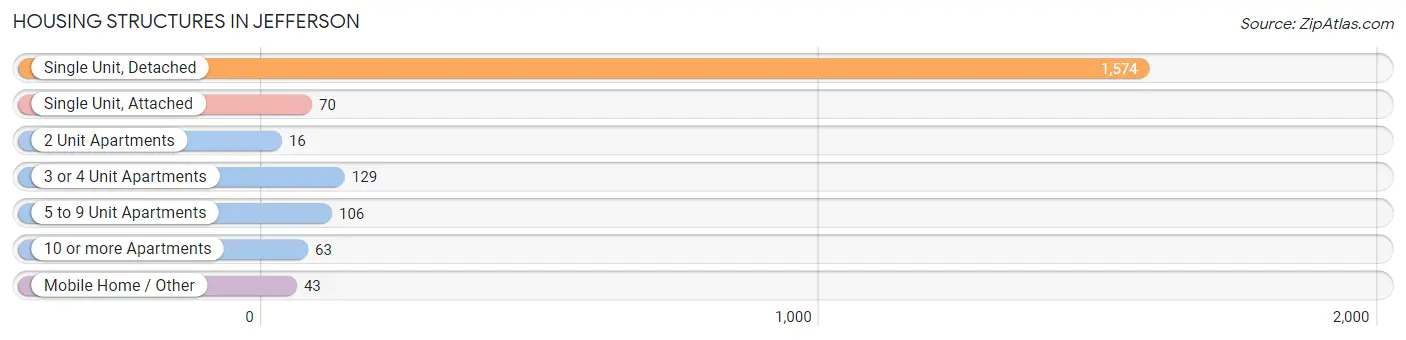
| Structure Type | # Housing Units | % Housing Units |
| Single Unit, Detached | 1,574 | 78.7% |
| Single Unit, Attached | 70 | 3.5% |
| 2 Unit Apartments | 16 | 0.8% |
| 3 or 4 Unit Apartments | 129 | 6.5% |
| 5 to 9 Unit Apartments | 106 | 5.3% |
| 10 or more Apartments | 63 | 3.2% |
| Mobile Home / Other | 43 | 2.1% |
| Total | 2,001 | 100.0% |
Housing Structures by Occupancy in Jefferson
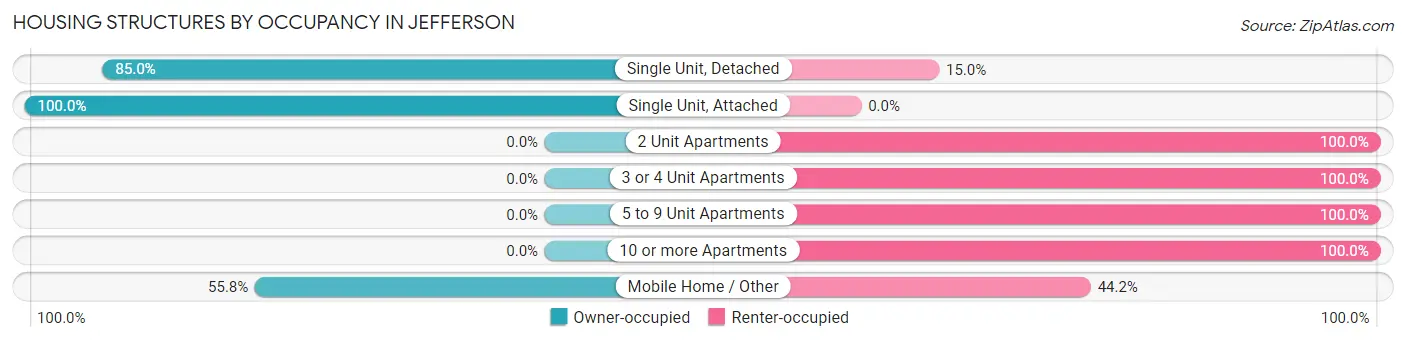
| Structure Type | Owner-occupied | Renter-occupied |
| Single Unit, Detached | 1,338 (85.0%) | 236 (15.0%) |
| Single Unit, Attached | 70 (100.0%) | 0 (0.0%) |
| 2 Unit Apartments | 0 (0.0%) | 16 (100.0%) |
| 3 or 4 Unit Apartments | 0 (0.0%) | 129 (100.0%) |
| 5 to 9 Unit Apartments | 0 (0.0%) | 106 (100.0%) |
| 10 or more Apartments | 0 (0.0%) | 63 (100.0%) |
| Mobile Home / Other | 24 (55.8%) | 19 (44.2%) |
| Total | 1,432 (71.6%) | 569 (28.4%) |
Housing Structures by Number of Rooms in Jefferson
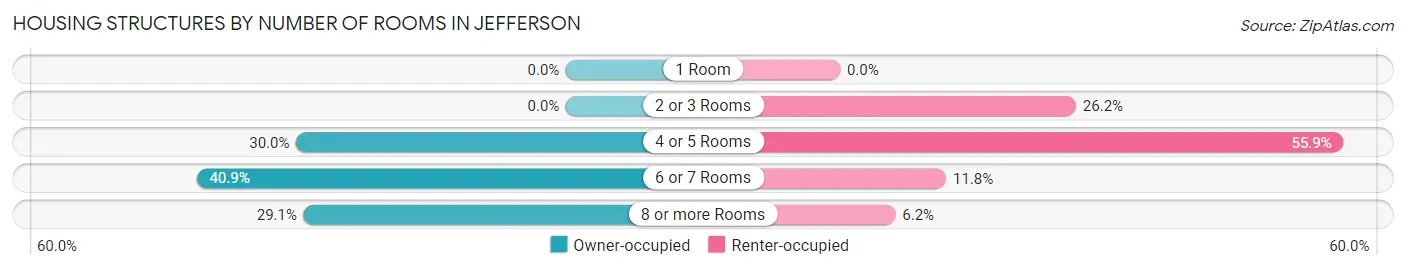
| Number of Rooms | Owner-occupied | Renter-occupied |
| 1 Room | 0 (0.0%) | 0 (0.0%) |
| 2 or 3 Rooms | 0 (0.0%) | 149 (26.2%) |
| 4 or 5 Rooms | 429 (30.0%) | 318 (55.9%) |
| 6 or 7 Rooms | 586 (40.9%) | 67 (11.8%) |
| 8 or more Rooms | 417 (29.1%) | 35 (6.1%) |
| Total | 1,432 (100.0%) | 569 (100.0%) |
Housing Structure by Heating Type in Jefferson
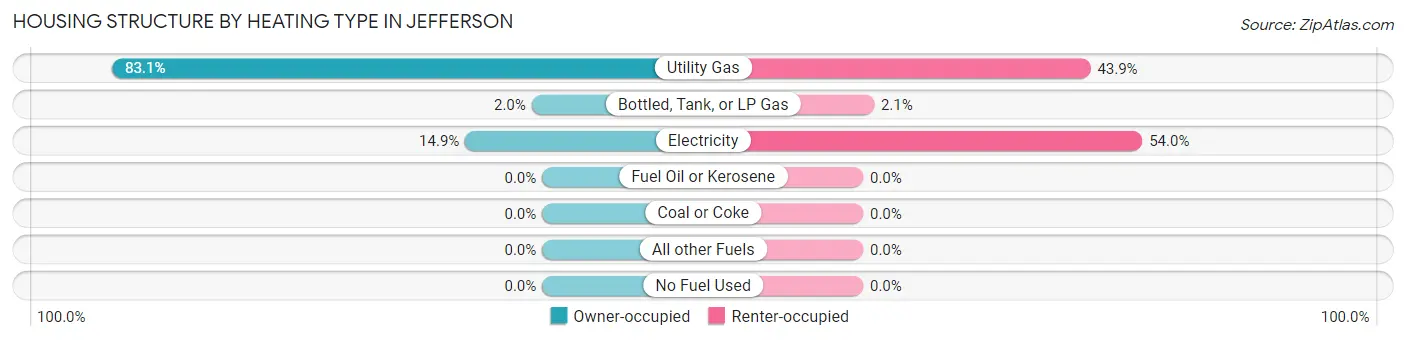
| Heating Type | Owner-occupied | Renter-occupied |
| Utility Gas | 1,190 (83.1%) | 250 (43.9%) |
| Bottled, Tank, or LP Gas | 29 (2.0%) | 12 (2.1%) |
| Electricity | 213 (14.9%) | 307 (53.9%) |
| Fuel Oil or Kerosene | 0 (0.0%) | 0 (0.0%) |
| Coal or Coke | 0 (0.0%) | 0 (0.0%) |
| All other Fuels | 0 (0.0%) | 0 (0.0%) |
| No Fuel Used | 0 (0.0%) | 0 (0.0%) |
| Total | 1,432 (100.0%) | 569 (100.0%) |
Household Vehicle Usage in Jefferson
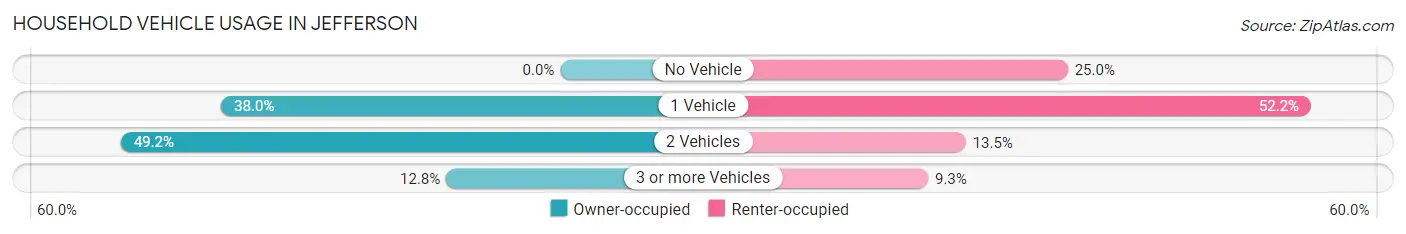
| Vehicles per Household | Owner-occupied | Renter-occupied |
| No Vehicle | 0 (0.0%) | 142 (25.0%) |
| 1 Vehicle | 544 (38.0%) | 297 (52.2%) |
| 2 Vehicles | 705 (49.2%) | 77 (13.5%) |
| 3 or more Vehicles | 183 (12.8%) | 53 (9.3%) |
| Total | 1,432 (100.0%) | 569 (100.0%) |
Real Estate & Mortgages in Jefferson
Real Estate and Mortgage Overview in Jefferson
| Characteristic | Without Mortgage | With Mortgage |
| Housing Units | 655 | 777 |
| Median Property Value | $132,600 | $112,300 |
| Median Household Income | $41,585 | $114 |
| Monthly Housing Costs | $509 | $0 |
| Real Estate Taxes | $1,819 | $18 |
Property Value by Mortgage Status in Jefferson
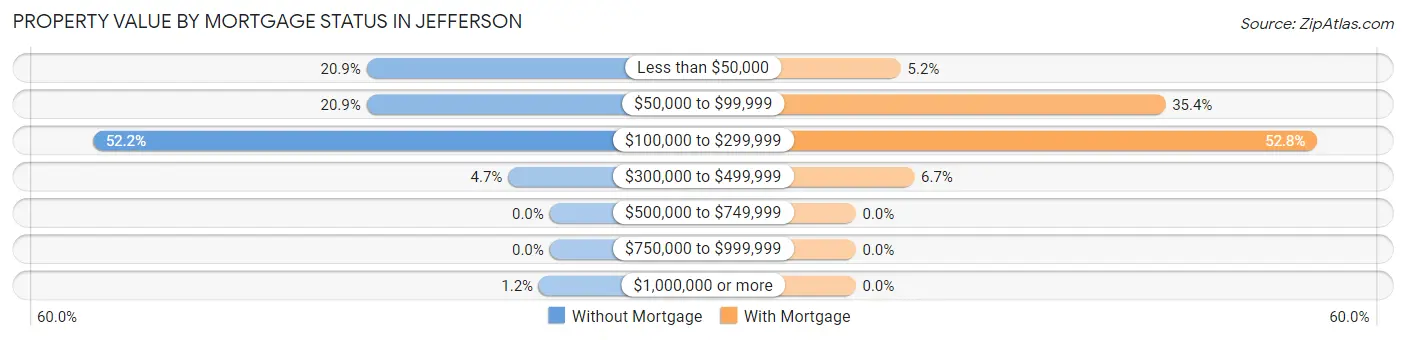
| Property Value | Without Mortgage | With Mortgage |
| Less than $50,000 | 137 (20.9%) | 40 (5.1%) |
| $50,000 to $99,999 | 137 (20.9%) | 275 (35.4%) |
| $100,000 to $299,999 | 342 (52.2%) | 410 (52.8%) |
| $300,000 to $499,999 | 31 (4.7%) | 52 (6.7%) |
| $500,000 to $749,999 | 0 (0.0%) | 0 (0.0%) |
| $750,000 to $999,999 | 0 (0.0%) | 0 (0.0%) |
| $1,000,000 or more | 8 (1.2%) | 0 (0.0%) |
| Total | 655 (100.0%) | 777 (100.0%) |
Household Income by Mortgage Status in Jefferson
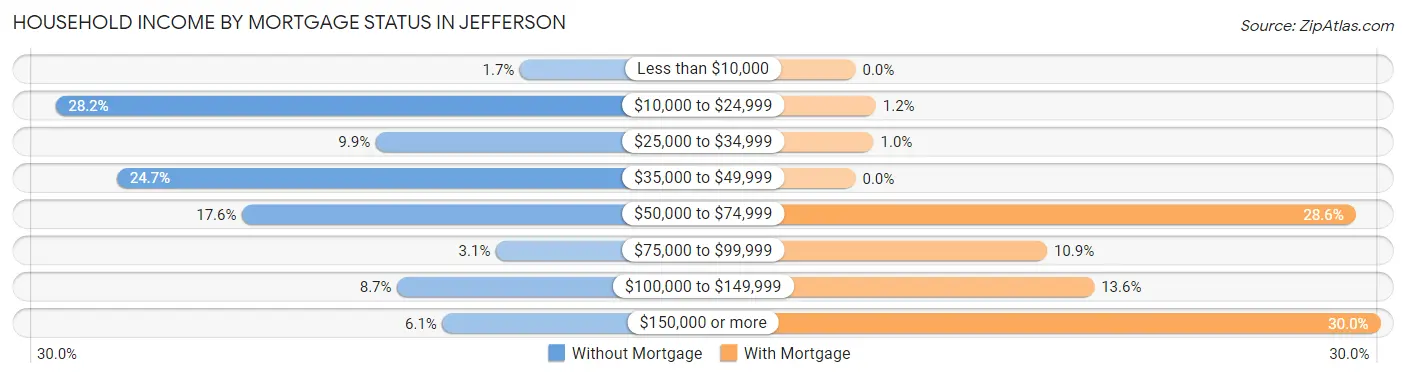
| Household Income | Without Mortgage | With Mortgage |
| Less than $10,000 | 11 (1.7%) | 0 (0.0%) |
| $10,000 to $24,999 | 185 (28.2%) | 9 (1.2%) |
| $25,000 to $34,999 | 65 (9.9%) | 8 (1.0%) |
| $35,000 to $49,999 | 162 (24.7%) | 0 (0.0%) |
| $50,000 to $74,999 | 115 (17.6%) | 222 (28.6%) |
| $75,000 to $99,999 | 20 (3.0%) | 85 (10.9%) |
| $100,000 to $149,999 | 57 (8.7%) | 106 (13.6%) |
| $150,000 or more | 40 (6.1%) | 233 (30.0%) |
| Total | 655 (100.0%) | 777 (100.0%) |
Property Value to Household Income Ratio in Jefferson
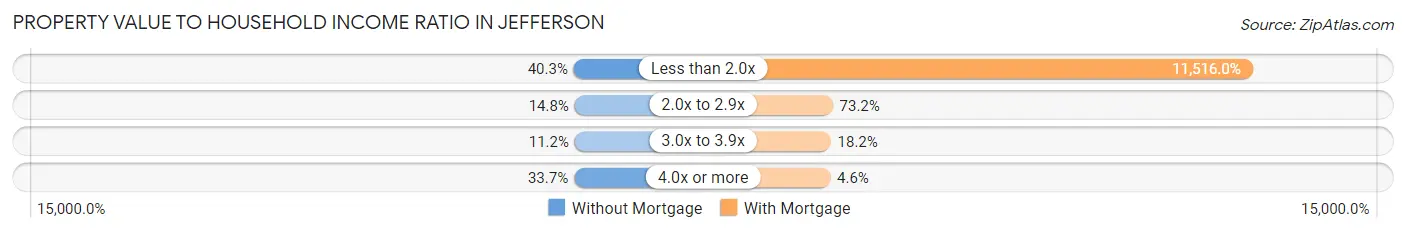
| Value-to-Income Ratio | Without Mortgage | With Mortgage |
| Less than 2.0x | 264 (40.3%) | 89,479 (11,516.0%) |
| 2.0x to 2.9x | 97 (14.8%) | 569 (73.2%) |
| 3.0x to 3.9x | 73 (11.2%) | 141 (18.1%) |
| 4.0x or more | 221 (33.7%) | 36 (4.6%) |
| Total | 655 (100.0%) | 777 (100.0%) |
Real Estate Taxes by Mortgage Status in Jefferson
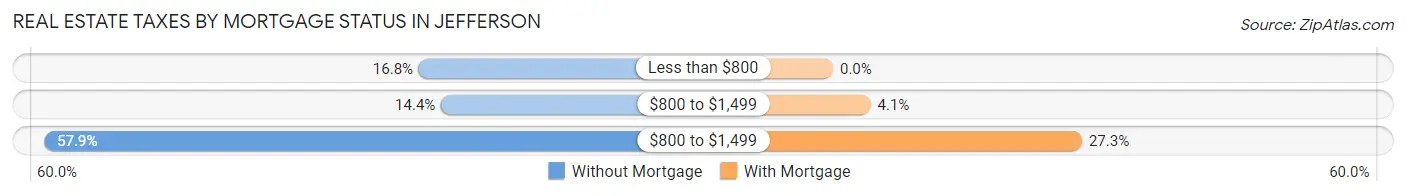
| Property Taxes | Without Mortgage | With Mortgage |
| Less than $800 | 110 (16.8%) | 0 (0.0%) |
| $800 to $1,499 | 94 (14.3%) | 32 (4.1%) |
| $800 to $1,499 | 379 (57.9%) | 212 (27.3%) |
| Total | 655 (100.0%) | 777 (100.0%) |
Health & Disability in Jefferson
Health Insurance Coverage by Age in Jefferson
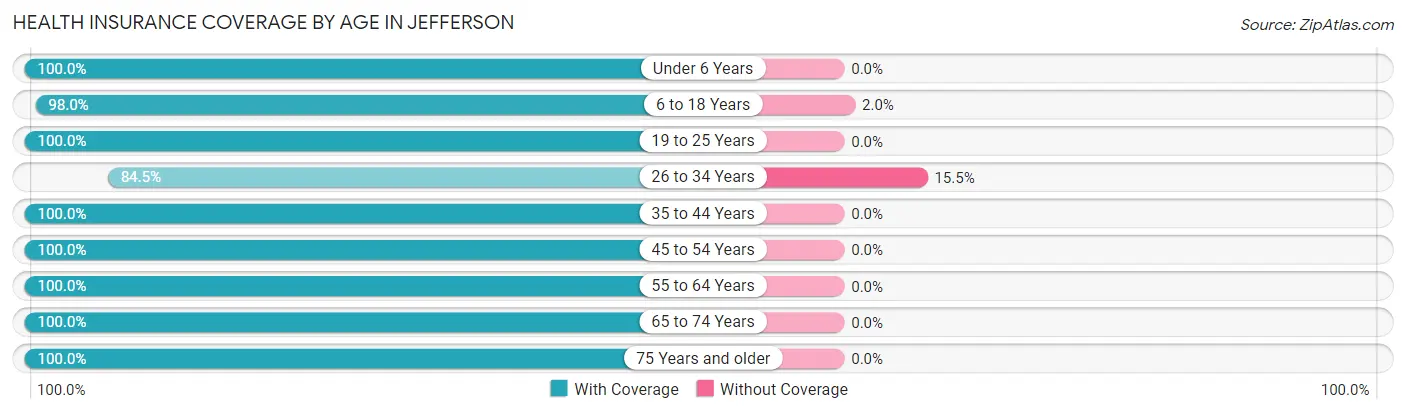
| Age Bracket | With Coverage | Without Coverage |
| Under 6 Years | 285 (100.0%) | 0 (0.0%) |
| 6 to 18 Years | 533 (98.0%) | 11 (2.0%) |
| 19 to 25 Years | 373 (100.0%) | 0 (0.0%) |
| 26 to 34 Years | 305 (84.5%) | 56 (15.5%) |
| 35 to 44 Years | 440 (100.0%) | 0 (0.0%) |
| 45 to 54 Years | 280 (100.0%) | 0 (0.0%) |
| 55 to 64 Years | 663 (100.0%) | 0 (0.0%) |
| 65 to 74 Years | 564 (100.0%) | 0 (0.0%) |
| 75 Years and older | 570 (100.0%) | 0 (0.0%) |
| Total | 4,013 (98.4%) | 67 (1.6%) |
Health Insurance Coverage by Citizenship Status in Jefferson
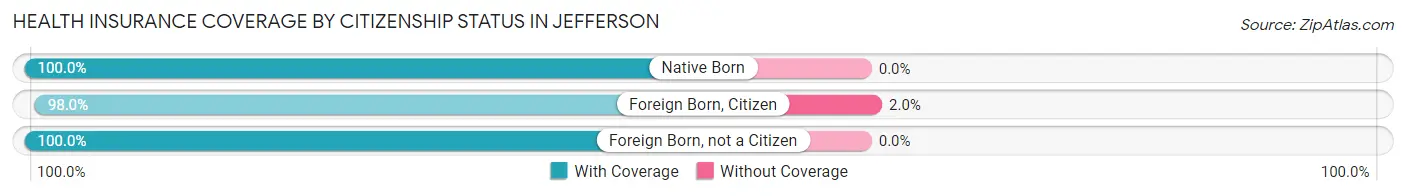
| Citizenship Status | With Coverage | Without Coverage |
| Native Born | 285 (100.0%) | 0 (0.0%) |
| Foreign Born, Citizen | 533 (98.0%) | 11 (2.0%) |
| Foreign Born, not a Citizen | 373 (100.0%) | 0 (0.0%) |
Health Insurance Coverage by Household Income in Jefferson
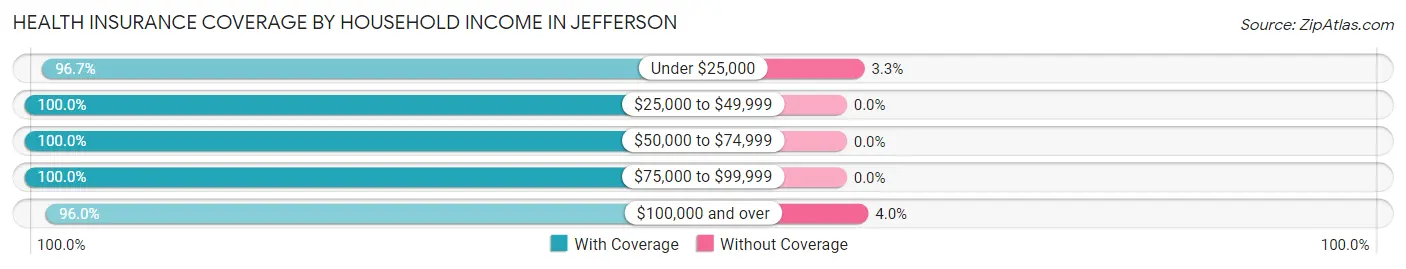
| Household Income | With Coverage | Without Coverage |
| Under $25,000 | 467 (96.7%) | 16 (3.3%) |
| $25,000 to $49,999 | 840 (100.0%) | 0 (0.0%) |
| $50,000 to $74,999 | 774 (100.0%) | 0 (0.0%) |
| $75,000 to $99,999 | 699 (100.0%) | 0 (0.0%) |
| $100,000 and over | 1,211 (96.0%) | 51 (4.0%) |
Public vs Private Health Insurance Coverage by Age in Jefferson
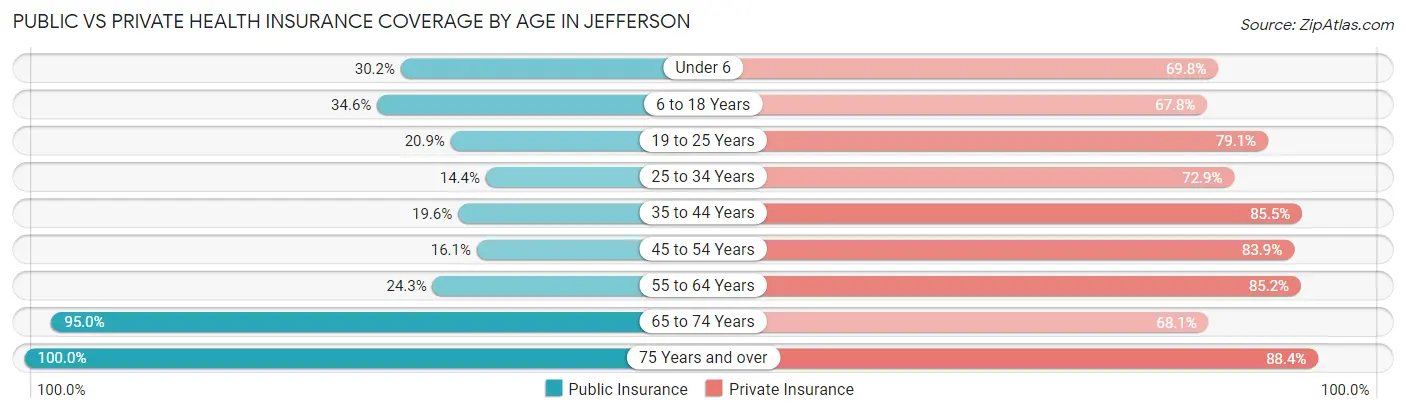
| Age Bracket | Public Insurance | Private Insurance |
| Under 6 | 86 (30.2%) | 199 (69.8%) |
| 6 to 18 Years | 188 (34.6%) | 369 (67.8%) |
| 19 to 25 Years | 78 (20.9%) | 295 (79.1%) |
| 25 to 34 Years | 52 (14.4%) | 263 (72.9%) |
| 35 to 44 Years | 86 (19.6%) | 376 (85.5%) |
| 45 to 54 Years | 45 (16.1%) | 235 (83.9%) |
| 55 to 64 Years | 161 (24.3%) | 565 (85.2%) |
| 65 to 74 Years | 536 (95.0%) | 384 (68.1%) |
| 75 Years and over | 570 (100.0%) | 504 (88.4%) |
| Total | 1,802 (44.2%) | 3,190 (78.2%) |
Disability Status by Sex by Age in Jefferson
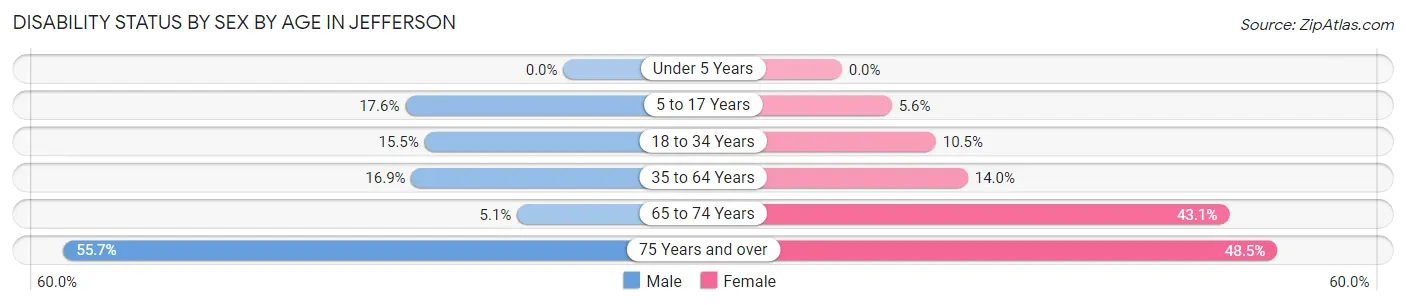
| Age Bracket | Male | Female |
| Under 5 Years | 0 (0.0%) | 0 (0.0%) |
| 5 to 17 Years | 56 (17.6%) | 16 (5.6%) |
| 18 to 34 Years | 59 (15.4%) | 38 (10.5%) |
| 35 to 64 Years | 111 (16.9%) | 102 (14.0%) |
| 65 to 74 Years | 11 (5.1%) | 151 (43.1%) |
| 75 Years and over | 98 (55.7%) | 191 (48.5%) |
Disability Class by Sex by Age in Jefferson
Disability Class: Hearing Difficulty
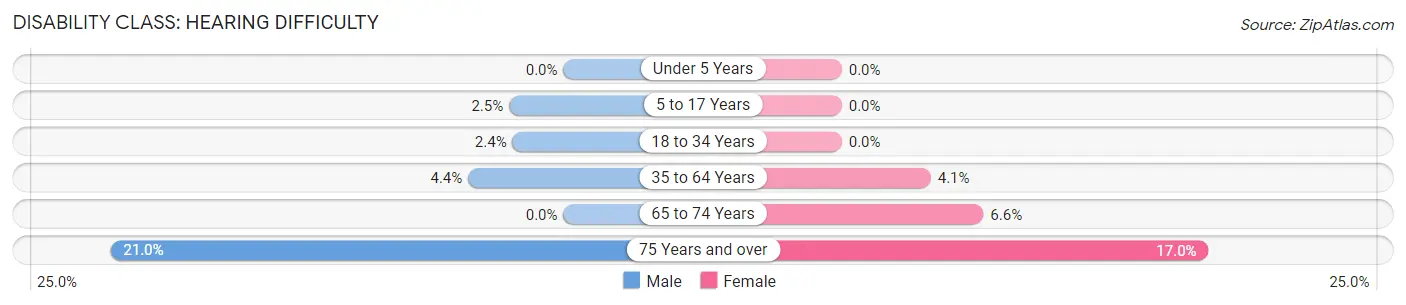
| Age Bracket | Male | Female |
| Under 5 Years | 0 (0.0%) | 0 (0.0%) |
| 5 to 17 Years | 8 (2.5%) | 0 (0.0%) |
| 18 to 34 Years | 9 (2.4%) | 0 (0.0%) |
| 35 to 64 Years | 29 (4.4%) | 30 (4.1%) |
| 65 to 74 Years | 0 (0.0%) | 23 (6.6%) |
| 75 Years and over | 37 (21.0%) | 67 (17.0%) |
Disability Class: Vision Difficulty
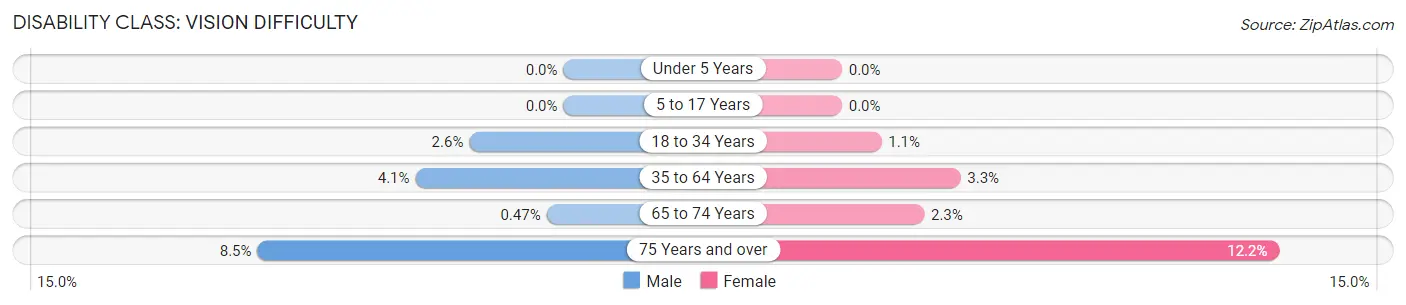
| Age Bracket | Male | Female |
| Under 5 Years | 0 (0.0%) | 0 (0.0%) |
| 5 to 17 Years | 0 (0.0%) | 0 (0.0%) |
| 18 to 34 Years | 10 (2.6%) | 4 (1.1%) |
| 35 to 64 Years | 27 (4.1%) | 24 (3.3%) |
| 65 to 74 Years | 1 (0.5%) | 8 (2.3%) |
| 75 Years and over | 15 (8.5%) | 48 (12.2%) |
Disability Class: Cognitive Difficulty
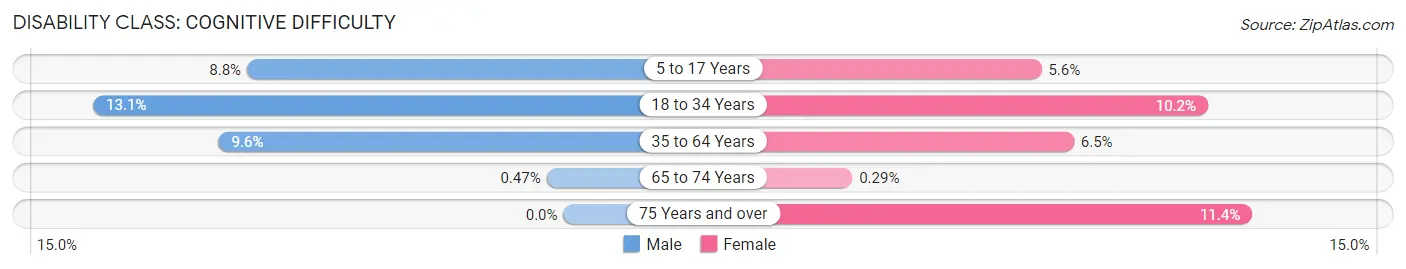
| Age Bracket | Male | Female |
| 5 to 17 Years | 28 (8.8%) | 16 (5.6%) |
| 18 to 34 Years | 50 (13.1%) | 37 (10.2%) |
| 35 to 64 Years | 63 (9.6%) | 47 (6.5%) |
| 65 to 74 Years | 1 (0.5%) | 1 (0.3%) |
| 75 Years and over | 0 (0.0%) | 45 (11.4%) |
Disability Class: Ambulatory Difficulty
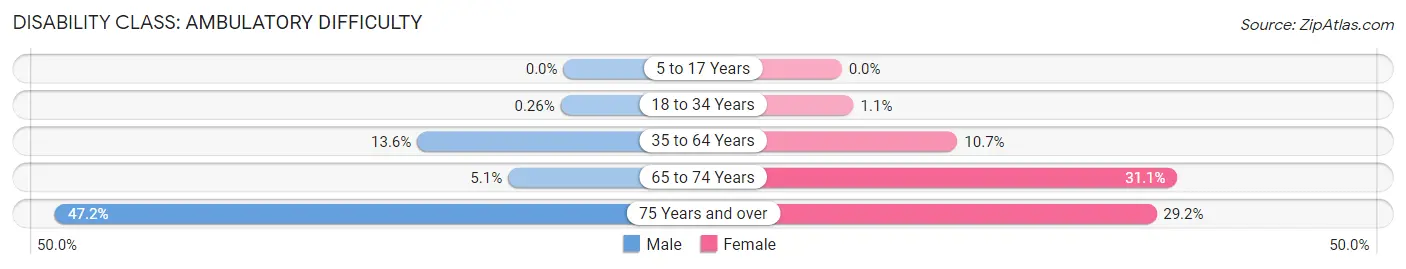
| Age Bracket | Male | Female |
| 5 to 17 Years | 0 (0.0%) | 0 (0.0%) |
| 18 to 34 Years | 1 (0.3%) | 4 (1.1%) |
| 35 to 64 Years | 89 (13.6%) | 78 (10.7%) |
| 65 to 74 Years | 11 (5.1%) | 109 (31.1%) |
| 75 Years and over | 83 (47.2%) | 115 (29.2%) |
Disability Class: Self-Care Difficulty
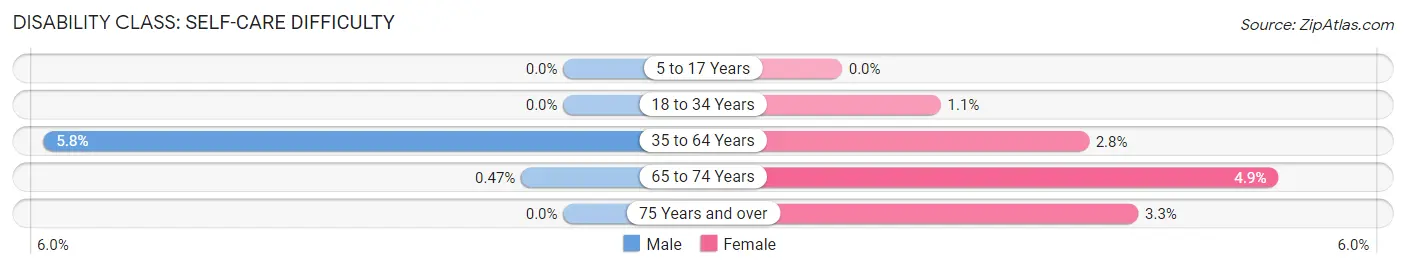
| Age Bracket | Male | Female |
| 5 to 17 Years | 0 (0.0%) | 0 (0.0%) |
| 18 to 34 Years | 0 (0.0%) | 4 (1.1%) |
| 35 to 64 Years | 38 (5.8%) | 20 (2.8%) |
| 65 to 74 Years | 1 (0.5%) | 17 (4.9%) |
| 75 Years and over | 0 (0.0%) | 13 (3.3%) |
Technology Access in Jefferson
Computing Device Access in Jefferson
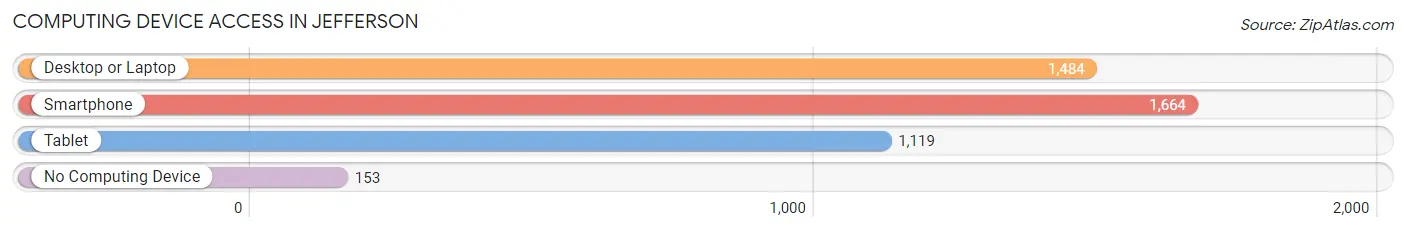
| Device Type | # Households | % Households |
| Desktop or Laptop | 1,484 | 74.2% |
| Smartphone | 1,664 | 83.2% |
| Tablet | 1,119 | 55.9% |
| No Computing Device | 153 | 7.6% |
| Total | 2,001 | 100.0% |
Internet Access in Jefferson
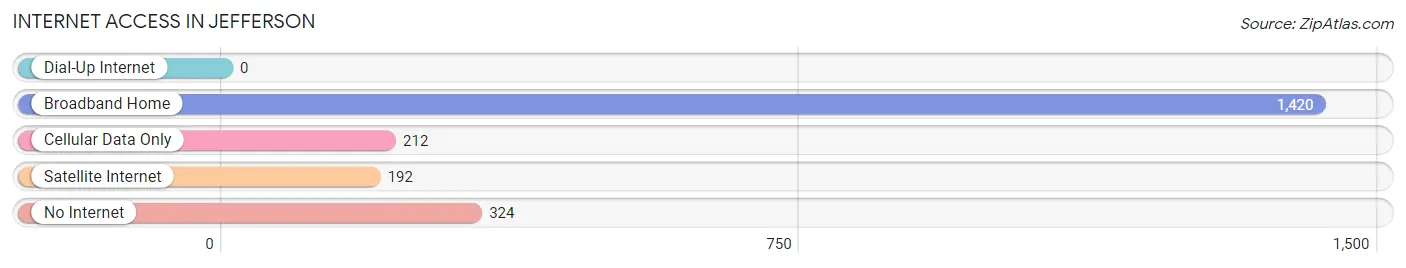
| Internet Type | # Households | % Households |
| Dial-Up Internet | 0 | 0.0% |
| Broadband Home | 1,420 | 71.0% |
| Cellular Data Only | 212 | 10.6% |
| Satellite Internet | 192 | 9.6% |
| No Internet | 324 | 16.2% |
| Total | 2,001 | 100.0% |
Jefferson Summary
Jefferson, Iowa is a small city located in Greene County, Iowa. It is situated in the rolling hills of the Loess Hills region, and is located about 40 miles northwest of Des Moines. The city has a population of 4,077 as of the 2010 census, and is the county seat of Greene County.
History
Jefferson was founded in 1854 by a group of settlers from Ohio. The city was named after Thomas Jefferson, the third president of the United States. The city was incorporated in 1858, and the first mayor was elected in 1859.
In the late 19th century, Jefferson was a thriving agricultural center, with a variety of businesses and industries. The city was also home to a number of educational institutions, including the Jefferson Academy, which was founded in 1867.
Geography
Jefferson is located in the rolling hills of the Loess Hills region of Iowa. The city is situated at the intersection of U.S. Route 30 and Iowa Highway 4. The city is located about 40 miles northwest of Des Moines, and is about a two-hour drive from both Omaha, Nebraska and Des Moines.
The city has a total area of 2.3 square miles, all of which is land. The city is located in the Raccoon River watershed, and is surrounded by farmland.
Economy
Jefferson’s economy is largely based on agriculture and manufacturing. The city is home to a number of manufacturing companies, including a John Deere plant, a Tyson Foods plant, and a Cargill plant. The city is also home to a number of small businesses, including restaurants, retail stores, and service providers.
The city is also home to a number of educational institutions, including the Jefferson Community College, which offers a variety of degree and certificate programs.
Demographics
As of the 2010 census, Jefferson had a population of 4,077. The racial makeup of the city was 97.2% White, 0.7% African American, 0.3% Native American, 0.3% Asian, 0.2% from other races, and 1.5% from two or more races. Hispanic or Latino of any race were 1.2% of the population.
The median income for a household in the city was $41,944, and the median income for a family was $50,917. The per capita income for the city was $20,845. About 8.2% of families and 10.2% of the population were below the poverty line, including 14.2% of those under age 18 and 8.2% of those age 65 or over.
Jefferson is a small city with a rich history and a strong economy. The city is home to a variety of businesses and industries, and is a great place to live and work. The city is also home to a number of educational institutions, making it a great place to pursue higher education.
Common Questions
What is Per Capita Income in Jefferson?
Per Capita income in Jefferson is $33,826.
What is the Median Family Income in Jefferson?
Median Family Income in Jefferson is $87,634.
What is the Median Household income in Jefferson?
Median Household Income in Jefferson is $48,868.
What is Income or Wage Gap in Jefferson?
Income or Wage Gap in Jefferson is 48.8%.
Women in Jefferson earn 51.2 cents for every dollar earned by a man.
What is Inequality or Gini Index in Jefferson?
Inequality or Gini Index in Jefferson is 0.42.
What is the Total Population of Jefferson?
Total Population of Jefferson is 4,190.
What is the Total Male Population of Jefferson?
Total Male Population of Jefferson is 1,922.
What is the Total Female Population of Jefferson?
Total Female Population of Jefferson is 2,268.
What is the Ratio of Males per 100 Females in Jefferson?
There are 84.74 Males per 100 Females in Jefferson.
What is the Ratio of Females per 100 Males in Jefferson?
There are 118.00 Females per 100 Males in Jefferson.
What is the Median Population Age in Jefferson?
Median Population Age in Jefferson is 47.7 Years.
What is the Average Family Size in Jefferson
Average Family Size in Jefferson is 2.9 People.
What is the Average Household Size in Jefferson
Average Household Size in Jefferson is 2.0 People.
How Large is the Labor Force in Jefferson?
There are 2,008 People in the Labor Forcein in Jefferson.
What is the Percentage of People in the Labor Force in Jefferson?
57.4% of People are in the Labor Force in Jefferson.
What is the Unemployment Rate in Jefferson?
Unemployment Rate in Jefferson is 2.1%.